Star-shaped drug delivery systems and advanced characterization by mass spectrometry
|
|
|
- MargaretMargaret Higgins
- 6 years ago
- Views:
Transcription
1 Friedrich-Schiller-Universität Jena Chemisch-Geowissenschaftliche Fakultät Star-shaped drug delivery systems and advanced characterization by mass spectrometry Dissertation Zur Erlangung des akademischen Grades Doctor rerum naturalium (Dr. rer. nat.) Vorgelegt dem Rat der Chemisch-Geowissenschaftlichen Fakultät der Friedrich-Schiller-Universität Jena von Diplom-Chemikerin Katrin Knop geboren am in Dresden
2 Gutachter: 1. Prof. Dr. Ulrich S. Schubert 2. Prof. Dr. Dagmar Fischer Tag der öffentlichen Verteidigung:
3 Non est ad astra mollis e terris via Hercules furens, Seneca
4
5 Table of contents
6
7 Documentation of authorship
8
9
10
11
12
13 1. Introduction
14
15
16
17 2. Drug delivery systems with stealth properties P1)

18 Figure 2.1.
19 Figure 2.2.
20

21 Figure 3.1.
22
23 3. Star-shaped drug delivery systems P2) 2013 P3) Star-shaped drug delivery systems with a PEG shell
24 Scheme 3.1.
25 Table 3.1.
26 Figure Star-shaped drug delivery systems with PEtOx shell
27 Table 3.2.

28 Figure 3.3.
29 4. Advanced characterization of pharmaceutical relevant polymers by matrix-assisted laser desorption/ionization mass spectrometry and collision induced dissociation P4) 2009 P5) 2010 P6) 2010 P7) 2011 P8) 2012
30 Figure 4.1.
31 Scheme 4.1.
32
33 Figure 4.2.
34
35 5. Matrix-free laser desorption/ionization mass spectrometry and imaging P9) P10) 2009 P11) 2012 P12) 2012 P13) Laser desorption/ionization for drug and drug delivery system mass spectrometry imaging
36 Figure 5.1.
37 (THP)H (THP)K Measurement above m/z (55% Laserenergy) Intensity Intensity Measurement below m/z (65% Laserenergy) m/z Figure

38 5.2. Laser desorption/ionization mass spectrometry imaging of secondary plant metabolites Figure 5.3.
39 Figure 5.4.

40 Figure 5.5.

41 Figure 5.6.
42 Figure 5.7.
43 6. Summary Scheme 6.1.
44
45
46
47 7. Zusammenfassung Schema 7.1.
48
49
50
51 8. References
52
53
54
55
56
57 Supplementary information Materials Instrumentation Synthesis of 4-arm poly(-caprolactone) and linear poly(-caprolactone)
58 Figure S1.
59 List of abbreviations
60
61 Curriculum vitae
62
63 Publication list
64 Poster presentations
65 Oral presentations
66
67 Acknowledgement/Danksagung
68
69
70
71 Declaration of authorship/selbstständigkeitserklärung
72
73 Publications P1-P13
74 P1 P2 P4 P5 P6 P7 P8 P10
75 Publication P1: Poly(ethylene glycol) in drug delivery: Pros and cons as well as potential alternatives K. Knop, R. Hoogenboom, D. Fischer, U. S. Schubert Angew. Chem. Int. Ed. 2010, 49,
76
 in Drug Delivery: Pros and Cons as Well as Potential Alternatives Katrin Knop, Richard Hoogenboom, Dagmar Fischer, and Ulrich S.")
77 Reviews U. S. Schubert et al. Drug Delivery DOI: /anie Poly(ethylene glycol) in Drug Delivery: Pros and Cons as Well as Potential Alternatives Katrin Knop, Richard Hoogenboom, Dagmar Fischer, and Ulrich S. Schubert* Keywords: drug delivery nanotechnology poly(ethylene glycol) polymers stealth effect In memory of Victor A. Kabanov Angewandte Chemie Wiley-VCH Verlag GmbH & Co. KGaA, Weinheim Angew. Chem. Int. Ed. 2010, 49,
78 Drug Transport Angewandte Chemie Poly(ethylene glycol) (PEG) is the most used polymer and also the gold standard for stealth polymers in the emerging field of polymerbased drug delivery. The properties that account for the overwhelming use of PEG in biomedical applications are outlined in this Review. The first approved PEGylated products have already been on the market for 20 years. A vast amount of clinical experience has since been gained with this polymer not only benefits, but possible side effects and complications have also been found. The areas that might need consideration and more intensive and careful examination can be divided into the following categories: hypersensitivity, unexpected changes in pharmacokinetic behavior, toxic side products, and an antagonism arising from the easy degradation of the polymer under mechanical stress as a result of its ether structure and its non-biodegradability, as well as the resulting possible accumulation in the body. These possible side effects will be discussed in this Review and alternative polymers will be evaluated. From the Contents 1. Introduction Historical Development Advantages of PEG Drawbacks of PEG Polymers Summary of PEG Potential Alternatives to PEG Conclusions Introduction Polymeric carriers, which physically entrap molecules of interest, and polymer conjugates, to which such molecules are chemically bound, play an important role in modern pharmaceutical technology. The shared task of carriers and conjugates is the targeted delivery of drugs to specific sites of action in the body. In the case of drug conjugates, in particular, the increase of the molar mass leads to reduced kidney excretion and results in a prolonged blood circulation time of the drug. Shielding of drug carriers and conjugates is required to avoid a fast recognition by the immune system followed by rapid clearance from the body. The suppression of nonspecific interactions with the body, that is, decreased interactions with blood components (opsonization) inducing activation of the complement system, leads to a reduced blood clearance of drug carriers and conjugates, which is known as the stealth effect. Drug-delivery vehicles can be coated with a hydrophilic polymer to allow both inhibition of opsonization and enhancement of water solubility. Poly(ethylene glycol) (PEG) is the most commonly applied non-ionic hydrophilic polymer with stealth behavior. Furthermore, PEG reduces the tendency of particles to aggregate by steric stabilization, thereby producing formulations with increased stability during storage and application. In the first part of this Review the requirements for hydrophilic polymers in the field of drug delivery will be introduced. In the second part, the overwhelming number of applications of PEG in this field will be briefly discussed, together with the advantages as well as undesired effects observed during the use of this polymer for biomedical purposes. Taking into account these debated deficiencies, potential alternative polymers for forming the hydrophilic shell of carriers for controlled drug release will be introduced and, finally, their actual status will be discussed. 2. Historical Development The ability of PEG to influence the pharmacokinetic properties of drugs and drug carriers is currently utilized in a wide variety of established and emerging applications in pharmaceutics. The change in the pharmacokinetics of administered drugs by being shielded by or bound to PEG results in prolonged blood circulation times. This consequently increases the probability that the drug reaches its site of action before being recognized as foreign and cleared from the body. Therefore, the majority of conjugated drugs as well as liposomal and micellar formulations on the market or in advanced clinical trials are PEG-containing products. [1] In fact, all polymer-based stealth drug-delivery systems that have been brought to the market up to now contain PEGfunctionalized products (PEGylated), and no other synthetic polymer has yet reached this status (Table 1). [1 3] The concept of PEGylation was first introduced back in the late 1970s; however, it only reached widespread applica- [*] K. Knop, Prof. U. S. Schubert Lehrstuhl für Organische und Makromolekulare Chemie (IOMC) Friedrich-Schiller-University Jena Humboldtstrasse 10, Jena (Germany) Fax: (+ 49) ulrich.schubert@uni-jena.de Homepage: Dr. R. Hoogenboom, Prof. U. S. Schubert Laboratory of Macromolecular Chemistry and Nanoscience Eindhoven University of Technology PO Box 513, 5600 MB Eindhoven (The Netherlands) K. Knop, Dr. R. Hoogenboom, Prof. U. S. Schubert Dutch Polymer Institute (DPI) PO Box 902, 5600 AX Eindhoven (The Netherlands) Prof. D. Fischer Department of Pharmaceutical Technology Friedrich-Schiller-University Jena (Germany) Angew. Chem. Int. Ed. 2010, 49, Wiley-VCH Verlag GmbH & Co. KGaA, Weinheim 6289
![Reviews U. S. Schubert et al. tion in different carrier systems in the 1990s (for an overview of drug-delivery systems, see Figure 1). [4,5] Figure 1. Overview of carrier systems for drug delivery.](/docs-images/79/78844049/images/79-0.jpg "The coupling of a protein to PEG was first reported in 1977 by Abuchowski et al.")

![[6, 7] A large number of PEG conjugates of proteins, polypeptides, DNA, and RNA as well as of small molecules have since been reported to be more efficient and stable than the native drugs, and](/docs-images/79/78844049/images/79-2.jpg "several conjugates have reached the market as commercial products. Table 1 shows that PEG conjugates play a very important part in contemporary drugdelivery applications.")
![[1 3] A deeper insight into this topic can be found in two special issues of Advanced Drug Delivery [8, 9] Reviews.](/docs-images/79/78844049/images/79-3.jpg "The effect of PEG surface coverage on the pharmacokinetics of poly(lactic-co-glycolic acid) microspheres was reported in 1994 by Gref et al.")
![[10] The authors showed that 66% of the noncoated particles were removed by the liver only 5 minutes after injection, while less than 30 % of the 20 kda PEG-coated nanospheres were captured by the](/docs-images/79/78844049/images/79-4.jpg "liver 2 h after injection. This study provided the basis for the use of PEG in microsphere technology, whose history already started in the 1950s.")
79 Reviews U. S. Schubert et al. tion in different carrier systems in the 1990s (for an overview of drug-delivery systems, see Figure 1). [4,5] Figure 1. Overview of carrier systems for drug delivery. The coupling of a protein to PEG was first reported in 1977 by Abuchowski et al. They demonstrated in two studies the non-immunogenicity of PEGylated albumin as well as an extension of the blood circulation time from 12 h to 48 h for PEGylated liver catalase while maintaining the activity of the enzyme. [6, 7] A large number of PEG conjugates of proteins, polypeptides, DNA, and RNA as well as of small molecules have since been reported to be more efficient and stable than the native drugs, and several conjugates have reached the market as commercial products. Table 1 shows that PEG conjugates play a very important part in contemporary drugdelivery applications. [1 3] A deeper insight into this topic can be found in two special issues of Advanced Drug Delivery [8, 9] Reviews. The effect of PEG surface coverage on the pharmacokinetics of poly(lactic-co-glycolic acid) microspheres was reported in 1994 by Gref et al. [10] The authors showed that 66% of the noncoated particles were removed by the liver only 5 minutes after injection, while less than 30 % of the 20 kda PEG-coated nanospheres were captured by the liver 2 h after injection. This study provided the basis for the use of PEG in microsphere technology, whose history already started in the 1950s. [11] Liposomes have been known since the early 1960s as versatile drug-delivery systems. [12, 13] However, a major development was made in 1990 when different research groups reported that the combination of liposome technology and PEGylation by attaching a PEG brush layer to the carriers drastically enhanced blood circulation times of liposomes. [14 16] For example, Klibanov et al. could show that conventional liposomes were completely cleared from blood after 5 h, whereas 49% of the sterically stabilized PEGylated liposomes still circulated in the blood after the same time. [14] This early report provided the basis for the only commercially Katrin Knop was born in 1981 in Dresden (Germany). She received her MS in Chemistry at the University Jena (Germany) in She then obtained a Marie Curie Fellowship at the NANOTOOL EST site in Toulouse (France) where she worked on drug-delivery systems for photodynamic therapy. In 2007 she joined the research group of U. S. Schubert as a PhD student at the Friedrich-Schiller-University Jena, where she is working on the synthesis and characterization of drug-transport systems. Dagmar Fischer was born in Coburg (Germany) in She studied pharmacy at the University of Würzburg and received her PhD at the University of Marburg in After research at the Texas Tech University Health Sciences Center in 2002 and 2003, she obtained her Habilitation at the University of Marburg in From she was Head of Preclinical Research and Development at Antisense Pharma GmbH. Since 2008 she has been Professor for Pharmaceutical Technology at the University Jena. Her research is focused on the field of nanoparticles as drug-delivery systems, with a focus on polymers. Richard Hoogenboom was born in 1978 in Rotterdam (The Netherlands) and studied chemical engineering at the TU Eindhoven (The Netherlands). In 2005, he completed his PhD under the supervision of U. S. Schubert and continued working as project leader for the Dutch Polymer Institute. After postdoctoral training with M. Möller at the RWTH Aachen (Humboldt fellowship) and R. J. M. Nolte at the Radboud University Nijmegen (NWO Veni grant), he was appointed as Associate Professor at Ghent University from July Ulrich S. Schubert was born in Tübingen in He studied chemistry in Frankfurt and Bayreuth (both Germany) and the Virginia Commonwealth University, Richmond (USA). His PhD was carried out at the Universities of Bayreuth and South Florida/ Tampa. After postdoctoral training with J.- M. Lehn at the UniversitØ Strasbourg (France), he moved to the TU München (Germany) and obtained his Habilitation in he was professor at the Center for NanoScience, Universität München (Germany), and Full-Professor at TU Eindhoven. Currently he holds a chair at the Friedrich-Schiller- University Jena Wiley-VCH Verlag GmbH & Co. KGaA, Weinheim Angew. Chem. Int. Ed. 2010, 49,
80 Drug Transport Angewandte Chemie Table 1: Drug-delivery systems stabilized with PEG that have received regulatory approval in the USA and/or the EU. [a] PEG drug description Company Indication Year of approval Adagen ( kda mpeg per adenosine deaminase) Enzon Inc. (USA & Europe) severe combined immunodeficiency 1990 (USA) Oncospar (5 kda mpeg-l-asparaginase) Enzon Inc. (USA)/ Rhône Poulenc Rorer (Europe) acute lymphoblastic leukemia 1994 (USA) Doxil/Caelyx (SSL formulation of doxorubicin) Alza Corp. (USA)/ Schering-Plough Corp. (Europe) Kaposi s sarcoma, ovarian cancer, breast cancer, multiple myeloma 1995 (USA) 1999 (USA) all 1996 (EU) PEG-Intron (2 20 kda mpeg-interferon-a-2a) Pegasys (12 kda mpeg-interferon-a-2b) Neulasta (20 kda mpeg-g-csf) Schering- Plough Corp. (USA & EU) chronic hepatitis C 2000 (EU) 2001 (USA) Hoffmann-La Roche (USA & EU) chronic hepatitis C 2002 (USA & EU) Amgen Inc. (USA & EU) febrile neutropenia 2002 (USA & EU) Somavert (4 6 5 kda mpeg per structurally modified HG receptor antagonist) Pfizer (USA & EU) acromegaly 2002 (EU) 2003 (USA) Macugen (2 20 kda mpeg- anti-vegf- aptamer) Pfizer (EU)/OSI Pharm. Inc. and Pfizer (USA) age-related macular degeneration 2004 (USA) 2006 (EU) Cimzia (2 40 kda mpeg- anti-tnfa) UCB S. A. (USA & EU) Crohn s disease, rheumatoid arthritis 2008 (USA) 2009 (USA) 2009 (EU) [a] mpeg: methoxypoly(ethylene glycol), SSL: sterically stabilized liposome, G-CSF: granulocyte-colony stimulating factor, HG: human growth, VEGF: vascular endothelial growth factor, TNF: tumor necrosis factor. available particulate drug-delivery system Doxil/Caelyx the stealth liposome encapsulated doxorubicin (Table 1). [17 19] Even though the use of micelle-forming amphiphilic polymers as drug-delivery vehicles was already proposed by Ringsdorf et al. in the 1970s, Kabanov et al. were the first to propose the use of PEG as a hydrophilic part of linear block copolymers for micellization in [20] Kwon and Kataoka finally pushed forward the development of PEG-containing block copolymer micelles to drug-delivery carriers. [21] This progress led to the development of dendritic and star-shaped amphiphilic structures, which exhibit enhanced control over the architecture, size, shape, and surface functionality of the micelles at the cost of higher complexity compared to linear block copolymers. [22] The enormous progress achieved during the last two decades in gene therapy stimulated the development of efficient vectors for gene transfection, but required the polymer to have special properties because of the charged nature of DNA. However, the cationic charge of the nonviral vectors which is necessary for electrostatic interaction with the negatively charged DNA is responsible for toxicity and a low half-life of the carriers in the body. The PEGylation of gene carriers resulted in a decrease in the disposition in the lung as well as lower initial toxicities compared to unmodified complexes. [23 25] This positive influence is most likely related to a decreased interaction with blood constituents, a lower tendency of the complexes to aggregate, and, therefore, a lower rate of filtration by pulmonary capillaries. Furthermore, PEGylated carriers are also characterized by a slower uptake by the organs (liver and spleen) of the reticuloendothelial system (RES). [23, 26] A comparison between 25 kda poly(ethylene imine) (PEI) and a PEGylated derivative grafted with 50 molecules of 550 Da PEG demonstrated that 15 minutes after intravenous (i.v.) injection, the PEGylated copolymer reached only 50% of the values of the unmodified polycation in the liver and spleen. This was correlated with a prolonged circulation of the PEGylated PEI in the blood through an increased (+ 63%) area under the curve (AUC) and an elevated terminal elimination phase compared to unmodified PEI. This effect of PEGylation could also be proved with other cationic polymers. By using PEGylated poly(l-lysine) (PLL) the amount of polyplex circulating in the blood shifted to 69 % from 15 % for the non-pegylated polymer. [23] PEGylated drugs, liposomes, and nanocarriers are characterized by reduced renal filtration, decreased uptake by the RES, and diminished enzymatic degradation. For this reason, PEGylated drugs show a prolonged half-life in the body and, thus, an enhanced bioavailability. Hence, the frequency of Angew. Chem. Int. Ed. 2010, 49, Wiley-VCH Verlag GmbH & Co. KGaA, Weinheim
![Reviews U. S. Schubert et al. drug administration and the amount of drug can be diminished, which improves the life quality of the patient and [1, 27] reduces clinical costs.](/docs-images/79/78844049/images/81-0.jpg "The excretion of PEG conjugates and PEGylated carriers by the kidneys is reduced by using drugs with a higher molar mass, and the enhanced permeability and retention (EPR) effect can be exploited.")
81 Reviews U. S. Schubert et al. drug administration and the amount of drug can be diminished, which improves the life quality of the patient and [1, 27] reduces clinical costs. The excretion of PEG conjugates and PEGylated carriers by the kidneys is reduced by using drugs with a higher molar mass, and the enhanced permeability and retention (EPR) effect can be exploited. This EPR effect, discovered by Maeda et al., is mostly observed in cancerous or inflamed tissues. [28] These tissues are marked by hypervascularization and a leaky vasculature. These unorganized and loosely connected endothelial cells allow nanoscopic particles to enter the neoplastic tissue and remain inside as a result of missing or decreased lymphatic drainage (Figure 2). Additionally, an increased Figure 2. Schematic representation of the EPR effect. production of vascular permeability enhancing factors is observed in tumor tissue, further augmenting the extravasation of macromolecules within the tumor. The EPR effect is also called passive targeting, and forms the basic principle that causes the functioning of targeted polymeric drug delivery in different diseases, such as cancer, infection, and inflammation, that show more permeable endothelia. [28 30] Some polymers show a nonlinear behavior in response to an external stimulus, such as a change in temperature or ph value. This response, which could, for example, be a decrease of solubility, can be taken advantage of in drugdelivery applications. The extracellular matrix of cancerous tissue has a decreased ph value of 6.5 to 7.2 compared to blood with a ph value of 7.35 to This drop in the ph value can induce precipitation of the polymer and the associated trapping of the polymer and a potentially bound drug or carrier within the cancer tissue. This approach of stimuli-responsive polymers includes manifold stimuli and various responses by the polymers which are ouside the scope of this Review. The interested reader is referred to reviews discussing this topic. [31 34] These selected examples of applications clearly demonstrate the rising importance of polymers, and in particular of PEG, in biomedical domains such as drug delivery. 3. Advantages of PEG Not every non-ionic hydrophilic polymer can provide stealth behavior. A number of structural parameters influence the biological and stabilizing effects and have to be carefully taken into consideration. [35] The molar mass as well as the polydispersity of the polymer has been shown in many applications to be important for biocompatibility and stealth behavior. The molar mass of PEG used in different pharmaceutical and medical applications ranges from 400 Da to about 50 kda. PEG with a molar mass of 20 kda to 50 kda is mostly used for the conjugation of low-molar-mass drugs such as small molecules, oligonucleotides, and sirna. This results in fast renal clearance being avoided by increasing the size of the conjugates above the renal clearance threshold. PEGs with lower molar masses of 1 kda to 5 kda are often used for the conjugation of larger drugs, such as antibodies or nanoparticulate systems. In this way, opsonization and subsequent elimination by the RES is avoided, enzymatic degradation is reduced, and cationic charges are hidden. PEG of about 3 kda to 4 kda is given orally as a laxative (as GoLYTELY and MoviPrep). From a theoretical point of view, a biodegradable polymer would be more beneficial in applications, since difficulties in achieving complete excretion would be avoided, although other issues, such as the toxicity of degradation products and the limited shelf live, would need to be considered. However, it should be kept in mind that the excretion of the polymer is not directly dependent on the molar mass of the polymer, but rather on the hydrodynamic volume, which is affected by the architecture of the polymer. For example, star-shaped polymers and dendrimers show lower hydrodynamic volumes than [36, 37] linear polymers with similar molar masses. In general, a low polydispersity index (PDI) is a basic prerequisite for the polymer to have pharmaceutical applications. A PDI value below 1.1 provides a polymer with an acceptable homogeneity to ensure reproducibility in terms of body-residence time and immunogenicity of the carrier [1, 38] system. This demand is readily fulfilled by PEG, since very well defined polymers with PDIs around 1.01 are readily accessible by the anionic polymerization of ethylene oxide. Furthermore, PEG shows a high solubility in organic solvents and, therefore, end-group modifications are relatively easy. At the same time, PEG is soluble in water and has a low intrinsic toxicity that renders the polymer ideally suited for biological applications. When attached to hydrophobic drugs or carriers, the hydrophilicity of PEG increases their solubility in aqueous media. It provides drugs with a greater physical and thermal stability as well as preventing or reducing aggregation of the drugs in vivo, as well as during storage, as a result of the steric hindrance and/or masking of charges provided through formation of a conformational cloud. This conformational cloud is generated by the highly flexible polymer chains, which have a large total number of possible conformations. The higher the rate of transition from one conformation to another, the more the polymer exists statistically as a conformational cloud which prevents interactions with blood components as well as protein Wiley-VCH Verlag GmbH & Co. KGaA, Weinheim Angew. Chem. Int. Ed. 2010, 49,
82 Drug Transport Angewandte Chemie interactions such as enzymatic degradation or opsonization followed by uptake by the RES. [39] The formation of an efficient sterically hindering cloud on the surface of particles is not only dependent on the polymer, but is also influenced by other factors such as the molar mass of the PEG, the surface density, and the way the PEG is attached to the [40, 41] surface (for example, brush-like or mushroom-like). The diminished interactions with the body result in PEGylated products showing less immunogenicity and antigenicity; hemolysis and aggregation of erythrocytes can also decrease, as can the risk of embolism. The steric hindrance has the additional advantage that the charge in charged carrier systems is shielded and the resulting zeta-potential and charge-induced interactions within the body are decreased. As a consequence, recognition by the immune system through opsonization is suppressed. These favorable properties of PEG in pharmacokinetics are known under the name of the stealth effect, in reference to stealth planes. Acute and short-term studies as well as pharmacokinetic studies of PEG have been carried out on a wide range of animal species such as rats, mice, guinea pigs, monkeys, and dogs. The gastrointestinal absorption of PEG is decreased as the molar mass increases. Whereas PEGs with a molar mass of 4 kda to 6 kda are not absorbed over 5 h in rat intestine, lowmolar-mass PEGs of about 1 kda show a slight absorptive effect of about 2%. The excretion of PEGs is mainly accomplished by the kidneys. In humans, 85% and 96% were excreted in urine in 12 h after intravenous injection of 1 g of 1 kda and 6 kda PEG, respectively. LD 50 values after oral intake were higher than 50 gkg 1 body weight for 6 kda PEG (50 % solution in water) in mice, rats, rabbits, and guinea pigs. After intraperitoneal (i.p.) administration, the LD 50 value was 5.9 and 6.8 gkg 1 in mice and rats, respectively. In short-term studies in monkeys (Macaca fascilaris), daily doses of 2 4 ml kg 1 of 200 Da PEG were administered over a 13 week period. Intratubular deposition of small numbers of oxalate crystals in the renal cortex were observed, but not related to other clinical or pathological findings. Long-term studies with albino rats with doses of 0.06 gkg 1 1 kda PEG and 0.02 gkg 1 4 kda PEG per day did not cause any significant adverse effects over a two-year period. [42] Toxic effects to the kidney resulting from high PEG doses of Da have been observed in laboratory animals and in burn patients whose injured skin was treated topically with PEG. Evaluating the relative safety of PEG solutions used for bowel cleansing prior to colonoscopy concludes that, in the absence of preexisting renal disease, PEGs are associated with similarly low risks of renal impairment. No significant adverse effects from low-molar-mass PEGs have been observed in inhalation toxicology studies, carcinogen testing, or mutagen assays. Biondi et al. reported that low-molar-mass PEGs of about 200 Da have a genotoxic effect after metabolic activation. However, this was evaluated by induction of chromosome aberrations in CHEL and CHO cells only in the presence of S9 mix. The findings suggested a potential mutagenic risk for PEGs of similar size. [43] In conclusion, PEGs of different molar masses have essentially similar toxicities, with the toxicity being inverse to the molar mass since the absorption from the gastrointestinal tract decreases with increasing molar mass. The level that caused no toxicological effect in rats was ppm in a diet equivalent to 1 gkg 1 body weight. The estimate of the acceptable daily intake for man is 0 10 mgkg 1 body weight. The success of PEG in drug-delivery applications also led to its use in other medical fields. Thus, PEG is used in blood and organ storage, where it reduces the aggregation of red blood cells and improves the blood compatibility of poly(vinyl chloride) bags. [44 47] PEG copolymers that are implanted as cardiovascular devices, such as stents, decrease thrombosis. [48] Furthermore, PEG is not only used in pharmaceutical preparations as an excipient for parenteral, topical, nasal, and ocular applications, it is also used as the active principle in laxatives. The suppression of interactions with biomolecules also led to a variety of antifouling and antiadhesion applications, such as in Merrifield syntheses, [49] ultrafiltration, [50] and the protection of contact lenses from pathogenic bacteria and fungi. [51, 52] PEG chains attached to hydrophobic molecules, such as oleic acid, can act as a surfactant, and are found as surface-active, viscosity-increasing, and skin-conditioning agents in all kinds of cosmetics from toothpaste to cleansing agents, such as shampoos, body and bath soaps, to fragrance, aftershave lotion, face powder, and eye shadow. [53,54] These examples show that PEG, with its special properties, is not only very popular in pharmaceutical applications, it is also a daily consumer product, and is omnipresent in our everyday life. 4. Drawbacks of PEG Polymers The increasing use of PEG and PEGylated products in pharmaceutical research as well as clinical applications not only provides new insight into the underlying mechanism of the beneficial properties of PEG, it also increases the likelihood of encountering potential side reactions. The potentially unfavorable effects that might be caused by PEG can be divided into several groups: Adverse side effects in the body can be provoked by the polymer itself or by side products formed during synthesis that lead to hypersensitivity. In addition, unexpected changes in the pharmacokinetic behavior can occur with PEG-based carriers. Furthermore, an antagonism arises from the non-biodegradability of PEG in combination with its relatively easy degradation upon exposure to oxygen. All these potential drawbacks and their importance will be discussed in the following Immunological Response Intravenous Administration It was already shown in early studies in 1950 that PEG has the propensity to induce blood clotting and clumping of cells, which leads to embolism. This finding indicates nonspecific interactions of PEG with blood. [42] Since then, it has been shown that PEG, which is not supposed to show any opsonization, can nevertheless induce specific as well as Angew. Chem. Int. Ed. 2010, 49, Wiley-VCH Verlag GmbH & Co. KGaA, Weinheim
83 Reviews U. S. Schubert et al. nonspecific recognition by the immune system, thereby leading to a response of the body to intravenously administered PEG formulations such as liposomal and micellar carrier systems or conjugates. It was shown that adverse reactions of PEG often occur through complement (C) activation, which leads to hypersensitivity reactions (HSR) that can provoke an anaphylactic [55, 56] shock. The complement system, which is part of the immune system, is a biochemical cascade that is started by the hydrolysis of C3, a protein present in blood, whose fragmentation can be triggered by a change in the conformation upon adsorption on a surface. This hydrolysis reaction leads to a biochemical cascade that results in the generation of different C3 and C5 fragments that bind to the surface, thereby labeling the identified foreign body. Leucocytes, mast cells, and macrophages that carry receptors for these complement factors will be activated to remove the foreign body and release inflammatory mediators, such as histamine and proinflammatory cytokines. [57] The release of histamine does not imperatively lead to the hypersensitivity reaction; an additional special susceptibility to one of the other steps is [56, 58] also necessary. In earlier studies it was proposed that surface-exposed PEG hydroxy groups provide molecular sites where C3b can covalently bind to the surface and, thus, initiate the pathway of complement activation. [59] However, it should be noted that the vast majority of all currently used PEGylated products are based on methoxy-peg (mpeg), thereby disproving the validity of this hypothesis. Although the exact trigger for this phenomenon has not yet been clarified, an immediate HSR in 5 10% of treated patients was shown for different PEG-containing liposomal carriers. [60] Complement activation with subsequent HSR was demonstrated with 99m Tc-labeled 2 kda mpeg-liposomes for the treatment of Crohns disease. [61] The Doxil/Caelyx (commercial distearoylphosphatidylethanolamine (DSPE) 2 kda mpeg) liposome formulation of doxorubicin (Table 1) used in anticancer therapy also causes HSR in up to 25% of the patients, despite pretreatment with corticosteroids and antihistamines and without prior sensitization. [55, 58] However, the conclusion that the adverse reaction is only caused by PEG can not be drawn conclusively. In fact, depending on the composition and size of the liposomal formulation, PEGliposomes cause complement activation even without doxorubicin encapsulation, but Doxil is a more-efficient complement activator than empty PEGylated liposomes (Table 2). [60] Table 2: Severity of adverse reactions of different carriers containing PEG and anticancer drugs in a porcine model. [a] Adapted from Ref. [60]. Liposomes Lipid dose [mmolkg 1 ] Frequency of adverse reaction Severity of adverse reactions mild severe lethal DPPC, PEG-DSPE, Chol / DPPC, PEG-DSPE, Chol / DPPC, Chol (90 nm) / DPPC, Chol (60 nm) / Doxil/Caelyx / DaunoXome / [a] DPPC:dipalmitoyl phosphatidylcholine, PEG-DSPE: 2 kda mpeg-conjugated distearoyl phosphatidylethanolamine, Chol: cholesterol. Investigations of the hypersensitivity from side reactions caused by sterically PEG-stabilized liposomes revealed rather opposing results, with complex causal relationships found between PEGylation, size, loading, preparation of the formulation, and different other parameters. [60] For example, small PEGylated liposomes with diameters of less than 70 nm showed no complement activation, in contrast to larger ones. [60] In addition, the beneficial pharmacokinetic effects of covering liposomes with PEG are sometimes absent. Parr et al. found only slight differences in the rates of plasma clearance for PEGylated and non-pegylated liposome formulations of doxorubicin; [62] Metselaar et al. observed that liposomes without PEG showed the same or even longer circulation half-lives as PEGylated liposomes (36 h and 22 h, respectively). [60] In summary, these studies indicated complement activation by PEG attached to liposomes, but further investigations are necessary to draw definite conclusions on the mechanism involved and the influence of the various factors that seem to affect the HSR. The adverse reaction of intravenously administered PEG can also be observed in the application of different contrast agents for echocardiography. Anaphylaxis as a result of hypersensitivity to PEG is observed with SonoVue (commercial contrast agent containing PEG), but not with Optison and Definity (commercial contrast agents without PEG). [63] De Groot et al. reported three cases of anaphylactic shock as a reaction to SonoVue. [64] Dijkmans et al. admit that SonoVue might contain a triggering factor responsible for three fatal cases (0.002% of the treated patients with advanced coronary artery disease as a predisposition) and 18 of 19 adverse anaphylactic or vasovagal reactions (fainting) (0.012%); no such adverse reactions were observed with Optison. [65] All together, a conclusive statement can not be given as to whether PEG alone or a combination of several factors causes hypersensitivity; further investigations are required. Even though these results argue for a nonspecific recognition of PEG by the body, the binding of antibodies the specific immune response to PEG was also observed. In 2005, a case study appeared that showed a severe IgE antibody mediated hypersensitivity reaction to intravenously administered 4 kda PEG. [66] However, in 1983 Richter et al. already reported the formation of antibodies to PEG conjugates in rabbits. The response to PEG itself was very low, but antibodies were observed for the conjugate of ovalbumin with 6 mpeg chains with a molar mass of 11 kda anti-peg as well as anti-ovalbumin. Although the formation of antibodies was highly dependent on the degree of substitution of the protein by PEG and the proportion of animals showing antibody response varied (17 % to 50 %), this study showed initially that PEG could act as a haptene. [67] Later, the same authors reported that the subcutaneous injection of a mpeg-modified rag Wiley-VCH Verlag GmbH & Co. KGaA, Weinheim Angew. Chem. Int. Ed. 2010, 49,
84 Drug Transport Angewandte Chemie weed allergen in humans triggered the formation of IgM isotype antibodies to PEG, but the only moderate humoral response was classified as not significant for clinics. [68] However, preexisting IgG and IgM anti-peg antibodies were identified in over 25 % of the healthy donors, and anti- PEG antibodies were induced in 5 of 13 patients in the clinical trial of PEG-asparaginase. [69] The presence of anti-peg antibodies was strongly related to the rapid blood clearance of PEG conjugates; this effect was also observed for PEGuricase in 5 of 8 patients. [70] In summary, PEGylation will continue to be of significant value in medicine to decrease immunogenicity, antigenicity, and toxicity as well as reducing renal clearance. However, it is important to recognize that PEG may possess antigenic and immunogenic properties as haptenes, and the close interaction between complement activation and antibody response should be kept in mind. Further comprehensive studies are required to fully elucidate the effect of anti-peg antibodies on PEG conjugates Oral Administration Hypersensitivity reactions not only occur when PEG is intravenously injected, but also during the preparation of patients for colonoscopy by oral administration of PEG as a laxative. In general, the gastrointestinal adsorption of PEG decreases as the molar mass increases. Whereas 4 kda to 6 kda PEGs are not absorbed over 5 h in rat intestines, lowmolar-mass PEGs of about 1 kda show a slight adsorptive effect of about 2 %. [42] MoviPrep, one of the commercial 3.35 kda PEG solutions for colonoscopy preparation, is reported to cause hypersensitivity and rash uticaria upon administration. The low absorption rate of 0.2% of high-molar-mass PEG by intestinal mucosa was suggested to be sufficient to cause angioedema as a result of systemic HSR to PEG in susceptible patients. [71] Similarly, GoLYTELY, another 3.35 kda PEG preparation for colonoscopy, was reported to cause anaphylactic reaction without prior disposition in three separate case studies. [72 74] Dermal Application Different examples indicate that cutaneous application of PEG can also cause allergic reactions, such as contact dermatitis. This contact allergy was observed for PEG with molar masses between 4 kda and 20 kda used in, for example, dentifrice. [75] Another study found that 8 kda and 20 kda PEG present in multivitamin tablets caused hypersensitivity that culminated in unconsciousness in a 36 year old man without predisposition. [76] Contact dermatitis as a result of hypersensitivity was also reported by Fisher in four patients when drugs containing PEG ranging from 200 to 400 Da were used as an excipient. [77] Quartier et al. reported contact dermatitis to the moisturizing 1 kda PEG-dodecylglycol block copolymers in 19 of 21 patients. [78] However, both Le Coz et al. and Quartier et al. note a connection between contact dermatitis and 1,4- dioxane, an industrial side product of the PEG synthesis. [54,78] 4.2. Changes in Pharmacokinetic Behavior Another potential immune reaction to the presence of PEG is the accelerated blood clearance (ABC) phenomenon. Dams et al. first reported that the 2 kda mpeg liposome concentration in rats was drastically decreased after 4 h compared to a previously injected liposome dose [from ( )% to ( )% after the second injection]. [79] Kiwada and co-workers later observed that the ABC phenomenon also occurred when the second injection was administered within five days. This finding indicated that a preceding injection of PEGylated liposomes can alter the circulation time of repeatedly injected PEG liposomes. [80] In addition, it was also reported that previously administered PEG-containing micelles with a size of at least 30 nm can also induce the ABC reaction, [81] thus indicating that the size of the PEGylated particles is also an important parameter for the reaction. On the other hand, it has been demonstrated that very high doses (5 mmol phospholipid per kg rat) of unprotected liposomes also cause this enhanced blood clearance. [82] This finding shows that the induction and magnitude of the phenomenon is not only determined by PEG, but also by the size and surface of the carrier. [83] Additionally, the amount of PEGylated lipid can affect the ABC phenomenon. Liposomes containing 0, 5, 10, or 15 mol% PEGylated lipid were tested in rabbits. The ABC phenomenon was found with 5 mol% PEG-covered liposomes to reach a maximum, and with the effect decreasing at higher coverage rates. This observation is in good agreement with the production of anti-peg as well as antiovalbumin antibodies in the presence of an ovalbumin conjugate with 6 molecules of 11 kda PEG. No antibodies were produced by conjugation with 20 molecules of 11 kda PEG molecules per ovalbumin molecule. [67] This ABC phenomenon not only affects the bioavailability of the drug, but passive targeting is also decreased: the second dose was shown to preferentially end up in Kupffer cells of the liver. [79, 80, 84] This observation proves an involvement of the immune system. This can cause severe liver damage in the case of highly toxic anticancer therapeutics. The mechanism of ABC is still not fully understood, but it has been suggested that the formation of anti-peg IgM antibodies by the spleen occurs upon the first injection; the IgM binds to the PEG of the second dose and activates the complement system, thereby leading to opsonization with C3 fragments of PEG and an enhanced uptake by Kupffer cells. [83,85] Since non-pegylated liposomes can also induce this phenomenon, it seems clear that the mechanism of the occurrence of ABC is much more complex. In any case, these unexpected changes in the pharmacokinetic behavior are undesirable and complicate the therapeutic use of PEGylated liposomes and micelles. An additional pharmacokinetic irregularity that is shown by PEGylated liposomes is the loss of long-circulating behavior at very low doses (approximately 0.5 mmolkg 1 ). [82] This observation was made with doses much lower than those used during normal therapeutic application (4 to 400 mmol of lipid kg 1 ); nevertheless, it is important in nuclear medicine, where only trace amounts are Angew. Chem. Int. Ed. 2010, 49, Wiley-VCH Verlag GmbH & Co. KGaA, Weinheim
85 Reviews U. S. Schubert et al. administered. [86] The mechanism accounting for this unexpected behavior is unknown and the question as to whether the loss of long-circulation time is connected to the ABC phenomenon remains unanswered Non-Biodegradability of PEG A disadvantage of PEG is its non-biodegradability. Therefore, the use of low-molar-mass PEGs would be preferable. However, oligomers with a molar mass below 400 Da were found to be toxic in humans as a result of sequential oxidation into diacid and hydroxy acid metabolites by alcohol and aldehyde dehydrogenase. The oxidative degradation significantly decreases with increasing molar mass and, therefore, a molar mass well above 400 Da should [87, 88] be used. On the other hand, the molar mass should not exceed the renal clearance threshold to allow complete excretion of the polymer. A molar mass limit of kda is reported for nondegradable polymers (corresponding to the albumin excretion limit and a hydrodynamic radius of approximately 3.5 nm). [1, 27, 38,89 91] Pasut and Veronese assumed that a molar mass below kda is required to prevent accumulation in the liver, [1] but the renal clearance threshold of PEG is not easy to determine. [38] It seems that PEG with a molar mass below 20 kda is easily secreted into urine, while higher molar mass PEG is eliminated rather slowly, and clearance through the liver becomes predominant. [1] To overcome these uncertainties multiarm and branched biodegradable PEGs were investigated that form low-molar-mass PEGs which can be excreted more easily after cleavage in the body. Studies concerning toxicity and excretion of PEG mostly date back to the 1950s to 1970s and, therefore, need to be updated with contemporary knowledge and methods. [92 94] In particular, the fate of PEG and PEGylated delivery systems at the cellular level is not known and needs further investigation. It is common practice to assume a fate similar to PEG for PEGylated delivery systems, which are, in general, chemically modified PEGs. Thus, the majority of studies seem to ignore the biological fate of the polymers after disintegration of the [91, 95] liposomes or micelles from which they originate. In fact, there are no systematic long-term studies that show 1) whether PEG is excreted completely or partly remains in the body, 2) where it is accumulated, and 3) its effects at the sites of accumulation. [96] 4.4. Degradation under Stress The stability of a polymer used for drug delivery is an important factor in achieving and maintaining the stability and therapeutic properties of drugs during storage as well as during treatment. [97] Instabilities observed in polymers can result from chemical changes induced by oxygen, water, and energy such as heat, radiation, or mechanical forces. [97] The effect of these exogenous factors on PEG stability will be discussed in the following. Mechanical stress on polymers and subsequent degradation can arise during several processes, such as the simple flow of solutions, stirring, or ultrasound treatment. In addition to shear stress during production processes or by injection with a syringe, shear stress can also occur in biological systems. Significant flow of aqueous fluids occurs in the human body, with shear stresses of up to 5 Pa, but the shear behavior of polymers for biomedical applications under these conditions has hardly been considered. [98] Therefore, an examination of the processes that lead to degradation, occurrences that happen during degradation, and the products formed during scission are an important part of the evaluation of polymers for biomedical applications. Up to now, stress studies have only been carried out on industrial PEG samples with molar masses ranging from 50 kda to 4000 kda that are not used in drug-delivery applications. Similarly, shear stresses up to 9 kpa were applied, which significantly exceed the forces occurring in vivo. These forces in vivo are generally around 1 Pa, with maximal shear stresses of around 5 Pa in capillaries and arterioles. [99 104] Even though the investigations on shear stress induced degradation of PEG were not performed with biologically relevant polymers and conditions, the partial degradation of PEG-based therapeutics during prolonged circulation can not be excluded. General findings such as the involvement of oxygen in the rupture of the ether bond and the faster degradation of PEG compared to polymers with a carbon backbone, such as poly(acrylic acid) (PAA) and poly(vinylpyrrolidone) (PVP), should be kept in mind. [103] PEG is also observed to undergo remarkable degradation under heating in the solid state and solution. [105] Scheirs et al. noted a decrease in the molar mass of solid-state PEG from 100 kda to 10 kda after aging for 30 days at 60 8C under air. The authors found by measuring IR spectra that the degradation resulted in the formation of appreciable quantities of aldehyde, carboxylic acid, and alcohol functional groups. [106] The heating of PEG probes of various molar masses ( kda) under a non-oxidative atmosphere at 50 8C also showed slight chain scissions. This finding led the authors to the conclusion that these degradations are induced at socalled weak scissions which have their origin at previously formed peroxides. [107, 108] This observation is consistent with others that show that neither the addition of antioxidants nor free radical inhibitors can totally prevent thermal degradation of PEG under inert conditions. [108] Although the discussed conditions might have only limited relevance for biological media, they should be kept in mind during the preparation of the carrier systems. Even though PEG does not absorb light above 300 nm, it is very sensitive to photooxidation, because of the oxidizability of the a-carbon atom by chromophoric impurities. [107] UV degradation of PEG in the range of 55 to 390 kda through the formation of ester and formate end groups occurs much faster than in other hydrophilic polymers such as PAA and PVP in the same molar mass range. [103] Although none of the studies concerning the mechanical stability of PEG involved pharmaceutical grade polymers and the conditions were harsher than those occurring in vivo, it Wiley-VCH Verlag GmbH & Co. KGaA, Weinheim Angew. Chem. Int. Ed. 2010, 49,
86 Drug Transport Angewandte Chemie can be concluded that PEG is more sensitive to degradation than vinylic polymers because of its ether structure and the possible formation of hydroperoxides. These factors have to be taken into consideration, in particular during storage of the polymer as well as the drug formulation Toxicity of Side-Products The most prominent side product formed during the synthesis of PEG is the cyclic dimer of ethylene oxide, 1,4- dioxane. Currently, 1,4-dioxane is stripped off from the product under reduced pressure. Dioxane is classified by the International Agency for Research on Cancer (IARC) in group 2b (that is, as being possibly carcinogenic in humans with sufficient evidence from animal experiments). Therefore, the European Pharmacopoeia (Ph. Eur.) limits the dioxane content to 10 ppm for pharmaceutical applications. Nonetheless, an evaluation of dioxane by the US Department for Health and Human Services revealed that rats exposed over two years to 111 ppm of 1,4-dioxane in air did not show any evidence of dioxane-caused cancer or any other health effects. Furthermore, PEG can also contain residual ethylene oxide from polymerization that is classified by the IARC in group 1 (carcinogenic in humans), as well as formaldehyde, which is in the same group. As a consequence, the Ph. Eur. limits the content of ethylene oxide to 1 ppm and the amount of formaldehyde to 30 ppm in PEG for pharmaceutical applications. The toxicity of these potential side products clearly demonstrates the necessity of using pharmaceutical grade PEG for biomedical applications. numerous positive properties. Therefore, we want to increase the awareness that PEG might also exhibit some limitations to complement the multitude of reviews that focus on all the beneficial properties of PEG. The limitations of PEG include the non-biodegradability and the resulting, and in most studies ignored, fate of PEG after in vivo administration. Many biological and toxicological data evaluating those points date back to the 1950s and 1970s and need to be updated and evaluated with contemporary knowledge, especially in terms of the fate at the molecular and cellular level, such as tissue vacuolization and fusion of membranes. At the same time, the polyether structure provides easy targets for peroxide degradation, and although investigations have not been performed under biologically relevant conditions, PEG can be relatively easy degraded compared to polymers with a carbon backbone. From a medicinal viewpoint, the unpredictable complement activation, which can lead to hypersensitivity reactions and unclear pharmacokinetics after a second dose (the so called ABC phenomenon) complicate the use of PEG therapeutics. Although PEG alone seems to be immunologically harmless, the immunogenicity of PEG is highly dependent on the degree of PEGylation and to which molecule the PEG is coupled. Nevertheless, the positive properties of PEG cannot be dismissed and strongly outweigh the sometimes observed negative effects discussed. As a consequence, PEG remains the most used polymer and the gold standard in biomedical applications; potential alternatives with even better properties are difficult to find at the moment. However, the search for alternative polymers is also driven by the strained patent and marketing situation of PEG, since numerous patents protect its applications. 5. Summary of PEG PEG is a very popular polymer with an overwhelming number of positive properties, as is easily confirmed by searching the literature. These advantageous qualities have led to a very broad usage of PEG in everyday products, industrial applications, as well as in many biomedical drugdelivery systems. Its success in the latter field is well reflected by numerous pharmaceutical products that have reached approval by the Food and Drug Administration (FDA) and European Medicines Agency (EMEA) during the last 20 years (Table 1). In publications on the use of PEG in drug delivery, an overwhelming enthusiasm is often evident and possible disadvantages are hardly mentioned, with potential difficulties that might be faced with this polymer concealed. Although, the possible disadvantages of PEG are highlighted here, this Review does not wish to create the impression that PEG should be avoided. On the contrary, we believe that PEG is of utmost importance for the development of new drug-release systems that will improve the quality of life. In addition, most of the discussed side effects and instabilities of PEG were only observed in a limited percentage of patients and are not as well investigated and documented as the 6. Potential Alternatives to PEG The discussed disadvantages of PEG intensified the search for alternative polymers for use in therapeutics. This section will present the most promising hydrophilic polymers that have been investigated as synthetic alternatives to PEG for different biomedical applications and their properties and potentials are compared to PEG. A variety of natural polymers such as heparin, [109] dextran, [110, 111] and chitosan [112] have also been used in a wide range of drug-delivery systems. However, they fall beyond the scope of this Review, which focuses on synthetic polymers, and will not be discussed here Biodegradable Polymers Poly(amino acid)s Different synthetic poly(amino acid)s are currently being investigated as alternatives to PEG and are in different stages of development. Poly(glutamic acid) (PGA), which was first investigated by Li and Wallace, has already entered a phase III clinical trial in the form of a 40 kda PGA-paclitaxel conjugate (37 wt%; Table 3). [113] Poly(hydroxyethyl-l-aspar- Angew. Chem. Int. Ed. 2010, 49, Wiley-VCH Verlag GmbH & Co. KGaA, Weinheim
87 Reviews U. S. Schubert et al. [a], [3, 196, 218,219] Table 3: Drug-delivery systems containing alternative polymers to PEG and their current status in clinical trials. Polymeric drug description Manufacturer Indication Status 36 kda PG-paclitaxel (21 wt %) (CT 2103, Opaxio) Cell Therapeutics Inc. NSCLC, ovarian, colorectal, breast and esophageal cancers phase III 33 kda PG-camptothecin (37 wt%) (CT 2106) Cell Therapeutics Inc. colorectal, lung and ovarian cancers phase I/II 28 kda PHPMA-doxorubicin (8.5 wt%) (PK1, FCE 28068) Pfizer, Cancer Research Campaign, UK NSCLC and breast cancers phase III 25 kda PHPMA-platinate (8.5 wt %) (AP 5280) Access Pharmaceuticals ovarian cancer phase II 25 kda PHPMA-doxorubicin (7.5 wt %)-galactosamine (PK2, FCE 28069) Pfizer, Cancer Research Campaign, UK hepatocellular carcinoma phase I/II 25 kda PHPMA-DACH-platinate (8.5 wt %) (AP 5346) Access Pharmaceuticals ovarian, melanoma and colorectal cancers phase I/II 18 kda PHPMA-camptothecin (10 wt%) (PNU ) Pfizer, Cancer Research Campaign, UK refractory solid tumors phase I, discontinued 17 kda PHPMA-PGA (37 wt %)-paclitaxel (5 wt%) (PNU ) Pfizer, Cancer Research Campaign, UK [a] NSCLC: non-small cell lung cancer; DACH: diaminocyclohexyl chelating ligand. refractory solid tumors phase I, discontinued agine) (PHEA) and poly(hydroxyethyl-l-glutamine) (PHEG) were tested for drug delivery in different studies, in particular by Romberg et al. (Scheme 1). [96] Scheme 1. Structures of poly(hydroxyethyl-l-asparagine) (PHEA), poly- (hydroxyethyl-l-glutamine) (PHEG), and poly(glutamic acid) (PGA). PGA, PHEA, and PHEG are degraded in vivo to their corresponding amino acids, which can be metabolized by physiological pathways. Their degradation kinetics have been studied in vitro by using different enzymes, which lead either to complete decomposition into single amino acids or degradation to oligomers with 4 to 9 repeating units. [96,114] Biodegradability is the main strength of these polymers together with a prolonged blood circulation time of particles with poly(amino acid)-modified surfaces. This extension was similar to liposomes modified with 5 kda PEG, 4 kda PHEG, and 3 kda PHEA. Similar elimination rates were measured for the poly(amino acid) liposomes as for the PEG liposomes. Additionally, a decrease in the ABC phenomenon has been shown when low doses were injected into rats [96, ] (Figure 3). However, PHEG and PHEA showed increased SC5b-9 (SC5b-9 = complement factor formed by hydrolysis of C3) levels in ELISA tests, thus indicating the explicit activation of the complement system. [96] In addition, the antigenicity of polymers with more than three amino acids in the chain complicates their use in vivo. [118] Nevertheless, both polymers have been used in different drug carriers, such as 100 kda PHEG-mitomycine conjugate (5.4 wt % mitomycine), [119] histidine-conjugated PHEA as a micelle-forming amphiphilic agent for doxorubicin, [120] or in combination with hyaluronic acid as a hydrogel for the administration of thrombin. [121] In contrast to PHEA and PHEG, poly(glutamic acid) is already approved by authorities and widely used as a thickener in food and cosmetics, as a wetting agent in cosmetics, and as a fertilizer which slowly releases nitrogen. [122] Despite the known antigenicity of poly(amino acid)s, the paclitaxel-pga conjugate was the first non-peg polymer-drug conjugate to reach a phase III clinical trial (under the name Opaxio, formerly Xyotax (CT-2103); Figure 4). [113] It showed less side effects and improved drug efficiency than nonconjugated paclitaxel in some tumors. Although clinical trials have been carried out since 2005, all of them have failed to meet the primary end-point of extended survival compared to gemcitabine or vinorelbine for non-small cell lung cancer (NSCLC in patients with a poor performance status (PS2) is incurable with the therapy available). However, beneficial Wiley-VCH Verlag GmbH & Co. KGaA, Weinheim Angew. Chem. Int. Ed. 2010, 49,

88 Drug Transport Angewandte Chemie Figure 4. Antitumor activity of PGA-taxol in rats bearing rat breast tumor 13762F (PG = poly(glycerol), TXL = taxol). Each drug was injected intravenously in a single dose at the indicated equivalent paclitaxel concentration. Data are presented as the mean and standard deviations of the tumor volume. [113] Reproduced from Ref. [113] with permission from Elsevier B.V. Figure 3. Effect of the polymer-lipid concentration on the pharmacokinetic behavior of PHEA and PEG liposomes after the first and second injection. a) Circulation kinetics of PHEA- (DPPC/cholesterol/PHEA- DODASuc) and PEG liposomes (DPPC/cholesterol/PEG-DSPE) (% of injected dose versus time). The closed symbols represent the results after the first injection; the open symbols those after the second injection of liposomes. b) Ratio of AUC 0 48 h of the second injection to the AUC 0 48h of the first injection (AUC 2nd/1st ) at the different lipid doses [AUC 0 48 h values were calculated from (a)]. Filled bars represent the AUC 2nd/1st of PEG liposomes, dotted bars represent the AUC 2nd/1st of PHEA liposomes. All results are expressed as the mean standard deviation (n = 3 4). *p < 0.05; n.s. = not significant, DODASuc = succinyldioctadecylamine. [115] Reproduced from Ref. [115] with permission from Elsevier B.V. tolerability, convenience, and safety, such as lower requirement for red blood cell transfusions, fewer hematologic and gastrointestinal adverse events as well as lower incidence of alopecia, fatigue, and weight loss were found. [123] Superior survival was observed among women less than 55 years old, and presumably premenopausal, upon treatment with Opaxio. This effect is attributed to the increased release of paclitaxel. [124, 125] Hypersensitivity reactions were only rarely observed, and those that did occur were only mild to moderate. [113] Therefore, Cell Therapeutics, Inc., the pharmaceutical company holding the rights to Xyotax, received fasttrack designation from the FDA for paclitaxel-pga in the indication of advanced non-small cell lung cancer in patients with a poor performance status. Currently, Cell Therapeutics has withdrawn its European marketing application of Opaxio for NSCLC after an EU panel raised concerns over the trial design. [126] In summary, poly(amino acid)s combine a number of advantageous properties for drug-delivery applications such as prolonged blood circulation, decreased ABC clearance, and particularly importantly biodegradability. Their major drawback is complement activation; however, this effect may be tolerable in clinical trials, since it apparently leads to only moderate hypersensitivity reactions Non-Biodegradable Polymers As the promising biodegradable polymers show an activation of the immune system, non-biodegradable polymers have also been taken into further consideration as alternatives to PEG for drug-delivery applications (Scheme 2) Polymers with Heteroatoms in the Main Chain Poly(glycerol) The close structural similarity of poly(glycerol) (PG) to PEG renders the polymer predetermined for biological applications. Indeed, linear as well as hyperbranched PG (HPG) with molar masses ranging from 150 Da to 540 kda have already been used as hydrophilic shells for conjugates and liposomes, reverse micelles, and hydrogels. [ ] The stealth effect and biocompatibility of these polymers have been evaluated in several studies. A prolonged blood circulation time of HPG liposomes compared to unmodified liposomes has been found for poly(glycerol)s with molar masses in the range of 150 Da to 750 Da. [128] Surfaces covered Angew. Chem. Int. Ed. 2010, 49, Wiley-VCH Verlag GmbH & Co. KGaA, Weinheim

89 Reviews U. S. Schubert et al. Scheme 2. Structures of the discussed non-biodegradable polymers. with kda HPG showed similar or better protein repulsion than PEG of the same molar mass, probably [132, 133] because of its dense brush-like structure. Only very low in vitro cytotoxicity has been observed at concentrations of 10 mgml 1 after 48 h incubation for HPGs with molar masses between 106 kda and 870 kda. In vivo studies on mice did not show any signs of toxicity. [134,135] The hemocompatibility of HPG has been proven by examination of platelet activation and by coagulation studies. [127, ] By examining the generation of C3a, the complement activation of the immune system by poly(glycerol)s has been found to be in the same range as that in saline and PEG (Figure 5). However, since only C3a levels were examined, a direct comparison with the results obtained by Szebeni et al. on PEG is not possible, as their studies were based on SC5b-9 levels. A comparative study between linear PG and HPG of 6.4 kda showed no significant difference in red blood cell aggregation, complement activation, and cell viability for the two polymer architectures in vitro as well as in vivo. No decrease in the biocompatibility and no increase in complement activation, because of the lower molar mass, was observed relative to the results found with 106 kda and 870 kda HPG. [134] The same non-biodegradability in vivo can be speculated for PG and PEG because of their comparable polyether structures. Michael and Coots found no signs of catabolism of PG, and the predominant excretion in urine after oral administration is similar to PEG. [137] Additionally, accumulation in the liver and spleen (but not in the kidney, lung, or heart) was found for the high-molar-mass HPG, and only very low excretion in urine was reported over 30 days in mice (Figure 5). [131] However, HPGs of lower molar mass were not investigated in terms of their accumulation, thus making an estimation of the excretion limit for HPG impossible. In Figure 5. a) b) Plot of the polymer concentration in plasma versus time after intravenous injection into female Balb/C mice. c) Levels of polymer accumulated over time in liver injected intravenously into female Balb/C mice (blank squares: HPGA, filled squares: HPGB). [131] Reproduced from Ref. [131] with permission from Elsevier B.V. d) Generation of the C3a fragment upon incubation of polymers with PPP. [135] Reproduced from Ref. [135] with permission from Elsevier B.V. Abbreviations: HPGA = hyperbranched poly(glycerol) of 106 kda, HPGB = hyperbranched poly(glycerol) of 540 kda, PPP = platelet-poor plasma. contrast to PEG, no degradation studies under mechanical stress have been reported for PG, but as PG possesses a similar ether structure as PEG, an analogous susceptibility to oxygen-induced degradation might be assumed Wiley-VCH Verlag GmbH & Co. KGaA, Weinheim Angew. Chem. Int. Ed. 2010, 49,
90 Drug Transport Angewandte Chemie The use of glycidol or epichlorhydrine as latent AB m monomers permits better control over the polymerization to give more defined hyperbranched poly(glycerol)s with the PDI value reduced from 5 to 1.8. [138] While hyperbranched poly(glycerol)s are accessible from glycidol or epichlorhydrine monomers, linear polymers are available by protecting the free hydroxy group of glycidol to prevent branching. The polymerization step is followed by deprotection of the hydroxy groups. [134] The functionalization of PG is feasible via the initiator, and since poly(glycerol)s are hydroxy-rich polymers, all the general substitution reactions of hydroxy groups are possible and result in high degrees of functionalization (Scheme 3). [129,136, 139] Diglycerol, PG-3, and PG-4 are commercially available oligomers. Esters of up to PG-10 are approved by the FDA as food and pharma additives. [140] Scheme 3. Synthesis of linear and hyperbranched poly(glycerol). In conclusion, since PG possesses a similar structure to PEG it shows comparable advantages and disadvantages. An additional interesting possibility is PG branching, since the hyperbranched arrangement allows very high degrees of functionalization, although some end groups will be sterically hidden. The high degree of branching is also advantageous for the circulation time, since branched structures are not as quickly excreted as their linear analogues. Furthermore, highly branched polymers have low intrinsic viscosity and are, therefore, expected to increase the blood viscosity only slightly, which has been shown to cause a variety of complex physiological effects. [141] Poly(2-oxazoline)s The hydrophilic poly(2-methyl-2-oxazoline) (PMeOx) and poly(2-ethyl-2-oxazoline) (PEtOx) were discovered in the 1960s. [ ] Since then a wide range of chemistry has built up around this class of polymers including the living polymerization method, which yields very low PDI values, and versatile end-group chemistry. [146,147] Nonetheless, the application of poly(2-oxazoline)s in biomedical fields arose only recently, and although both types of polymers have been quite widely tested for different drug-carrier applications, only a few basic biological and stability studies have been reported. [148,149] Drug-transport systems with poly(2-oxazoline) were developed, for example, based on micelles of PLA-PEtOx-PLA [PLA = poly(lactic acid)] as carriers of doxorubicin. [150] PEtOx-poly(e-caprolactone) micelles with paclitaxel have been shown to possess the same efficiency as Cremophor EL formulated paclitaxel. [151] A cytosine arabinose conjugate of PEtOx showed IC 50 values in HeLa cell viability tests in a similar range as the corresponding PEG conjugate. [152] PMeOx-coated surfaces have been shown to possess the same protein repellency as [153, 154] PEG. One of the few fundamental biological studies was performed by Veronese et al. They showed erythrocyte compatibility for PEtOx with molar masses of 5, 10, and 20 kda at polymer concentrations of 5 mg ml 1. They also showed that 20 kda PEtOx was safe and nontoxic for intravenous administration every second day at doses of up to 50 mgkg 1 over a period of 2 weeks (control: saline). [155] The hydrophilic shells of PMeOx and PEtOx prolonged the blood circulation times of liposomes in the same range as PEG. [156] In addition, Zalpinsky et al. documented similar prolonged blood circulation of PEG-, PMeOx- and PEtOxmodified liposomes with 5 mol% of phospholipid and about 40 repeating units of each polymer. [157] Additionally, they found that three different types of liposomes showed a similar tissue distribution profile after 24 h, which means there is preferential distribution in the liver, spleen, and kidney (Figure 6). [157] Analogous results have been found for 111 Inlabeled 4 kda PMeOx and 4 kda PEtOx, which showed an augmented blood circulation time but also an increased occurrence of the polymer in the kidney and bladder. [158] Furthermore, PEtOx possesses a lower critical solution temperature (LCST), which can be used for enhanced targeting of specific tissue. [149,159] The biodegradation of PEtOx was investigated by using proteinase K, a nonhuman enzyme. A partial degradation to PEI was found on incubation, but whether this degradation also takes place in humans was not investigated. [160] Cleavage of this side group generates the cationic derivative PEI, which was shown to be cytotoxic as well as to induce erythrocyte aggregation and hemolysis depending on the molar mass, branching, and number of cationic groups. The lower the molar mass and the degree of branching of the PEI, the higher [161, 162] the bio- and hemocompatibility. In summary, PMeOx and PEtOx show a behavior comparable to PEG in terms of blood circulation time, opsoniza- Angew. Chem. Int. Ed. 2010, 49, Wiley-VCH Verlag GmbH & Co. KGaA, Weinheim
 Blood lifetimes of 67 Ga-labeled liposomes [(90 5) nm] prepared from the EPC, cholesterol, and DSPE conjugate of either PEG, PMeOx, or PEtOx, as well as a control EPG; molar ratio 1.85:1:0.15.")
.")
91 Reviews U. S. Schubert et al. Figure 6. a) Blood lifetimes of 67 Ga-labeled liposomes [(90 5) nm] prepared from the EPC, cholesterol, and DSPE conjugate of either PEG, PMeOx, or PEtOx, as well as a control EPG; molar ratio 1.85:1:0.15. Four Sprague Dawley rats were injected with each liposomal preparation in the tail vein. Samples obtained by retroorbital bleeding at various times were used to determine the radioactivity in the blood (EPC: egg phosphatidylcholine, EPG: egg phosphotidylglycerol). [156] Reproduced from Ref. [156] with permission from the American Chemical Society. b) g-camera imaging of the in vivo distribution of PMeOx 48 PipDOTA[ 111 In] in a CD1 mouse 30 min and 3 h after intravenous injection (PipDOTA: piperazine-thiouryl-p-benzyl- 1,4,7,10-tetraazacyclododecane-N,N,N,N-tetraacetic acid). The highest concentrations were in the bladder (thin arrowhead), the kidneys (arrows), and the blood pool in the heart (thick arrowhead). [158] Reproduced from Ref. [158] with permission from Elsevier B.V. tion, and organ distribution. Nevertheless, important details of immune activation and mechanical stability need further investigation to further evaluate the potential of poly- (2-oxazoline)s as alternatives to PEG Vinyl Polymers Poly(acrylamide) Torchilin et al. reported that liposomes covered with 7 kda poly(acrylamide) (PAAm) showed prolonged blood circulation compared to unmodified liposomes (Figure 7). [163] Microspheres of PAAm containing 5-fluorouracil, [164] hydrogels for ibuprofen release, and ultrafine hydrogel nanoparticles with meta-tetra(hydroxyphenyl)chlorin for photodynamic therapy (PDT) have also been tested. [165] Hemoglobin-containing PAAm microspheres have also been investigated as oxygen carriers. [166] Figure 7. a) Liposome clearance from the blood of mice; b) liposome accumulation in the liver. 1) plain liposomes; 2) PVP-l-P-liposomes (2.5 mol% PVP); 3) PAAm-L-P-liposomes (2.5 mol% PAAm); 4) PEGliposomes (2.5 mol% PEG); 5) PVP-L-P liposomes (6.5 mol% PVP); 6) PAAm-L-P liposomes (6.5 mol% PAAm); 7) PEG liposomes (6.5 mol% PEG) (L: molar mass of polymer 6 8 kda, P: with terminal palmityl group). Reproduced from Ref. [163] with permission from Elsevier B.V. PAAm is often affirmed in such studies to be nonimmunogenic, highly protein resistant, [167, 168] and not to show cytotoxic effects. [169] However, other reports state an inflammatory response upon implantation of PAAm hydrogels. [ ] Other reported drawbacks of PAAm are the following: 1) PAAm can degrade to acrylamide by thermal and photolytic effects; [171] 2) it has a carbon backbone and, as a result, is not biodegradable; [171] 3) a preferential distribution of 7 kda PAAm liposomes in the liver; [163] 4) PAAm is synthesized by polymerization of acrylamide, a monomer which is known to induce a variety of severe neurotoxic effects [167] so that residual monomer may [171, 173] account for adverse reactions. In view of the controversies and the described disadvantages of PAAm, the wide application of PAAm seems to be surprising. Although PAAm seems to improve blood clearance rates of liposomes, it activates the immune system and even worse, the monomer shows very distinct toxic side effects it is classified by the International Agency for Research on Cancer in group 2b (meaning the agent is possibly carcinogenic to humans) and is produced during Wiley-VCH Verlag GmbH & Co. KGaA, Weinheim Angew. Chem. Int. Ed. 2010, 49,
92 Drug Transport Angewandte Chemie thermal and photolytic degradation of the polymer. These drawbacks limit the widespread use of PAAm for biomedical applications Poly(vinylpyrrolidone) Poly(vinylpyrrolidone) (PVP) is commercially available, for example, under the brand name Kollidon from BASF. In the cosmetic and pharmaceutical industry it is used as, for example, tablet coating and binder as well as an excipient for the formulation of poorly water soluble drugs. PVP is also used in adhesives, coatings and inks, photoresists, paper, photography, textiles, and fiber applications. PVP was used as a plasma expander in the first half of the 20th century, and the iodine complex (Povidone-iodine) possesses disinfectant properties. As a food additive, PVP is used as a stabilizer and has the E number E1201. [40] This wide range of oral applications indicate that there is already potential compatibility to biomedical fields and, indeed, investigations concerning its suitability for drugdelivery applications look very promising. Its highly hydrated structure makes it suitable to increase the water content of other polymeric materials. [174,175] It is possibly through this high hydration that an interaction with the immune system is suppressed, and distribution studies on poly(hydroxyethyl methacrylate) (PHEMA) and PHEMA-PVP copolymer hydrogels suggest that PVP shows no C3a activation. [176] This leads to the prolonged blood circulation of 6 kda and 7 kda PVP liposomes and 6 kda PVP-superoxiddismutase [163,177, 178] (SOD) conjugates (Figure 7). Nevertheless, contradictory results have also been reported that show an enhanced protein adsorption on 6 kda PVP-uricase conjugates compared to native uricase as well as the formation of PVP antibodies. [179] Similar observations have been made with PVP-conjugated d-nacetylhexosamidase A, which can interact strongly with antibodies of the native protein. [179] Despite this finding, PVP has been tested in several drug-delivery systems, including a SOD conjugate [178] and liposomes with a stabilizing, hydrophilic PVP shell. [163, 177, 180] In addition, PLA-PVP micelles [181, 182] and microspheres [183] as well as PVP-gelatin hydrogels [184] and PVP have been studied for their formulation assistance. [185,186] PVP has also been used as a gene-delivery system as it can bind presumably through hydrogen bonds with DNA to form a complex. PVP increased the stability and half-life of DNA in vivo by shielding the negative charge and protecting it against enzymatic degradation. [187] Another promising aspect of PVP is its slower degradation compared to PEG under UV or ultrasound irradiation, even though the formation of peroxides during [103, 188] drying can not be prevented. [189] The Ph. Eur. limits the peroxide content of this polymer to 400 ppm. As for PEG, the slow in vitro peroxide-mediated degradation of the polymer is in contrast to its in vivo non-biodegradability. PVP possesses a carbon backbone that is not degraded on exposure to enzymes. This led to the removal of PVP as a plasma expander from the market: patients who received PVP with a molar mass above 25 kda, which cannot be excreted from the body developed a PVP storage disease. [190] PVP can be synthesized by free-radical polymerization of vinylpyrrolidone as well as by controlled radical polymerization methods. [174] The latter method leads to improved PDI values below 1.2, [182, ] variable end groups, [182, 194] and most importantly to the prevention of high-molar-mass PVP. The vinylpyrrolidone monomer is presumed to be a carcinogen and should be removed carefully from the polymer. In conclusion, the biocompatibility of PVP looks quite promising for polymers with molar masses below the kidney threshold. Nevertheless, PVP has similar problems as PEG: an unclear immunological behavior and non-biodegradability, which leads to accumulation of the polymer above the excretion limit Poly(N-(2-hydroxypropyl)methacrylamide) The bio-application of poly(n-(2-hydroxypropyl)methacrylamide) (PHPMA) was established by Kopecek et al. in the 1970s. [195] The application of PHPMA was further developed by Rihova et al. and Duncan, which led to the use of PHPMA conjugates in clinical trials. [195] The most successful conjugate, a 28 kda PHPMA-doxorubicin copolymer (8.5 wt %; doxorubicin PK1; clinical trial FCE phase III; Scheme 4) was tested against various cancers (Table 3) and showed activity against NSCLC, colorectal cancer, and breast cancer. [196] Additionally, neither cardiotoxicity nor multidrug resistance was observed in these studies, no liver and spleen accumulation was noted, and no immunogenicity or polymer-related toxicity was detected. [195] Scheme 4. A doxorubicine-hpma conjugate. In addition, 25 kda PHPMA conjugates with doxorubicin galactosamine (7.5 wt%), carboplatinate (8.5 wt % Pt), and DACH platinate (8.5% w/w) successfully entered phase I/II trials for various cancers. [195] However, the fact that the clinical trials for the PHPMA-paclitaxel and PHPMA-camptothecin conjugates were discontinued because of a lack of antitumor activity shows that biological events that result in efficient drug-delivery systems in vivo are not easily understood and not yet fully explored (Table 3). Angew. Chem. Int. Ed. 2010, 49, Wiley-VCH Verlag GmbH & Co. KGaA, Weinheim
93 Reviews U. S. Schubert et al. Other HPMA-conjugated systems for cancer therapy were also investigated, but have not yet entered clinical trials. These include a glutathione derivative to inhibit human glyoxalase and a cyclohexanone derivative coupled to HPMA with a molar mass of 3 30 kda and with various drug contents. In vitro studies with murine B16 melanoma cells showed the conjugate was less efficient than the free drug, but this result is not surprising, since the success of conjugates is based on the retarded, slower release of the drug in vivo. [197] A study of 16 to 50 kda geldanamycin-hpma conjugates also revealed reduced toxicities in A2780 ovarian cancer cells as well as prostate cancer cell lines (PC-3 and DU145) and endothelial cells (HUVECs). The improved in vivo tolerance of mice against the conjugate was investigated, and showed a tolerance for 80 mg kg 1 with no signs of toxicity (compared to 30 mg kg 1 for the free drug). [198,199] Conventional conjugation by PHPMA occurs by binding to the multiple side chains of the polymer. For conjugates with proteins, conjugation of one end of the PHPMA chain (instead of the multiple side groups to yield starlike architectures) turned out to be more advantageous. The PDI value above 3.5 for a conventional protected SOD conjugate was reduced to 2 by conjugation with semitelechelic PHPMA. This probably causes the improved biocompatibility, as significantly larger numbers of antibodies were formed against the classic form of PHPMA-SOD conjugate than [200, 201] the star-shaped PHPMA-SOD conjugate. Drug-delivery systems with different architectures, such as starlike doxorubicin conjugates, conjugation with multiple side groups, or the use of the polymer as an excipient all showed a decreased efficiency in vitro against A2780 ovarian carcinoma cells compared to the free doxorubicin. [202] HPMA conjugates were prepared for active targeting by a Fab antibody, and mesochlorin was introduced as the active principle for photodynamic therapy. This study showed an inhibition of the growth of ovarian carcinoma cells under irradiation. [203] Complexes of poly(l-lysine) and DNA with semitelechelic 5.5 kda and 8.5 kda PHPMA were found to display an increased in vitro stability in salt solutions against albumin-induced aggregation, decreased albumin binding, and reduced phagocytic uptake, but have not shown any prolonged circulation times in vivo. The reason for that remains to be elucidated. [204] The blood circulation time for PLL-PEI complexes was found to increase from 5 to 90 minutes by modification with multivalent PHPMA. [23] Liposomes with PHPMA hydrophilic shells that would transport calcein were prepared. [205] Whiteman et al. showed that liposomes modified with 4.3 kda PHPMA have longer blood circulation times than unmodified ones (Figure 8). [206] Different types of hydrogels of PHPMA were also tested as drug carriers, [207] for example, for doxorubicin [208] or for PHPMA-adriamycine conjugates to overcome multidrug resistence. [208] PHPMA can be prepared by either free or controlled radical polymerization mechanisms (such as atomtransfer radical polymerization (ATRP) or reversible addition-fragmentation chain transfer (RAFT)), [ ] and different end groups for chemical modifications were obtained. [212] The degradation of the polymer under thermal heating was studied. [213] Again, similar to all vinyl polymers, they are Figure 8. a) Blood clearance and b) liver accumulation for 1) plain liposomes and 2) liposomes with 0.3 mol% PHPMA-oleic acid, M w 4300 Da; 3) liposomes with 3 mol% PHPMA-oleic acid, M w 4300 Da; 4) liposomes with 3 mol% PHPMA-oleic acid, M w 2900 Da. [206] Reproduced from Ref. [206] with permission from Informa Healthcare, Taylor & Francis Group. degraded under stress, but in general they are not biodegradable under physiological conditions. [214] Nonetheless, it has been shown that a molar mass of 30 kda ensures elimination of the carrier from the body. [195] The excretion limit is 45 kda, and long-circulating carriers end up in the liver and spleen. [ ] However, a DOX-PHPMA conjugate with a molar mass above 30 kda tested in mice showed a diminished doxorubicin concentration in the heart, but an augmented presence of the conjugate was found in the liver and spleen. [217] In summary, PHPMA conjugates have already entered clinical trials and the results look very promising. However, immunological and stability questions as well as the excretion limit have not yet been investigated and the results of the clinical trials have to be awaited. 7. Conclusions PEG is currently the most used polymer in the biomedical field of drug delivery and the only polymeric therapeutic that has market approval for different drugs. The success of PEG is based on its hydrophilicity, decreased interaction with blood components, and high biocompatibility. However, scientific results obtained in recent years show that it may also have possible drawbacks, such as interaction with the immune system, possible degradation under stress, and accumulation in the body above an uncertain excretion limit. Furthermore, many of the studies on the biocompatibility of PEG date back to the 1950s to 1970s and, therefore, Wiley-VCH Verlag GmbH & Co. KGaA, Weinheim Angew. Chem. Int. Ed. 2010, 49,
94 Drug Transport Angewandte Chemie additional investigations are required that exploit contemporary techniques and analytical possibilities, in particular at the cellular level. If an alternative polymer to PEG has to be chosen, a wide range of chemically very different synthetic polymers are available, although only a limited number are water soluble. These water-soluble polymers have to compete with the very high requirements of the gold standard PEG. It becomes very clear when considering the potential alternatives that, in comparison to PEG, none of the alternative polymers are supported by sufficient studies concerning their biocompatibility, degradation under stress, and excretion limit. Even though the difficult patent situation of PEG pushed the search for alternative polymers, none of them have yet achieved approval for application. Most of the hydrophilic polymers cannot be considered as alternatives because they undergo severe interactions with the immune system and, therefore, are not able to prolong drug-carrier circulation times in the body. The most promising polymers that do show enhanced circulation time are poly(glycerol)s, poly(amino acid)s, poly- (vinylpyrrolidone), poly(2-oxazoline)s, and poly(n-(2-hydroxypropyl)methacrylamide). Clearance by the kidneys can be favored by using biodegradable polymers. However, the only polymers that provide both a biodegradable structure and a stealth effect are synthetic poly(amino acid)s. All other considered polymers show the same disadvantage as PEG, namely nonbiodegradability and the associated unknown fate after disaggregation of the drug carrier, in particular after frequently repeated administrations. Poly(amino acid)s are the only polymers not to excite the accelerated blood clearance phenomenon, which is an advantage over PEG. An evaluation is not possible for all the other presented polymers, as investigations on this topic have not yet been reported. It should also be considered that the presented polymers, with their rather different chemical structures, might follow different degradation pathways, which may lead to new chemical species of yet unknown biocompatibility. Degradation under stress has barely been investigated for all of the alternative polymers; thus, conclusions can not be drawn except in the case of PAAm, which degrades to its toxic monomer and is, therefore, unsuitable for biomedical applications. Interestingly, most of the monomers are toxic compounds, whereas the resulting polymers are biocompatible. Considered as a whole, it appears that when all the polymers are judged with the same severe criteria, PEG remains the gold standard in the field of polymeric drug delivery, as it is the best investigated polymer. However, further studies with more systematic investigations may lead to a different view. In fact, possible substitutes are showing promising results and just need further investigations to allow proper evaluation and comparison with PEG. The Dutch Polymer Institute (DPI) and the Thüringer Ministerium für Bildung, Wissenschaft und Kultur (TMBWK, ProExzellenz-Programm NanoConSens, B ) are gratefully acknowledged for financial support. We thank Dr. Tobias Pöhlmann, Dr. Stephanie Hornig, and Prof. Dieter Schubert for helpful comments. Additionally, we would like to thank the referees for their kind efforts and helpful remarks. Received: May 19, 2009 Published online: July 20, 2010 [1] G. Pasut, F. M. Veronese, Prog. Polym. Sci. 2007, 32, [2] T. M. Allen, P. R. Cullis, Science 2004, 303, [3] R. Duncan, M. J. Vicent, F. Greco, R. I. Nicholson, Endocr.- Relat. Cancer 2005, 12, S189 S199. [4] D. Bhadra, S. Bahdra, P. Jain, N. K. Jain, Pharmazie 2002, 57,5 28. [5] C. Monfardini, F. M. Veronese, Bioconjugate Chem. 1998, 9, [6] A. Abuchowski, T. van Es, N. C. Palczuk, F. F. Davis, J. Biol. Chem. 1977, 252, [7] A. Abuchowski, J. R. McCoy, N. C. Palczuk, T. van Es, F. F. Davis, J. Biol. Chem. 1977, 252, [8] F. Veronese, J. M. Harris, Adv. Drug Delivery Rev. 2002, 54, [9] F. Veronese, J. M. Harris, Adv. Drug Delivery Rev. 2003, 55, [10] R. Gref, Y. Minamitake, M. T. Peracchia, V. Trubetskoy, V. Torchilin, R. Langer, Science 1994, 263, [11] J. Kreuter, Int. J. Pharm. 2007, 331, [12] G. Gregoriadis, N. Engl. J. Med. 1976, 295, [13] G. Gregoriadis, N. Engl. J. Med. 1976, 295, [14] A. L. Klibanov, K. Maruyama, V. P. Torchilin, L. Huang, FEBS Lett. 1990, 268, [15] G. Blume, G. Cevc, Biochim. Biophys. Acta Biomembr. 1990, 1029, [16] M. C. Woodle, M. Newman, L. Collins, C. Redemann, F. Martin, Proc. Int. Symp. Controlled Release Bioact. Mater. 1990, 17, [17] M. C. Woodle, Adv. Drug Delivery Rev. 1995, 16, [18] D. D. Lasic, D. Needham, Chem. Rev. 1995, 95, [19] V. P. Torchilin, Nat. Rev. Drug Discovery 2005, 4, [20] A. V. Kabanov, V. P. Chekhonin, V. Y. Alakhov, E. V. Batrakova, A. S. Lebedev, N. S. Melik-Nubarov, S. A. Arzhakov, A. V. Levashov, G. V. Morozov, FEBS Lett. 1989, 258, [21] G. S. Kwon, K. Kataoka, Adv. Drug Delivery Rev. 1995, 16, [22] S. Svenson, D. A. Tomalia, Adv. Drug Delivery Rev. 2005, 57, [23] D. Oupicky, M. Ogris, K. A. Howard, P. R. Dash, K. Ulbrich, L. W. Seymour, Mol. Ther. 2002, 5, [24] M. Ogris, S. Brunner, S. Schueller, R. Kircheis, E. Wagner, Gene Ther. 1999, 6, [25] H.-K. Nguyen, P. Lemieux, S. V. Vinogradov, C. L. Gebhart, N. Guerin, G. Paradis, T. K. Bronich, V. Y. Alakhov, A. V. Kabanov, Gene Ther. 2000, 7, [26] A. Aigner, D. Fischer, T. Merdan, C. Brus, T. Kissel, F. Czubayko, Gene Ther. 2002, 9, [27] S. Parveen, S. K. Sahoo, Clin. Pharmacokinet. 2006, 45, [28] H. Maeda, J. Wua, T. Sawaa, Y. Matsumurab, K. Horic, J. Controlled Release 2000, 65, [29] K. Greish, J. Drug Targeting 2007, 15, [30] R. Haag, F. Kratz, Angew. Chem. 2006, 118, ; Angew. Chem. Int. Ed. 2006, 45, [31] D. Schmaljohann, Adv. Drug Delivery Rev. 2006, 58, [32] J. Kost, R. Langer, Adv. Drug Delivery Rev. 2001, 46, [33] C. de Las Heras Alarcon, S. Pennadem, C. Alexander, Chem. Soc. Rev. 2005, 34, Angew. Chem. Int. Ed. 2010, 49, Wiley-VCH Verlag GmbH & Co. KGaA, Weinheim
95 Reviews U. S. Schubert et al. [34] A. W. York, S. E. Kirkland, C. L. McCormick, Adv. Drug Delivery Rev. 2008, 60, [35] V. P. Torchilin, V. S. Trubetskoy, Adv. Drug Delivery Rev. 1995, 16, [36] S. M. Grayson, W. T. Godbey, J. Drug Targeting 2008, 16, [37] R. Luxenhofer, M. Bezen, R. Jordan, Macromol. Rapid Commun. 2008, 29, [38] F. M. Veronese, G. Pasut, Drug Discovery Today 2005, 10, [39] C. Passirani, J.-P. Benoit, Biomaterials for Delivery and Targeting of Proteins and Nucleic Acids, CRC, Boca Raton, FL, [40] V. P. Torchilin, J. Microencapsulation 1998, 15, [41] H. Petersen, P. M. Fechner, D. Fischer, T. Kissel, Macromolecules 2002, 35, [42] (WHO International Programme on Chemical Safety), last accessed [43] O. Biondi, S. Motta, P. Mosesso, Mutagenesis 2002, 17, [44] I. B. Mosbah, R. Franco-Go, H. B. Abdennebi, R. Hernandez, G. Escolar, D. Saidane, J. Rosello-Catafau, C. Peralta, Transplant. Proc. 2006, 38, [45] B. Balakrishnana, D. Kumarb, Y. Yoshidab, A. Jayakrishnan, Biomaterials 2005, 26, [46] M. Rahman, C. S. Brazel, Prog. Polym. Sci. 2004, 29, [47] S. Lakshmi, A. Jayakrishnan, Artif. Organs 1998, 22, [48] L. J. Suggs, J. L. West, A. G. Mikos, Biomaterials 1999, 20, [49] Encyclopedia of Polymer Science and Technology (Ed.: H. F. Mark), Wiley, New York, [50] A. Asatekin, S. Kang, M. Elimelech, A. M. Mayes, J. Membr. Sci. 2007, 298, [51] K. H. Cheng, S. L. Leung, H. W. Hoekman, W. H. Beekhuis, P. G. H. Mulder, A. J. M. Geerards, A. Kijlstra, Lancet 1999, 354, [52] O. H. Kwon, Y. C. Nho, Y. M. Lee, J. Ind. Eng. Chem. 2003, 9, [53] W. Johnson, Int. J. Toxicol. 2001, 20, [54] C.-J. Le Coz, E. Heid, Contact Dermatitis 2001, 44, [55] A. Chanan-Khan, J. Szebeni, S. Savay, L. Liebes, N. M. Rafique, C. R. Alving, F. M. Muggia, Ann. Oncol. 2003, 14, [56] J. Szebeni, Toxicology 2005, 216, [57] J. Janatova, ASAIO J. 2000, S53 S62. [58] J. Szebeni, L. Baranyi, S. Savay, J. Milosevits, R. Bunger, P. Laverman, J. M. Metselaar, G. Storm, A. Chanan-Khan, L. Liebes, F. M. Muggia, R. Cohen, Y. Barenholz, C. R. Alving, J. Liposome Res. 2002, 12, [59] J. Szebeni, F. M. Muggia, C. R. Alving, J. Natl. Cancer Inst. 1998, 90, [60] J. M. Metselaar, Dissertation, Dept. Pharmaceutics, Utrecht Institute for Pharmaceutical Sciences, Utrecht University, The Netherlands, [61] A. H. Brouwers, D. J. de Jong, E. T. M. Dams, W. J. G. Oyen, O. C. Boerman, P. Laverman, T. H. J. Naber, G. Storm, F. H. M. Corstens, J. Drug Targeting 2000, 8, [62] M. J. Parr, D. Masin, P. R. Cullis, M. B. Bally, J. Pharmacol. Exp. Ther. 1997, 280, [63] D. Calvo, J. M. de La Hera, D.-H. Lee, Rev. Esp. Cardiol. 2006, 59, [64] M. C. H. de Groot, B. J. van Zwieten-Boot, A. C. van Grootheest, Ned. Tijdschr. Geneeskd. 2004, 148, [65] P. A. Dijkmans, C. A. Visser, O. Kamp, Eur. J. Echocardiogr. 2005, 6, [66] P. Dewachter, C. Mouton-Faivre, Allergy 2005, 60, [67] A. W. Richter, E. Akerblom, Int. Arch. Allergy Appl. Immunol. 1983, 70, [68] A. W. Richter, E. Akerblom, Int. Arch. Allergy Appl. Immunol. 1984, 74, [69] J. K. Armstrong, G. Hempel, S. Koling, L. S. Chan, T. Fisher, H. J. Meiselman, G. Garratty, Cancer 2007, 110, [70] N. J. Ganson, S. J. Kelly, E. Scarlett, J. S. Sundy, M. S. Hershfield, Arthritis Res. Ther. 2005, 8, R12 R22. [71] C. Assal, P. Y. Watson, Gastrointest. Endocrinol. 2006, 64, [72] E. Schuman, P. E. Balsam, Gastrointest. Endocrinol. 1991, 37, 411. [73] E. Brullet, A. Moron, X. Calvet, C. Frias, J. Sola, Gastrointest. Endocrinol. 1992, 38, [74] N. Stollman, H. D. Manten, Gastrointest. Endocrinol. 1996, 44, [75] M. Ito, D. Watanabe, M. Kobayashi, Y. Tamada, Y. Matsumoto, Contact Dermatitis 2006, 54, 225. [76] Y. N. Kwee, J. Dolovich, J. Allergy Clin. Immunol. 1982, 69, 138. [77] A. A. Fisher, Contact Dermatitis 1978, 414, [78] S. Quartier, M. Garmyn, S. Becart, A. Goosens, Contact Dermatitis 2006, 55, [79] E. T. M. Dams, P. Laverman, W. J. G. Oyen, G. Storm, G. L. Scherphof, J. W. M. van der Meer, F. H. M. Corstens, O. C. Boerman, J. Pharmacol. Exp. Ther. 2000, 292, [80] T. Ishida, R. Maeda, M. Ichihara, K. Irimura, H. Kiwada, J. Controlled Release 2003, 88, [81] H. Koide, T. Asai, K. Hatanaka, T. Urakami, T. Ishii, E. Kenjo, M. Nishihara, M. Yokoyama, T. Ishida, H. Kiwada, N. Okua, Int. J. Pharm. 2008, 362, [82] T. Ishida, M. Harada, X. Y. Wang, M. Ichihara, K. Irimura, H. Kiwada, J. Controlled Release 2005, 105, [83] T. Ishida, H. Kiwada, Int. J. Pharm. 2008, 354, [84] T. Ishida, K. Masuda, T. Ichikawa, M. Ichihara, K. Irimura, H. Kiwada, Int. J. Pharm. 2003, 255, [85] T. Ishida, S. Kashima, H. Kiwada, J. Controlled Release 2008, 126, [86] P. Laverman, A. H. Brouwers, E. T. M. Dams, W. J. G. Oygen, G. Storm, N. van Rooijen, F. H. M. Corstens, O. C. Berman, J. Pharmacol. Exp. Ther. 2000, 293, [87] D. A. Herold, K. Keil, D. E. Bruns, Biochem. Pharmacol. 1989, 38, [88] K. D. Hinds, Biomaterials for Delivery and Targeting of Proteins and Nucleic Acids, CRC, Boca Raton, FL, [89] V. P. Torchilin, Adv. Drug Delivery Rev. 2006, 58, [90] Y. Takakura, A. Takagi, M. Hashida, H. Sezaki, Pharm. Res. 1987, 4, [91] S. M. Moghimi, A. C. Hunter, J. C. Murray, Pharmacol. Rev. 2001, 52, [92] C. B. Schaffer, F. H. Critchfield, J. H. Nair, J. Am. Pharm. Assoc. Sci. Ed. 1950, 39, [93] C. P. Carpenter, M. D. Woddside, E. R. Kinkead, J. M. King, L. J. Sullivan, Toxicol. Appl. Pharmacol. 1971, 18, [94] H. F. Smyth, C. P. Carpenter, C. S. Weil, J. Am. Pharm. Assoc. Sci. Ed. 1950, 39, [95] S. M. Moghimi, J. Szebeni, Prog. Lipid Res. 2003, 42, [96] B. Romberg, J. M. Metselaar, L. Baranyi, C. J. Snel, R. Bunger, W. E. Hennink, J. Szebeni, G. Storm, Int. J. Pharm. 2007, 331, [97] R. S. Porteer, A. Casale, Polym. Eng. Sci. 1985, 25, [98] X. Zhang, S. Granick, Macromolecules 2002, 35, [99] T. G. Papaioannou, E. N. Karatzis, M. Vavuranakis, J. P. Lekakis, C. Stefanadis, Int. J. Cardiol. 2006, 113, [100] A. R. DAlmeida, M. L. Dias, Polym. Degrad. Stab. 1997, 56, [101] D. A. White, Chem. Eng. Sci. 1970, 25, [102] Y. Minoura, T. Kasuya, S. Kawamura, A. Nakano, J. Polym. Sci. Part A 1967, 5, Wiley-VCH Verlag GmbH & Co. KGaA, Weinheim Angew. Chem. Int. Ed. 2010, 49,
96 Drug Transport Angewandte Chemie [103] T. Aarthi, M. S. Shaama, G. Madras, Ind. Eng. Chem. Res. 2007, 46, [104] A. Nakano, Y. Minoura, J. Appl. Polym. Sci. 1971, 15, [105] S. Han, C. Kim, D. Kwon, Polymer 1997, 38, [106] J. Scheirs, S. W. Bigger, O. Delatycki, Polymer 1991, 32, [107] S. Morlat, J.-L. Gardette, Polymer 2001, 42, [108] A. M. Afih-Effat, J. N. Hay, Eur. Polym. J. 1972, 8, [109] J. S. Lee, D. H. Go, J. W. Bae, S. J. Le, K. D. Park, J. Controlled Release 2007, 117, [110] C. Larsen, Adv. Drug Delivery Rev. 1989, 3, [111] S.-I. Sugahara, M. Kajiki, H. Kuriyama, T.-R. Kobayashi, J. Controlled Release 2007, 117, [112] K. A. Janes, P. Calvo, M. J. Alonso, Adv. Drug Delivery Rev. 2001, 47, [113] C. Li, S. Wallace, Adv. Drug Delivery Rev. 2008, 60, [114] J. Pytela, V. Saudek, J. Drobnik, F. Rypacek, J. Controlled Release 1989, 10, [115] B. Romberg, C. Oussoren, C. J. Snel, M. G. Carstens, W. E. Hennink, G. Storm, Biochim. Biophys. Acta Biomembr. 2007, 1768, [116] B. Romberg, F. M. Flesch, W. E. Hennink, G. Storm, Int. J. Pharm. 2008, 355, [117] J. M. Metselaar, P. Bruin, L. W. T. de Boer, T. de Vringer, C. Snel, C. Oussoren, M. H. M. Wauben, D. J. A. Crommelin, G. Storm, W. E. Hennink, Bioconjugate Chem. 2003, 14, [118] J. C. Middleton, A. J. Tipton, Biomaterials 2000, 21, [119] K. De Winne, E. Roseeuw, J. Pagnaer, E. Schacht, J. Bioact. Compat. Polym. 2004, 19, [120] S. R. Yang, H. J. Lee, J.-D. Kim, J. Controlled Release 2006, 114, [121] G. Pitarresi, P. Pierro, F. S. Palumbo, G. Tripodo, G. Giammona, Biomacromolecules 2006, 7, [122] M. Obst, A. Steinbuechel, Biomacromolecules 2004, 5, [123] M. E. R. OBrien, M. A. Socinski, A. Y. Popovich, I. N. Bondarenko, A. Tomova, B. T. Bilynskyi, Y. S. Hotko, V. L. Ganul, I. Y. Kostinsky, A. J. Eisenfeld, L. Sandalic, F. B. Oldham, B. Bandstra, A. B. Sandler, J. W. Singer, J. Thorac. Oncol. 2008, 3, [124] C. Li, J. E. Price, L. Milas, N. R. Hunter, S. Ke, D.-F. Yu, C. Charnsangavej, S. Wallace, Clin. Cancer Res. 1999, 5, [125] C. Li, D.-F. Yu, R. A. Newman, F. Cabrai, L. C. Stephens, N. Hunter, L. Milas, S. Wallace, Cancer Res. 1998, 58, [126] en.pdf (European Medicines Agency), last accessed [127] E. G. R. Fernandes, A. A. A. de Queiroz, G. A. Abraham, J. S. Roman, J. Mater. Sci. Mater. Med. 2006, 17, [128] K. Maruyama, S. Okuizumi, O. Ishida, H. Yamauchi, H. Kikuchi, M. Iwatsuru, Int. J. Pharm. 1994, 111, [129] S.-E. Stiriba, H. Kautz, H. Frey, J. Am. Chem. Soc. 2002, 124, [130] M. H. Oudshoorn, R. Rissmann, J. A. Bouwstra, W. E. Hennink, Biomaterials 2006, 27, [131] R. K. Kainthan, D. E. Brooks, Biomaterials 2007, 28, [132] C. Siegers, M. Biesalski, R. Haag, Chem. Eur. J. 2004, 10, [133] P.-Y. J. Yeh, R. K. Kainthan, Y. Zou, M. Chiao, J. N. Kizhakkedathu, Langmuir 2008, 24, [134] R. K. Kainthan, J. Janzen, E. Levin, D. V. Devine, D. E. Brooks, Biomacromolecules 2006, 7, [135] R. K. Kainthan, S. R. Hester, E. Levin, D. V. Devine, D. E. Brooks, Biomaterials 2007, 28, [136] H. Turk, R. Haag, S. Alban, Bioconjugate Chem. 2004, 15, [137] W. R. Michael, R. H. Coots, Toxicol. Appl. Pharmacol. 1971, 20, [138] H. Frey, R. Haag, Rev. Mol. Biotechnol. 2002, 90, [139] R. Haag, J.-F. Stumbe, A. Sunder, H. Frey, A. Hebel, Macromolecules 2000, 33, [140] R. D. OBrien, Fats and Oils Formulating and Processing for Applications, CRC, Boca Raton, FL, [141] R. K. Kainthan, D. E. Brooks, Bioconjugate Chem. 2008, 19, [142] D. A. Tomalia, D. P. Sheetz, J. Polym. Sci. Part A 1966, 4, [143] W. Seeliger, E. Aufderhaar, W. Diepers, R. Feinauer, R. Nehring, W. Thier, H. Hellmann, Angew. Chem. 1966, 78, ; Angew. Chem. Int. Ed. Engl. 1966, 5, [144] T. Kagiya, S. Narisawa, T. Maeda, K. Fukui, J. Polym. Sci. Part B 1966, 4, [145] T. G. Bassiri, A. Levy, M. Litt, J. Polym. Sci. Part B 1967, 5, [146] S. Kobayashi, Prog. Polym. Sci. 1990, 15, [147] F. Wiesbrock, R. Hoogenboom, M. A. M. Leenen, M. A. R. Meier, U. S. Schubert, Macromolecules 2005, 38, [148] N. Adams, U. S. Schubert, Adv. Drug Delivery Rev. 2007, 59, [149] R. Hoogenboom, Angew. Chem. 2009, 121, ; Angew. Chem. Int. Ed. 2009, 48, [150] C.-H. Wang, C.-H. Wang, G.-H. Hsiue, J. Controlled Release 2005, 108, [151] S. C. Lee, C. Kim, I. C. Kwon, H. Chung, S. Y. Jeong, J. Controlled Release 2003, 89, [152] A. Mero, G. Pasut, L. Dalla Via, M. W. M. Fijten, U. S. Schubert, R. Hoogenboom, F. M. Veronese, J. Controlled Release 2008, 125, [153] R. Konradi, B. Pidhatika, A. Muehlebach, M. Textor, Langmuir 2008, 24, [154] B. Pidhatika, J. Moeller, V. Vogel, R. Konradi, Chimia 2008, 62, [155] F. M. Veronese, A. Mero, G. Pasut, Z. Fang, T. X. Viegas, 36th Ann. Meeting & Exposition CRS [156] M. C. Woodle, C. M. Engbers, S. Zalipsky, Bioconjugate Chem. 1994, 5, [157] S. Zalpinsky, C. B. Hansen, J. M. Oaks, T. M. Allen, J. Pharm. Sci. 1996, 85, [158] F. C. Gaertner, R. Luxenhofer, B. Blechert, R. Jordan, M. Essler, J. Controlled Release 2007, 119, [159] C. Weber, C. R. Becer, R. Hoogenboom, U. S. Schubert, Macromolecules 2009, 42, [160] C. H. Wang, K.-R. Fan, G.-H. Hsiue, Biomaterials 2005, 26, [161] J. H. Jeong, S. H. Song, D. W. Lim, H. Lee, T. G. Park, J. Controlled Release 2001, 73, [162] D. Fischer, T. Bieber, Y. Li, H.-P. Elsaesser, T. Kissel, Pharm. Res. 1999, 16, [163] V. P. Torchilin, M. I. Shtilman, V. S. Trubetskoy, K. Whiteman, A. M. Milstein, Biochim. Biophys. Acta Biomembr. 1994, 1195, [164] M. Sairam, V. R. Babu, B. V. K. Naidu, T. M. Aminabhavi, Int. J. Pharm. 2006, 320, [165] D. Gao, H. Xu, M. A. Philbert, R. Kopelman, Angew. Chem. 2007, 119, ; Angew. Chem. Int. Ed. 2007, 46, [166] J. N. Patton, A. F. Palmer, Langmuir 2006, 22, [167] M. R. Hynd, J. N. Turner, W. Shain, J. Biomater. Sci. Polym. Ed. 2007, 18, Angew. Chem. Int. Ed. 2010, 49, Wiley-VCH Verlag GmbH & Co. KGaA, Weinheim
97 Reviews U. S. Schubert et al. [168] D. Saraydin, S. Uenver-Saraydin, E. Karadag, E. Koptagel, O. Gueven, Nucl. Instrum. Methods Phys. Res. Sect. B 2004, 217, [169] E. S. You, H. S. Jang, W. S. Ahn, M. I. Kang, M. G. Jun, Y. C. Kim, H. J. Chun, J. Ind. Eng. Chem. 2007, 13, [170] S. Fernandez-Cossio, M. T. Castano-Oreja, Plast. Reconstr. Surg. 2006, 117, [171] L. H. Christensen, V. B. Breiting, A. Aasted, A. Jorgensen, I. Kebuladze, Plast. Reconstr. Surg. 2003, 111, [172] H. Gin, B. Dupuyi, D. Bonnemaison-Bourignon, L. Bordenave, R. Bareille, M. J. Latapie, C. Baquey, J. H. Bezian, D. Ducassou, Biomater. Artif. Cells Artif. Organs 1990, 18, [173] T. F. Xi, C. X. Fan, X. M. Feng, Z. Y. Wan, C. R. Wang, L. L. Chou, J. Biomed. Mater. Res. Part A 2006, 78, [174] M. Stach, I. Lacik, J. D. Chorvat, M. Buback, P. Hesse, R. A. Hutchinson, L. Tang, Macromolecules 2008, 41, [175] D. Gulsen, A. Chauhan, J. Membr. Sci. 2006, 269, [176] M. S. Payne, T. A. Horbett, J. Biomed. Mater. Res. 1987, 21, [177] V. P. Torchilin, V. S. Trubetskoy, K. R. Whiteman, P. Caliceti, P. Ferruti, F. M. Veronese, J. Pharm. Sci. 1995, 84, [178] P. Caliceti, O. Schiavon, M. Morpurgo, F. M. Veronese, L. Sartor, E. Ranucci, P. Ferruti, J. Bioact. Compat. Polym. 1995, 10, [179] P. Caliceti, O. Schiavon, F. M. Veronese, Bioconjugate Chem. 2001, 12, [180] D. Le Garrec, J. Taillefer, J. E. Van Lier, V. Lenaert, J.-C. Leroux, J. Drug Targeting 2002, 10, [181] A. Benahmed, M. Ranger, J.-C. Leroux, Pharm. Res. 2001, 18, [182] L. Luo, M. Ranger, D. G. Lessard, D. Le Garrec, S. Gori, J.-C. Leroux, S. Rimmer, D. Smith, Macromolecules 2004, 37, [183] M. Moneghini, D. Voinovich, F. Princivalle, L. Magarotto, Pharm. Dev. Technol. 2000, 5, [184] C. M. A. Lopes, M. I. Felisberti, Biomaterials 2003, 24, [185] R. J. Mumper, J. G. Duguid, K. Anwer, M. K. Barron, H. Nitta, A. P. Rolland, Pharm. Res. 1996, 13, [186] W. W. L. Chin, P. W. S. Heng, P. S. P. Thong, R. Bhuvaneswari, W. Hirt, S. Kuenzel, K. C. Soo, M. Olivo, Eur. J. Pharm. Biopharm. 2008, 69, [187] M. Nicolaou, P. Chang, M. J. Newman, Polymeric gene delivery, CRC, Boca Raton, FL, [188] L. A. Shibaev, E. Y. Melenevskaya, B. M. Ginzburg, A. V. Yakimaskii, O. V. Ratnikova, A. V. Gribanov, J. Macromol. Sci. Phys. 2008, 47, [189] K. J. Hartauer, G. N. Arbuthnot, S. W. Baertschi, R. A. Johnson, W. D. Luke, N. G. Pearson, E. C. Rickard, C. A. Tingle, P. K. S. Tsang, R. E. Wiens, Pharm. Dev. Technol. 2000, 5, [190] P. Dunn, T.-T. Kuo, L.-Y. Shih, P.-N. Wang, C.-F. Sun, M. J. W. Chang, Am. J. Hematol. 1998, 57, [191] S.-I. Yusa, S. Yamago, M. Sugahara, S. Morikawa, T. Yamamoto, Y. Morishima, Macromolecules 2007, 40, [192] B. Ray, M. Kotani, S. Yamago, Macromolecules 2006, 39, [193] D. Wan, K. Satoh, M. Kamigaito, Y. Okamoto, Macromolecules 2005, 38, [194] E. Ranucci, P. Ferruti, R. Annunziata, I. Gerges, G. Spinelli, Macromol. Biosci. 2006, 6, [195] R. Duncan, Nat. Rev. Cancer 2006, 6, , and references therein. [196] P. L. Soo, M. Dunne, J. Liu, C. Allen, Nanotechnology in Drug Delivery, Springer, Berlin, [197] Z.-B. Zheng, G. Zhu, H. Tak, E. Joseph, J. L. Eiseman, D. J. Creighton, Bioconjugate Chem. 2005, 16, [198] Y. Kasuya, Z.-R. Lu, P. Kopeckova, T. Minko, S. Tabibi, J. Kopecek, J. Controlled Release 2001, 74, [199] M. P. Borgman, A. Ray, R. B. Kolhatkar, E. A. Sausville, A. M. Burger, H. Ghandehari, Pharm. Res. 2009, 26, [200] S. Kamei, J. Kopecek, Pharm. Res. 1995, 12, [201] V. Sure, T. Etrych, K. Ulbrich, T. Hirano, T. Kondo, T. Todoroki, M. Jelinkova, B. Rihova, J. Bioact. Compat. Polym. 2002, 17, [202] D. Wang, P. Kopeckova, T. Minko, V. Nanayakkara, J. Kopecek, Biomacromolecules 2000, 1, [203] Z.-R. Lu, J.-G. Shiah, S. Sakuma, P. Kopeckova, J. Kopecek, J. Controlled Release 2002, 78, [204] D. Oupicky, K. A. Howard, C. Konak, P. R. Dash, K. Ulbrich, L. W. Seymour, Bioconjugate Chem. 2000, 11, [205] L. Paasonen, B. Romberg, G. Storm, M. Yliperttula, A. Urtti, W. E. Hennink, Bioconjugate Chem. 2007, 18, [206] K. R. Whiteman, V. Subr, K. Ulbrich, V. P. Torchilin, J. Liposome Res. 2001, 11, [207] S. Woerly, S. Fort, I. Pignot-Paintrand, C. Cottet, C. Carcenac, M. Savasta, Biomacromolecules 2008, 9, [208] M. Stastny, D. Plocova, T. Etrych, M. Kovara, K. Ulbrich, B. Rihova, J. Controlled Release 2002, 81, [209] M. Save, J. V. M. Weaver, S. P. Armes, P. McKenna, Macromolecules 2002, 35, [210] C. W. Scales, Y. A. Vasilieva, A. J. Convertine, A. B. Lowe, C. L. McCormick, Biomacromolecules 2005, 6, [211] C.-Y. Hong, C.-Y. Pan, Macromolecules 2006, 39, [212] A. W. York, C. W. Scales, F. Huang, C. L. McCormick, Biomacromolecules 2007, 8, [213] K. Demirelli, M. F. Coskun, E. Kaya, M. Coskun, Polym. Degrad. Stab. 2002, 78, [214] L. Sprincl, J. Exner, O. Sterba, J. Kopecek, J. Biomed. Mater. Res. 1976, 10, [215] L. W. Seymour, R. Duncan, J. Strohalm, J. Kopecek, J. Biomed. Mater. Res. 1987, 21, [216] L. W. Seymour, Y. Miyamoto, H. Maeda, M. Brereton, J. Strohalm, K. Ulbrich, R. Duncan, Eur. J. Cancer Part A 1995, 31, [217] J.-G. Shiah, M. Dvorak, P. Kopeckova, Y. Sun, C. M. Peterson, J. Kopecek, Eur. J. Cancer 2001, 37, [218] R. Duncan, Adv. Drug Delivery Rev. 2009, 61, [219] D. P. Nowotnika, E. Cvitkovic, Adv. Drug Delivery Rev. 2009, 61, Wiley-VCH Verlag GmbH & Co. KGaA, Weinheim Angew. Chem. Int. Ed. 2010, 49,
98

99 Publication P2: Amphiphilic star-shaped block copolymers as unimolecular drug delivery systems: Investigations using a novel fungicide K. Knop, G. M. Pavlov, T. Rudolph, K. Martin, D. Pretzel, B. O. Jahn, D. H. Scharf, V. Makarov, U. Möllmann, A. A. Brakhage, F. H. Schacher, U. S. Schubert Soft Matter 2013, 9,
100
101 Soft Matter PAPER View Article Online View Journal View Issue Downloaded by Thuringer Universitats und Landesbibliothek Jana on 24 January 2013 Published on 07 November 2012 on doi: /c2sm26509e Cite this: Soft Matter, 2013, 9, 715 Received 29th June 2012 Accepted 10th October 2012 DOI: /c2sm26509e Introduction Both drug development and modern disease therapies are suffering from the fact that one-third of all newly synthesized and potentially active substances are insoluble in water leading to limited administration if any administration at all is possible. 1 In particular, in the case of cancer therapy, many agents are in general highly hydrophobic and anti-neoplastic, causing very severe side effects during therapy, such as immunosuppression, nausea, and alopecia (hair loss). But also for other cases drugs with a low therapeutic index are used, rendering the specic distribution of the administered a Laboratory of Organic and Macromolecular Chemistry (IOMC), Friedrich-Schiller-University Jena, Humboldtstrasse 10, 07743, Jena, Germany. ulrich.schubert@uni-jena.de; Web: Fax: +49 (0) ; Tel: +49 (0) b Jena Center for So Matter (JCSM), Friedrich-Schiller-University Jena, Humboldtstrasse 10, 07743, Jena, Germany c Dutch Polymer Institute (DPI), John F. Kennedylaan 2, 5612 AB Eindhoven, The Netherlands d Leibniz Institute for Natural Product Research and Infection Biology Hans Knöll Institute, Beutenbergstr. 11a, Jena, Germany e Department of Chemistry, Uppsala University, BMC Box 576, Uppsala, Sweden f Institute of Biochemistry, Russian Academy of Science, Leninsky pr., 33-2, Moscow , Russia Electronic supplementary information (ESI) available: Synthesis procedures and characterization of the star-shaped block copolymers, experimental details of the biological testing and details of the computational studies. See DOI: /c2sm26509e Amphiphilic star-shaped block copolymers as unimolecular drug delivery systems: investigations using a novel fungicide Katrin Knop, abc Georges M. Pavlov, ab Tobias Rudolph, ab Karin Martin, bd David Pretzel, ab Burkhard O. Jahn, e Daniel H. Scharf, bd Axel A. Brakhage, bd Vadim Makarov, f Ute Möllmann, d Felix H. Schacher ab and Ulrich S. Schubert* abc Amphiphilic star-shaped poly(3-caprolactone)-block-poly(oligo(ethylene glycol)methacrylate) [PCL a -b- POEGMA b ] 4 block copolymers with four arms and varying degrees of polymerization for the core (PCL) and the shell (POEGMA) were used to investigate the solution behavior in dilute aqueous solution using a variety of techniques, including fluorescence and UV/Vis spectroscopy, dynamic light scattering, analytical ultracentrifugation, and isothermal titration calorimetry. Particular emphasis has been applied to prove that the systems form unimolecular micelles for different hydrophilic/lipophilic balances of the employed materials. In vitro cytotoxicity and hemocompatibility have further been investigated to probe the suitability of these structures for in vivo applications. A novel fungicide was included into the hydrophobic core in aqueous media to test their potential as drug delivery systems. After loading, the materials have been shown to release the drug and to provoke therewith an inhibition of the growth of different fungal strains. substances within the human body desirable. Systemic fungal infections are known as frequent and important complications of modern medicine. Especially for immunocompromised patients with acquired immune deciency syndrome (AIDS) or cancer, who attended e.g. extensive chemotherapy, fungal diseases are known as a major cause of death. 2,3 Until now, the broad band fungicide amphotericin B (AmB) has been the drug of choice for sepsis with fungal strains, but is highly toxic in particular with respect to the kidneys. 4 Drug delivery systems (DDS) as a kind of packaging for drug molecules were created to overcome the abovementioned adverse issues. They ensure prolonged blood circulation times of drugs, most probably due to an apparently higher molar mass. 5 This leads to a decreased renal ltration of the drugs and to an enhanced uptake in, e.g., the cancer tissue. This can be even further promoted by the enhanced permeability and retention (EPR) effect. As a result of the EPR effect, DDS are preferentially entrapped into the neoplastic tissue and can therefore improve an effective targeting during chemotherapy. 6 8 To ensure long circulating times, DDS are usually shielded by a suitable shell, preventing recognition by the human immune system and, hence, excretion of the drug carriers. Poly(ethylene glycol) (PEG) is known to prevent unspecic interactions with the human body and is known to act as a socalled stealth polymer in DDS. 9 The diversity and versatility of modern polymer synthesis enable the introduction of PEG segments into DDS of different architectures. 10,11 This journal is ª The Royal Society of Chemistry 2013 Soft Matter, 2013, 9,
102 Soft Matter View Article Online Paper Downloaded by Thuringer Universitats und Landesbibliothek Jana on 24 January 2013 Published on 07 November 2012 on doi: /c2sm26509e The use of block copolymer micelles as DDS appears to be attractive due to several reasons: rst, an appealingly easy structural build-up using self-assembly and second, the fact that the hydrophilic segments of amphiphilic block copolymers can act as a protecting shell around the hydrophobic core, which potentially hosts encapsulated cargo. 12 However, such micellar systems can also disassemble into block copolymer unimers, especially if the concentration within the bloodstream falls below the critical micelle concentration (cmc) aer administration. 13 Although this can be inuenced to a certain extent by a rational design of the hydrophobic block, dendrimers came into focus as unimolecular micelles at even a very dilute concentration. 14,15 One drawback in this particular case is that the rather dense cores of dendritic structures offer only limited space for the encapsulation of guest molecules, besides the difficult synthesis and upscaling. 16,17 This has led to an increased interest in unimolecular starshaped block copolymers as DDS as the core in these systems is supposed to provide more space for hydrophobic molecules. In addition, the synthesis of star-shaped polymers and block copolymers is oen less tedious when compared to classical approaches used for dendrimer synthesis. 18 For these reasons, star-shaped block copolymers comprising an inner hydrophobic and an outer hydrophilic segment represent an attractive approach for the macromolecular engineering of DDS. Star-shaped block copolymers can be engineered using multifunctional initiators. Hydroxyl functionalities can be used as initiators for the ring-opening polymerization of 3-caprolactone or lactic acid as hydrophobic segments. PEG has been frequently used as a hydrophilic shell, although it has already been shown that linear PEG is not sufficient for the stabilization of unimolecular systems in water as the investigated systems still exhibited a cmc. 19,20 An exception was reported for amphiphilic starlike macromolecules, which were intensively studied by Uhrich et al. Here, no cmc could be determined, although linear PEG served as a hydrophilic shell. 21,22 Another alternative for a highly hydrophilic shell is the use of comb-like segments as demonstrated by Schramm et al. for a set of four- and six-armed [PCL-block-poly(oligo(ethylene glycol)methacrylate)] ([PCL-b-POEGMA]) block copolymers. 23,24 It is generally acknowledged that a branched or even a brushlike shell lowers the aggregation number and promotes the formation of unimolecular micelles. 25,26 Nevertheless, for a similar system with four arms and a shell formed by POEGMA (M n ¼ 300 g mol 1 for the OEGMA monomer) a cmc could be detected, indicating the formation of multimolecular micelles. 27 Consequently, the number and character of arms seem to inuence whether unimolecular micelles are formed by the star-shaped block copolymers. A unimolecular behavior is advantageous for drug delivery applications, because disassembling of the micelles, liberation followed by precipitation of the drug and therewith connected negative side effects can be avoided. Therefore, we were interested in the polymer characteristics and conditions under which unimolecularity occurs for star-shaped block copolymers with a brush-like hydrophilic shell. Here, we present the synthesis of four-arm PCL-b-poly- (oligo(ethylene glycol)methacrylate) (POEGMA) star-shaped block copolymers with the general formula [PCL a -b-poegma b ] x, where the subscripts a and b represent the degrees of polymerization of the corresponding block, and x refers to the overall number of arms. The aim was to explore under which conditions this system forms unimolecular micelles and how the inclusion capacity for hydrophobic guest substances can be optimized. We therefore synthesized a library with varying degrees of polymerization (DP) for the hydrophobic (PCL) and the hydrophilic block (POEGMA). Our main focus was to elucidate the minimum POEGMA length that is necessary to obtain stable unimolecular micelles in aqueous systems and to dene an optimum hydrophilic/hydrophobic balance. Furthermore, we present the rst results on the biocompatibility of PCL-b- POEGMA and on the encapsulation of a novel fungicide. The inclusion capacity was studied as well as the antifungal activity against the fungal strains Sporobolomyces salmonicolor 549, Candida albicans BMSY212 and Penicillium notatum JP36 in comparison to the free drug. Experimental part Materials Tin(II) 2-ethylhexanoate (Aldrich), a-bromoisobutyryl bromide (Aldrich), anisole (Fluka, 99.0%), copper(i) bromide (Aldrich, %), trioxane (Aldrich), fat brown RR (Aldrich), nile red (Aldrich), and pyrene (Alfa Aesar) were used as received. 3-Caprolactone (Aldrich) was dried for 2 days over CaH 2 before distillation and stored under argon. Triethylamine was distilled over CaH 2 and stored under argon. Pentaerythritol (Aldrich) was co-evaporated with toluene prior to use. Tetrahydrofuran (THF, Aldrich) was dried in a solvent purication system (Pure Solv EN, Innovative Technology) before use. Oligo(ethylene glycol) methyl ether methacrylate M n ¼ 475 g mol 1 (Aldrich, OEGMA 475) and N,N,N 0,N 00,N 00 -pentamethyldiethylenetriamine (Aldrich, PMDETA) were passed through an aluminum oxide bed containing 5% CaH 2 prior to use. Acetone of spectroscopic purity grade for analytical ultracentrifuge purposes was obtained from Sigma Aldrich showing the following characteristics (at 20 C): dynamic viscosity h 0 ¼ mpa s, density r 0 ¼ g cm 3. Instrumentation 1 H and 13 C nuclear magnetic resonance (NMR) spectra were recorded in CDCl 3 on a Bruker AC 250 or a 300 MHz spectrometer at 298 K. Chemical shis are given in parts per million (ppm, d scale) relative to the residual signal of the deuterated solvent. Size exclusion chromatography (SEC) was performed on a Shimadzu system equipped with a SCL-10A system controller, a LC-10AD pump, a RID-10A refractive index detector, and both a PSS Gram30 and a PSS Gram1000 column in series, whereby N,N-dimethylacetamide with 5 mmol of LiCl was used as an eluent at a ow rate of 1 ml min 1 and the column oven was set to 60 C. The system was calibrated with PMMA (410 to 716 Soft Matter, 2013, 9, This journal is ª The Royal Society of Chemistry 2013
103 Paper View Article Online Soft Matter Downloaded by Thuringer Universitats und Landesbibliothek Jana on 24 January 2013 Published on 07 November 2012 on doi: /c2sm26509e g mol 1 ) and PEG (440 to g mol 1 ) standards. Furthermore, the kinetics of the polymerization was studied using a Shimadzu system equipped with a SCL-10A system controller, a LC-10AD pump, and a RID-10A refractive index detector using a solvent mixture containing chloroform, triethylamine, and iso-propyl alcohol (94 : 4 : 2) at a ow rate of 1 ml min 1 on a PSS-SDV-linear M 5 mm column. The system was calibrated with PMMA (410 to g mol 1 ) and PEG (440 to g mol 1 ) standards. Matrix-assisted laser desorption/ionization time of ight (MALDI-TOF) mass spectra were recorded on an Ultraex III TOF/TOF (Bruker Daltonics, Bremen, Germany), equipped with a Nd:YAG laser and with trans-2-[3-(4-tert-butylphenyl)-2-methyl- 2-propenylidene] malononitrile (DCTB) as a matrix and lithium chloride as an ionizing agent in reector and linear modes. The instrument was calibrated prior to each measurement with an external PMMA standard from PSS Polymer Standards Services GmbH (Mainz, Germany). Dynamic light scattering (DLS) measurements were performed on ALV DLS/SLS equipment consisting of an ALV Laser CGS3 Goniometer with an ALV Avalanche correlator and a He Ne laser (l ¼ nm) at 298 K. The aqueous polymer solutions as well as the THF solutions with concentrations of 1 mg ml 1 were ltered twice (GF 1 2 mm or PTFE 0.45 mm) and measured at an angle of 150. The hydrodynamic radius (R h ) was determined using the CONTIN algorithm. Angle-dependent measurements were performed in the same manner in the range of 30 to 150 in 10 steps. Sedimentation velocity experiments were performed using a Beckman XLI analytical ultracentrifuge (ProteomeLab XLI Protein Characterization System) at a rotor speed of rpm and at 20 C, using interference optics and Al double-sector cells of an optical path of 12 mm. Viscosity measurements were conducted using an AMVn viscometer (Anton Paar, Graz, Austria), with a capillary ball combination as the measuring system. Density measurements were carried out in a DMA 02 density meter (Anton Paar, Graz, Austria) according to the procedure of Kratky et al. 28 The sedimentation velocity data analysis was performed with the continuous particle size distribution c(s) of Sedt, where s is the velocity sedimentation coefficient. 29,30 The program Sedt numerically solves the Lamm equation, the basic differential equation describing the coupled sedimentation and diffusion process. 31 In the c(s) method, this is done for a large number of globular species with different sedimentation and diffusion coefficients. The result is a continuous sedimentation coefficient distribution, which represents the best combination of species for matching the entire collected set of experimental concentration proles. The numerical analysis is conducted under appropriate statistical criteria of goodness-of-t. The frictional ratio value (f/f sph ), which is the weight-average frictional ratio of all species, was optimized executing a t command, where f represents the frictional coefficient of the solute macromolecule and f sph the frictional coefficient of a rigid sphere with the same anhydrous volume (free of solvent) as the macromolecule. The Tikhonov Philips 2 nd derivative regularization method was used with a condence level of 0.7 to 0.9 (corresponding F-ratio). The partial specic volume (y), the solvent density (r 0 ), and the solvent dynamic viscosity (h 0 ) are additional parameters required to calculate the sedimentation coefficient distributions. Finally, the differential distribution (dc(s)/ds) of the sample is obtained and marked as c(s), scaled such that the area under the c(s) curve will give the loading concentration of the macromolecules between the minimum and maximum s-values occurring (expressed, in the case of interference optics, in the number of fringes, J). In addition, the determination of the sedimentation coefficient distribution g*(s) by least-squares boundary modeling (ls g*(s)) was used. The values of s obtained by these two soware are in good correlation with the accuracy of Svedberg. During the sedimentation experiments, three concentrations of each sample in acetone were studied in the concentration range, which allows a reliable extrapolation to zero concentration in the linear approximation in accordance with the relationship s 1 ¼ s 0 1 (1 + k s c +.) and an estimation of both values s 0 and the concentration coefficient k s. The relative viscosities h r ¼ t/s 0 of the solutions were calculated from the respective time of the fall of the steel ball in a viscous medium of the solvent and polymer solutions, s 0 and t at 20 C. The relative viscosities h r ranged from 2.0 to The extrapolation to zero concentration was made by using both the Huggins and the Kraemer equations, and the average values were considered as the value of the intrinsic viscosity. The z potential measurements were performed using a Zetasizer Nano ZS (Malvern instruments, Malvern, UK). The solutions were prepared with 1 mg ml 1 polymer in deionized water and passed through 1 2 mm glass frit lters prior to measurement. Atomic absorption spectroscopy was performed on a nova400 (Analytik Jena, Jena, Germany) instrument. A calibration of ve different concentrations of a standard provided by SCP Science (France) was done (R 2 > 0.999). UV-vis absorption measurements were performed on an Analytik Jena SPECORD 250 (Analytik Jena, Jena, Germany) at 298 K. Fluorescence emission as well as excitation spectroscopy were measured on a Jasco FP-6500 spectrometer at 298 K. For the photometric absorbance measurement, a TECAN Innite M200 PRO plate reader (TECAN, Crailsheim, Germany) was used to measure the absorption of samples from (a) the XTT cytotoxicity assay (570 nm with a background correction of the optical density (OD) at 690 nm), (b) the hemolysis of erythrocytes (540 nm with a background correction of the OD at 690 nm), and (c) the photometric evaluation of erythrocyte aggregation (645 nm). Each well containing the sample was measured at four different spots each with 10 ashes per scan. To visualize the viability of the L929 cells aer incubation with different polymers, the blue/red/green uorescence signal of cells cultured in a 96 well plate and stained with Hoechst 33342/ uorescein diacetate (FDA)/propidium iodide (PI) was observed on a uorescence microscope (Cell Observer Z1, Carl Zeiss, Jena, Germany) equipped with a mercury arc UV lamp and the appropriate lter combinations for excitation and detection of emission. Images of a series were captured with a 10 objective using identical instrument settings (e.g. UV lamp power, This journal is ª The Royal Society of Chemistry 2013 Soft Matter, 2013, 9,
 and spots of the 96 well plate were addressed using an automated XY table.")
104 Soft Matter View Article Online Paper Downloaded by Thuringer Universitats und Landesbibliothek Jana on 24 January 2013 Published on 07 November 2012 on doi: /c2sm26509e integration time, and camera gain) and spots of the 96 well plate were addressed using an automated XY table. The isothermal titration calorimetry (ITC) measurements were performed with a VP-ITC microcalorimeter from MicroCal (Northhampton, MA). Reference cell as well as the sample cell, both lled with a volume of 1.6 ml, were enclosed in an adiabatic jacket. The samples were injected stepwise into the working cell with a syringe of total volume of 288 ml under constant stirring at a stirring rate of 310 rpm. The measurements were performed at a constant temperature of 25 C. Small aliquots of the sample (6 ml) were successively injected into the water of the working cell. The data treatment was performed as follows: rstly, the baseline was subtracted from the data and secondly each peak was integrated providing the heat per injection. The energy minimization and the dynamics simulations were performed with the TINKER 6 (J.W. Ponder, freely available at molecular-modelling package. 32 All atoms were modelled explicitly by the use of the MM force eld proposed by Allinger et al. 33 Parameterizations as given in the ESI were used for nonexistent parameters in the original set. Moreover, the MM force eld was adopted without further modications. The geometry of the energy minimization calculation was obtained by a quasi- Newton nonlinear optimization routine. The molecular dynamics trajectory was carried out via a modied Beeman algorithm in combination with the analytical continuum solvation (ACE) method 34 for water over 100 ps based on a previous run without solvation. For all calculations the default parameters and threshold values of TINKER were used. Results and discussion Synthesis The star-shaped block copolymers were synthesized as described previously. 23 Briey, the core-rst method was applied to build-up different PCL cores (13 23 repeating units of 3-caprolactone per arm), whose hydroxyl end groups were subsequently esteried with a-bromoisobutyryl bromide. The bromine end groups were then used as initiators for the atom transfer radical polymerization (ATRP) of OEGMA to form the hydrophilic outer shell. For the three different cores no inuence of the PCL block length on the polymerization rate was observed. Fig. 1 (a) Hydrodynamic diameters of different [PCL a -b-poegma b ] 4 star-shaped block copolymers in THF (red columns) and water (blue columns). (b) Hydrophilic/ lipophilic balance values calculated for the star-shaped block copolymers. The materials were puried by ltration over an aluminum oxide column to remove any copper, which is of importance for the application in the biomedical eld. AAS measurements of the nal polymers revealed copper concentrations below 40 ppm. The extinction values are even below the lowest standard of 0.1 mg L 1 copper of the calibration (Table S4 ). Subsequently, the star-shaped block copolymers were Table 1 Polymer Characteristics of star-shaped [PCL a -b-poegma b ] 4 block copolymers Theoretical DP POEGMA Conversion in SEC a [%] DP POEGMA M n [g mol 1 ] calculated b M n [g mol 1 ] measured c PDI [PCL 18 -b-poegma 12 ] [PCL 18 -b-poegma 20 ] [PCL 18 -b-poegma 25 ] [PCL 18 -b-poegma 51 ] [PCL 23 -b-poegma 25 ] [PCL 13 -b-poegma 26 ] a Obtained from SEC (CHCl 3 :iproh:net 3 ) using PEG calibration. b Calculated from the conversion. c Obtained from SEC (DMAc:LiCl) using PMMA calibration. 718 Soft Matter, 2013, 9, This journal is ª The Royal Society of Chemistry 2013
105 Paper View Article Online Soft Matter Downloaded by Thuringer Universitats und Landesbibliothek Jana on 24 January 2013 Published on 07 November 2012 on doi: /c2sm26509e completely separated from the OEGMA macromonomers by a preparative size exclusion column and freeze-dried (Table 1) (synthesis details are given in the ESI ). Solution behavior First, the size and the shape of unimolecular [PCL-b-POEGMA] 4 star-shaped block copolymers were investigated in non-selective solvents, e.g. THF and acetone. For this purpose, DLS and analytical ultracentrifugation (AUC) measurements were carried out and compared to molecular calculations. DLS measurements were performed at the concentration of 1mgmL 1 and provided similar results both in THF and in acetone. The results from THF are depicted in Fig. 1a and show a good correlation between increasing length of the POEGMA block and the diameter of the star-shaped block copolymer unimers. The [PCL 18 Br] 4 macroinitiator shows a diameter of 6.8 nm. The size increases up to 14.6 nm for [PCL 18 -b- Fig. 2 (a) Normalized distributions of the intrinsic velocity sedimentation coefficients [s] obtained in acetone and in water for [PCL 18 -b-poegma 25 ] 4 at a concentration of c ¼ 0.5 mg ml 1. (b) Final geometries of the gas phase energy minimization and dynamics calculation of [PCL 18 POEGMA 12 ] 4 depicted as a calotte model based on van der Waals radii. Carbon atoms are represented in grey and oxygen atoms in red. Hydrogen atoms are omitted. Table 2 Hydrodynamic characteristics and molar masses of the initiator [PCL 18 Br] 4 and [PCL 18 POEGMA ] 4 in acetone Polymer [h] [cm 3 g 1 ] s 0 M sf [10 13 s] (f/f sph ) 0 [g mol 1 ] M n [g mol 1 ] [PCL 18 Br] a [PCL 18 -b-poegma 12 ] b [PCL 18 -b-poegma 20 ] b [PCL 18 -b-poegma 25 ] b [PCL 18 -b-poegma 51 ] b a Calculated from 1 H NMR. b Calculated from the conversion. POEGMA 51 ] 4 with the longest POEGMA block. In the same way, the diameters of the amphiphilic star-shaped block copolymers increase with higher molar masses of the PCL block while the length of the POEGMA segment was constant. To obtain further information about the shape of the systems investigated, both [PCL 18 -b-poegma 25 ] 4 and [PCL 18 -b- POEGMA 51 ] 4 have been used in angle-dependent light scattering measurements. Due to rather low scattering intensities, the interpretation of the results was not unambiguous (Fig. S4 ). Therefore, further experiments were performed using AUC for a series of star-shaped block copolymers with a PCL core of constant DP and an increasing length of the POEGMA segments. This method allowed an estimation of the molar mass of the macromolecules using the hydrodynamic values s 0 (Fig. 2a), the frictional ratio (f/f sph ) 0, and the partial specic volume y obtained from the modied Svedberg relation: M sd ¼ (RT/(1 yr 0 )(s 0 /D 0 ) ¼ M sf ¼ 9p2 1/2 N A ([s](f/f sph ) 0 ) 3/2 y 1/2, where D 0 is the translation diffusion coefficient, [s] h s 0 h 0 /(1 yr 0 ) is the intrinsic sedimentation coefficient, y is the partial specic volume of the solute macromolecules, R is the gas constant, T is the temperature in K, and N A is Avogadro number. The values of the molar mass calculated on the basis of the AUC measurements (M sf ) show a good correlation with the M n values obtained through 1 H-NMR experiments and the conversion (Table 2). Thevaluesfortheintrinsicviscosity[h] and the frictional ratio (f/f sph ) 0 are in the same region for all investigated [PCL 18 -b- POEGMA ] 4 block copolymers. At the same time the velocity sedimentation coefficient s 0 varies by almost 6 times. This behavior of the hydrodynamic values is characteristic of globular species. As the values of both intrinsic viscosity and frictional ratio aresuperiortothoseobservedforglobularproteins([h] protein z 4.5, (f/f sph ) protein z 1.25) the hydrodynamic behavior of the starshaped block copolymers can be described as a spheroid with constant asymmetry. The degree of asymmetry of the spheroid is estimated from the intrinsic viscosity data calculating the Simha factor n h [h]/y and the frictional ratio (Perrin factor), 31 which are determined as ([h]/y) av ¼ and (f/f sph ) av ¼ , respectively. Based on these values, an estimation of the asymmetry of the ellipsoids (p) generally is possible. Therefore, for prolate ellipsoids p was determined to be 9.3 (viscosity) and 11.2 (translation friction). For oblate ellipsoids, p was calculated to be This journal is ª The Royal Society of Chemistry 2013 Soft Matter, 2013, 9,
106 Soft Matter View Article Online Paper Downloaded by Thuringer Universitats und Landesbibliothek Jana on 24 January 2013 Published on 07 November 2012 on doi: /c2sm26509e 16.2 (viscosity) and 14.0 (translation friction). On this basis, average values for prolate ellipsoids p av ¼ 10 1andforoblate ellipsoids p av ¼ 15 1 are obtained. However, a nal decision whether the investigated star-shaped block copolymers represent prolate or oblate ellipsoids by using only hydrodynamic data is not possible. These ndings are in accordance with the results obtained by molecular mechanics and dynamics simulations performed for [PCL 18 -b-poegma 12 ] 4. Energy minimization of the geometry in the gas phase shows a stretched PCL core carrying dense POEGMA brushes at the end of each arm. By applying a molecular dynamics calculation based on the energetically optimized structure the folding of the PCL arms and, therefore, a strong shrinking of the core is observed. [PCL 18 -b-poegma 12 ] 4 does not adopt a spherical structure, but rather a kidney-shaped morphology as depicted in Fig. 2b. Two arms collapse separately, while the two others merge, leading to an elongated shape of the molecule. This structure shows a length of around 7.6 nm and a width of 2.4 nm to 4.2 nm, which is in good accordance with the values observed in DLS and AUC experiments. Self-assembly in aqueous media The solution behavior of the star-shaped block copolymers in water is of crucial importance for their use as DDS. Different samples were dialyzed from a 1 mg ml 1 DMF solution against distilled water. In Fig. 1a, the resulting diameters determined by DLS are depicted (striped bars). For the [PCL 18 -b-poegma 12 ] 4, micelles with a hydrodynamic diameter of 20 nm were obtained and similar values were found for samples with a POEGMA shell of up to 51 units. Number-averaged DLS CONTIN plots show diameters of roughly 20 nm. Investigations in non-selective solvents revealed diameters of 6 to 12 nm, depending on the length of the POEGMA segments. The diameters observed in water with 20 nm are somewhat larger. For this discrepancy, two possible explanations can be given: (1) the inclusion of water into the POEGMA shell increases the observed diameter or (2) multimolecular micelles are formed. More detailed information on this question can be obtained by the investigation of the [PCL a -b-poegma b ] 4 star-shaped block polymers in water using AUC. The study of the velocity sedimentation of the aqueous solution of [PCL 18 -b-poegma 25 ] 4 shows that predominantly intermolecular clusters of unimolecular micelles are formed. Fig. 2a depicts a comparison of the intrinsic velocity sedimentation coefficient distributions for [PCL 18 -b-poegma 25 ] 4 in acetone and water. The value [s] h s 0 h 0 /(1 yr 0 ) ¼ M/N A P 0 hr 2 i 1/2 is independent of the employed solvent, with P 0 being the Flory hydrodynamic parameter and hr 2 i the mean square of the radius of gyration for the moving macromolecule in solution. The distribution of [s] in aqueous solution shows a main central part and two lateral shoulders. The low s-shoulder may be attributed to unimolecular micelles (14%), the main part corresponds to 62%, and the high s- shoulder contains 24% of the material. Therefore, AUC investigations clearly show the presence of larger aggregates. Although the brush-like shell should prevent aggregation 25,26 and promote the formation of unimolecular micelles, AUC measurements revealed the formation of larger agglomerates of micelles. Further investigations should provide information on the nature of these aggregates. Possible aggregation models are illustrated in Fig. 3: (a) the star-shaped block copolymers behave like a conventional micellar systems (like in the case of linear block copolymers), where multimolecular micelles are formed and the aggregation number is mainly determined by the block length ratio of hydrophilic and hydrophobic segments, (b) the POEGMA shells entangle, forming a kind of supermicelle 35,36 and (c) a system with unimolecular micelles exists at low concentrations, which aggregates at higher values into multimolecular micelles. Fig. 3 Schematic representation of possible aggregation models for star-shaped [PCL a -b-poegma b ] 4 block copolymers. Fig. 4 Intensity of the fluorescence emission of nile red at 620 nm with increasing polymer concentration of [PCL 18 -b-poegma 12 ] 4, [PCL 18 -b- POEGMA 20 ] 4, [PCL 18 -b-poegma 25 ] 4 and [PCL 18 -b-poegma 51 ] 4 as well as an expanded view of the low concentration regime (inset). 720 Soft Matter, 2013, 9, This journal is ª The Royal Society of Chemistry 2013
107 Paper View Article Online Soft Matter Downloaded by Thuringer Universitats und Landesbibliothek Jana on 24 January 2013 Published on 07 November 2012 on doi: /c2sm26509e To elucidate the presence of unimolecular micelles, pyrene was used as a uorescent probe The results obtained for the star-shaped block copolymers [PCL 18 -b-poegma ] 4, depicted in Fig. S5, show changes in the vibrational ne structure (i.e. reected in the change of the ratio of band I to band III) as an indication for a change in the microenvironment of the pyrene, 40 although this must not necessarily correspond to a cmc. The slope can be explained by exceeding the loading capacity of the star-shaped block copolymer (Fig. S8 ). As investigations with pyrene did not allow a nal conclusion, additional experiments were performed with nile red as a uorescent probe: only if hydrophobic cores are present, uorescence intensity will be detected (Fig. 4). Similar to the preparation of the solutions for the cmc determinations using pyrene, samples were prepared with a constant dye content but varying polymer concentrations. Fig. 4 shows the uorescence emission of nile red at 620 nm, which is increasing evenly although polymer concentrations down to mm have been used. The inset demonstrates that at very low concentrations no sudden change in the uorescence intensity can be observed and the intensity is monotonically increasing with increasing polymer concentration. This behavior is an indication of the presence of hydrophobic cores in the whole concentration range, thus conrming the existence of unimolecular micelles even for the smallest hydrophilic shell, [PCL 18 -b-poegma 12 ] 4. Fig. 5 (a) Experimental titration curve obtained for [PCL 18 -b-poegma 12 ] 4 titrated from a 50 mg ml 1 solution into water (baseline corrected). (b) Enthalpograms obtained for the titration of 10 and 50 mg ml 1 solutions of [PCL 18 -b- POEGMA 12 ] 4 and [PCL 18 -b-poegma 51 ] 4. However, no linear slope is observed as expected for an ideal system. This can be attributed to the entanglement of the POEGMA arms, which is more pronounced at higher concentrations. A penetration of the arms into the core can be conceived by leaving less space for the nile red and prevents the fast and complete inclusion of the appropriate number of molecules as observed earlier by Yang et al. 41 Moreover, the authors observed that by further increasing the PEG chain the inclusion capability for pyrene decreases as longer arms hinder molecule diffusion into the core domains. This observation can be conrmed by our ndings with nile red, which are particularly visible in the inset of Fig. 4b. [PCL 18 -b-poegma 20 ] 4 and [PCL 18 -b-poegma 25 ] 4 seem to represent an optimum region of the PCL:POEGMA ratio in terms of nile red inclusion efficiency. In contrast, the POEGMA shell of [PCL 18 -b-poegma 51 ] 4 appears to prevent an efficient inclusion of guest molecules. To conrm the results obtained by spectroscopic methods a complementary approach was used to exclude the presence of multimolecular micelles. Isothermal titration calorimetry (ITC) is an established method to determine the cmc for surfactants and block copolymers. 42 Moreover, the micellization enthalpy together with the free energy of micellization can be calculated. 43,44 For surfactant systems, sigmoidal curves are usually obtained, similar to experiments with pyrene as a uorescence probe, where the cmc can be deduced from the iniction point of the curve. As initial concentrations, 10 mg ml 1 (the maximum concentration used for the cmc determination) and 50 mg ml 1 were chosen. In Fig. 5a, the titration curve is illustrated for [PCL 18 -b-poegma 12 ] 4 with an initial concentration of 50 mg ml 1. For [PCL 18 -b-poegma 12 ] 4 and [PCL 18 -b- POEGMA 51 ] 4 similar results were observed, showing an exothermic incidence for each injection of the sample solution. Kubowicz et al. obtained similar results but used the declining trajectory to determine the cmc as the authors did not observe a sigmoidal shape for the investigated systems. 45 They assumed that the lowest heat value corresponds to the lower linearly extrapolated curve usually used in combination with the upper linearly extrapolated curve to determine the cmc. By measuring two different concentrations for the four different polymers [PCL 18 -b-poegma 12 ] 4, [PCL 18 -b-poegma 20 ] 4, [PCL 18 - b-poegma 25 ] 4 and [PCL 18 -b-poegma 51 ] 4, it was shown that this approach is not appropriate in the case of star-shaped systems. Due to the fact that both curves of the same material show a declining trajectory, hinting towards demicellization enthalpies, these results cannot be attributed to a cmc (Fig. 5b). Rather, the gain of entropy is detected as exothermic amplitude upon dilution of the sample solution. As during the measurement the concentration is increasing, the dilution effect becomes less pronounced. However, it should be noted that the interpretation of these data might be challenging because the dissolution of micelles is probably not a one-step process. Nevertheless the absence of a cmc is assumed, although a stepwise dissolution process should be kept in mind for the system investigated here. 45 With this background the results obtained by DLS and AUC can be explained in a reasonable manner. In water, the formation of aggregates is observed leading to an increased This journal is ª The Royal Society of Chemistry 2013 Soft Matter, 2013, 9,
108 Soft Matter View Article Online Paper Downloaded by Thuringer Universitats und Landesbibliothek Jana on 24 January 2013 Published on 07 November 2012 on doi: /c2sm26509e hydrodynamic diameter. Although the brush-like POEGMA shells of the star-shaped block copolymers should prevent agglomeration, the formation of a loose network of unimolecular micelles is proposed by entanglement of the POEGMA arms of different molecules. As by spectroscopic methods the absence of multimolecular micelles was conrmed, these starshaped block copolymers can be employed for drug delivery purpose. Concentration dependent DLS measurements showed an increase of the count rate with increasing concentration. No sudden transition is observed leading to the conclusion that the transition to supermicelles is not a spontaneous process at a certain threshold concentration but might rather be connected to an equilibrium between unimolecular micelles and larger aggregates. These results are somewhat surprising as for drug delivery usually polymers are chosen with large hydrophilic blocks to ensure their solubility in water. To evaluate the proportion of hydrophilic to hydrophobic blocks the concept of the hydrophilic/lipophilic balance (HLB) was introduced. Here, both blocks are compared, the hydrophilic part by its molar mass and the hydrophobic block by its content of methylene groups. The ratio delivers a value, which is recommended to be above 0.9 for conventional micelles. In Fig. 1b, the HLB values calculated according to Uhrich et al., 46 for all star-shaped block copolymers described here are depicted. In our case, only [PCL 18 -b-poegma 51 ] 4 and [PCL 13 -b-poegma 26 ] 4 meet these requirements. [PCL 18 -b-poegma 12 ] 4 even shows a HLB value below 0.8 but still unimolecular micelles seem to be formed. We tentatively assume that this concept might not be applicable for the star-shaped system presented here. In comparison, [PCL a -b- POEGMA b ] 4 star-shaped block copolymers previously introduced by Schramm et al. 23,24 showed HLB values around Within this study, it could be clearly demonstrated that even smaller hydrophilic shells of POEGMA are sufficient to stabilize unimolecular micelles. Encapsulation of guest molecules To evaluate the uptake and inclusion capacity of the star-shaped block copolymers, fat brown RR and nile red were chosen as model dyes. Different methods for the encapsulation of hydrophobic molecules into amphiphilic polymers have been previously reported; one approach, amongst others, was to apply ultrasound to enhance and to accelerate the uptake of the solid guest molecules by the micellar cores. 23,47 However, ultrasound may damage sensitive drugs; therefore, this method is not useful for DDS. To facilitate the uptake, the use of a co-solvent was found to be benecial, which is removed either by evaporation or dialysis. 48,49 To identify the best suited preparation conditions for the system, different formulation methods have been tested (Fig. 6a). Therefore, [PCL 18 -b-poegma 25 ] 4 was used and the concentration was adjusted to 1 mg ml 1 (corresponding to mm) for each method. The concentration of the dye was varied from 0.09 mm to 1.4 mm. Dialysis was found to be very unsuitable as rather low loadings were obtained. For ultrasound-assisted inclusion, a maximum around 25 nile red molecules per polymer was observed, whereas dropping of an acetone solution containing both dye and polymer into water yielded up to 45 nile red molecules per unimolecular micelle. As the best results were obtained with the dropping approach, this method was used for further investigations with different star-shaped block copolymers. To expand the selection of encapsulated molecules, fat brown RR was utilized, as both dyes are expected to have different hydrophobicity, which will also inuence the encapsulation efficiency. Fig. 6b represents the results obtained for [PCL 18 -b-poegma ] 4. Surprisingly, no trend with increasing size of the POEGMA shell was observed. The results reect rather the ndings of the cmc determination with nile red. [PCL 18 -b-poegma 25 ] 4 seems to represent an optimum shell to core ratio with an inclusion capacity of around 20 molecules fat brown RR per macromolecule observed from the inclusion saturation ratio. Star-shaped block copolymers with shorter POEGMA shells include less fat brown RR molecules per unimolecular micelle (ca. 10). On the other hand, also [PCL 18 -b- POEGMA 51 ] 4 exhibited the same inclusion capacity, attributed to the shielding effect of the bulky shell. The core size, in contrast, has only a minor inuence on the inclusion capacity for this system. For the smallest core [PCL 13 -Br] 4, a decreased inclusion maximum of around 10 dye molecules was found when compared to 20 units for a DP of 18 and 23 of PCL (Fig. S6 ). To improve the inclusion capacity most probably a more drastic change of the arm length has to be chosen. Fig. 6 (a) Absorption intensity of nile red at 525 nm measured for different molar ratios of dye to polymer [PCL 18 -b-poegma 25 ] 4 (1 mg ml 1 ) in dependence of the preparation method. (b) Absorption intensity of fat brown RR at 460 nm for different molar ratios of dye to polymer for [PCL 18 -b-poegma ] 4 polymers. Evaluation of in vitro biocompatibility To elucidate the applicability of the star-shaped block copolymers for medical use, an assessment of their biocompatibility 722 Soft Matter, 2013, 9, This journal is ª The Royal Society of Chemistry 2013
 Photometric determination of the hemolytic activity after incubation with different star-shaped block copolymer concentrations for 1 h at 37 C.")
109 View Article Online Paper Soft Matter Downloaded by Thuringer Universitats und Landesbibliothek Jana on 24 January 2013 Published on 07 November 2012 on doi: /c2sm26509e Fig. 7 (a) Photometric determination of the hemolytic activity after incubation with different star-shaped block copolymer concentrations for 1 h at 37 C. Triton X-100 (1%) served as a positive control and PBS as a negative control. Data are presented as the mean percentage SD of hemolytic activity compared to the positive control set as 100%. (b) Photometric determination of the erythrocyte aggregation after 2 h incubation at 37 C with polymers. 25 kda bpei (50 mg ml 1 ) served as a positive control and PBS as a negative control. Data are presented as the mean measured absorbance SD. in terms of hemocompatibility and possible cytotoxic side effects was performed. Most oen, DDS are developed for intravenous administration as they either do not survive in the gastric acid or are not absorbed in the gastrointestinal tract. The interactions of the polymers with erythrocytes as major blood components and one of the rst cellular contact partners aer systemic administration were investigated regarding red blood cell hemolysis and aggregation. The hemolytic activity of cationic charged polymers, e.g. poly(ethylene imine) 600 Da to 1 kda, poly(l-lysine) 36.6 kda and also generation dependent poly(amido amine) above G3, is well documented. 50,51 But also uncharged macromolecules of high molar mass, like dextran 60 kda, poly(vinyl pyrrolidone) 360 kda and PEG 20 kda, have been shown to induce red blood cell aggregation. 52 The release of hemoglobin was used to quantify the erythrocyte membrane damaging effect of three different concentrations (5, 25, 50 mg ml 1 ) of the star-shaped block copolymers (Fig. 7a). The treatment of red blood cells with PBS buffer as a negative control and 1% Triton X-100 solution as a positive control Fig. 8 (a) Cell viability of L929 mouse fibroblasts after incubation with starshaped block copolymers up to 10 mg ml 1 for 24 hours. The cell viability was determined by a XTT assay according to ISO Data are expressed as mean SD of six determinations. (b) Representative fluorescence microscopy micrographs of Hoechst 33342/FDA/PI stained L929 mouse fibroblast cells cultured for 24 hours in the presence of 10 mg ml 1 of [PCL 18 -b-poegma 25 ] 4 for 24 hours. (1) Blue fluorescent Hoechst dye labels nuclei of all cells present; (2) green fluorescent FDA dye indicates cytoplasm of vital cells; (3) red fluorescent PI signals tag nuclei of dead cells; (4) overlay of Hoechst dye fluorescence and green fluorescence of the FDA dye. resulted in 0% and 100% hemolysis, respectively. As a hemolysis value of less than 2% of the total release is classied as non-hemolytic, no hemolytic effects up to concentrations of 100 mg ml 1 were found, indicating the absence of any membrane destabilizing property of the polymers. We furthermore investigated whether the [PCL a -b-poeg- MA b ] 4 star-shaped block copolymers would induce the aggregation of erythrocytes, which would represent a sign of blood incompatibility. Aer incubation with different concentrations (5, 25, 50 mg ml 1 ) of the materials, the formation of aggregates was studied by both microscopy and photometry. Visual inspection (Fig. S8 ) as well as absorption measurements (Fig. 7b) showed that none of the star-shaped block copolymers led to cluster formation below a concentration of 25 mg ml 1. The treatment with 25 kda branched PEI (bpei) at 25 mg ml 1 served as a positive control causing the clear formation of aggregates, whereas PBS treated samples used as a negative control did not lead to any aggregate formation. The in vitro cytotoxicity experiments were performed via a XTT assay using L929 mouse broblasts, according to the German standard institution guideline DIN ISO as a reference for biomaterial testing. Aer 24 h of incubation with different polymer concentrations (0.1, 1.0 and 10 mg ml 1 )of the [PCL b-poegma 25 ] 4 and [PCL 18 -b-poegma ] 4 starshaped block copolymers, the metabolic activity of cells treated with test-samples was found to be on the level of untreated controls, which proves the non-toxic effect of the polymers even This journal is ª The Royal Society of Chemistry 2013 Soft Matter, 2013, 9,
 Absorption intensity of the fungicide (structure given in inset) at 345 nm at constant concentrations of [PCL 18 -b-poegma 25 ] 4 and increasing drug concentration.")
110 Soft Matter View Article Online Paper Downloaded by Thuringer Universitats und Landesbibliothek Jana on 24 January 2013 Published on 07 November 2012 on doi: /c2sm26509e Fig. 9 (a) Absorption intensity of the fungicide (structure given in inset) at 345 nm at constant concentrations of [PCL 18 -b-poegma 25 ] 4 and increasing drug concentration. (b) Inhibition zones of the different fungicide polymer preparations obtained with Sporobolomyces salmonicolor 549. at the highest concentration used here (Fig. 8a and S9 ). A detailed live/dead microscopy study of polymer treated cells conrmed their membrane integrity (exclusion of red uorescent PI from cell nuclei) and their excellent viability (strong green uorescence of FDA in cytoplasm) (Fig. 8b). The zeta potential for the [PCL a -b-poegma b ] 4 star-shaped block copolymers shows values of about 10 mv. The lowest value with 2 mv was obtained in the case of [PCL 18 -b-poegma 51 ] 4. These values are in the typical range for long-circulating PEG protected DDS. 53,54 However, the low values imply also the disadvantage of minor electrostatic repulsion leading to the observed aggregation of the unimolecular micelles. Heading e.g. drug loading and biological activity, those results do conrm that [PCL a -b-poegma b ] 4 star-shaped block copolymers might represent an interesting system for drug delivery issues. In a second step a fungicide was loaded into the starshaped block copolymers. The development of new fungicides and delivery devices represents a very important step in improving the therapy of systemic fungal infections as frequent and important complications, especially of immunocompromised patients with acquired immune deciency syndrome (AIDS) or cancer, who attended e.g. extensive chemotherapy. 2,3 The hydrophobic drug with newly discovered promising antifungal activity (structure in Fig. 9a) was encapsulated into the polymer [PCL 18 -b-poegma 25 ] 4 as this polymer has shown the most promising inclusion capacities in previous studies (Fig. 9a). 55 For the dropping method a constant polymer concentration and a growing fungicide concentration were chosen, showing a steady increase of the absorbance with the exception of a step at the drug to polymer ratio of 20, corresponding to the previously determined inclusion limit. A further increase of the absorbance is observed up to a ratio of 80 drug molecules per polymer molecule suggesting that the drug is not only included into the core but also within the hydrophilic shell. Zeta potential measurements are supporting this assumption as the values of the zeta potential are decreasing for the polymer to drug ratios 5, 10 and 20 from 10 mv down to 40 mv. From this ratio the zeta potential remains in the range of 40 mv for the fungicide to polymer ratios 40 to 80. Similar results were obtained regarding the fungicide activity. Fig. 9b depicts the inhibition zones for the experiments performed with Sporobolomyces salmonicolor 549. Further experiments carried out with Candida albicans BMSY212 and Penicillium notatum JP36 yielded comparable values (results not shown). For fungicide to polymer ratios of 5 to 20, the encapsulated fungicide shows the same antifungal activity as the free drug, which is applied in the same concentration as used for the drug polymer preparation in a mixture of dimethylsulfoxide, methanol and water to ensure solubility of the hydrophobic drug. The dissolution of the fungicide in pure water, as a comparative experiment, was not successful, no UV signal could be observed and also no inhibition zones in the fungicide test were obtained with the supernatant as well as the suspension of the drug. For higher ratios of drug to polymer, the free fungicide showed an increased activity, whereas the inhibition zone provoked by the encapsulated drug was observed to lie in the same range as for a ratio of 20. In accordance with the results obtained earlier for the inclusion study and the zeta potential measurements, an inclusion of the fungicide into the POEGMA shell is supposed. This might lead upon administration to the fungal medium to the loss of the shell bound fungicide molecules by precipitation. Only dissolved or in the hydrophobic cavity included fungicide is effective and, hence, the ratio of drug to polymer of 20 resembles the optimum dose for this system. However, the star-shaped polymer is able to solubilize hydrophobic drug molecules in water without the help of a cosolvent and, more importantly, to release them. Conclusion 4-Arm [PCL a -b-poegma b ] 4 star-shaped block copolymers with varying degrees of polymerization for both PCL and POEGMA have been prepared and exhaustively characterized using mass spectrometry, SEC, DLS, AUC and computational methods. We could show that a spheroidal geometry is adopted in nonselective solvents. 724 Soft Matter, 2013, 9, This journal is ª The Royal Society of Chemistry 2013
111 Paper View Article Online Soft Matter Downloaded by Thuringer Universitats und Landesbibliothek Jana on 24 January 2013 Published on 07 November 2012 on doi: /c2sm26509e In water as a selective solvent, both unimolecular micelles with a PCL core and a POEGMA shell as well as loose aggregates of several connected star-shaped block copolymer unimers were found. This was conrmed using AUC measurements and, in addition, with nile red as a uorescence probe, leading to the conclusion that for all [PCL-b-POEGMA] 4 samples unimolecular hydrophobic cores are present. Furthermore, ITC measurements showed that these amphiphilic systems do not exhibit a cmc. These ndings demonstrate that unimolecular micelles can be formed by star-shaped amphiphilic block copolymers also below the typically expected values for the hydrophilic/ lipophilic balance. Inclusion studies using fat brown RR as well as nile red showed an optimum length of 20 to 25 OEGMA units within the hydrophilic shell for a core DP of 18 repeating units. To elucidate the applicability of these materials as DDS biological investigations regarding hemolytic activity, erythrocyte aggregation, and the cytotoxicity against L929 mouse broblast cells were carried out. None of the polymers showed cytotoxic or hemolytic activity. As a rst application, a novel fungicide was encapsulated into the PCL core of [PCL 18 -b-poegma 25 ] 4, which was chosen because it exhibited the best inclusion capacity in our model studies with fat brown RR. It is assumed that the drug was not only entrapped in the core but also further taken up by the POEGMA shell as well. However, the antifungal activity of the encapsulated drug increased only up to a ratio of 20 drug molecules per polymer. Acknowledgements We thank Sandra Köhn for the atom absorption measurements and Carolin Fritzsche as well as Christiane Weigel for biological tests. Michael Wagner and Dr Stephanie Schubert are acknowledged for discussions. We thank the Thuringian Ministry for Education, Science and Culture (TMBWK, grant #B , NanoConSens and TMBWK, grant #B , ChaPoNano) for nancial support. Notes and references 1 C. A. Lipinski, J. Pharmacol. Toxicol., 2000, 44, G. Medoff, J. Brajtburg, G. S. Kobayashi and J. Bolard, Annu. Rev. Pharmacol. Toxicol., 1983, 23, M. H. Koldin and G. Medoff, Pediatr. Clin. North Am., 1983, 30, B. G. Yu, T. Okano, K. Kataoka and G. Kwon, J. Controlled Release, 1998, 53, R. Duncan, Nat. Rev. Drug Discovery, 2003, 2, Y. Matsumura and H. Maeda, Cancer Res., 1986, 46, H. Maeda, J. Wu, T. Sawa, Y. Matsumura and K. Hori, J. Controlled Release, 2000, 65, Y. Matsumura and K. Kataoka, Cancer Sci., 2009, 100, K. Knop, R. Hoogenboom, D. Fischer and U. S. Schubert, Angew. Chem., Int. Ed., 2010, 49, N. Hadjichristidis, M. Pitsikalis, S. Pispas and H. Iatrou, Chem. Rev., 2001, 101, S. M. Grayson and J. M. J. Frechet, Chem. Rev., 2001, 101, J. F. Gohy, Adv. Polym. Sci., 2005, 190, R. Savic, T. Azzam, A. Eisenberg and D. Maysinger, Langmuir, 2006, 22, G. R. Newkome, C. N. Mooreeld, G. R. Baker, A. L. Johnson and R. K. Behera, Angew. Chem., Int. Ed., 1991, 30, S. Kim, Y. Shi, J. Y. Kim, K. Park and J.-X. Cheng, Expert Opin. Drug Delivery, 2010, 7, H. Liu, Y. Chen, D. Zhu, Z. Shen and S.-E. Stiriba, React. Funct. Polym., 2007, 67, C. Kojima, K. Kono, K. Maruyama and T. Takagishi, Bioconjugate Chem., 2000, 11, J. Khandare, M. Calderón, N. M. Dagia and R. Haag, Chem. Soc. Rev., 2012, 41, M. Deng, X. Chen, L. Piao, X. Zhang, Z. Dai and X. Jing, J. Polym. Sci., Part A: Polym. Chem., 2004, 42, M. R. Nabid, S. J. Tabatabaei Rezaei, R. Sedghi, H. Niknejad, A. A. Entezami, H. A. Oskooie and M. M. Heravi, Polymer, 2011, 52, H. B. Liu, S. Farrell and K. Uhrich, J. Controlled Release, 2000, 68, A. M. Harmon and K. E. Uhrich, J. Bioact. Compat. Polym., 2009, 24, O. G. Schramm, G. M. Pavlov, H. P. van Erp, M. A. R. Meier, R. Hoogenboom and U. S. Schubert, Macromolecules, 2009, 42, O. G. Schramm, M. A. R. Meier, R. Hoogenboom, H. P. van Erp, J. F. Gohy and U. S. Schubert, So Matter, 2009, 5, J. Yun, R. Faust, S. L. Szilagyi, S. Keki and M. Zsuga, Macromolecules, 2003, 36, M. Zamurovic, S. Christodoulou, A. Vazaios, E. Iatrou, M. Pitsikalis and N. Hadjichristidis, Macromolecules, 2007, 40, T. Ren, A. Wang, W. Yuan, L. Li and Y. Feng, J. Polym. Sci., Part A: Polym. Chem., 2011, 49, O. Kratky, H. Leopold and H. Stabinger, Methods Enzymol., 1973, 27, P. Schuck, Biophys. J., 2000, 78, last accessed 04 April C. R. Cantor and P. Schimmel, Biophysical Chemistry, Freeman, San Francisco, J. W. Ponder and F. M. Richards, J. Comput. Chem., 1987, 8, N. L. Allinger, Y. H. Yuh and J. H. Lii, J. Am. Chem. Soc., 1989, 111, M. Schaefer and M. Karplus, J. Phys. Chem., 1996, 100, M. R. Radowski, A. Shukla, H. von Berlepsch, C. Bottcher, G. Pickaert, H. Rehage and R. Haag, Angew. Chem., Int. Ed., 2007, 46, H. Y. Hong, Y. Y. Mai, Y. F. Zhou, D. Y. Yan and J. Cui, Macromol. Rapid Commun., 2007, 28, This journal is ª The Royal Society of Chemistry 2013 Soft Matter, 2013, 9,
112 Soft Matter View Article Online Paper Downloaded by Thuringer Universitats und Landesbibliothek Jana on 24 January 2013 Published on 07 November 2012 on doi: /c2sm26509e 37 K. Kalyanasundaram and J. K. Thomas, J. Am. Chem. Soc., 1977, 99, M. Wilhelm, C. L. Zhao, Y. C. Wang, R. L. Xu, M. A. Winnik, J. L. Mura, G. Riess and M. D. Croucher, Macromolecules, 1991, 24, G. Kwon, M. Naito, M. Yokoyama, T. Okano, Y. Sakurai and K. Kataoka, Langmuir, 1993, 9, A. Hashidzume, M. Mizusaki, K. Yoda and Y. Morishima, Langmuir, 1999, 15, H. Yang, J. J. Morris and S. T. Lopina, J. Coll. Int. Sci., 2004, 273, Y. Kadam, K. Singh, D. G. Marangoni, J. H. Ma, V. K. Aswal and P. Bahadur, Colloids Surf., A, 2010, 369, R. De Lisi, S. Milioto and N. Muratore, Macromolecules, 2002, 35, P. Taboada, V. Mosquera, D. Attwood, Z. Yang and C. Booth, Phys. Chem. Chem. Phys., 2003, 5, S. Kubowicz, A. F. Thunemann, R. Weberskirch and H. Möhwald, Langmuir, 2005, 21, H. B. Liu, A. Jiang, J. A. Guo and K. E. Uhrich, J. Polym. Sci., Part A: Polym. Chem., 1999, 37, C. J. Hawker, K. L. Wooley and J. M. J. Frechet, J. Chem. Soc., Perkin Trans. 1, 1993, H. M. Aliabadi, S. Elhasi, A. Mahmud, R. Gulamhusein, P. Mahdipoor and A. Lavasanifar, Int. J. Pharm., 2007, 329, H. Cabral, M. Nakanishi, M. Kumagai, W. D. Jang, N. Nishiyama and K. Kataoka, Pharm. Res., 2009, 26, D. Fischer, Y. X. Li, B. Ahlemeyer, J. Krieglstein and T. Kissel, Biomaterials, 2003, 24, N. Malik, R. Wiwattanapatapee, R. Klopsch, K. Lorenz, H. Frey, J. W. Weener, E. W. Meijer, W. Paulus and R. Duncan, J. Controlled Release, 2000, 68, J. K. Armstrong, R. B. Wenby, H. J. Meiselman and T. C. Fisher, Biophys. J., 2004, 87, K. Kataoka, A. Harada and Y. Nagasaki, Adv. Drug Delivery Rev., 2001, 47, R. Gref, M. Luck, P. Quellec, M. Marchand, E. Dellacherie, S. Harnisch, T. Blunk and R. H. Müller, Colloids Surf., B, 2000, 18, V. G. Pesin and A. M. Chalezkii, J. Org. Chem., 1961, 32, Soft Matter, 2013, 9, This journal is ª The Royal Society of Chemistry 2013

113 Publication P3: Star-shaped drug carriers for doxorubicin with POEGMA and POEtOxMA brush-like shells: A structural, physical and biological comparison K. Knop, D. Pretzel, A. Urbanek, T. Rudolph, D. H. Scharf, A. Schallon, M. Wagner, S. Schubert, M. Kiehntopf, A. A. Brakhage, F. H. Schacher, U. S. Schubert Biomacromolecules, 2013, submitted.
114
115 Star-shaped drug carriers for doxorubicin with POEGMA and POEtOxMA brush-like shells: A structural, physical and biological comparison 4 Department of Pharmaceutical Technology, Institute of Pharmacy, Friedrich-Schiller- University Jena, Otto-Schott-Strasse 41, Jena, Germany 5 Institute for Clinical Chemistry and Laboratory Diagnostics,,
116
117
118
119
120 Scheme 1. Schematic representation of the synthetic route to four-arm star block copolymers with different hydrophilic shells.
121
122
![[PCL 18 -b-poeg 19 MA] 4 [PCL 18 -b-poetoxma] 4 polymers [PCL 18 -b- POEtOx 4 MA] 4 and [PCL 18 -b-poetox 9 MA] 4 than the length of the OEtOx side chain itself.](/docs-images/79/78844049/images/123-0.jpg "In contrast, the size of the unimers formed by [PCL 18 -b-poeg 19 MA] 4 is slightly elevated [PCL 18 -b-poetox 9 MA] 4 although both systems should have")
123 [PCL 18 -b-poeg 19 MA] 4 [PCL 18 -b-poetoxma] 4 polymers [PCL 18 -b- POEtOx 4 MA] 4 and [PCL 18 -b-poetox 9 MA] 4 than the length of the OEtOx side chain itself. In contrast, the size of the unimers formed by [PCL 18 -b-poeg 19 MA] 4 is slightly elevated [PCL 18 -b-poetox 9 MA] 4 although both systems should have comparable.
124 [PCL 18 -b-poeg 19 MA] 4 [PCL 18 -b- POEtOxMA] 4 based materials, respectively. [PCL 18 -b-poeg 19 MA] 4, where the shell occupied the largest volume and causes more steric hindrance
125 [PCL 18 -b-poetox 4 MA] 4 polymers with a starting concentration of [PCL 18 -b-poetox 4 MA 15 ] 4, the material with the shortest outer block. These conclusions were further confirmed by isothermal titration calorimetry (ITC) and the results obtained for different [PCL 18 -b-poetox 4 MA] 4 star block copolymers are shown in Figure 5. In all cases, exothermic reactions after each injection of polymer solutions with concentrations of 50 mg ml -1 into water can be observed. No sigmoidal shape of the curve, as expected for surfactants, was found. Comparable results were obtained for lower concentrations (10 mg ml -1 ) of the materials. For each polymer at two different concentrations, declining trajectories are observed that would result in two different demicellization enthalpies and cmcs. The exothermic effect was, therefore, attributed to a dilution rather than a disaggregation of aggregates. Nevertheless, the interpretation of the thermodynamic data might be hampered by slow demicellization or the occurrence of multi-step processes. However, from the combined results obtained, the absence of a cmc for all nine star block copolymers can be concluded, whereas the DLS results hint towards the formation of aggregates in water, presumably due to entanglement of the hydrophilic shells.
![Zeta potentials of [PCL 18 -b-poeg 19 MA] 4, [PCL 18 -b-poetox 4 MA] 4 and [PCL 18 -b- POEtOx 9 MA] 4 polymers [PCL 18 -b-poetox 4 MA] 4 polymers zeta potential values around 12 mv and the [PCL 18](/docs-images/79/78844049/images/126-0.jpg "-b- POEtOx 9 MA] 4 polymers [PCL 18 -b-poeg 19 MA] 4 [PCL 18 -b- POEtOx 9 MA] 4, POEtOx 4 MA and POEtOx 9 MA based polymers, respectively, the values are decreasing with increasing arm-length of the")
126 Zeta potentials of [PCL 18 -b-poeg 19 MA] 4, [PCL 18 -b-poetox 4 MA] 4 and [PCL 18 -b- POEtOx 9 MA] 4 polymers [PCL 18 -b-poetox 4 MA] 4 polymers zeta potential values around 12 mv and the [PCL 18 -b- POEtOx 9 MA] 4 polymers [PCL 18 -b-poeg 19 MA] 4 [PCL 18 -b- POEtOx 9 MA] 4, POEtOx 4 MA and POEtOx 9 MA based polymers, respectively, the values are decreasing with increasing arm-length of the brush-like shell. Therefore, the formation of supermicelles, caused by the entanglement of the shells, might be explained by the decreasing zeta potential provoking a diminished electrostatic repulsion.
127 [PCL 18 -b-poeg 19 MA 45 ] 4, [PCL 18 -b-poetox 4 MA 44 ] 4 and [PCL 18 -b-poetox 9 MA 51 ] 4 were submitted to a detailed blood compatibility analysis as these polymers possess the highest ratio of hydrophilic comb polymer and will be later used for encapsulation studies
128
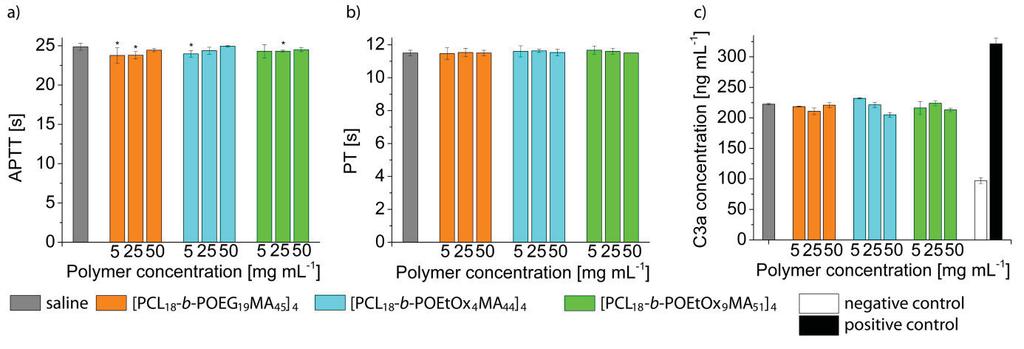
129
130 FACS) analysis of p latelet activation CD62p/CD42 co-expression after
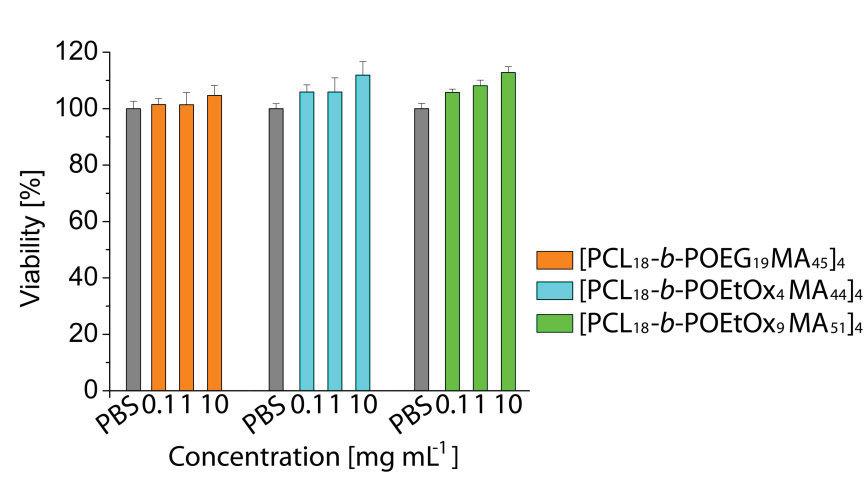
131
132
, h) and l) showing the cytoplasm stained with")
133 cell nuclei stained with Hoechst d), h) and l) showing the cytoplasm stained with CellTracker Orange CMRA.
134
135 complement system was detected. A cytotoxicity assay against L929 mouse fibroblasts showed no short-term cytotoxicity after 24 h incubation with the polymer. These results prove that amphiphilic polymers covered by a POEtOxMA shell can be regarded as alternative shell material in comparison to POEGMA. The clinically relevant anti-cancer drug doxorubicin was encapsulated into the unimolecular micelles, and their cytostatic effects were evaluated in a comparative study with the L929 and HEK 293 immortalized cell line and the cancer cell lines MCF-7 and MDA-MB 231. For both, the star-shaped block copolymer formulated doxorubicin and Caelyx an enhanced IC 50 value in comparison to free doxorubicin was determined. As all three micellar formulation showed similar IC 50 values, corresponding cellular uptake and release mechanisms can be assumed for both the shell types, the POEGMA and the POEtOxMA shell.
136 Future research will focus on the improvement of the encapsulation efficiency to decrease the dose of polymer given during an
137
138
139
140
141 Supporting information Star-shaped drug carriers for doxorubicin with POEGMA and POEtOxMA brush-like shells: A structural, physical and biological comparison 4 Department of Pharmaceutical Technology, Institute of Pharmacy, Friedrich-Schiller-University Jena, Otto-Schott-Strasse 41, Jena, Germany 5 Institute for Clinical Chemistry and Laboratory Diagnostics,,
142
143
144
145
146
147
148
149
150
151
152 in acetone[pcl 18 -b-poeg 9 MA] 4 and [PCL 18 -b- POEG 19 MA] 4 polymers as well as (b) the [PCL 18 -b-poetox 4 MA] 4 and [PCL 18 -b-poetox 9 MA] 4 polymers. Data of the [PCL 18 -b-poeg 9 MA] 4 polymers taken from a previous publication. 3 [PCL 18 -b-poeg 19 MA 45 ] 4, [PCL 18 -b-poetox 4 MA 44 ] 4 and [PCL 18 -b-poetox 9 MA 51 ] 4 polymers in water. [PCL 18 -b-poeg 19 MA] 4, polymers, (b) the [PCL 18 -b-poetox 4 MA] 4 polymers and (c) the [PCL 18 -b-poetox 9 MA] 4 polymers.
153 [PCL 18 -b- POEG 19 MA] 4 polymers, an identical cmc in the range of mg ml -1 was detected with this method. A cmc below mg ml -1 is determined for the [PCL 18 -b-poetox 4 MA] 4 polymers by the band I to band III ratio method. The cmc of the [PCL 18 -b-poetox 9 MA] 4 polymers is even more difficult to identify. Apparently, the cmc is only influenced by the chemical characteristics of the hydrophilic shell and not by its length or hydrophilic strength, which is in contradiction to previous reports of classical micelles formed by amphiphilic block copolymers. 46
154 Viscosity measurements were conducted at 20 C using an AMVn (Anton Paar, Graz, Austria) rolling ball viscometer with a manually filled capillary of 0.9 mm internal diameter. The viscosities of the solution, (50 /70 /85 ) of the capillary. After x-repetitive measurements, the dynamic viscosity was then calculated by following relationship: = b s b s are the densities of the ball and the sample respectively, t is the rolling time. The density of the solutions was measured by a densitometer (DMA 4100, Anton Paar, Graz, Austria). Figure S12. Photometric determination of the hemolytic activity after incubation with different polymer concentrations for 1 h at 37 C of star-shaped block copolymers with (a) small shell size and (b) medium shell size. Triton X-100 (1%) served as positive and PBS as negative control.
155 Figure S13. with star-shaped block copolymers with (a) small shell size and (b) medium shell size

156 Figure S14.

157 FACS analysis of p latelet activation CD62p/CD42 co-expression after Complement activation Figure S16.
 supplemented with 10% FCS, 100 U ml -1 penicillin and 100 μg ml -1 streptomycin (all components from Biochrom,")
158 For the cytotoxicity experiments, the mouse fibroblast cell line L929 was purchased from the German Collection of Microorganisms and Cell Cultures (DSMZ, Braunschweig, Germany). The cells were routinely cultured as follows: Dulbecco's modied eagle's medium (DMEM) supplemented with 10% FCS, 100 U ml -1 penicillin and 100 μg ml -1 streptomycin (all components from Biochrom, Berlin, Germany) at 37 C in a humidified atmosphere with 5% (v/v) CO 2. The shortterm cytotoxicity was determined with a XTT assay following the ISO/EN part 5 protocol: L929 cells were seeded in 96-well plates at a density of cells/well and were grown as monolayer cultures for 24 h. The cells were then incubated separately with different polymer concentrations (0.01, 0.1, 1.00 and μg ml -1 (n = 6)) for 24 h. Control cells were incubated with fresh culture medium. After incubation, 50 μl of a XTT added to each well. After 4 h at 37 C, 100 μl of each solution were transferred to a new microtiter, plate and the optical density (OD) was measured photometrically. The negative control was standardized as 0% of metabolism inhibition and referred as 100% viability. Figure S17: with (a) small shell size and (b) medium shell size Figure S18: Absorption intensity of fat brown RR at 460 nm for different molar ratios of dye to polymer for (a) the [PCL 18 -b-poeg 19 MA] 4, (b) the [PCL 18 -b-poetox 4 MA] 4 polymers and (c) the [PCL 18 -b-poetox 9 MA] 4 polymers.
159 Figure S19: (a) Absorption intensity of doxorubicin at 481 nm for different molar ratios of drug to polymer. (b) different molar ratios of drug to polymer For the cytotoxicity experiments, the mouse fibroblast cell line L929, the human breast adenocarcinoma cell lines MCF-7 and MDA-MB 231 as well as the human embryonic kidney (HEK) 293 cell line were purchased from the German Collection of Microorganisms and Cell Cultures (DSMZ, Braunschweig, Germany). The cells were routinely cultured as follows: Dulbecco's modied eagle's medium (DMEM; for L929 cells), or Minimum essential medium (MEM; for MCF-7 cells) supplemented with 10% FCS, 100 U ml -1 penicillin and 100 μg ml -1 streptomycin (all components from Biochrom, Berlin, Germany) at 37 C in a humidified atmosphere with 5% (v/v) CO 2. Cells were seeded in 96-well plates (at a density of cells per well for L929 and MDA-MB-231, and at a density of cells per well for MCF-7) and were grown as monolayer cultures for 24 h. The cells were then incubated separately with different concentrations of doxorubicin (0.01, 0.1, 1.00 and μg ml -1 (n = 6)) for 24 h, 3 d and 6 d. After 3 d medium was removed and replaced by fresh medium containing doxorubicin. Control cells were incubated with culture medium. After each incubation time, 50 μl of a XTT instructions were added to each well. After 4 h at 37 C, 100 μl of each solution were transferred to a new microtiter, plate and the optical density (OD) was measured photometrically at 450 nm. The negative control was standardized as 0% of metabolism inhibition and referred to as 100% viability.
160 Microscopic observation on cellular uptake of doxorubicin and encapsulated doxorubicin. The cellular uptake and distribution of doxorubicin and encapsulated doxorubicin was evaluated using fluorescent microscopy (FM) and confocal laser scanning microscopy (CLSM). For the microscopic imaging, mouse fibroblast cell line L929, human MCF-7 and MDA-MB 231 breast cancer cell line were grown in 8-well Chamber Slide system (Thermo Scientific; Langenselbold, Germany) for 24 h and then incubated with doxorubicin, Caelyx and in a concentration of μg ml -1 (n = 3) for another 24 h. Control cells were incubated with fresh culture medium. For FM, cell nuclei were then stained with Hoechst (1 μg ml -1 ) and cells were analysed immediately using a fluorescence microscope (Cell Observer Z1, Carl Zeiss, Jena, Germany) equipped with a mercury arc UV lamp and the appropriate filter combinations for excitation and detection of emission of Hoechst and doxorubicin. All images were captured with a 10 objective using identical instrument settings (e.g. UV lamp power, integration time, and camera gain) and spots were addressed using an automated XY table.
161 For CLSM, cytoplasma of the adherent cells was labeled using 10 μm CellTracker Orange CMRA (Life Technologies, Darmstadt, Germany) according to manufacture instructions and in the next step, cells were fixed for 10 min using PBS with 4% paraformaldehyde. For embedding fixed cells, Moviol 4-88 solution containing 625 μg 1,4-diazabicyclo-(2,2,2)octane (Roth, Karlsruhe, Germany) was used. Fluorescence images were obtained with confocal laser-scanning microscopes (LSM 510 Meta, Zeiss, Jena, Germany), using a Epiplan Neofluar 20 objective (NA 0.5 Zeiss). The 488 nm laser line was used for excitation of doxorubicin and emission was collected between 560 and 615 nm. The 543 nm line excited the CellTracker Orange CMRA and the emitted fluorescence was collected with a nm bandpass filter. Images were captured in multitrack mode enabling single excitation and emission of fluorescence. To allow a comparison, all images of a series were captured under identical conditions and instrument settings (laser power, pinhole diameter and detector gain).
162

163 Publication P4: Systematic MALDI-TOF CID investigation on different substituted mpeg 2000 K. Knop, B. O. Jahn, M. D. Hager, A. C. Crecelius, M. Gottschaldt, U. S. Schubert Macromol. Chem. Phys. 2010, 211,
164
165 Full Paper Systematic MALDI-TOF CID Investigation on Different Substituted mpeg 2000 a Katrin Knop, Burkhard O. Jahn, Martin D. Hager, Anna Crecelius, Michael Gottschaldt, Ulrich S. Schubert* Methoxy poly(ethylene glycol) 2000 (mpeg 2000) samples were substituted via esterification reactions to convert the hydroxyl end group of the mpeg into potential initiators for the cationic ring opening polymerization of 2-oxazolines. These substitution products were investigated by matrix-assisted laser desorption/ionization time-of-flight mass spectrometry (MALDI-TOF MS); in addition, detailed MALDI-TOF/TOF-collision induced dissociation (CID) MS studies were performed to introduce this method as complementary structural characterization tool allowing the detailed analysis of the prepared macromolecules. The CID of the macroinitiators revealed 1,4-hydrogen and 1,4-ethylene eliminations forming very regular fragmentation patterns which showed, depending on the end groups, different fragmentation series. Furthermore, very pronounced McLafferty þ 1 rearrangements (1,5 hydrogen-transfer) of the introduced ester end groups were observed leaving the mpeg molecule as neutral acid. This incisive loss revealed the exact molar mass for each end group and, therefore, represents an important tool for end group determination of functionalized polymers. Introduction K. Knop, B. O. Jahn, M. D. Hager, A. Crecelius, M. Gottschaldt, U. S. Schubert Laboratory of Organic and Macromolecular Chemistry, Friedrich- Schiller-University Jena, Humboldtstr. 10, Jena, Germany Fax ; ulrich.schubert@uni-jena.de K. Knop, M. D. Hager, A. Crecelius, M. Gottschaldt, U. S. Schubert Dutch Polymer Institute (DPI), John F. Kennedylaan 2, 5612 AB Eindhoven, The Netherlands U. S. Schubert Laboratory of Macromolecular Chemistry and Nanoscience, Eindhoven University of Technology, Den Dolech 2, 5600 MB Eindhoven, The Netherlands a : Supporting information for this article is available at the bottom of the article s abstract page, which can be accessed from the journal s homepage at or from the author. In the emerging field of drug delivery, block copolymers are widely used for designing vectors with sufficient in vivo stability and delivery efficiency. [1] These biological applications of polymers require a very solid and profound characterization of the used materials beyond NMR spectroscopic methods and size exclusion chromatography (SEC). In the last few years mass spectrometry (MS) arose to a very versatile technique to acquire detailed information of the polymer structure and, in particular, of the end group nature. In former times MS analysis of polymers has been a difficult task being limited to the analysis of low molar mass compounds. [2] This changed dramatically when Karas and Hillenkamp developed in the 1980s the matrix-assisted laser desorption ionization (MALDI) process and improved Macromol. Chem. Phys. 2010, 211, ß 2010 WILEY-VCH Verlag GmbH & Co. KGaA, Weinheim DOI: /macp
166 K. Knop, B. O. Jahn, M. D. Hager, A. Crecelius, M. Gottschaldt, U. S. Schubert therewith by far the analytical possibilities in polymer chemistry. [3 5] Since then, a large variety of synthetic polymers has been investigated by MALDI-MS methods, such as polystyrene (PS) and poly(methyl methacrylate) (PMMA). Also poly(ethylene glycol) (PEG) is very well investigated by MALDI-MS techniques as it provides an easily ionizable structure. [6,7] To gain deeper insight into the polymer composition, tandem MS methods have been developed and applied to different synthetic polymers like PMMA, PS or poly(ethylene terephthalate) (PET). [8,9] These new techniques have also been used for the fragmentation of different PEG samples. Methoxy poly- (ethylene glycol) (mpeg) and dimethoxy poly(ethylene glycol) (2mPEG) of m/z 500 ionized with lithium have been fragmented in a fast-atom bombardment (FAB)-collision induced dissociation (CID)-quadrupole instrument. The authors presented the different stability of proton and sodium ion adducts and the following consequences for high and low energy collision processes as well as the fragmentation mechanisms. [10,11] Equally, PEG 1000 was investigated by sustained-offresonance-induction (SORI)-CID-Fourier transform (FT)-MS measurements and fragments with very high mass resolution were obtained and could be assigned. [12] Different mono- and disubstituted PEGs in the range of m/z 500 were investigated by the group of Williams et al. by using desorption electrospray ionization (DESI). [13] The MALDI process was also used to obtain ions for post source decay (PSD). Already in 1994 a mechanism for the fragmentation of PEG was proposed by Selby et al. who investigated cyclic polyethers. [14] These 1,4-hydrogen- or 1,4-ethylene elimination mechanisms (Scheme 1) were confirmed by Jackson et al. who observed through fragmentation of PEG additional distonic radical cations, which were formed by homolytic bond cleavage. [15] Kowalski et al. successfully performed MALDI-PSD analysis of linear and branched PEG 600 and 1500 and established thereby a method to differentiate between various polymer architectures. [4,16] Hoteling et al. fragmented with the aid of a MALDI-CID cell, unsubstituted PEG 1000 confirming therewith the fragmentations of PEG, which were already observed earlier by Lattimer and coworkers. [17] In order to expand the tool box of block copolymers prepared for biological applications, PEG can be used as macroinitiator for the polymerization of 2-oxazolines. This polymerization can be performed via a microwave assisted cationic ring opening polymerization (CROP) and requires, as the name suggests, a cationic initiator. [18] For this purpose mpeg was converted to a macroinitiator via an esterification reaction of the end groups. [19] These macroinitiators were used for detailed mass spectrometrical and tandem MS investigations to gain insight into the structure Scheme 1. Schematic representation of the observed fragment series resulting from (a) 1,4-hydrogen elimination mechanism and (b) 1,4 ethylene-elimination mechanism of mpeg. and to facilitate later the interpretation of the fragmentation behavior of block copolymers, which is still a challenging task. In this study we performed the synthesis and the fragmentation of substituted mpeg samples (esterified) by MALDI-TOF-MS/MS to obtain detailed information on the molecular structure and the decomposition mechanism of the polymerization precursors. We obtained for the first time a detailed MALDI-TOF CID analysis of the fragmentation of substituted mpeg samples with higher molar masses. Experimental Part Materials mpeg 2000 was purchased from Fluka, triethylamine, 4-(bromomethyl) benzoyl bromide, 4-(chloromethyl) benzoyl chloride and 4-toluenesulfonyl chloride were purchased from Aldrich and used as received unless otherwise stated. Triethylamine was stored over potassium hydroxide and distilled from calcium hydride prior to use. mpeg 2000 was coevaporated with dry toluene (distillation from sodium/benzophenone) before usage and highest available purity grade dichloromethane was purchased from Fluka. The substitution reaction was carried out according to the reported procedure [20] and the products were characterized by 1 HNMR spectroscopy, SEC, and MALDI-TOF MS. a-methoxy-v-4-(chloromethyl) benzoic acid ester-poly(ethylene glycol) 2 000: 1 H NMR (250 MHz, CDCl 3 ): d(ppm) ¼ 7.99 (d, 2H), 7.40 (d, 2H), 4.55 (s, 2H), 4.40 (t, 2H), 3.76 (t, 2H), (m, 171H), 3.31 (s, 3H) (Figure S1 of Supporting Information). 678 Macromol. Chem. Phys. 2010, 211, ß 2010 WILEY-VCH Verlag GmbH & Co. KGaA, Weinheim DOI: /macp
167 Systematic MALDI-TOF CID Investigation on... SEC: M n ¼ g mol 1, M w ¼ g mol 1, PDI ¼ 1.1. a-methoxy-v-4-(bromomethyl) benzoic acid ester-poly(ethylene glycol) 2 000: 1 H NMR (250 MHz, CDCl 3 ):d(ppm) ¼ 8.01(d, 2H), 7.44 (d, 2H), (m, 4H), 3.81 (t, 2H), (m, 186H), 3.36 (s, 3H) (Figure S2 of Supporting Information). SEC: M n ¼ g mol 1, M w ¼ g mol 1, PDI ¼ 1.1. a-methoxy-v-4-toluenesulfonyl-poly(ethylene glycol) 2 000: 1 H NMR (250 MHz, CDCl 3 ): d(ppm) ¼ 7.77 (d, 2H), 7.32 (d, 2H), 4.13 (t, 2H), (m, 176H), 3.35 (s, 3H) (Figure S3 of Supporting Information). SEC: M n ¼ g mol 1, M w ¼ g mol 1, PDI ¼ 1.1. For MALDI-TOF MS and MS/MS measurements the matrix material, trans-2-[3-(4-tert-butylphenyl)-2-methyl-2-propen-ylidene] malononitrile (DCTB) and sodium chloride (NaCl) were obtained from Sigma Aldrich. Lithium chloride (LiCl) and sodium bromide (NaBr) were obtained from Acros Organics. Tetrahydrofuran (THF) of HPLC grade was purchased from Roth and used as received. Biobeads 1 S-X3 were obtained from BioRad (Hercules, CA, USA) and prepared in THF according to the supplier s instructions. Instrumentation NMR experiments were performed with a Bruker AC 250. Chemical shifts are reported as d values relative to TMS, defined as d ¼ 0.00 ppm ( 1 H NMR). Size exclusion chromatography (SEC) was performed on a Shimadzu system equipped with a SCL-10A system controller, a LC- 10AD pump and a RID-10A refractive index detector using a solvent mixture containing chloroform, triethylamine and iso-propanol (94:4:2) at a flow rate of 1 ml min 1 on a PSS-SDV-linear M 5 mm column at room temperature. The system was calibrated with PEG standards purchased by PSS Standard. An Ultraflex III TOF/TOF (Bruker Daltonics, Bremen, Germany) was used for the MALDI-TOF-MS and MS/MS analysis. The instrument was equipped with a Nd:YAG laser and a collision cell. All spectra were measured in the positive reflector mode. For the MS/MS mode, argon was used as the collision gas at a pressure of mbar. The FWHM was calculated to lay in a range between for the lower region of the mass spectrum and for the higher m/z region of the spectra. The instrument was calibrated prior to each measurement with an external standard PMMA from PSS Polymer Standards Services GmbH (Mainz, Germany). MS and MS/MS data were processed using PolyTools 1.0 (Bruker Daltonics) and Data Explorer 4.0 (Applied Biosystems). Sample Preparation For the sample preparation, 1 ml of substituted mpeg (10 mg ml 1 ) in THF, 10 ml of DCTB (10 mg ml 1 ) in THF and 5 ml of lithium chloride, sodium chloride or sodium bromide dissolved in THF at a concentration of 100 mg ml 1 were mixed and the dried-droplet sample preparation method was applied. Results and Discussion In order to prepare block copolymers of PEG and poly(2- oxazolines) the hydroxyl end group of mpeg needs to be converted into an initiator for the CROP. Therefore, mpeg 2000 was substituted by esterification reaction with end groups which are suitable as initiators, [19] such as benzyl bromide, benzyl chloride, or tosylate. The reactions with 4-(bromomethyl) benzoyl bromide, 4-(chloromethyl) benzoyl chloride, and toluene sulfonyl chloride yield polymers with the desired end groups; the reactions were performed according to a reported literature procedure. [20] To ensure a full conversion of mpeg the reaction was monitored by MALDI MS, revealing a complete substitution with 4-(bromomethyl) benzoyl bromide after 1 h reaction time and with 4-(chloromethyl) benzoyl chloride as well as toluene sulfonyl chloride after 4 h, respectively. The reaction products were washed with water and purified by chromatography using a Biobeads column. The converted mpeg samples were characterized by 1 H NMR spectroscopy, SEC and MALDI-TOF MS. Whereas the SEC data showed a retention of the molar mass during the reaction, the full conversion of each mpeg sample was confirmed in addition to the MALDI monitoring by 1 H NMR spectroscopy within the proton NMR accuracy. Tosylated mpeg The MALDI-TOF spectra were measured in reflector mode and contained two distributions for the reaction product of the conversion of mpeg with toluene sulfonyl chloride. Both showed within themselves peak distances of m/z 44 corresponding to the PEG repeating unit (Figure 1a). The smaller distribution was shifted by 16 m/z units to larger values in comparison to the main distribution. Therefore, both distributions could be assigned to the desired reaction product: the ones ionized with sodium represent the main distribution and the ones ionized with potassium the other, less intense distribution. For the tandem MS investigations a precursor ion with 38 repeating units was chosen (Figure 1b) and the investigations were performed with lithium chloride and sodium chloride as ionizing agents. The CID spectra showed no differences between sodium and lithium ionized tosylated mpeg except the cation attached, therefore only results obtained with sodiated adducts are presented. The CID spectrum can be divided into three parts with different emerging fragmentation mechanism respectively as shown in Figure 1c, e and f and presented in the following. In the upper molar mass region of the MS/MS spectrum right after the parent ion a very pronounced loss of small fragments is observed. A zoom into that region revealed the loss of (Figure 1c). This neutral loss can be assigned to the corresponding acid of the sulfonic acid ester end group of the substituted mpeg. The very prominent and distinct fragmentation can be explained by a McLafferty þ 1 rearrangement (1,5 hydrogen-transfer) [21] that involves the sulfonic acid ester bond leading to the Macromol. Chem. Phys. 2010, 211, ß 2010 WILEY-VCH Verlag GmbH & Co. KGaA, Weinheim 679
168 K. Knop, B. O. Jahn, M. D. Hager, A. Crecelius, M. Gottschaldt, U. S. Schubert fragment distributions forming eye catching regular structures in the middle molar mass region of the CID spectrum that are certainly much lower in intensity in comparison to the 1,5 hydrogen-transfer (Figure 1e). These series are formed by 1,4-elimination mechanisms, which were already proposed by Lattimer and coworkers and Jackson et al. (Scheme 1). [13 15] Interestingly, the corresponding B 0 and C 0 fragment series for the 1,4-hydrogen elimination were observed to occur with much lower intensities. Furthermore, three other fragment series can be observed in the spectrum, which are formed by two subsequently following fragmentations (Figure 1g). Fragment series E and F are formed by 1,4-hydrogen eliminations at both ends of the substituted mpeg molecule or by 1,5 hydrogen-transfer combined with an 1,4-hydrogen elimination. The hydroxyl group of fragment series G is formed by 1,4-ethylene fragmentation. Additionally, to form the series G, 1,4- hydrogen elimination or 1,5 hydrogen-transfer occurs at the other end group of the PEG chain. In the lower molar mass region, below m/z 500, the appearance of the CID spectrum changes as more fragments can be observed (Figure 1f). They can be attributed to distonic radical cations, which are formed either by single homolytic bond cleavage or multiple bond cleavages (Figure 1g). [13,14] p-(chloromethyl)-benzoic Acid Ester of mpeg Figure 1. (a) MALDI-TOF spectrum of tosylated mpeg; (b) CID mass spectrum of the parent peak with 38 repeating units (marked with a bar in (a)); (c) zoom into the MS/MS spectrum below the parent peak showing the distinct loss of toluene sulfonic acid (inset: zoom into parent ion); (d) schematic representation of the proposed mechanism for cleavage of the sulfonic acid ester bond; (e) zoom into the MS/MS spectrum at m/z values between and with marked observed fragment series; (f) zoom into the MS/MS spectrum at m/z values between 240 and 300 with marked observed fragment series; (g) schematic representation of the observed fragments. cleavage of the toluene sulfonic acid and the formation of a vinyl ether end group at the PEG chain with a m/z value of , as observed previously by different groups (Figure 1d). [22 25] This peak at m/z marks the beginning of the fragment series B that can be followed down to m/z The B series, as well as the C series, are part of different For the benzyl chloride substituted mpeg the MALDI MS spectra showed only one distribution with the PEG repeating unit of m/z 44. The molar masses of the peaks could be assigned to the sodium adducts of the substituted mpeg and, additionally, the isotops of the peaks provided with their distinct chlorine structures a further prove of the substitution reaction (Figure 2a). The CID experiments were carried out with the parent ion that possessed 38 repeating units and sodium as ionizing agent for better comparability. The benzyl chloride substituted mpeg MALDI MS and tandem MS investigations were carried out in addition with lithium as doping salt. Since the spectra showed like the tosylated mpeg no differences compared to the sodium ionized samples, only the prior will be shown and discussed (Figure 2b). Corresponding to the tosylate substituted sample a division into three parts can be observed. In the upper molar mass region a very distinct neutral loss right after the precursor ion was observed, besides the intense unspecific small fragments of m/z 14 and m/z 25 (Figure 2c). As this mass loss of m/z and m/z corresponds to the p-(chloromethyl)-benzoic acid with 35 Cl and 37 Cl, respectively, a 1,5 hydrogen-transfer is proposed leading, like in the case of tosylated mpeg, to the fragment with m/z (Figure 2d). [22 25] Furthermore, the loss of 680 Macromol. Chem. Phys. 2010, 211, ß 2010 WILEY-VCH Verlag GmbH & Co. KGaA, Weinheim DOI: /macp
169 Systematic MALDI-TOF CID Investigation on... Again, the dominant fragment series occurring in the middle region of the CID spectrum are formed by 1,4- hydrogen elimination leading to the B and C series that show the methoxy end group of the parent ion and the ethylene ether end group for the B series and the aldehyde end group for the C series (Figure 2e). Accompanying to the B, B and C, C series the A series is observed with the C series as corresponding opposite fragment (Scheme 1), but no fragments of the A series could be assigned. The series F as product of 1,4-ethylene fragmentation and either 1,4-hydrogen elimination or 1,5 hydrogen-transfer was observed (Figure 2g). In contrast to tosylated mpeg a series A was observed which still includes the functionalized end group, since the substituted benzoates are less efficient leaving groups. The region below m/z 500 shows multiple fragments, which can be assigned as distonic radical cations, which are formed either by single homolytic bond cleavage or multiple bond cleavages (Figure 1f and g). [13,14] p-(bromomethyl)-benzoic Acid Ester of mpeg Figure 2. (a) MALDI-TOF spectrum of benzyl chloride substituted mpeg; (b) CID mass spectrum of the parent peak with 38 repeating units (marked with a bar in (a)); (c) zoom into the MS/MS spectrum below the parent peak showing the distinct loss of 4-(chloromethyl) benzoic acid (inset: zoom into parent ion); (d) schematic representation of the proposed mechanism for cleavage of the 4-(chloromethyl) benzoic acid ester bond; (e) zoom into the MS/MS spectrum at m/z values between and with marked observed fragment series; (f) zoom into the MS/MS spectrum at m/z values between 240 and 300 with marked observed fragment series; (g) schematic representation of the observed fragments. the chlorine atom within the acid is underlined by the loss of the chlorine isotopic pattern. The CID spectrum shows within the middle molar mass region regular series of fragments with intensities below the 1,5 hydrogen-transfer corresponding to fragment series formed by different 1,4-eliminations discussed already by Lattimer coworkers and Jackson et al. (Scheme 1). [14,15] The benzyl bromide substitution of mpeg delivers after a very short reaction time a MALDI MS spectrum that contains only one distribution, ionized with sodium. The product peaks showed additionally the very characteristic bromine isotopic patterns (Figure 3a). Collision induced fragmentation studies were performed on the precursor ion with 38 repeating units and delivered a very prominent loss of m/z 213, like already observed for the previous mpeg samples (Figure 3b and c). This mass loss corresponds with the neutral loss of 4-(bromomethyl) benzoic acid caused by a 1,5 hydrogen-transfer (further confirmed by the change of the characteristic bromine isotopic pattern) to a carbon pattern (Figure 3d). [22 25] In the middle molecular mass region regular series of fragments with lower intensities than the 1,5 hydrogen-transfer were found belonging to fragment series formed by different 1,4-elimination mechanisms discussed already above (Scheme 1). [14,15] In the case of benzyl bromide substituted mpeg only the B and C series with the corresponding B and C series were observed. Whereas the B and C series, not bearing the benzyl bromide group, provide the most intense peaks, the B and C series showed the characteristic bromine isotopic pattern in accordance with the fragmentation mechanism. Interestingly, no fragments could be detected that were derived from multiple fragmentations although the applied collision energy was sufficient to induce multiple fragmentations on tosylated and benzyl chloride substituted mpeg (Figure 3e and g). One new fragment series was detected formed by a backbiting mechanism that substitutes the bromine (Figure 3g). This induced fragmentation, caused by the Macromol. Chem. Phys. 2010, 211, ß 2010 WILEY-VCH Verlag GmbH & Co. KGaA, Weinheim 681
170 K. Knop, B. O. Jahn, M. D. Hager, A. Crecelius, M. Gottschaldt, U. S. Schubert The region of the CID spectrum below m/z 500 shows distonic radical cations formed by single homolytic or multiple bond cleavages (Figure 1f). [13,14] Comparison of the CID Spectra Figure 3. (a) MALDI-TOF spectrum of benzyl bromide substituted mpeg; (b) CID mass spectrum of the parent peak with 38 repeating units (marked with a bar in (a)); (c) zoom into the MS/MS spectrum below the parent peak showing the distinct loss of 4-(bromomethyl) benzoic acid (inset: zoom into parent ion); (d) schematic representation of the proposed mechanism for cleavage of the 4-(bromomethyl) benzoic acid ester bond; (e) zoom into the MS/MS spectrum at m/z values between and with marked observed fragment series; (f) zoom into the MS/MS spectrum at m/z values between 240 and 300 with marked observed fragment series; (g) schematic representation of the observed fragments (D fragments correspond to Fig. 3 substituted with Br, respectively). very good leaving group quality of bromine, leads to the cyclic structure H and the fragment series B. This additional fragmentation pathway could be observed, in comparison to benzyl chloride substituted mpeg, due to the higher lability of bromine induced by the higher pk a value of the corresponding acid. For the three end group modification reactions a full conversion was achieved proven by 1 H NMR spectroscopy as well as MALDI-TOF MS (Figures 1a, 2a and 3a). The MALDI-TOF MS and the MALDI-CID investigations were performed with sodium and lithium as doping salt. Although otherwise reported no difference in signal-tonoise ratio or ion abundance was observed in these cases, possibly caused by the higher m/z value of the precursor ions. [22] For the three different substituted mpegs the parent peak with 38 repeating units was chosen for the CID experiments. After acid cleavage the same resulting mpeg fragments with the same mass occurred. These very prominent and in the three tandem MS spectra very characteristic acid cleavages are proposed to occur via a 1,5 hydrogen-transfer, as already observed by different groups. [22 25] For the halogen substituted mpeg precursor ions the loss of the characteristic bromine and respectively chlorine isotopic pattern in the formed 1,5 hydrogen-transfer product at m/z 1710 can be observed, which now only show the carbon isotopic pattern. This mechanism is presented in Figures 1d, 2d, and 3d as concerted reaction although it is not yet clarified whether this mechanism occurs in a concerted or a step-wise electron rearrangement. [26] In MS of small molecules McLafferty þ 1 rearrangements are supposed to occur in a charge-induced mechanism. For polymer fragmentation in general and for PEG ionized with sodium in particular, usually a charge-remote mechanism is assumed as ionization of the chains happens in general via the attachment of an ion. [10] Interestingly, the hereby proposed 1,5 hydrogen-transfers occur as charge-remote mechanisms in accordance with the following observation. For all three substituted mpeg samples regular fragmentation series in the middle molar mass region were observed which are much less intense than the peak obtained by the 1,5 hydrogen-transfer acid cleavage. This difference in intensity between fragments formed during 1,5 hydrogen-transfer and fragments formed during 1,4- elimination can be explained by the energy requirement for these two rearrangements. Although a collision cell is a high energy device and delivers more than enough energy for both mechanisms, apparently, the internal energy conversion leading to a 1,5 hydrogen-transfer associated with the loss of the acid end group occurs more efficient than the energy conversion that is followed by an elimination reaction. Subsequently, it can be deduced that for collision- 682 Macromol. Chem. Phys. 2010, 211, ß 2010 WILEY-VCH Verlag GmbH & Co. KGaA, Weinheim DOI: /macp
171 Systematic MALDI-TOF CID Investigation on... induced fragmentation these ester bonds are more easily cleaved than ether bonds corresponding to the general expectation. A comparison of the CID spectra of polymers with the three end groups (Figures 1b, 2b and 3b) shows also that the intensity of the 1,4-elimination fragments in comparison to the 1,5 hydrogen-transfer peak differs. Whereas tosylate substituted mpeg delivers very low intense 1,4-elimination fragments at only 0.2% normalized intensity, benzyl chloride substituted mpeg shows normalized intensities at 6% and benzyl bromide substituted mpeg delivers values of about 30% normalized intensity. This observation can be explained by the leaving group quality of the end group. Tosylate provides the best leaving group qualities of the three examples leading to a preferred and dominant McLafferty loss. This probably early rearrangement leaves time for further fragmentations explaining the relative high amount of fragments that were derived from multiple dissociations. Ester bonds are not as good leaving groups as tosylate groups; therefore relatively to the 1,5 hydrogentransfer the 1,4-eliminations occur more often. Apparently, the exchange of the chlorine with the bromine makes a large difference in the fragmentation probability, which can not yet be explained. In general, the intensity of the two fragments formed during one process should be the same. [21] Nevertheless, it can be clearly observed in the Figures 1e, 2e and 3e that the fragments not bearing the introduced end groups (B and C series) are much more intense, than the ones still holding the introduced end group (series B and C ). For this observation a possible explanation is connected with the localization of the ionizing sodium on the polymer chain. The ionization of PEG molecules with sodium occurs by coordination of the ion with up to eight oxygen atoms of the polymer chain. [27] As the ester end group might disturb this coordination, the complexation at the methoxy ends of the mpeg molecules might be energetically more favorable and is therefore as ionized fragment more stable during rearrangement and potential following secondary reactions. As the elimination occurs with charge-remote mechanism, the sodium complexed methoxy end remains hence the part of the fragmented molecule, which is detected. For clarification, density functional theory (DFT) calculations were performed at the B3LYP [28] level of theory in combination with the split valence basis set þ G(2d,2p) with the aid of the Gaussian03 program package. [29] Energies are given as thermal enthalpies. The p-(chloromethyl)-benzoic acid ester and the tosylated mpeg with eight repeating units were used as model systems of the polymer chain. The results show a large difference in energy of over 200 kj mol 1 between the sodium complex with a crown-shaped mpeg chain and the complexation via the ester end group of a linear polymer chain (Figure 4). In case of the linear mpeg the sodium is situated at the carbonyl oxygen atom of the ester end group. However, the calculations of different geometries of the complex with the crown-shaped PEG chain showed a negligible divergence between the methoxy end group and the ester end group as the top of the crown-shaped complex in comparison to the linear model. In both cases the complex with the ester end group is slightly preferred (p-(chloromethyl)-benzoic acid ester of mpeg DE ¼ 6 kj mol 1 ; tosylated mpeg DE ¼ 4 kj mol 1 ). Although the linear model describes only a border case it shows on the one hand, that the MacLafferty þ 1 rearrangement might occur more probably via charge-remote mechanism and on the other Figure 4. Calculated structures of the ionized sodium adducts with eight repeating units optimized at the B3LYP/6-311 þ G(2d,2p) level of theory. Atom descriptions are as follows: coiled: oxygen; black: carbon; white: hydrogen; transverse striped: chlorine resp. sulfur; longitudinal striped: sodium; (a) p-(chlormethyl)-benzoic acid ester, carbonyl group topped crown-shaped sodium complex; (b) p-(chlormethyl)-benzoic acid ester, methoxy topped crown-shaped sodium complex, DE ¼ 6kJmol 1 in relation to (a); (c) p-(chlormethyl)-benzoic acid ester, linear polymer chain, DE ¼ 220 kj mol 1 in relation to (a); (d) tosylated mpeg, carbonyl group topped crown-shaped sodium complex; (e) tosylated mpeg, methoxy topped crownshaped sodium complex, DE ¼ 4 kj mol 1 in relation to (d); (f) tosylated mpeg, linear polymer chain, DE ¼ 217 kj mol 1 in relation to (d). Macromol. Chem. Phys. 2010, 211, ß 2010 WILEY-VCH Verlag GmbH & Co. KGaA, Weinheim 683
172 K. Knop, B. O. Jahn, M. D. Hager, A. Crecelius, M. Gottschaldt, U. S. Schubert hand, that the complexation of the sodium ion by carbonyl group is less favorable. Distonic radical cations of the fragmented PEG samples were only observed in the lower molar mass region below about m/z 500 leading to a rather unspecific overlay of multiple fragments in this range. Conclusion mpeg was substituted with different end groups linked by an ester bond. Tandem MS investigations yielded in the middle and the upper molar mass region of the spectra fragments with high analytical value. By 1,5 hydrogen-transfer the end groups introduced by polymer analogs reactions were cleaved off in a very efficient and characteristic way revealing the exact mass of the end group and providing thereby very direct information on the end group nature. Further, in-detail examinations of the spectra revealed the different leaving group qualities of the end groups and a preferentially ionization during the MALDI process by the PEG chain as a crown ether-shaped complex rather than the carbonyl group of the ester end group. These findings were supported by DFT calculations of the different possible complexation geometries. With these examples of substituted mpegs MALDI-TOF MS and MS/MS were proven to represent a powerful combination of tools to investigate synthetic polymers and polymer analogs reactions and to elucidate the conversion as well as the exact structure of the reaction products. This study effectively shows that a combination of MALDI-MS and CID fragmentation greatly facilities the determination of end group and architectural modifications to synthetic polymers. Acknowledgements: The authors wish to acknowledge the Dutch Polymer Institute (DPI, technology area high-throughput-experimentation) and the Thüringer Kultusministerium (grant no. B ) for the financial support of this study. Many thanks are also expressed to Bruker Daltonik GmbH for their cooperation. Received: June 22, 2009; Revised: October 29, 2009; Published online: January 22, 2010; DOI: /macp Keywords: block copolymers; CID; collision induced dissociation; mass spectrometry; matrix-assisted laser desorption/ionization mass spectrometry (MALDI MS); poly(ethylene glycol) [1] G. Gaucher, M.-H. Dufresne, V. P. Sant, Ning Kang D. Maysinger, J.-C. Leroux, J. Controlled Release 2005, 109, 169. [2] H.-R. Schulten, R. P. Lattimer, Mass Spectrom. Rev. 1984, 3, 231. [3] S. D. Hanton, Chem. Rev. 2001, 101, 527. [4] M. W. F. Nielen, Mass Spectrom. Rev. 1999, 18, 309. [5] A. C. Crecelius, A. Baumgaertel, U. S. Schubert, J. Mass Spectrom. 2009, 44, [6] G. Montaudo, M. S. Montaudo, C. Puglisi, F. Samperi, Macromolecules 1995, 28, [7] St. Weidner, G. Kuehn, Rapid Commun. Mass Spectrom. 1996, 10, 942. [8] J. H. Scrivens, A. T. Jackson, Int. J. Mass Spectrom. 2000, 200, 261. [9] P. M. Peacock, C. N. McEwen, Anal. Chem. 2004, 76, [10] R. P. Lattimer, H. Münster, H. Budzikiewicz, Int. J. Mass Spectrom. Ion Processes 1989, 90, 119. [11] R. P. Lattimer, J. Am. Soc. Mass Spectrom. 1994, 5, 1072 and references therein. [12] S. J. Pastor, C. L. Wilkins, Int. J. Mass Spectrom. 1998, 175, 81. [13] J. P. Williams, G. R. Hilton, K. Thalassinos, A. T. Jackson, J. H. Scrivens, Rapid Commun. Mass Spectrom. 2007, 21, [14] T. L. Selby, C. Wesdemiotis, R. P. Lattimer, J. Am. Soc. Mass Spectrom. 1994, 5, [15] A. T. Jackson, H. T. Yates, J. H. Scrivens, G. Critchley, J. Brown, M. R. Green, R. H. Bateman, Rapid Commun. Mass Spectrom. 1996, 10, [16] P. Kowalski, C. Guttman, W. Wallace, Proc. ASMS Conf. Mass Spectrom. Allied Topics 1998, 46, [17] A. J. Hoteling, K. Kawaoka, M. C. Goodberlet, W.-M. Yu, K. G. Owens, Rapid Commun. Mass Spectrom. 2003, 17, [18] R. Hoogenboom, F. Wiesbrock, H. Huang, M. A. M. Leenen, H. M. L. Thijs, S. F. G. M. van Nispen, M. van der Loop, C.-A. Fustin, A. M. Jonas, J.-F. Gohy, U. S. Schubert, Macromolecules 2006, 39, [19] M. W. M. Fijten, R. Hoogenboom, U. S. Schubert, J. Polym. Sci., Part A: Polym. Chem. 2008, 46, [20] K. Jankova, X. Chen, J. Kops, W. Batsberg, Macromolecules 1998, 31, 538. [21] F. W. McLafferty, F. Turecek, Interpretation of Mass Spectra, 2 nd edition, University Science Books, Mill Valley 1993, p 82. [22] A. T. Jackson, M. R. Green, R. H. Bateman, Rapid Commun. Mass Spectrom. 2006, 20, [23] A. R. Bottrill, A. E. Giannakopulos, C. Waterson, D. M. Haddelton, K. S. Lee, P. J. Derrick, Anal. Chem. 1999, 71, [24] A. T. Jackson, S. E. Slade, K. Thalassinos, J. H. Scrivens, Anal. Bioanal. Chem. 2008, 392, 643. [25] R. Chen, X. Yu, L. Li, J. Am. Soc. Mass Spectrom. 2002, 13, 888. [26] D. J. McAdoo, C. E. Hudson, M. Skyiepal, E. Broido, L. L. Griffin, J. Am. Chem. Soc. 1987, 109, [27] J. Gidden, T. Wyttenbach, A. T. Jackson, J. H. Scrivens, M. T. Bowers, J. Am. Chem. Soc. 2000, 122, [28] P. J. Stephens, F. J. Devlin, C. F. Chablowski, M. Frisch, J. Phys. Chem. 1994, 98, 11623, and references cited therein. [29] Gaussian 03, Revision C.02, M. J. Frisch, G. W. Trucks, H. B. Schlegel, G. E. Scuseria, M. A. Robb, J. R. Cheeseman, J. A. Montgomery, Jr., T. Vreven, K. N. Kudin, J. C. Burant, J. M. Millam, S. S. Iyengar, J. Tomasi, V. Barone, B. Mennucci, M. Cossi, G. Scalmani, N. Rega, G. A. Petersson, H. Nakatsuji, M. Hada, M. Ehara, K. Toyota, R. Fukuda, J. Hasegawa, M. Ishida, T. Nakajima, Y. Honda, O. Kitao, H. Nakai, M. Klene, X. Li, J. E. Knox, H. P. Hratchian, J. B. Cross, V. Bakken, C. Adamo, J. Jaramillo, R. Gomperts, R. E. Stratmann, O. Yazyev, A. J. Austin, R. Cammi, C. Pomelli, J. W. Ochterski, P. Y. Ayala, K. Morokuma, G. A. Voth, P. Salvador, J. J. Dannenberg, V. G. Zakrzewski, S. Dapprich, A. D. Daniels, M. C. Strain, O. Farkas, D. K. Malick, A. D. Rabuck, K. Raghavachari, J. B. Foresman, J. V. Ortiz, Q. Cui, A. G. Baboul, S. Clifford, J. Cioslowski, B. B. Stefanov, G. Liu, A. Liashenko, P. Piskorz, I. Komaromi, R. L. Martin, D. J. Fox, T. Keith, M. A. Al-Laham, C. Y. Peng, A. Nanayakkara, M. Challacombe, P. M. W. Gill, B. Johnson, W. Chen, M. W. Wong, C. Gonzalez, J. A. Pople, Gaussian, Inc., Wallingford CT, Macromol. Chem. Phys. 2010, 211, ß 2010 WILEY-VCH Verlag GmbH & Co. KGaA, Weinheim DOI: /macp

173 Publication P5: Block length determination of the block copolymer mpeg-b-ps using MALDI-TOF MS/MS A. C. Crecelius, C. R. Becer, K. Knop, U. S. Schubert J. Polym. Sci., Part A: Polym. Chem. 2010, 48,
174
175 Block Length Determination of the Block Copolymer mpeg-b-ps Using MALDI-TOF MS/MS ANNA C. CRECELIUS, 1,2 C. REMZI BECER, 1,2,3 KATRIN KNOP, 1,2 ULRICH S. SCHUBERT 1,2,3 1 Laboratory of Organic and Macromolecular Chemistry, Friedrich-Schiller-University Jena, Humboldtstr. 10, Jena 07743, Germany 2 Dutch Polymer Institute (DPI), John F. Kennedylaan 2, 5612 AB Eindhoven, The Netherlands 3 Laboratory of Macromolecular Chemistry and Nanoscience, Eindhoven University of Technology, Den Dolech 2, 5600 MB Eindhoven, The Netherlands Received 19 May 2010; accepted 1 July 2010 DOI: /pola Published online in Wiley Online Library (wileyonlinelibrary.com). ABSTRACT: The molar mass determination of block copolymers, in particular amphiphilic block copolymers, has been challenging with chromatographic techniques. Therefore, methoxy poly- (ethylene glycol)-b-poly(styrene) (mpeg-b-ps) was synthesized by atom transfer radical polymerization (ATRP) and characterized in detail not only by conventional chromatographic techniques, such as size exclusion chromatography (SEC), but also by matrix-assisted laser/desorption ionization tandem mass spectrometry (MALDI-TOF MS/MS). As expected, different molar mass values were obtained in the SEC measurements depending on the calibration standards (either PEG or PS). In contrast, MALDI-TOF MS/MS analysis allowed the molar mass determination of each block, by the scission of the weakest point between the PEG and PS block. Thus, fragments of the individual blocks could be obtained. The PEG block showed a depolymerization reaction, while for the PS block fragments were obtained in the monomeric, dimeric, and trimeric regions as a result of multiple chain scissions. The block length of PEG and PS could be calculated from the fragments recorded in the MALDI-TOF MS/MS spectrum. Furthermore, the assignment of the substructures of the individual blocks acquired by MALDI-TOF MS/MS was accomplished with the help of the fragments that were obtained from the corresponding homopolymers. VC 2010 Wiley Periodicals, Inc. J Polym Sci Part A: Polym Chem 48: , 2010 KEYWORDS: block copolymer; MALDI-TOF MS/MS; mass spectrometry; poly(ethylene glycol); poly(styrene); structure; tandem MS INTRODUCTION Amphiphilic block copolymers are of tremendous interest for various applications in which the combination of hydrophilic and hydrophobic properties are utilized, for example, as compatibilizers, dispersion stabilizers, and emulsifiers. Copolymers containing poly(ethylene glycol) (PEG) as hydrophilic and poly(styrene) (PS) as hydrophobic segment are used in many industrial applications, such as stabilizers, surfactants, and templates for the preparation of inorganic nanoparticles. 1,2 One major breakthrough in block copolymer synthesis in the last two decades was the introduction of controlled radical polymerization techniques (CRP), such as atom transfer radical polymerization (ATRP). 3 ATRP allows the synthesis of welldefined structures of copolymers in industry as well as on the laboratory scale. In ATRP, a transition metal compound acts as a carrier of a halogen atom in a reversible redox process. 4 The detailed characterization of amphipilic copolymers is crucial, since the properties of such materials depend on the microstructures, such as the ratio of the corresponding block lengths, end group functionality, and the chain architecture. 5 Traditional characterization techniques for this purpose are size exclusion chromatography (SEC) and proton-nuclear magnetic resonance ( 1 H NMR) spectroscopy. However, since the introduction of soft ionization techniques, such as matrix-assisted laser desorption/ionization time-of-flight (MALDI-TOF) 6,7 and electrospray ionization (ESI), 8 mass spectrometry (MS) has been placed in the focus of polymer analysis The addition of tandem MS (MS/MS) analysis in combination with both soft ionization techniques has made the structure analysis of homopolymers, as well as copolymers easier However, only a few reports exist about the MS/MS analysis of copolymers using MALDI-TOF and ESI Wesdemiotis et al. 21 performed MALDI-TOF MS/MS measurements on the poly(fluoro oxetane)-co-(tetrahydrofuran) copolymer to obtain information regarding its architecture. The block copolymer mono-n-butyl ethers of poly(ethylene glycol)-b-poly(propylene oxide) (PEG-b-PPO) was analyzed by Weidner et al. 22 to determine the correct number of repeating units in the PEG and the PPO block of the Additional Supporting Information may be found in the online version of this article. Correspondence to: A. C. Crecelius ( anna.crecelius@ uni-jena.de) or U. S. Schubert ( ulrich.schubert@uni-jena.de) Journal of Polymer Science: Part A: Polymer Chemistry, Vol. 48, (2010) VC 2010 Wiley Periodicals, Inc. BLOCK LENGTH DETERMINATION, CRECELIUS ET AL. 4375
176 JOURNAL OF POLYMER SCIENCE: PART A: POLYMER CHEMISTRY DOI /POLA TABLE 1 Summary of SEC and 1 H NMR Spectroscopy Data Sample name Reac time min M n,sec g/mol (PEG calibration) PDI M n,sec g/mol (PS calibration) PDI NMR (n) NMR (m) SEC (m) Macroinitiator 2, , Sample , , Sample , , Sample , , Sample , , Sample , , copolymer. The end-groups and segment information about complex copolyester samples was obtained by Weidner et al. 23 employing MALDI-TOF MS/MS analysis. Adamus 24 investigated two random biodegradable copolyester macromolecules by applying ESI ion trap MS combined with MS n. Terrier et al. 25 used ESI-MS/MS under low-energy conditions to investigate ammonium adducts of a series of linear triblock and glycerol derivative diblock copolyesters. First the authors performed tandem MS analysis of the homopolymers to identify the structure of the product ions and to propose a possible fragmentation pathway. The authors demonstrated with their work that it is possible to distinguish between copolyesters with the same composition in each repeating unit with inversed block sequences and that information about the block length can be readily obtained. Simonsick and Petkovska 26 performed FT-MS n for structural characterization and sequencing of a copolymer consisting of poly(glycidyl methacrylate) and methyl methacylate. Girod et al. 27 determined accurately the PS block size in a PEG-b-PS block copolymer prepared by a nitroxide-mediated polymerization from the number of styrene losses as observed in the ESI-MS/MS spectrum. In an alternative fragmentation route the junction group between the two blocks could be structurally described. In contrast to the PS block, the PEG block did not show any specific dissociation. The authors expanded their studies by coupling liquid chromatography at critical conditions (LCCC) with on-line ESI tandem MS to characterize a PEG-b-PS block copolymer. 28,29 Giordanengo et al. 30 investigated by ESI-MS/MS as well as by NMR spectroscopy the microstructure of a poly(methacrylic acid)-poly(methyl methacrylate) copolymer. The random nature of the copolymer could only be detected by tandem MS analysis. In this study, we first used the traditional methods, such as SEC, and 1 H NMR spectroscopy to characterize the block copolymer mpeg-b-ps, which was synthesized by ATRP; afterwards MALDI-TOF MS and MS/MS were applied to determine the size of both blocks. By using MALDI-TOF MS/MS analysis, the hydrolysis of both blocks, as described by Girod et al. 31 was not necessary and therefore the analysis was much faster and easier. RESULTS AND DISCUSSION Characterization of the Block Copolymer by SEC and 1 H NMR Spectroscopy The block copolymer mpeg-b-ps was synthesized utilizing the ATRP reaction. In total five copolymer samples were obtained besides the macroinitiator and were first characterized by SEC using either a PEG or a PS calibration and, secondly, by 1 H NMR spectroscopy. The results obtained from both characterization techniques are summarized in Table 1. The difference in the calculated number average molar mass values (M n ) by using two different types of calibration standards are arising from the different hydrodynamic volumes of the copolymers obtained. As the calibration standards, either PEG or PS, do not have the same chemical structure to that of the copolymer samples, the relative M n values should be in between the molar mass values calculated according to PEG or PS calibration. Small polydispersity index (PDI) values as expected from a controlled polymerization were obtained, as presented in Table 1. By integrating the signals of the 1 H NMR spectra, the n and m values for the two repeating units of mpeg-b-ps were obtained. The integration of the peaks that belong to PEG in the 1 H NMR spectrum was taken as 44 repeating units and the corresponding PS content was calculated accordingly. Higher numbers of repeating units were observed at higher monomer conversions, as expected. The SEC graphs were also used to calculate the number of repeating units for PS in the block copolymers. The obtained m values differ slightly from the values obtained by 1 H NMR spectroscopy. As depicted in Figure 1, the hydrodynamic volume of the block copolymer is increasing at higher monomer conversions. There is a shoulder appearing at higher elution time, which corresponds exactly to the PEG macroinitiator. The ratio of this shoulder to the formed polymer peak decreases due to the increased concentration of the polymer. This indicates that the shoulder belongs to unfunctionalized PEG macroinitiator. Nevertheless, the peaks in the SEC curves shift to the lower 4376 WILEYONLINELIBRARY.COM/JOURNAL/JPOLA
177 ARTICLE FIGURE 1 SEC curves from PEG-b-PS copolymer samples. elution time proving the growth of the copolymer chain. It should be noted that there is another shoulder appearing at the lower elution time side. This peak corresponds to the chain-chain coupling reaction that is a side reaction during the radical polymerization of styrene. The impurities in the block copolymer, such as unfunctionalized PEG macroinitiator or the coupled block copolymer, have not been removed from the sample using dialysis or any other purification technique. In a follow-up study we are aiming to collect several fractions using 2D-SEC-LC to analyze each adduct, product or side product using MALDI-TOF MS and MS/MS techniques. This will allow us to detect the fingerprints of the polymerization. MALDI-TOF MS and MS/MS Analysis of Homopolymers The successful formation of the macroinitiator was investigated by MALDI-TOF MS analysis, as shown in Figure 2. The calculated M n value for mpeg 2000 was 1907 g/mol and for the macroinitiator 2122 g/mol; the corresponding PDI values using PolyTools for the determination for mpeg 2000 and the macroinitiator were 1.02 and 1.01, respectively. The experimental mass accuracy assigned for both polymers is around m/z 0.1, as presented in Table 2. This is within the mass accuracy achievable with the used instrument. From the starting material mpeg 2000 and the macroinitiator MALDI-TOF MS/MS analysis was performed to evaluate which fragmentations can occur. The obtained fragments of the homopolymers could be later the basis for the elucidation of the structure of fragment ions in the copolymer analysis. To interpretate the fragment ions obtained for both homopolymers, the structures described by Hoteling et al. 32 were used as possible starting points. Hoteling et al. 32 proposed accordingly to Selby et al. 33 that a 1,4-hydrogen elimination and a 1,2-ethylene elimination are occurring as fragmentation routes. The dissociation of PEG was first described by Lattimer et al. using fast atom bombardment tandem MS. 34 The ions according to these eliminations with the corresponding end groups could be determined in the recorded mass spectra for mpeg 2000 (Supporting Information Fig. 1 and Table 1) and for the macroinitiator (Supporting Information Fig. 2 and Table 2). The product ions arising from the dissociations of mpeg and the macroinitiator were labelled according to the nomenclature established by Lattimer et al. 34 Starting with Supporting Information Figure 1, the MALDI-TOF MS/MS spectrum of mpeg 2000 using AgTFA as salt additives is presented herein. A parent ion with 41 repeating units was selected. The signals of the generated fragment ions in Supporting Information Figure 1(a) reveal a depolymerization reaction. By zooming into the MALDI-TOF MS/MS spectra, as presented in Supporting Information Figure 1(b), it could not be determined accurately if the fragment ions C and A 0 are formed or if they can be explained by the silver isotopes of the fragment series B and C 0, respectively, since the detected ions are only 2 m/z values apart from each other. The MALDI-TOF MS/MS analysis was also performed with NaI, and more or less the same fragments were obtained, except fragment A, as in the AgTFA cationized sample. More detailed information can be found in Supporting Information Figure 1. mpeg 2000 has a methoxy group on one end and a hydroxyl group on the other end. The hydroxyl group is reacted by a- bromo-iso-butyryl bromide to yield the PEG macroinitiator. As mentioned earlier, the macroinitiator was analyzed as well by MALDI-TOF MS/MS using DCTB as matrix with the addition of NaI. A parent ion with 41 repeating units corresponding to a m/z value of 2008 was selected and the TABLE 2 Measurements of the Mass Accuracy Obtained for the MALDI-TOF MS Analysis of mpeg 2000 and the Macroinitiator (Fig. 2) Species m/z theo m/z exp Error (m/z) FIGURE 2 MALDI-TOF MS spectrum of mpeg 2000 and macroinitiator (matrix: DCTB, salt: NaI). mpeg Macroinitiator BLOCK LENGTH DETERMINATION, CRECELIUS ET AL. 4377
178 JOURNAL OF POLYMER SCIENCE: PART A: POLYMER CHEMISTRY DOI /POLA FIGURE 3 MALDI-TOF MS spectra of mpeg-b-ps (copolymer 1) in (a) normal mode, and (b) suppressing of ions up to m/z DCTB was used as matrix and AgTFA as salt additive. resulting MALDI-TOF MS/MS spectrum can be found in Supporting Information Figure 2. The zoom displayed in Supporting Information Figure 2(b) in connection with Supporting Information Table 2 shows the formation of seven fragment series (B, B 0,B 00,C,C 0,C 00 and C 000 ). The fragment series B, B 0,C,andC 0 are also detected when mpeg 2000 is fragmented, as presented in Supporting Information Figure 1(b), only as sodium adducts instead of silver adducts. Two additional fragment series B 00 and C 00 could be obtained, showing the characteristic end group of the macroinitiator. At first instance a bromoester moiety was expected as end group, but the distinct isotopic pattern of the bromine atom was not found and cleavage of the bromine atom from the parent ion of the macroinitiator was observed, since a fragment ion with m/z 1929 is presented in Supporting Information Figure 2. Fragment series C 000 is as well formed, which contains the unsaturated end group CH 3 AC¼CH 2. Additionally, a fragment ion, in which the whole bromoester group was cleaved off, was also recorded at the m/z value of Fragment series having a hydrogen atom as end group could be identified. This explains how fragment series B 0 and C could be formed bearing a hydrogen atom as end group. After the MALDI-TOF MS/MS analysis of mpeg 2000 and the macroinitiator was discussed in detail, now the tandem MS analysis of PS will be in the focus of this contribution. PS with a 1,1-dimethylacetic acid ethylester group as initiator moiety and a bromine atom as end group was selected. The matrices DCTB and dithranol and the salt additives NaI and AgTFA were tested for the MALDI-TOF MS analysis of PS. The highest signal-to-noise levels showed the matrix dithranol in combination with AgTFA for the MALDI-TOF MS measurement of PS (spectrum not shown). The corresponding MALDI-TOF MS/MS spectra of PS are presented in Supporting Information Figure 3. As parent ion the silver adduct with 35 repeating units of PS was selected with a m/z value of In the parent ion the bromine as end group was cleaved off and a radical was formed. The instability of the CABr bond is extensively discussed by Borman et al. 35 on PMMA synthesized by ATRP. The authors showed that methyl bromide gets lost and a ring-closed lactone end group is 4378 WILEYONLINELIBRARY.COM/JOURNAL/JPOLA
179 ARTICLE FIGURE 4 MALDI-TOF MS/MS spectra of mpeg-b-ps using the highest isotopic peak of mpeg 59 -PS 4 with m/z 3305 as precursor ion; (a) complete, (b) monomeric, (c) dimeric, and (d) trimeric region of the mass spectrum. formed during the MALDI process. The generated fragment ions are annotated in the zoom shown in Supporting Information Figure 3(b) and the structures are summarized in Supporting Information Table 3. The nomenclature, as introduced by Gies et al., 36 was selected for labeling the fragments produced by the MALDI-TOF MS/MS analysis. In the elucidation of the structures of the recorded peaks, the reports of Gies et al. 36 as well as Polce et al. 37,38 were used as assistance. All three studies came to the conclusion that free radicals are formed and undergo further fragmentations. In Supporting Information Table 3 only the fragment ions labeled with Ian. and Ibn II show the characteristic 1,1- dimethylacetic acid ethylester group as initiator group, all other fragment ions underwent scission of this initiator moiety and could have also been generated if a butyl group would have been used as initiator instead, corresponding to the measurements by Gies et al. 36 and Polce et al. 37 A detailed mechanism about the formation of these specific product ions has been reported by Gies et al. 36 The studied block copolymer exhibits the same Br termination, although the cleavage of the CABr bond does not occur, since the selected precursor ion of the MALDI-TOF MS/MS analysis with a m/z value of 3305 corresponds to the intact silver-containing molecule with 59 PEG and 4 PS repeating units, as shown later in this contribution. One possible explanation for this unexpected phenomenon can be that the CABr bond cleavage is time dependent. PS was synthesized 6 months before the block copolymer was produced and both compounds were analyzed by MALDI-TOF MS and tandem MS at the same date. Characterization of the Block Copolymer by MALDI-TOF MS and MS/MS Analysis The MALDI-TOF MS spectrum of the copolymer sample 1 is presented in Figure 3. From Figure 3(a), it is obvious that the unfunctionalized PEG, which is the remaining reagent from the synthesis of the macroinitiator, is masking the signals of the copolymer sample. This effect can be overcome BLOCK LENGTH DETERMINATION, CRECELIUS ET AL. 4379

 Maan. 302.1(n ¼ 1) 406.1 (n ¼ 2) 510.1 (n ¼ 3) A 168.4 (n ¼ 1) 213.1 (n ¼ 2) 256.1 (n ¼ 3) 301.1 (n ¼ 4) 2370.")
 B 0 194.2 (n ¼ 1) 238.1 (n ¼ 2) 283.1 (n ¼ 3) 1779.8 (n ¼ 37) C 211.1 (n ¼ 1) 254.1 (n ¼ 2) 298.1 (n ¼ 3) 2588.")
180 JOURNAL OF POLYMER SCIENCE: PART A: POLYMER CHEMISTRY DOI /POLA TABLE 3 Structural Assignments for the Peaks in the MALDI-TOF MS/MS Spectra of Figure 4, Fragments of the PS Block, and mpeg Block Label Ions Observed (m/z) Schematic Representation of the Structures Frag Frag Mabn II (n ¼ 1) (n ¼ 2) Maan (n ¼ 1) (n ¼ 2) (n ¼ 3) A (n ¼ 1) (n ¼ 2) (n ¼ 3) (n ¼ 4) (n ¼ 51) A (n ¼ 1) (n ¼ 2) (n ¼ 3) (n ¼ 4) (n ¼ 53) B (n ¼ 1) (n ¼ 2) (n ¼ 3) (n ¼ 57) B (n ¼ 1) (n ¼ 2) (n ¼ 3) (n ¼ 37) C (n ¼ 1) (n ¼ 2) (n ¼ 3) (n ¼ 55) C (n ¼ 1) (n ¼ 2) (n ¼ 3) (n ¼ 57) 4380 WILEYONLINELIBRARY.COM/JOURNAL/JPOLA
181 ARTICLE TABLE 4 Measurements of the Mass Accuracy of the Fragment Peaks Presented in the MALDI-TOF MS/MS Spectra Shown in Figure 4 Species m/z theo m/z exp Error (m/z) Frag Frag Mabn II Maan A A B B C C by suppressing the ions up to m/z 3000 reaching the detector. By using this approach, intense signals of the copolymer sample could be recorded, as shown in Figure 3(b). The zoom of the MALDI-TOF MS spectrum reveals the assignment of the repeating units of both blocks (PEG with m/z 44 and PS with m/z 104). The remaining copolymer samples have been analyzed in the same manner by MALDI-TOF MS. The corresponding MALDI-TOF MS spectra can be found in Supporting Information Figure 4. With rising sample number, the copolymer distribution is shifting to higher m/z values and the MALDI-TOF MS analysis is more and more difficult. Hence, a pre-fractionation, such as two-dimensional liquid chromatography, before the MALDI-TOF MS measurements, would be highly favorable. The MALDI-TOF MS/MS analysis was performed on the highest isotopic peak (m/z 3305) of mpeg-b-ps with 59 repeat units of mpeg and 4 repeat units of PS. Since the window of the precursor ion selector could only be closed up to m/z 4, without losing the precursor ion signal, side products, such as mpeg 52 -b-ps 7 with m/z 3309 (highest isotopic peak) and mpeg 66 -b-ps 1 with m/z 3301 (highest isotopic peak) could also be fragmented in the analysis. If this would be the case, the fragmentation of mpeg 66 -b-ps 1 should reveal a different pattern of fragments due to the short PS block. However, patterns correlated to such a fragmentation could not be found. The only possibility to overcome this phenomenon is the use of an instrument with higher resolution, such as a fourier transform ion cyclotron resonance (FTICR) mass spectrometer or an orbitrap. The resulting mass spectra from the instrument used in this study are presentedinfigure4. Corresponding structures could be assigned to nearly all peaks in the monomeric, dimeric, and trimeric region of the mass spectrum [see Fig. 4(b d)]. The structures, which are summarized in Table 3, could be found with the help of the MALDI-TOF MS/MS spectra of the homopolymers. The assignment of the fragment ions was performed over the whole available m/z range, but are not included in Table 3. To show the validity of our assignments, first the mass accuracy for the identified fragments was calculated. The results are presented in Table 4. The obtained mass accuracy was m/z 0.1, which lies in the specifications of the used mass detector. Additionally, the measured isotopic patterns were compared with the calculated ones for the identified fragments and are shown in Supporting Information Figure 5. In some cases, overlapping m/z value peaks are obtained, making the identification of the fragments demanding. However, in most cases a series of fragments with differing numbers of repeating units was observed and used to judge the assignment. Obviously only fragments of the mpeg block (Table 3) and the PS block (Table 3) could be detected in the MALDI-TOF MS/MS spectrum of mpeg-b-ps, which means that there were no signals detected correlated to fragments bearing the mpeg block as well as the PS block. From this phenomenon it can be concluded that a scission between both blocks in the tandem MS mode occurs. Three scissions, as shown in Scheme 1, are possible. The first option shown in Scheme 1(a) is that a 1,4-hydrogen elimination starts from the end of the mpeg block, so that the fragment series B and X are formed. The fragment series B, as presented in Table 3, could be identified in the corresponding MALDI-TOF MS/MS spectrum of mpeg-b-ps. Fragment series X is only detectable with one repeating unit at the m/z value of It might be that it fragments further in the tandem MS mode and is not observed in the corresponding MALDI-TOF MS/MS spectrum, since it possibly does not ionize with Ag þ. A second 1,4-hydrogen-elimination can occur, as presented in Scheme 1(b), so that fragment series X and C 0 are formed as a consequence. Fragment series X could only be identified with one repeating unit in the corresponding MALDI-TOF MS/MS spectrum, since it possibly fragments further and does not ionize with Ag þ. Fragment series C 0 could be easily detected in the MALDI-TOF MS/MS spectrum (see Fig. 4). The third option, as presented in Scheme 1(c), is the McLafferty rearrangement, where a hydrogen atom is separated from the block copolymer. Here again, as shown in Scheme 1(a), the fragment series B is formed as well as fragment series X, which could not be found in the acquired MALDI-TOF MS/MS spectrum. As in the recorded MALDI-TOF MS/MS spectrum (Fig. 4 and Table 3) fragment series of mpeg with 57 repeating units could be observed, the fragmentation route as presented in Scheme 1(a,b) is possibly favored. If a McLafferty rearrangement would take place one could expect to see 58 repeating units of fragment series B and at least fragment X with one repeating unit. As mentioned earlier, no fragment series containing both repeating units of mpeg and PS could be observed. This was proven by acquirering MALDI-TOF MS/MS spectra from precursor ions containing the same number of mpeg repeating units and an increasing number of PS repeating units, as BLOCK LENGTH DETERMINATION, CRECELIUS ET AL. 4381
182 JOURNAL OF POLYMER SCIENCE: PART A: POLYMER CHEMISTRY DOI /POLA SCHEME 1 Proposed scission of the mpeg block from the PS block. (a), (b) 1,4-Hydrogen-elemination from each side of the copolymer chain, and (c) McLafferty rearrangement. presented in Figure 5. With increasing the repeating units of PS, the gap in the mass spectrum, where no fragments were obtained at higher molar masses, increased. Therefore a scission between both blocks is proposed as a result for the tandem MS analysis of mpeg-b-ps. EXPERIMENTAL Materials Styrene (99%, Aldrich) and anisole (Fluka) were passed through neutral alumina oxide column before use. CuBr (99.999%, Aldrich), a bromo isobutyryl bromine (98%, Aldrich), ethyl-2-bromoisobutyrate (98%, Aldrich), poly(ethylene glycol) methyl ether (M n ¼ 2000 g/mol, flakes), N,N,N 0,N 00,N 00 -pentamethyldiethylenetriamine (99%, Aldrich), and triethylamine (99%, Aldrich) was used as received. Instruments For the determination of the monomer conversions, gas chromatography (GC) measurements were performed on a Shimadzu GC used with a Trace column RTX-5 and an autosampler. 1 H NMR spectroscopy was recorded on a Bruker Avance 250 MHz in deuterated methylene chloride. The chemical shifts were calibrated with respect to tetramethylsilane (TMS). SEC was measured on an Agilent system which is equipped with triple detectors that are a diode array detector, a reflactive index detector, and a multiangle light scattering detector. Two PSS SDV (5 l pore size) columns were placed in series. DMA with 5 mmol LiCl was used as eluent 4382 WILEYONLINELIBRARY.COM/JOURNAL/JPOLA

183 ARTICLE B ) for the financial support of this study. They also thank Bruker Daltonik GmbH for their cooperation. REFERENCES AND NOTES 1 Dixit, S. G.; Mahadeshwar, A. R.; Haram, S. K. Colloids Surf A 1998, 133, Westman, A.; Huthfehre, T.; Demirev, P.; Sundqvist, B. U. R. J Mass Spectrom 1995, 30, Kamigatio, M.; Ando, T.; Sawamoto, M. Chem Rev 2001, 101, Matyjaszewski, K.; Xia, J. H. Chem Rev 2001, 101, FIGURE 5 MALDI-TOF MS/MS spectra of precursor ions containing 59 repeating units of mpeg and an increasing number of PS repeating units. The selected precursor ions are schematically represented between the spectra. DCTB was used as matrix and AgTFA as salt additive. [Color figure can be viewed in the online issue, which is available at wileyonlinelibrary. com.] at 1 ml/min flow rate and the column oven was set to 50 C. An Ultraflex III TOF/TOF (Bruker Daltonics, Bremen, Germany) was used for the MALDI-TOF MS and MS/MS analysis. The instrument is equipped with a Nd:YAG laser and a collision cell. For the MS/MS mode, argon was used as collision gas at a pressure of mbar. The instrument was calibrated before every measurement with an external standard PMMA from PSS Polymer Standards Services GmbH (Mainz, Germany). MS data were processed using PolyTools 1.0 (Bruker Daltonics). CONCLUSIONS The block length of the copolymer mpeg-b-ps could be determined in an accurate and reliable manner by performing MALDI-TOF MS/MS analysis, since a dissociation of the PEG block was leading to the separation of both blocks. The PEG block showed a depolymerization reaction, while for the PS block fragments in the monomeric, dimeric, and trimeric regions were observed. This fast and easy to perform measurement does not require the hydrolysis of mpeg-b-ps followed by the independent MALDI-TOF MS analysis of each individual block to determine the block length of the copolymer. Future experiments will be concentrated on the purification of the block copolymers by performing two-dimensional liquid-chromatography before MALDI-TOF MS and tandem MS analysis. The authors thank the Dutch Polymer Institute (DPI, technology area high-throughput-experimentation) and the Thüringer Ministerium für Bildung, Wissenschaft und Kultur (grant no. 5 Becer, C. R.; Paulus, R. M.; Hoeppener, S.; Hoogenboom, R.; Fustin, C.-A.; Gohy, J.-F.; Schubert, U. S. Macromolecules 2008, 41, Karas, M.; Hillenkamp, F. Anal Chem 1988, 60, Tanaka, K.; Waki, H.; Ido, Y.; Akita, S.; Yoshida, Y.; Yoshida, T. Rapid Commun Mass Spectrom 1988, 2, Fenn, J. B.; Mann, M.; Meng, C. K.; Wong, S. F.; Whitehouse, C. M. Science 1989, 246, Nielen, M. W. F. Mass Spectrom Rev 1999, 18, Hanton, S. D. Chem Rev 2001, 101, Montaudo, G.; Samperi, F.; Montaudo, M. S. Prog Polym Sci 2006, 31, Grunendling, T.; Weidner, S.; Falkenhagen, J.; Barner- Kowollik, C. Polym Chem 2010, 1, McEwen, C. N.; Peacock, P. M. Anal Chem 2002, 74, Peacock, P. M.; McEwen, C. N. Anal Chem 2004, 76, Peacock, P. M.; McEwen, C. N. Anal Chem 2006, 78, Weidner, S. M.; Trimpin, S. Anal Chem 2008, 80, Crecelius, A. C.; Baumgaertel, A.; Schubert, U. S. J Mass Spectrom 2009, 44, Baumgaertel, A.; Weber, C.; Knop, K.; Crecelius, A.; Schubert, U. S. Rapid Commun Mass Spectrom 2009, 23, Baumgaertel, A.; Becer, C. R.; Gottschaldt, M.; Schubert, U. S. Macromol Rapid Commun 2008, 29, Knop, K.; Jahn, B. O.; Hager, M. D.; Crecelius, A.; Gottschaldt, M.; Schubert, U. S. Macromol Chem Phys 2010, 6, Wesdemiotis, C.; Pingitore, F.; Polce, M. J.; Russell, V. M.; Kim, Y.; Kausch, C. M. T.; Connors, H.; Medsker, R. E.; Thomas, R. R. Macromolecules 2006, 39, Weidner, S. M.; Falkenhagen, J.; Maltsev, S.; Sauerland, V.; Rinken, M. Rapid Commun Mass Spectrom 2007, 21, Weidner, S. M.; Falkenhagen, J.; Knop, K.; Thünemann, A. Rapid Commun Mass Spectrom 2009, 23, BLOCK LENGTH DETERMINATION, CRECELIUS ET AL. 4383
184 JOURNAL OF POLYMER SCIENCE: PART A: POLYMER CHEMISTRY DOI /POLA 24 Adamus, G. Rapid Commun Mass Spectrom 2007, 21, Terrier, P.; Buchmann, W.; Desmazieres, B.; Tortajada, J. Anal Chem 2006, 78, Simonsick, W. J.; Petkovska, V. I. Anal Bioanal Chem 2008, 392, Girod, M.; Phan, T. N. T.; Charles, L. J Am Soc Mass Spectrom 2008, 19, Girod, M.; Phan, T. N. T.; Charles, L. Rapid Commun Mass Spectrom 2008, 22, Girod, M.; Phan, T. N. T.; Charles, L. Rapid Commun Mass Spectrom 2009, 23, Giordanengo, R.; Viel, S.; Hidalgo, M; Allard-Breton, B.; Thévand, A.; Charles, L. Anal Chim Acta 2009, 654, Girod, M.; Mazarin, M.; Phan, T. N. T.; Gigmes, D.; Charles, L. J Polym Sci Part A: Polym Chem 2009, 47, Hoteling, A. J.; Kawaoka, K.; Goodberlet, M. C.; Yu, W.-M.; Owens, K. G. Rapid Commun Mass Spectrom 2003, 17, Selby, T. L.; Wesdemiotis, C.; Lattimer, R. P. J Am Soc Mass Spectrom 1994, 5, Lattimer, R. P.; Münster, H.; Budzikiewicz, H. Int J Mass Spectrom Ion Processes 1989, 90, Borman, C. D.; Jackson, A. T.; Bunn, A.; Cutter, A. L.; Irvine, D. J. Polymer 2000, 41, Gies, A. P.; Vergne, M. J.; Orndorff, R. L.; Hercules, D. M. Macromolecules 2007, 40, Polce, M. J.; Ocampo, M.; Quirk, R. P.; Wesdemiotis, C. Anal Chem 2008, 80, Polce, M. J.; Ocampo, M.; Quirk, R. P.; Leigh, A. M.; Wesdemiotis, C. Anal Chem 2008, 80, WILEYONLINELIBRARY.COM/JOURNAL/JPOLA
185 Publication P6: Characterization of different poly(2-ethyl-2-oxazoline)s via matrixassisted laser desorption/ionization time-of flight tandem mass spectrometry A. Baumgaertel, C. Weber, K. Knop, A. C. Crecelius, U. S. Schubert Rapid Commun. Mass Spectrom. 2009, 23,
186
187 RAPID COMMUNICATIONS IN MASS SPECTROMETRY Rapid Commun. Mass Spectrom. 2009; 23: Published online in Wiley InterScience ( DOI: /rcm.3933 Characterization of different poly(2-ethyl-2-oxazoline)s via matrix-assisted laser desorption/ionization time-offlight tandem mass spectrometry Anja Baumgaertel 1, Christine Weber 1,2, Katrin Knop 1,2, Anna Crecelius 1,2 and Ulrich S. Schubert 1,2,3 * 1 Laboratory of Organic and Macromolecular Chemistry, Friedrich-Schiller-University Jena, Humboldtstr. 10, Jena, Germany 2 Dutch Polymer Institute (DPI), John F. Kennedylaan 2, 5612 AB Eindhoven, The Netherlands 3 Laboratory of Macromolecular Chemistry and Nanoscience, Eindhoven University of Technology, Den Dolech 2, 5600 MB Eindhoven, The Netherlands Received 28 November 2008; Revised 25 December 2008; Accepted 29 December 2008 Matrix-assisted laser desorption/ionization time-of-flight mass spectrometry (MALDI-TOF MS) coupled with CID (collision-induced dissociation) has been used for the detailed characterization of two poly(2-ethyl-2-oxazoline)s as part of a continuing study of synthetic polymers by MALDI-TOF MS/MS. These experiments provided information about the variety of fragmentation pathways for poly(oxazoline)s. It was possible to show that, in addition to the eliminations of small molecules, like ethene and hydrogen, the McLafferty rearrangement is also a possible fragmentation route. A library of fragmentation pathways for synthetic polymers was also constructed and such a library should enable the fast and automated data analysis of polymers in the future. Copyright # 2009 John Wiley & Sons, Ltd. Matrix-assisted laser desorption/ionization time-of-flight mass spectrometry (MALDI-TOF MS) 1,2 is an important tool for the characterization of high molar mass substances in biological and chemical fields, such as proteins and peptides, as well as natural and synthetic polymers. 3 The combination of the soft ionization method MALDI-TOF MS 4 with postsource decay (PSD) and collision-induced dissociation (CID) has made it a powerful tool for the structural elucidation of polymers. 5 The arrangement of a collision cell in a TOF analyzer allows the investigation of unimolecular polymer degradation within a single spectrum. 6 The instrument used in this study has a special MS/MS unit, which overcomes the disadvantages of PSD, such as a longer measurement time or less efficient fragmentation. 7 Poly(2-alkyl-2-oxazoline)s are an important class of polymers with a wide range of potential applications such as in thermosensitive materials, as sensors or as carrier systems for active agents in drug delivery. 8 The cationic ring opening polymerization of 2-oxazolines was first reported in the 1960s by different research groups This method was later modified 13,14 and, more recently, a microwave-assisted process was introduced to achieve better yields. 15,16 In comparison with conventional heating, microwave irradiation enables the polymerization time to be reduced by up to 400 times, and possible side reactions, like chain *Correspondence to: U. S. Schubert, Laboratory of Organic and Macromolecular Chemistry, Friedrich-Schiller-University Jena, Humboldtstr. 10, Jena, Germany. ulrich.schubert@uni-jena.de Contract/grant sponsor: Dutch Polymer Institute. Contract/grant sponsor: Thüringer Kultusministerium; contract/grant number: B transfer or chain coupling, are also reduced. During these investigations a complete library of poly(2-alkyl-2-oxazoline)s was synthesized and the polymerization was investigated by kinetic studies, NMR spectroscopy, size-exclusion chromatography (SEC) and MALDI-TOF MS. 17,18 In addition, to confirm the living polymerization mechanism, all poly(2- oxazoline)s up to a M n of 7000 Da were analyzed by MALDI- TOF MS to confirm the living polymerization mechanism. 19 In this study we report for the first time the MALDI-TOF MS and MS/MS analysis of two different poly(2-ethyl-2- oxazoline)s (PEtOx) synthesized under microwave irradiation. The first is a methyl-initiated methacrylate macromonomer and the second is a polymer, initiated with propargyl and terminated with hydroxy. EXPERIMENTAL Materials 2-Ethyl-2-oxazoline (99%; Acros Organics, Geel, Belgium; EtOx) was dried over barium oxide and distilled under argon prior to use. Methyl tosylate (98%; Sigma Aldrich, Oakville, Canada; MeTos) and propargyl toluene-4-sulfonate (97%; Fluka, Taufkirchen, Germany) were distilled and stored under argon. Acetonitrile (extra dry; Acros Organics) was stored under argon. Methacrylic acid (99%; Sigma Aldrich; MAA) was used as received. Triethylamine was dried over potassium hydroxide and distilled under argon. The matrix, anthracene-1,8,9-triol (Sigma Aldrich), sodium iodide (Acros Organics) as well as the solvents, chloroform and acetone. (HPLC grade; Roth, Karlsruhe, Germany) were used as purchased. Copyright # 2009 John Wiley & Sons, Ltd.
188 Synthesis of the oligo(2-ethyl-2-oxazoline) methacrylate macromonomer and the poly(2- ethyl-2-oxazoline) The oligo(2-ethyl-2-oxazoline) methacrylate macromonomer and the poly (2-ethyl-2-oxazoline) were both synthesized via microwave irradiation. 20 For the reaction, the desired amounts of methyl tosylate (initiator for the macromonomer) (1.485 g, 7.9 mmol) or propargyl tosylate (initiator for the polymer) (0.282 g, 1.3 mmol), 2-ethyl-2-oxazoline (macromonomer: g, 40.2 mmol; polymer: g, 25.9 mmol) and acetonitrile (macromonomer: 6.1 ml; polymer: 6.7 ml) were transferred to predried microwave vials under inert conditions. These mixtures were first stirred for 10 s, then heated up to 1408C for around 3 min and afterwards cooled down automatically with a nitrogen flow. For end capping of the macromonomer, methacrylic acid (1.02 ml, 12 mmol, 1.5- fold excess) and triethylamine (2.3 ml, 16.6 mmol, 2-fold excess) were added separately by syringe; for the polymer 1 ml of a sodium carbonate water mixture (31.8 mg/ml) was added, and both were heated at 808C for 15 h. After removing the acetonitrile under reduced pressure the macromonomer and the polymer were dissolved in chloroform, washed with an aqueous sodium hydrogen carbonate solution and saturated brine, dried with sodium sulfate and filtered. The solvent was evaporated under reduced pressure and the resulting white sticky polymer was dried under vacuum. Characterization of poly(2-ethyl-2-oxazoline)s 757 required measurement range. MS and MS/MS data were processed using the software FlexAnalysis, PolyTools 1.0 and an isotope pattern calculator from Bruker Daltonics. RESULTS AND DISCUSSION The polymerization of 2-ethyl-2-oxazoline (EtOx) can be performed in a living manner, as has already been described elsewhere, 22 with the use of microwave irradiation yielding oligomers and polymers with well-defined end groups. 23 In the present study both a methyl-initiated methacrylate macromonomer and a propargyl-initiated and hydroxylterminated polymer were synthesized. For the macromonomer the cationic ring-opening polymerization of the 2-ethyl- 2-oxazoline monomer was initiated by methyl tosylate and the monomer was end capped by methacrylic acid and triethylamine. The compound was characterized by SEC to obtain values of M n ¼ 1170 Da, M w ¼ 1252 Da and PDI ¼ 1.07 and to confirm the livingness of the polymerization. In addition to the SEC measurements MALDI-TOF MS was used to investigate the possible occurrence of chain-transfer SEC measurements Size-exclusion chromatography (SEC) was carried out on a system equipped with a SCL-10A system controller, a LC- 10AD pump and a RID-10A refractive index detector (all from Shimadzu, Duisburg, Germany) using a solvent mixture containing chloroform, triethylamine and isopropanol (94:4:2) at a flow rate of 1 ml min 1 on a PSS-SDVlinear M 5 mm column (PSS, Mainz, Germany) at room temperature. The system was calibrated with commercial polystyrene ( Da) and poly(methyl methacrylate) ( Da) standards from PSS. MALDI sample preparation For the sample preparation, oligo(2-ethyl-2-oxazoline) methacrylate macromonomer (10 mg/ml) and poly(2-ethyl- 2-oxazoline) (10 mg/ml) in chloroform, dithranol in chloroform (20 mg/ml), and the doping salt (NaI) dissolved in acetone at a concentration of 100 mg/ml were used. The dried-droplet spotting technique 21 (matrix, salt and analyte previously mixed together) was applied. For each sample 1 ml of the mixture was spotted onto a target plate. MALDI-TOF MS measurements MALDI-TOF MS measurements were performed with an Ultraflex III TOF/TOF (Bruker Daltonics, Bremen, Germany) mass spectrometer equipped with a Nd:YAG laser and a collision cell. All spectra were measured in the positive ion reflectron mode. For the MS/MS mode, argon was used as collision gas at a pressure of mbar. The instrument was calibrated prior to each measurement with an external PMMA standard H(CH 2 CCH 3 COOCH 3 ) n H þ Na þ (m/z 425 or 2526, measured with sodium iodide) from PSS in the Figure 1. (a) MALDI-TOF MS spectrum of the oligo(2-ethyl- 2-oxazoline) methacrylate macromonomer (matrix: dithranol in CHCl 3, ionization salt: NaI in acetone, solvent: CHCl 3 ). (b) MALDI-TOF MS/MS spectrum of the selected precursor ion at m/z 618. The product ion series (A) is initialized with the loss of the methacrylate end group (B). Copyright # 2009 John Wiley & Sons, Ltd. Rapid Commun. Mass Spectrom. 2009; 23: DOI: /rcm
189 758 A. Baumgaertel et al. or chain-coupling reactions as well as to determine the end groups. All spectra were measured in the reflectron mode to verify the polymer structure by comparison of the theoretical calculated and the measured isotopic pattern. 24 The MALDI- TOF MS spectrum, as shown in Fig. 1(a), contains only one distribution from m/z 200 to 1500 corresponding to the desired macromonomer structure ionized with a sodium cation (CH 3 [NCOC 2 H 5 CH 2 CH 2 ] n OCOCH 2 CH 3 þ Na þ ). All the oligomer ions could be assigned with a mass accuracy of better than 0.2 m/z units. The calculation of the numberaverage and the weight-average molar masses and the polydispersity index using PolyTools 1.0 delivered values that were comparable with those from the SEC measurement (M n, MALDI ¼ 822 Da, M w, MALDI ¼ 873 Da, PDI MALDI ¼ 1.06). For the MALDI-TOF MS/MS measurement the ion with the highest signal intensity within the distribution was chosen as the precursor ion. This ion was selected by the timed ion selector (TIS), which suppress all precursor ions with their product ions except the selected one, which can pass through this deflection gate. 7 As second step the selected precursor ion and its product ions were accelerated into a LIFT TM unit, where an actual potential lift is performed, when the ions are in the unit. 7,25 This unit is followed by a focusing cell to modulate the speed of the ions and a post-acceleration cell. Because metastable fragment ions are suppressed after the LIFT unit only the precursor ion and its associated product ions are detected. Fragmentation of the ion at m/z 618 resulted in one product ion series and some lower abundance ions and this spectrum is displayed in Fig. 1(b). After cleavage of the methacrylic end group (B) the more stable cationic oxazolinium species is formed and the depolymerization (A) of the macromonomer can be followed down to one monomer repeating unit with the initiator. This depolymerization probably takes place via a mechanism analogous to the polymerization mechanism of 2-oxazolines and is depicted in Scheme 1. In comparison with this oligo(2-ethyl-2-oxazoline) macromonomer, a polymer with different end groups was synthesized to determine its MALDI-TOF MS/MS behavior. A propagyl tosylate-initiated polymerization of EtOx followed by a hydroxyl group end capping was chosen for this study. SEC was performed to confirm the molar mass and the PDI value (M n ¼ 1,955 Da; M w ¼ 2,247 Da; PDI ¼ 1.15). The MALDI-TOF MS spectrum of the PEtOx was measured in the reflectron mode and showed three distributions with distances between the ions of the adjacent oligomers of m/z units (Figs. 2(a) and 2(b)). The main distribution can be attributed to the desired product with a propargyl starting group and a hydroxyl end group. A second, less abundant distribution with higher molar mass can be assigned to a proton-initiated PEtOx with a hydroxyl end group. For the third distribution there are two possibilities for the starting group and the end group, on the one hand the proton as starting group and the enamine structure of the oxazoline as end group or on the other hand the propargyl group as initiating group and NHCH 2 CH 2 OH as end group. These additional ion series are formed via chain transfer and termination during the polymerization reaction. The comparison of these results with those given by NMR demonstrated that the NMR resonances of the -OH or -NHCH 2 CH 2 OH groups are not observable in the spectrum, because they overlap with the other signals of the polymer or have a too low intensity. The characteristic values of this polymer (M n ¼ 1,916 Da; M w ¼ 2,011 Da; PDI ¼ 1.05) were similar to those obtained from the SEC results. From the multiplicity of ions, the ion at m/z 1961, pertaining to the main distribution, was selected as the precursor ion (marked with a circle in Fig. 2(a)) with no influence from ions belonging to the two other distributions. The corresponding MS/MS spectrum is presented in Fig. 3(a). The product ions in the low mass range, up to m/z 250, showed very high signal intensities whereas those Scheme 1. Schematic representation of the suggested fragmentation pathways for the oligo(2-ethyl-2-oxazoline) methacrylate macromonomer in the MALDI-TOF MS/MS spectrum in Fig. 1(b). Copyright # 2009 John Wiley & Sons, Ltd. Rapid Commun. Mass Spectrom. 2009; 23: DOI: /rcm
190 Characterization of poly(2-ethyl-2-oxazoline)s 759 Figure 2. (a) MALDI-TOF MS spectrum of poly(2-ethyl-2- oxazoline) (matrix: dithranol in CHCl 3, ionization salt: NaI in acetone, solvent: CHCl 3 ). (b) Zoom of the MALDI-TOF MS spectrum of PEtOx (region from m/z 1950 to m/z 2070). Figure 3. (a) MALDI-TOF MS/MS spectrum of the selected precursor ion at m/z (b) Zoom of the MALDI-TOF MS/ MS spectrum of PEtOx (region from m/z 900 to m/z 1000). between m/z 250 and the precursor ion at m/z 1961 had intensities around 10% of those of the low mass ions. In Fig. 3(b) twelve different series can be observed, where eight of them are actually four double series with a distance between the pairs of 6 m/z units, a distance which will be explained by the fragmentation mechanisms discussed below. The mass difference between the oligomers in these series was m/z units, which corresponds to the mass of one repeating unit of EtOx. Poly(2-ethyl-2-oxazoline)s have the same ethene spacing group between the heteroatom as is found in poly(ethylene glycol)s, which have already been characterized by MALDI- TOF MS/MS by several research groups. Lattimer and coworkers 26 used fast-atom bombardment (FAB) ionization to establish a 1,4-hydrogen or ethene elimination mechanism proceeding via a six-membered transition state. In these mechanisms the ethene spacing groups were only affected by the elimination of H 2 or C 2 H 4 from the backbone. Further studies by Owens et al. using MALDI-TOF MS/MS confirmed these fragmentation pathways. 27 Transfer of these 1,4-hydrogen and ethene elimination mechanisms to the PEtOx system provided two possible arrangement of the sixmembered transition state, starting from each side of the chain. The difference between the two arrangements is always the side group plus the nitrogen atom of the backbone, which causes the double series A, A 0, formed by ethene elimination, and B, B 0, formed by hydrogen elimination. These mechanisms are shown in Schemes 2(a) and 2(b). However, all the ions labeled with X could not be observed in the MS/MS spectrum. Interestingly, two of these four corresponding ions possess the same structure and, consequently, the same mass. Based on the chemical instability of these X fragments a second elimination of ethene is proposed, leading to the formation of an isocyanate group, providing an explanation for the occurrence of the third double series D, D 0 (Scheme 2(c)). An alternative mechanistic possibility is that the double series A, A 0 and B, B 0 occurs via a McLafferty rearrangement 28 (Scheme 2(d)). The characteristic step in this pathway is the migration of a hydrogen atom in the g-position to an unsaturated functional group via a six-membered cyclic transition state followed by a b-cleavage to form the double bond. A cleavage could then occur with the aid of the side chain, leading to a double bond end group and a propionic acid amide end group. This kind of rearrangement has already been described in the ESI- MS/MS of carboxylate anions 29 and the esters of N- Copyright # 2009 John Wiley & Sons, Ltd. Rapid Commun. Mass Spectrom. 2009; 23: DOI: /rcm
191 760 A. Baumgaertel et al. Scheme 2. Schematic representation of: (a) fragmentation pathway for sodiated PEtOx leading to the A and A 0 series formed by ethene elimination; (b) fragmentation pathway for sodiated PEtOx leading to the B and B 0 series formed by hydrogen elimination; (c) fragmentation pathway for sodiated PEtOx leading to the D and D 0 series formed by ethene elimination on the side chain; (d) fragmentation pathway for sodiated PEtOx leading to the series A, A 0 and B, B 0 formed by McLafferty rearrangement; and (e) fragmentation pathway for sodiated PEtOx leading to the series C and C 0 formed by a- and side-group cleavage. acetylated peptides. 30 In a complementary fashion, the double series C and C 0 could be explained by an a-cleavage of the backbone between the CH 2 groups followed by a cleavage of the side group resulting in the formation of a methylene imine end group (Scheme 2(e)). In addition to these related double series there are four additional product ion series, which can be assigned to structures that are formed by combination of the above mechanisms. The series E is explainable by ethene elimination on one side of the chain and hydrogen elimination on the other side of the chain. By performing hydrogen elimination on both sides of the chain the product ion series F can be formed. Finally, the series G and H can be explained by a combination of the a- cleavage and side-group elimination with ethene elimination for G or with hydrogen elimination for H. In addition, ions belonging to the small distributions in the MALDI-TOF MS spectrum were characterized by tandem mass spectrometry. The side product H(NCOC 2 H 5 CH 2 CH 2 ) n OH þ Na þ, emerging from chain transfer during the reaction, showed nine different product ion series in the MALDI-TOF MS/MS spectrum. These could be explained by the previously described fragmentation mechanisms, although because some of the ions formed by these mechanisms overlapped with each other only these nine series were observable. Copyright # 2009 John Wiley & Sons, Ltd. Rapid Commun. Mass Spectrom. 2009; 23: DOI: /rcm
192 Characterization of poly(2-ethyl-2-oxazoline)s 761 Scheme 2. (Continued). Copyright # 2009 John Wiley & Sons, Ltd. Rapid Commun. Mass Spectrom. 2009; 23: DOI: /rcm
193 762 A. Baumgaertel et al. The third distribution of the MS spectrum was also studied by MS/MS. Because of the two possible structures of the precursor ion, H(NCOC 2 H 5 CH 2 CH 2 ) n NCOC 2 H 4 CH 2 CH 2 þ Na þ or CHCCH 2 (NCOC 2 H 5 CH 2 CH 2 ) n NHCH 2 CH 2 OHþNa þ, fifteen different product ion series were found in the MS/MS spectrum. These series can again be explained by the fragmentation mechanisms mentioned above. CONCLUSIONS A detailed characterization of the oligo(2-ethyl-2-oxazoline) methacrylate macromonomer and the 2-ethyl-2-oxazoline polymer was performed by MALDI-TOF MS/MS, which allowed the fragmentation of single ions from the MALDI- TOF MS spectrum. The resulting product ions occurring from fragments of the two poly(2-ethyl-2-oxazoline)s could be explained by the different leaving group qualities of the end groups. Methacrylic acid possessed a high lability leaving a cationic residual poly(oxazoline) chain that depolymerized easily. In contrast, the hydroxyl end group was a poor leaving group and thus it induced a variety of fragmentation mechanisms visible in the more complex MS/ MS spectrum of this polymer. For both end groups possible fragmentation pathways like the 1,4 elimination of ethene or hydrogen or the McLafferty rearrangement were proposed and the formed structures were correlated to the obtained masses of the product ions. The knowledge obtained from this study will be used for a detailed investigation of polyoxazolines synthesized with different end groups, with varying leaving group quality, side groups, i.e. methyl, nonyl or phenyl group, and higher molar masses. These studies will lead to the construction of a MS/MS product ion library of polyoxazolines for a fast and automated analysis of homopolymers and block or random copolymers with different end and side groups of this type of synthetic polymer. Acknowledgements The authors wish to acknowledge the Dutch Polymer Institute (DPI, technology area high-throughput-experimentation) and the Thüringer Kultusministerium (Grant No. B ) for the financial support of this study. Many thanks are also expressed to Bruker Daltonics GmbH for their cooperation. REFERENCES 1. Karas M, Hillenkamp F. Anal. Chem. 1988; 60: Tanaka K, Waki H, Ido Y, Akita S, Yoshida Y, Yohida T. Rapid Commun. Mass Spectrom. 1988; 2: Hanton SD. Chem. Rev. 2001; 101: Maloney DR, Hunt KH, Lloyd PM, Muir AVG, Richards SN, Derrick PJ, Haddleton DM. J. Chem. Soc., Chem. Commun. 1995; 5: Montaudo G, Samperi F, Montaudo MS. Prog. Polym. Sci. 2006; 31: Gies AP, Vergne MJ, Orndorff RL, Hercules DM. Macromolecules 2007; 40: Suckau D, Resemann A, Schuerenberg M, Hufnagel P, Franzen J, Holle A. Anal. Bioanal. Chem. 2003; 376: Adams N, Schubert US. Adv. Drug Deliv. Rev. 2007; 59: Bassiri TG, Levy A, Litt M. J. Polym. Sci., Part B: Polym. Lett. 1967; 5: Tomalia DA, Sheetz DP. J. Polym. Sci., Part A-1: Polym. Chem. 1966; 4: Seeliger W, Aufderhaar E, Diepers W, Feinauer R, Nehring R, Thier W, Hellman H. Angew. Chem. 1966; 78: Kagiya T, Narisawa S, Maeda T, Fukui K. J. Polym. Sci., Part B: Polym. Lett. 1966; 4: Uyama H, Kobayashi S. Macromolecules 1991; 24: Groß A, Maier G, Nuyken O. Macromol. Chem. Phys. 1996; 197: Hoogenboom R, Schubert US. Macromol. Rapid Commun. 2007; 28: Wiesbrock F, Hoogenboom R, Schubert US. Macromol. Rapid. Commun. 2004; 25: Wiesbrock F, Hoogenboom R, Leenen M, Van Nispen SFGM, Van der Loop M, Abeln CH, Van den Berg AMJ, Schubert US. Macromolecules 2005; 38: Hoogenboom R, Fijten MWM, Meier MAR, Schubert US. Macromol. Rapid Commun. 2003; 24: Meier MAR, Hoogenboom R, Fijten MWM, Schneider M, Schubert US. J. Comb. Chem. 2003; 5: Weber C. Diploma thesis, University of Jena, Raeder HJ, Schrepp W. Acta Polym. 1998; 49: Fijten MWM, Haensch C, Van Lankvelt BM, Hoogenboom R, Schubert US. Macromol. Chem. Phys. 2008; 209: Weber C, Becer CR, Baumgaertel A, Hoogenboom R, Schubert US. Des. Monomers Polym. 2009; in press. 24. Schubert US, Eschbaumer C. J. Incl. Phenom. 1999; 35: Ultraflex III User Manual, version 1.0, September, Selby TL, Wesdemiotis C, Lattimer RP. J. Am. Soc. Mass Spectrom. 1994; 5: Hoteling AJ, Kawaoka K, Goodberlet MC, Yu WM, Owens KG. Rapid Commun. Mass Spectrom. 2003; 17: McLafferty FW, Tureček F. Interpretation von Massenspektren. Spektrum Akademischer Verlag: Heidelberg, Grossert JS, Cook MC, White RL. Rapid Commun. Mass Spectrom. 2006; 20: Anbalagan V, Patel JN, Niyakorn G, Van Stipdonk MJ. Rapid Commun. Mass Spectrom. 2003; 17: 291. Copyright # 2009 John Wiley & Sons, Ltd. Rapid Commun. Mass Spectrom. 2009; 23: DOI: /rcm
194
195 Publication P7: Macromol. Chem. Phys
196
197 Full Paper Linear Polyethyleneimine: Optimized Synthesis and Characterization On the Way to Pharmagrade Batches Lutz Tauhardt, Kristian Kempe, Katrin Knop, Esra Altuntaş, Michael Jäger, Stephanie Schubert, Dagmar Fischer, Ulrich S. Schubert* The synthesis of linear polyethyleneimine (LPEI) by acidic hydrolysis of poly(2-ethyl-2-oxazoline) is studied and optimized to reach the highest degree of hydrolysis within the shortest time range using a microwave synthesizer. In addition, the purification procedure is significantly improved; the fast batch processing combined with an excellent control of the actual heating time represents a well-suited alternative to the conventional synthesis on the way to pharmagrade PEI. The developed protocol for the preparation of methyl and proton-initiated LPEIs shows a high reproducibility, and the identity and purity of the LPEIs is proven by means of 1 H NMR and IR spectroscopy as well as MALDI-TOF- and ESI-Q- TOF-MS. Introduction Polyethyleneimines (PEIs) are available in two forms as branched polyethyleneimine (BPEI) and linear polyethyleneimine (LPEI). Both are of highest interest in pharmaceutical research as polymeric vectors for gene delivery as they can electrostatically interact with negatively charged molecules like DNA and RNA. [1] PEIs with a high molar mass and a high degree of branching demonstrated the formation of small and enzymatically stable polyplexes with nucleic acids with a high cell uptake and therapeutic activity. L. Tauhardt, K. Kempe, K. Knop, E. Altuntaş, Dr. M. Jäger, Prof. U. S. Schubert Laboratory of Organic and Macromolecular Chemistry (IOMC) and Jena Center for Soft Matter (JCSM), Friedrich-Schiller-University Jena, Humboldtstraße 10, Jena, Germany ulrich.schubert@uni-jena.de K. Knop, Dr. M. Jäger, Prof. U. S. Schubert Dutch Polymer Institute (DPI), P.O. Box 902, 5600 AX Eindhoven, The Netherlands Dr. S. Schubert, Prof. D. Fischer Department of Pharmaceutical Technology and Jena Center for Soft Matter (JCSM), Institute of Pharmacy, Friedrich-Schiller- University Jena, Otto-Schott-Straße 41, Jena, Germany However, their in vivo and clinical administration were limited due to cytotoxic effects and a low hemocompatibility. [1e] Although LPEIs with comparable molar masses were less effective in condensation of nucleic acids, they were found to be more suitable for in vivo applications due to a reduced toxicity and a higher transfection efficiency compared to the branched form. [2] Some of the commercially available LPEIs (e.g., ExGen500, jetpei) already reached clinical trials, e.g. for the local treatments of bladder carcinoma and HIV disease. [3] Beside its important role in gene delivery, PEI has some other applications. Based on its ability to form complexes with anionic species, metal complexes, or metal ions, PEI represents an interesting material for technical applications. On account of its chelating properties, PEI is used in waste water treatment for removing heavy metal ions and in hydrometallurgy for the recovery of noble metals. [4] Another field of application of PEI lays in the paper industry, where it is used for the fixation of pigments, as flocculation aid, [5] and as retention agent to improve the wet strength of paper (Epomin, Polymin). LPEI can be synthesized by the polymerization of N- substituted aziridines and their subsequent hydrolysis. [6] The more common method, though, is to obtain LPEI by the 1918 Macromol. Chem. Phys. 2011, 212, ß 2011 WILEY-VCH Verlag GmbH & Co. KGaA, Weinheim wileyonlinelibrary.com DOI: /macp
198 Linear Polyethyleneimine: Optimized Synthesis and Characterization... acidic [7] or basic [8] hydrolysis of poly(2-oxazoline)s. The living character of the cationic ring-opening polymerization (CROP) of 2-oxazolines allows the preparation of welldefined LPEIs with narrow molar mass distributions. Commercially available LPEIs, e.g. from Polysciences or Polyplus Transfection (jetpei), are commonly synthesized by acidic hydrolysis of methyl-initiated poly(2-ethyl-2- oxazoline) (PEtOx). [9] However, with reaction times ranging from a few hours up to several days [7c] the acidic hydrolysis of poly(2-oxazoline)s proceeds very slowly. The basic hydrolysis is even slower. [10] More recently, the acceleration of the acidic hydrolysis under microwave irradiation was demonstrated by Schubert et al. [7a] Nevertheless, the reaction conditions were not optimized to reach full hydrolysis to LPEI within the shortest reaction time but rather to prepare partially hydrolyzed poly(2-methyl-2- oxazoline)s and poly(2-ethyl-2-oxazoline)s. Since the degree of hydrolysis significantly influences the transfection efficiency, [1d] a defined and also full degree of hydrolysis is preferred for pharmaceutical and clinical applications. Here, we report the optimization of the hydrolysis conditions of PEtOx using a microwave synthesizer with an autosampler and an improved purification procedure. These techniques were modified on the one hand with regard to reproducibility and controllability. On the other hand, the methods were upscaled to produce PEIs of defined quality in the range of several grams. Moreover, two differently initiated LPEIs, i.e., a methyl- and a protoninitiated, were prepared by acidic hydrolysis of methyl- (1) or proton- (2) initiated PEtOx. The methyl-initiated LPEI (3) contains only secondary amino groups, the proton-initiated LPEI (4) exhibits one primary amino group, which allows selective end group functionalization. The differently initiated LPEIs were characterized by proton nuclear magnetic resonance ( 1 H NMR) and infrared (IR) spectroscopy as well as matrix-assisted laser desorption/ionization (MALDI) and electrospray ionization (ESI) time-of-flight (TOF) mass spectrometry (MS). Such an intense structural characterization is essential on the way to pharmagrade PEI since up to now only very limited information and protocols, and even less data sheets are available. Consequently, a highly reproducible, time- and yield efficient synthesis protocol allows the preparation of well-defined and in-depth characterized LPEI batches that ensure the absence of impurities and the constancy in structure and, thus, properties. Experimental Section Chemicals and Instrumentation 2-Ethyl-2-oxazoline and methyl tosylate were obtained from Acros Organics, distilled to dryness over barium oxide (BaO), and stored under argon. Acetonitrile was purchased from Sigma-Aldrich. An Initiator Sixty single-mode microwave synthesizer from Biotage, equipped with a noninvasive IR sensor (accuracy: 2%), was used for polymerizations and hydrolyses under microwave irradiation. 1 H NMR spectra were recorded on a Bruker AC 300 MHz at 298 K. Chemical shifts are reported in parts per million (ppm, d scale) relative to the residual signal of the deuterated solvent. ESI- Quadrupole-TOF-MS measurements were performed with a microtof Q-II (Bruker Daltonics) mass spectrometer. The ESI-Q- TOF mass spectrometer was operating at 4.5 kv, at a desolvation temperature of 180 8C, and in the positive ion mode. Methanol or methanol/water mixtures were used as solvents. The ESI-Q-TOF- MS instrument was calibrated in the m/z range using an internal calibration standard (Tunemix solution), which was supplied from Agilent. The MALDI-TOF-MS spectra were measured on an Ultraflex III TOF/TOF (Bruker Daltonics GmbH, Bremen, Germany). The instrument was equipped with a frequency-tripled Nd:YAG operating at a wavelength of 355 nm. All spectra were measured in the positive reflector mode. For the sample preparation 1 ml of PEI (10 mg ml 1 ) and 10 ml of 2,5-dihydroxybenzoic acid (DHB) (10 mg ml 1 ), both dissolved in methanol, were mixed. One microliter of this solution was applied to the target using the dried-droplet method. The IR spectra were recorded on a FT-IR spectrometer IRAffinity-1 (Shimadzu). Size-exclusion chromatography (SEC) of the PEtOxs was measured on a Shimadzu system equipped with a SCL-10A system controller, a LC-10AD pump, and a RID-10A refractive index detector using a solvent mixture containing chloroform, triethylamine, and isopropyl alcohol (94:4:2) at a flow rate of 1 ml min 1 on a PSS-SDV-linear M 5 lm column at room temperature. The system was calibrated with polystyrene ( g mol 1 ) standards. Synthesis of LPEI The PEtOxs used in this study as starting materials for the preparation of LPEI were synthesized according to literature. [11] The polymerization of 2-ethyl-2-oxazoline was performed at 140 8C in a microwave synthesizer using methyl tosylate or p-toluenesulfonic acid as initiator and acetonitrile as solvent. PEtOxs with molar masses between M n ¼ 1000g mol 1 and M n ¼ g mol 1 and low polydispersity index values (PDI 1.3) were synthesized. As a general method, methyl- (1) or proton-initiated (2) PEtOxs were treated with an excess of 6 M aqueous HCl for different periods of time at 100 and 130 8C in a flask and a microwave synthesizer, respectively. The acid was removed under reduced pressure, and the residue was dissolved in water followed by the addition of 3 M NaOH until precipitation occurred. The LPEI was filtered off, recrystallized from water, dissolved in methanol or N,N-dimethylformamide (DMF), and precipitated into ice-cold diethyl ether. The white precipitate was filtered off and dried in vacuo at 40 8C (methanol) or 60 8C (DMF) for 5 d. The purity and the degree of hydrolysis of the resulting LPEI 3 (methyl-initiated) and 4 (protoninitiated) were determined by 1 H NMR spectroscopy. Optimized Synthesis Protocol For the production of pharmagrade LPEI, the following optimized synthesis protocol was established: The PEtOx 1 or 2 (5 g) was dissolved in 15 ml of 6 M aqueous HCl and heated in a microwave Macromol. Chem. Phys. 2011, 212, ß 2011 WILEY-VCH Verlag GmbH & Co. KGaA, Weinheim 1919
199 L. Tauhardt et al. synthesizer for 1 h. The acid was removed by vacuum distillation (30 mbar) at 130 8C. The residue was dissolved in water (50 ml), and 3 M aqueous NaOH was added until precipitation occurred. The LPEI was filtered off and recrystallized from water (80 ml). After filtration, the LPEI was dissolved in methanol (40 ml) and precipitated into ice-cold diethyl ether (400 ml). The white precipitate was filtered off and dried in vacuo at 40 8C for 5 d. The purity and the degree of hydrolysis of the resulting LPEI 3 or 4 were determined by 1 H NMR spectroscopy. Scheme 1. Schematic representation of the synthesis of the different LPEIs. Methyl-Initiated LPEI (3) 1 H NMR (300 MHz, CD 3 OD): d ¼ 3.65 (t, CH 2 OH), 2.73 (br., NCH 2 ), 2.39 (s, CH 3 N). IR (FT-IR): n ¼ (NH), (CH 3 ), (CH), (CH 2 /CH 3 ), (CN), (CN), (CN) cm 1. Proton-Initiated LPEI (4) 1 H NMR (300 MHz, CD 3 OD): d ¼ 3.65 (t, CH 2 OH), 2.73 (br., NCH 2 ). IR (FT-IR): n ¼ (NH 2 ), (NH), (NH 2 ), (CH 3 ), (CH), (NH), (CH 2 /CH 3 ), (CN), (CN) cm 1. uncleaved even by elongation of the reaction time to 26 h. The incomplete hydrolysis is assigned to the precipitation of the LPEI hydrochloride, which is formed during the reaction. The LPEIs obtained after neutralization with base were soluble in warm water, DMF, and methanol; and insoluble in chloroform, diethyl ether, and dichloromethane. The long reaction times of several hours required an optimization of the reaction conditions in a microwave synthesizer. Optimized Synthesis of LPEI Results and Discussion Conventional Synthesis of LPEI in a Flask Using Oil- Bath Heating The usage of microwave synthesizers is beneficial for the acceleration of the hydrolysis, as already reported. [7a] Based on this previous study, the hydrolysis conditions were further optimized. The usage of a microwave synthesizer enables heating of solvents above their actual boiling points resulting in shorter reaction times. Furthermore, it allows an excellent control of the heating time and rate. Therefore, the synthesis becomes tunable and also highly reproducible, which is important with respect to the pharmaceutical application of LPEI that requires a certified method for the preparation. LPEI can be obtained by acidic [7] or basic [8] hydrolysis of poly(2-oxazoline)s. Since the acidic hydrolysis proceeds much faster than the basic hydrolysis, [10] the acidic treatment was chosen to synthesize LPEI. In a first set of experiments, PEtOx was heated with an excess of 6 M HCl overnight at 100 8C in a flask. LPEIs with two different starting groups, i.e., a methyl group (3) and a proton (4), and different molar masses were synthesized using this approach (Scheme 1). To the best of our knowledge, it is the first report of a proton-initiated LPEI. The primary amino group renders the possibility for selective end group functionalization. A detailed analysis of the differently initiated LPEIs is feasible by means of 1 H NMR spectroscopy (Figure 1). For both types of LPEI, a triplet at d ¼ 1.13 can be observed. This signal belongs to the methyl group of uncleaved PEtOx side chains. By correlating the integrals of the methyl proton signal of the uncleaved side chain (d ¼ 1.13) and the protons of the LPEI backbone (d ¼ 2.73), the degree of hydrolysis can be determined within the limits of the 1 H NMR accuracy (98% after 18 h). About 1% of the PEtOx remained Figure 1. 1 H NMR spectra of the different LPEIs (300 MHz, CD 3 OD) Macromol. Chem. Phys. 2011, 212, ß 2011 WILEY-VCH Verlag GmbH & Co. KGaA, Weinheim
200 Linear Polyethyleneimine: Optimized Synthesis and Characterization... Table 1. Degree of hydrolysis of 1 (n ¼ 20) under different hydrolysis conditions in a microwave synthesizer. Entry Condition a) Time [h] Temperature [-C] Degree of hydrolysis b) [%] A acidic B acidic C acidic D acidic E acidic 1/ F basic 1/ G basic a) Acidic: 6 M aqueous HCl, basic: 3 M aqueous NaOH; b) Determined by 1 H NMR spectroscopy. For the present study, 100 mg of PEtOx 1 (2 000 g mol 1, n ¼ 20) were dissolved in 4 ml of 6 M HCl and heated in a microwave synthesizer. The degree of hydrolysis of the product was determined by 1 H NMR spectroscopy (Table 1). In a first run, compound 1 (2 000 g mol 1, n ¼ 20) was hydrolyzed in a microwave synthesizer for 7 h at 150 and 130 8C (entries A and B), respectively, to yield product 3 (890 g mol 1, n ¼ 20). Both samples showed no difference in their 1 H NMR and MALDI-TOF mass spectra, and a degree of hydrolysis above 99% was calculated. Since the reaction was finished after 7 h, the time dependency of the hydrolysis was investigated in more detail. A test reaction at 150 8C and 1 h reaction time resulted in the same degree of hydrolysis (>99%) as for 7 h (entry C). For the reaction at 130 8C, different hydrolysis times were studied (entries D and E). After 0.5 h 2% of the PEtOx side chains were still uncleaved. Extension to 1 h yielded the maximum degree of hydrolysis (>99%). Longer reaction times did not increase the degree of hydrolysis further. It should be noted that in no event a full PEtOx side chain cleavage could be achieved. Hence, the optimal hydrolysis condition reaching the maximum side chain cleavage within the shortest time is 1 h at 130 8C. Compared to the methods described in literature so far, the reaction time could be significantly reduced. The optimized microwave-assisted synthesis protocol (130 8C) was used for the synthesis of the LPEIs with molar masses between 430 and g mol 1. The protocol could also be applied for the preparation of proton-initiated LPEI (4). In addition, commercially available PEtOx (Aldrich, M w ¼ g mol 1 ) was hydrolyzed using the microwave-assisted synthesis protocol. 98% of the PEtOx side chains were cleaved within 1 h. Again, prolonged reaction times did not further increase the degree of hydrolysis. However, a subsequent second hydrolysis step increased the degree of hydrolysis slightly from 98 to 99%. Interestingly, commercially available LPEIs exhibit a much lower degree of hydrolysis, e.g. 90% for LPEI g mol 1 (Polyscience) and 96% for LPEI g mol 1 (Polyscience), according to the 1 H NMR measurement protocol described above. The method established can be applied for a maximum concentration of 0.33 g PEtOx per ml 6 M HCl. At this point, the solubility limit of PEtOx in HCl at room temperature was reached. By using an Initiator Sixty single-mode microwave synthesizer from Biotage, the maximum in reaction volume was limited to 15 ml of stock solution (0.33 g PEtOx per ml 6 M HCl). It is thus possible to hydrolyze 5 g of PEtOx within 1 h, yielding about 2 g of LPEI. The autosampler can handle 24 microwave vials automatically. Due to the limited batch size, the time saving compared to the preparation in the flask is lost in cases of amounts larger than 48 g LPEI to be synthesized. This problem might be overcome by using microwave synthesizers with larger batches or continuous flow microwave reactors. When the concentration was increased to 0.67 g PEtOx per ml of 6 M HCl, the degree of hydrolysis decreased to 87% after 1 h reaction time. Compared to the fast acidic hydrolysis conditions established above, the basic hydrolysis of PEtOx with 3 M NaOH at 130 8C in a microwave synthesizer proceeded much slower resulting in a degree of cleavage of only 12% after 10 min (entry F). The degree of hydrolysis remained constant even after 2 h reaction time (entry G). This behavior is attributed to the phase separation within the reaction mixture. Optimized Purification Protocol For the use of LPEI for polyplex formation in gene delivery, a high purity is essential. In addition, the detailed characterization of the polymer structure, including end group analysis by MALDI-TOF- and ESI-Q-TOF-MS, requires an improved purification procedure. The main impurities are salts. LPEI is known to form complexes with salts (e.g., NaI), [12] which can influence the MS spectra. Thus, the influence of different bases used for the purification of LPEI Macromol. Chem. Phys. 2011, 212, ß 2011 WILEY-VCH Verlag GmbH & Co. KGaA, Weinheim 1921
201 L. Tauhardt et al. Figure 2. MALDI-TOF-MS spectra of LPEI before (top) and after (bottom) precipitation in diethyl ether (matrix: DHB). on the resulting MS spectra was investigated, and the purification protocol was optimized. LPEI was prepared as described above and precipitated using the following bases: NaOH, KOH, LiOH, Cs 2 CO 3. Analysis by 1 H NMR spectroscopy and MALDI-TOF-MS showed no significant difference between the samples; no influence of the utilized base could be observed. However, the MALDI mass spectra revealed a complex pattern of overlapping peaks preventing a detailed analysis (Figure 2 top). A second recrystallization from water did not improve the quality of the spectra. Nevertheless, for the analysis of differently functionalized LPEIs it is necessary to obtain interpretable MALDI mass spectra for the end group determination. Therefore, the optimization of the purification procedure was investigated. Since DMF is known to dissolve salts readily, the LPEI was dissolved in DMF and precipitated in a large excess of icecold diethyl ether instead of drying directly after the recrystallization from water. The effect of this step on the MALDI-TOF mass spectrum was remarkable (Figure 2 bottom). A disadvantage of this method was the usage of DMF as solvent. High drying temperatures and long drying periods were required to remove DMF completely, even under high vacuum conditions. To overcome this problem, methanol was used to dissolve the LPEI for precipitation in ice-cold diethyl ether. Consequently, the product can be dried in vacuo at 40 8C. 1 H NMR spectroscopy as well as ESI- Q-TOF-MS and MALDI-TOF-MS showed no differences to the results of the DMF route. The purity was proven by 1 H NMR spectroscopy indicating no solvent signals after drying for 5 d at 40 8C in vacuo. Characterization of the LPEIs by MALDI-TOF and ESI-Q-TOF-MS The different LPEIs were characterized by MALDI-TOF as already described for the methyl-initiated LPEI in literature. [7a] In addition, ESI-Q-TOF-MS studies were performed since less fragmentation products, compared to MALDI- TOF-MS measurements, were expected. Caffeic acid (CA) and 2,5-dihydroxybenzoic acid (DHB) without salt addition proved to be the most suitable matrices for LPEIs, as described previously. [13] Although DHB required higher laser intensities, the resolution of the peaks as well as the signal/noise ratio were found to be superior to the results obtained by CA. Hence, all measurements were performed using DHB. For the ESI-Q-TOF-MS measurements, the LPEIs were dissolved in methanol or in a methanol/water mixture. In both MALDI-TOF and ESI-Q-TOF mass spectra, distributions for the sodium and the proton adduct of LPEI were found. In contrast to the MALDI mass spectra, which showed only singly charged ions, singly (þ1) and doubly (þ2) charged ionic species appeared in the ESI mass spectra, as depicted in Figure 3. An expanded region of the mass spectra of LPEI 3 (M n ¼ 860 g mol 1, n ¼ 20) is shown in Figure 4. Six of the distributions were assigned to the displayed structures. As expected, proton and sodium adducts of the reaction product could be detected as well as two differently initiated species. The methyl-initiated species derive from the initiation of the polymerization with methyl tosylate. In addition, proton-initiated species, formed by chain transfer reactions occurring during the polymerization of PEtOx, were observed. [14] Moreover, the MALDI-TOF and the ESI-Q-TOF mass spectra showed a species bearing an uncleaved PEtOx side chain. This supports the previous assignment of the triplet at d ¼ 1.13 in the 1 H NMR spectrum. Both MALDI-TOF and ESI-Q-TOF mass spectra showed in principle the same peaks although in the ESI mass spectrum the proton-initiated species in LPEI 3 were hardly visible. Simple MALDI-TOF and ESI-Q-TOF mass spectra were obtained for the proton-initiated LPEI 4 (M n ¼ 660 g mol 1, n ¼ 15) (Figure 5). Both ESI-Q-TOF and MALDI-TOF mass spectra showed the same peaks. No signals for methylinitiated LPEI were visible since p-toluenesulfonic acid was 1922 Macromol. Chem. Phys. 2011, 212, ß 2011 WILEY-VCH Verlag GmbH & Co. KGaA, Weinheim
202 Linear Polyethyleneimine: Optimized Synthesis and Characterization... Figure 3. (a) MALDI-TOF-MS and (b) ESI-Q-TOF-MS (straight line: double, dotted line: single charged species) of LPEI 3 (860 g mol 1, n ¼ 20). used as initiator for the polymerization of the PEtOx. For three of the distributions, corresponding structures could be assigned. In accordance to the spectra of LPEI 3, a distribution for LPEI with an uncleaved PEtOx side chain was found. The unassigned peaks (mainly in the MALDI- TOF-MS spectrum) belong to fragmentation products. A detailed study on the fragmentation and composition will be published elsewhere. [15] For the hydrolysis performed in both flask and microwave synthesizer, comparable spectra were obtained following the optimized purification protocol. Since LPEI is a polycation, there is a problem analyzing higher molar masses with ESI-Q-TOF and MALDI-TOF-MS. For high-molar-mass LPEIs, there are numerous multiply charged species, making the ESI-Q-TOF mass spectra very complicated. By means of MALDI-TOF-MS only singly charged species can be detected. Therefore, it is hard to obtain spectra of the multiply charged polycation LPEI, when the degree of polymerization is too large. Conclusion Figure 4. Expanded region of the MALDI- (top) and the ESI-Q-TOF mass spectra (bottom) as well as structural assignments for the different distributions of LPEI 3 (860 g mol 1, n ¼ 20). In conclusion, both the hydrolysis in a flask and in a microwave synthesizer results in a degree of hydrolysis above 99%. LPEIs with different molar masses (430 g mol 1 to g mol 1 ) were synthesized using both methods. However, compared to the conventional heating in a flask, the hydrolysis in a microwave synthesizer proceeded much faster. Since the batch processing is automated, it is possible to synthesize larger amounts of LPEI. The fast and efficient hydrolysis and the good heat distribution render the microwave synthesizer to be very energy saving, compared to conventional heating in a flask. Further advantages of a microwave synthesizer are the excellent control of the heating rate and time, making the hydrolysis highly controllable and reproducible. This is important with respect to the development of a certified synthesis method for larger amounts of pharmagrade LPEI. The synthesis conditions were optimized to obtain the maximum of side chain cleavage (99%) within the shortest time range. Although incomplete cleavage (<1%) was obtained even by increasing the reaction time and the temperature, the best and most efficient hydrolysis conditions were found to be 130 8C for 1 h using a microwave synthesizer. The maximum concentration of PEtOx, which can be hydrolyzed, was found to be 0.33 g PEtOx per ml 6 M hydrochloric acid. An increase of the concentration led to a decrease of the degree of hydrolysis. A methyl and a proton-initiated LPEI were prepared via the improved protocol. Several parameters, which can be used as specification for a pharmagrade pro- Macromol. Chem. Phys. 2011, 212, ß 2011 WILEY-VCH Verlag GmbH & Co. KGaA, Weinheim 1923
203 L. Tauhardt et al. Figure 5. Expanded region of the MALDI- (top) and the ESI-Q-TOF mass spectra (bottom) as well as structural assignments for the different distributions of the proton-initiated LPEI 4 (M n ¼ 660 g mol 1, n ¼ 15). duction of LPEI, were identified and systematically investigated. The developed protocol showed a high reproducibility, and the identity and purity of the LPEIs was proven by means of 1 H NMR and IR spectroscopy as well as MALDI-TOF- and ESI-Q-TOF-MS. To the best of our knowledge, this contribution contains the first report of a proton-initiated LPEI. The primary amino group of 4 enables the possibility of a selective end group functionalization of the LPEI. Acknowledgements: The authors thank the Thuringian Ministry for Education, Science and Culture (grant #B , Nano- ConSens) and the Dutch Polymer Institute for financial support. K.K. is grateful to the Landesgraduiertenförderung for financial support. Received: March 29, 2011; Revised: May 9, 2011; Published online: June 30, 2011; DOI: /macp Keywords: electrospray ionization mass spectrometry; hydrolysis; linear polyethyleneimine; matrix-assisted laser desorption/ ionization mass spectrometry (MALDI-TOF MS); poly(2-ethyl-2- oxazoline)s [1] [1a] O. Boussif, F. Lezoualc h, M. A. Zanta, M. D. Mergny, D. Scherman, B. Demeneix, J. P. Behr, Proc. Natl. Acad. Sci. USA 1995, 92, 7297; [1b] B. Brissault, A. Kichler, C. Guis, C. Leborgne, O. Danos, H. Cheradame, Bioconjugate Chem. 2003, 14, 581; [1c] W. T. Godbey, M. A. Barry, P. Saggau, K. K. Wu, A. G. Mikos, J. Biomed. Mater. Res. 2000, 51, 321; [1d] J. H. Jeong, S. H. Song, D. W. Lim, H. Lee, T. G. Park, J. Controlled Release 2001, 73, 391; [1e] M. Neu, D. Fischer, T. Kissel, J. Gene Med. 2005, 7, 992. [2] [2a] D. Fischer, A. von Harpe, K. Kunath, H. Petersen, Y. Li, T. Kissel, Bioconjugate Chem. 2002, 13, 1124; [2b] M. H. Louis, S. Dutoit, Y. Denoux, P. Erbacher, E. Deslandes, J. P. Behr, P. Gauduchon, L. Poulain, Cancer Gene Ther. 2005, 13, 367; [2c] L. Wightman, R. Kircheis, V. Rössler, S. Carotta, R. Ruzicka, M. Kursa, E. Wagner, J. Gene Med. 2001, 3, 362; [2d] J. W. Wiseman, C. A. Goddard, D. McLelland, W. H. Colledge, Gene Ther. 2003, 10, [3] [3a] E. R. Toke, O. Lorincz, E. Somogyi, J. Lisziewicz, Int. J. Pharm. 2010, 392, 261; [3b] M. A. Mintzer, E. E. Simanek, Chem. Rev. 2008, 109, 259. [4] [4a] S. Kobayashi, K. Hiroishi, M. Tokunoh, T. Saegusa, Macromolecules 1987, 20, 1496; [4b] A. von Zelewsky, L. Barbosa, C. W. Schläpfer, Coord. Chem. Rev. 1993, 123, 229; [4c] E. Bayer, B. Y. Spivakov, K. Geckeler, Polym. Bull. 1985, 13, 307. [5] B. A. Bolto, Prog. Polym. Sci. 1995, 20, 987. [6] K. F. Weyts, E. J. Goethals, Polym. Bull. 1988, 19, 13. [7] [7a] H. M. L. Lambermont-Thijs, F. S. van der Woerdt, A. Baumgaertel, L. Bonami, F. E. Du Prez, U. S. Schubert, R. Hoogenboom, Macromolecules 2010, 43, 927; [7b] M. H. Litt, C. S. Lin, J. Polym. Sci., Part A: Polym. Chem. 1992, 30, 779; [7c] R. Tanaka, I. Ueoka, Y. Takaki, K. Kataoka, S. Saito, Macromolecules 1983, 16, 849. [8] [8a] J. Bartulín, B. L. Rivas, M. Rodríguez-Baeza, U. Angne, Makromol. Chem. 1982, 183, 2935; [8b] T. Saegusa, H. Ikeda, H. Fujii, Polym. J. 1972, 3, 35. [9] US (2010), Polyplus Transfection (Ilkirch Graffenstaden, FR), invs.: A. Adib, F. Stock, P. Erbacher. [10] K. M. Kem, J. Polym. Sci.: Polym. Chem. Ed. 1979, 17, [11] R. Hoogenboom, R. M. Paulus, Å. Pilotti, U. S. Schubert, Macromol. Rapid Commun. 2006, 27, [12] C. K. Chiang, G. T. Davis, C. A. Harding, T. Takahashi, Macromolecules 1985, 18, 825. [13] J. E. Girard, M. Konaklieva, J. Gu, C. M. Guttman, S. J. Wetzel, Proceedings of the 51st ASMS Conference on Mass Spectrometry and Allied Products, Montreal (Canada), [14] [14a] A. Levy, M. Litt, J. Polym. Sci. [A1]: Polym. Chem. 1968, 6, 1883; [14b] M. Litt, A. Levy, J. Herz, J. Macromol. Sci. A: Pure Appl. Chem. 1975, 9, 703. [15] E. Altuntaş, K. Knop, L. Tauhardt, K. Kempe, A. Crecelius, M. Jäger, M. Hager, U. S. Schubert, unpublished Macromol. Chem. Phys. 2011, 212, ß 2011 WILEY-VCH Verlag GmbH & Co. KGaA, Weinheim
204

205 Publication P8: J. Mass Spectrom
206
207 Research Article Received: 16 May 2011 Revised: 13 November 2011 Accepted: 17 January 2011 Published online in Wiley Online Library (wileyonlinelibrary.com) DOI /jms.2032 Tandem mass spectrometry of poly(ethylene imine)s by electrospray ionization (ESI) and matrix-assisted laser desorption/ionization (MALDI) Esra Altuntaş, a,b Katrin Knop, a,b,c Lutz Tauhardt, a,b Kristian Kempe, a,b Anna C. Crecelius, a,b,c Michael Jäger, a,b Martin D. Hager a,b and Ulrich S. Schubert a,b,c * In this contribution, linear poly(ethylene imine) (PEI) polymers, which are of importance in gene delivery, are investigated in detail by using electrospray ionization-quadrupole-time of flight (ESI-Q-TOF) and matrix-assisted laser desorption/ionization-time of flight (MALDI-TOF) mass spectrometry (MS). The analyzed PEIs with different end groups were synthesized using the polymerization of substituted 2-oxazoline via a living cationic ring-opening polymerization (CROP) and a subsequent hydrolysis under acidic conditions. The main goal of this study was to identify linear PEI polymers in a detailed way to gain information about their fragmentation pathways. For this purpose, a detailed characterization of three different linear PEIs was performed by using ESI-Q-TOF and MALDI-TOF MS in combination with collision-induced dissociation (CID) experiments. In ESI-MS as well as MALDI-MS analysis, the obtained spectra of PEIs resulted in fitting mass distributions for the investigated PEIs. In the tandem MS analysis, a 1,2-hydride shift with a charge-remote rearrangement via a four-membered cyclic transition state, as well as charge-induced fragmentation reactions, was proposed as the main fragmentation mechanisms according to the obtained fragmentation products from the protonated parent peaks. In addition, heterolytic and homolytic cleavages were proposed as alternative fragmentation pathways. Moreover, a 1,4-hydrogen elimination was proposed to explain different fragmentation products obtained from the sodiated parent peaks. Copyright 2012 John Wiley & Sons, Ltd. Supporting information may be found in the online version of this article. Keywords: tandem mass spectrometry; poly(ethylene imine)s; collision-induced dissociation; fragmentation mechanism; electrospray ionization INTRODUCTION Poly(ethylene imine)s (PEIs) represent an important class of cationic polymers that are widely used in different industrial processes such as paper production, shampoo manufacturing, textile industry, water purification, and in the preparation of electrochemical sensors. However, the most current scientifically interesting topic is related to the usage of PEI as a complexation agent for negatively charged DNAandRNAingenedelivery. [1 8] There are several ways to synthesize PEIs, such as the cationic ring-opening polymerization (CROP) of aziridine by a Lewis acid leading to branched PEIs, [9] the controlled polymerization of N-substituted aziridines (which avoids branching reactions), [10] and the polymerization of substituted 2-oxazoline via the living CROP and the subsequent hydrolysis under acidic or basic conditions that yields strictly linear PEIs. [11 16] The living CROP of 2-oxazolines (Ox), and the subsequent hydrolyis of the resulting poly(2-oxazoline)s (POx) enables the possibility to synthesize welldefined linear poly(ethylene imine)s with a narrow molar mass distribution. Saegusa et al. published the first detailed synthesis and characterization study of linear PEIs starting from the living CROP of Ox and the subsequent hydrolysis of obtained POx under alkaline conditions. Our group recently published several contributions dealing with the synthesis of PEI homopolymers and copolymers for different possible applications such as temperature and ph responsive micelles. [14,15] A large number of studies have been performed on PEI/DNA complexes to investigate the correlation between the transfection efficiency and different characteristics of the PEI polymer, such as purity, molar mass, and architecture (linear and branched). Molar mass has been found to have a significant impact on the transfection efficiency; an increased transfection efficiency is reached with increased molar mass of PEIs. [17 22] However, the toxicity of PEI increases with a prolonged chain length of PEI; hence, the optimal molar mass that provides * Correspondence to: Ulrich S. Schubert, Laboratory of Organic and Macromolecular Chemistry (IOMC), Friedrich-Schiller-Universität Jena, Humboldtstrasse 10, Jena, Germany. ulrich.schubert@uni-jena.de a Laboratory of Organic and Macromolecular Chemistry (IOMC), Friedrich-Schiller- Universität Jena, Humboldtstrasse 10, Jena, Germany b Jena Center for Soft Matter (JCSM), Friedrich-Schiller-Universität Jena, Humboldtstrasse 10, Jena, Germany c Dutch Polymer Institute (DPI), P.O. Box 902, 5600 AX Eindhoven, The Netherlands 105 J. Mass. Spectrom. 2012, 47, Copyright 2012 John Wiley & Sons, Ltd.
208 E. Altuntaş et al. 106 low toxicity but high transfection efficiency has to be elucidated. The in vivo application of PEI requires a pure and well-defined material to obtain reproducible transfection efficiency results and to minimize the immunological response of the body to the cationic polymer. Therefore, a controlled synthesis and a detailed characterization of these macromolecules have tremendous importance because of its biological usage. Mass spectrometry, combined with soft ionization techniques such as electrospray ionization mass spectrometry (ESI-MS) [23] and matrix-assisted laser desorption/ionization mass spectrometry (MALDI-MS), [24,25] has been widely utilized for the characterization of different polymer samples. Although each method involve different processes in ion formation, both techniques generally allow the ionization of various macromolecules with little or no fragmentation, enabling an accurate molar mass determination by making the unfragmented structure amenable to mass separation. Both techniques are frequently used for the characterization of different polymers for various purposes, such as to determine the accurate molar mass distributions of polymers, to analyze initiating and terminating end groups of different polymers, to study polymerization mechanisms and kinetics, to determine the initiator efficiency in radical polymerizations, to quantify the efficiency of photoinitiation processes in free radical polymerizations, and to identify the degradation products of different polymers. [26 36] The interfacing of these soft ionization methods with collision-induced dissociation (CID) or post-source decay (PSD) methods presents a modern powerful technique for the detailed structural characterization of polymers including the investigation of the sequence and molecular architecture in copolymers. [37 49] Despite the utmost importance of PEI, for transfection applications, only very few detailed characterizations of this material were reported up-to-date. Furthermore, mass spectrometric analyses of PEI are quite rare. This fact could be caused by the multiple charges of this polymer, which render it very suitable for complexation with negatively charged DNA but also introduces additional challenges in the MS characterization. For this study, PEIs were synthesized with different end groups by using the living CROP of 2-ethyl- 2-oxazoline (EtOx) and subsequent hydrolysis under acidic conditions. The main goal was to identify these PEI polymers with different instrumentations to gain information about their fragmentation pathways. For this purpose, a detailed characterization of PEIs was performed by ESI-Q-TOF MS/MS and MALDI-TOF MS/MS. Comprehensive information concerning the fragmentation mechanisms of the PEI polymers and comparison of the tandem mass analysis of these polymers with two different ionization techniques (ESI/ MALDI) is reported. EXPERIMENTAL SECTION Materials 2-Ethyl-2-oxazoline (99%, Acros, EtOx) was dried over barium oxide and distilled under argon prior to use. Methyl tosylate (98%, Aldrich, MeTos) was distilled and stored under argon. Sodium azide (99%, Sigma Aldrich) and acetonitrile (extra dry, Acros) were stored under argon. The matrix material for the MALDI-TOF MS and MS/MS measurements was 2,5-dihydroxybenzoic acid (DHB), and it was purchased from Sigma Aldrich. All solvents used for the ESI-Q-TOF MS measurements were LC-MS grade solvents; they were purchased from Sigma Aldrich and used as received. Instrumentation The polymerizations and hydrolyses were performed in a Biotage Initiator Sixty microwave synthesizer. Proton nuclear magnetic resonance ( 1 H NMR) spectra were recorded on a Bruker AC 300 MHz at 298 K. Chemical shifts are reported in parts per million (ppm, d scale) relative to the residual signal of the deuterated solvent. The IR spectra were recorded on a FT-IR spectrometer IRAffinity-1 (Shimadzu). General procedure for the microwave-assisted polymerization of PEtOx A stock solution containing the initiator, EtOx monomer, and the solvent (acetonitrile) was prepared. The monomer concentration was adjusted to 4 M; and a monomer to initiator ratio of 20 was used, yielding a molar mass at 2000 g/mol. The microwave vials were heated to 140 C for a predetermined time in the microwave synthesizer. The polymerization was quenched through the addition of trace amount of water or an excess of sodium azide. Subsequently, the solution was filtrated and the solvent was evaporated in vacuum. The polymer was redissolved in chloroform, washed with water, and precipitated in ice-cold diethyl ether. 1 H NMR samples were prepared to determine the monomer conversion and the molar masses (M n ) of the polymers. Acidic hydrolysis of PEtOx to linear PEIs Linear PEI polymers were synthesized through acidic hydrolysis of the corresponding PEtOx homopolymers. The PEtOx was heated with an excess of 6 M aqueous HCl in a microwave synthesizer at 130 C for 1 h. After the removal of the acid under reduced pressure at 130 C, the residue was dissolved in deionized water followed by the addition of 3 M NaOH until precipitation occurred (ph > 9). The PEI was filtered off and precipitated in deionized water for a second and a third time for an improved purification. After the filtration, the PEI was dissolved in methanol or DMF and precipitated into ice-cold diethyl ether. The white precipitate was filtered off and dried at 50 C in vacuum. The polymers obtained were characterized by 1 H NMR and FT-IR spectroscopy. In every case, the degree of hydrolysis was above 99%, as determined by 1 H NMR spectroscopy (further information can be found in the supporting information (SI)). A detailed procedure of the synthesis of PEIs can be found elsewhere. [50] ESI-Q-TOF MS and MS/MS analysis PEI samples were analyzed by using a microtof Q-II (Bruker Daltonics) mass spectrometer equipped with an automatic syringe pump, from KD Scientific, for sample injection. The ESI-Q-TOF mass spectrometer was running at 4.5 kv, with a desolvation temperature of 180 C. The mass spectrometer was operating in the positive ion mode. Nitrogen was used as the nebulizer and drying gas. For the CID experiments, a quadrupole was used for the selection of precursor ions, and argon was used as the collision gas. The collision energy was set according to the MS/MS experiments to be carried out by using the tune collision energy function to identify the best collision energy value for these experiments. The standard electrospray ion (ESI) source was used to generate the ions. The concentration of the samples was 10 mg/ml, and all samples were injected with the use of a constant flow rate (180 ml/h) of sample solution. The solvent was methanol or a methanol/water mixture. There was no salt or acid addition prior to analysis, but ionization occured readily from the sodium content that is naturally present in the wileyonlinelibrary.com/journal/jms Copyright 2012 John Wiley & Sons, Ltd. J. Mass. Spectrom. 2012, 47,
209 Tandem mass spectrometry of PEI by ESI and MALDI glass or in the polymer sample. A total of 60 scans/spectrum were averaged, and the quoted m/z values are monoisotopic. The ESI-Q-TOF MS instrument was calibrated in the m/z range with the use of an external calibration standard (Tunemix solution), which is supplied from Agilent. All data were processed via Bruker Data Analysis software version 4.0. MALDI-TOF MS and MS/MS analysis MALDI-TOF MS experiments were performed with an Ultraflex III TOF/TOF (Bruker Daltonics) equipped with a Nd:YAG laser and a collision cell. All spectra were measured in the positive reflector mode. For the MS/MS measurements (LIFT mode), argon was used as the collision gas at a pressure of mbar, and the collision energy amounts to 20 kev. The instrument was calibrated prior to each measurement with an external PMMA standard (molar mass 410 or 2500) from PSS Polymer Standards Services GmbH (Mainz, Germany) in the required measurement range. MS and MS/MS data were processed using Flex Analysis 3.0, PolyTools 1.12 (beta version), Data Explorer 4.0, and an isotope pattern calculator. The ion abundances of several scans were summed up to obtain spectra with good signal/noise ratio for TOF MS and MS/MS experiments. The quoted m/z values are monoisotopic. For the sample preparation, 1 ml of PEI solution in methanol (10 mg/ml) and 10 ml of 2,5-dihydroxybenzoic acid (DHB) solution in methanol (10 mg/ml) were mixed (without salt addition), and the dried-droplet sample preparation method was applied. [51] RESULTS AND DISCUSSION Investigated PEIs The synthesis of linear PEIs can be performed by hydrolyzing linear PEtOxs under alkaline or acidic conditions. The polymerizations of EtOxs were performed using the microwave-assisted living CROP, providing an easy access to well-defined polymers. As useful end groups a hydrogen starting group, as well as a methyl starting group, and a hydroxyl end group were chosen because of their similarity to those used for transfection agent applications. Furthermore, a methyl starting group and an azide end group were chosen to investigate the behavior and to be able to use PEIs in click reactions. [52,53] A schematic representation of the CROP of EtOx and the subsequent hydrolysis under acidic conditions to obtain PEIs is depicted in Scheme 1(a). The studied PEI polymers are displayed in Scheme 1(b). The subsequent hydrolysis reaction to obtain the corresponding PEIs was executed in a microwave synthesizer. Previously, the hydrolysis reaction was performed overnight (24 h) under conventional heating to reflux; where, at 99% of the PEtOx, side chains were cleaved off. However, using a microwave synthesizer is much faster, and even azide end groups can tolerate the acidic microwave hydrolysis. After purification, a detailed analysis of the PEI polymers was performed with the use of 1 H NMR spectroscopy, showing for all macromolecules a 99% conversion of the amide side chains to amine functionalities (SI and [50]). Further characterization was performed with the use of MS techniques, where ESI-MS and MALDI-MS have been utilized. However, it was a challenging task to characterize the resulting PEIs in MS, as the obtained macromolecules contained large salt contaminations. Complicated spectra rendered the MS analysis almost unfeasible. By applying an optimized purification procedure for the PEI polymers and improved measurement conditions (such as the choice of the matrix for MALDI-MS), we found it possible to obtain analyzable MS, as well as MS/MS spectra. Several MALDI matrices have been used to identify the optimum measurement conditions for PEI polymers, such as t-2-(3-(4-t-butyl-phenyl)-2-methyl-2- propenylidene)malononitrile (DCTB), caffeinic acid (CA), sinnapinic acid (SA), and 2,5-dihydroxybenzoic acid (DHB). DHB was found to be the best suitable matrix for the characterization of PEI samples, as shortly reported previously in a proceeding publication; [54] therefore, all sample preparations were performed using the DHB matrix. The compositional information on polymers can be obtained by a single-dimensional mass spectrum that can identify the number and types of monomer units, backbone substituents, and end groups incorporated into the studied polymer. In order to obtain the compositional information, the ESI-Q-TOF and MALDI-TOF mass spectra of the studied PEIs were scrupulously examined in terms of chain end group structures and molar mass distributions. The PEI polymers, PEI-1, PEI-2, and PEI-3, with different initiating and/or terminating end groups were additionally characterized by utilizing ESI-Q-TOF MS/MS and MALDI-TOF MS/MS to identify the fragmentation products. For this purpose, specific oligomers from the distribution of polymer ions formed upon ionization were mass-selected and fragmented using CID. Tandem mass spectra reveal the masses of the fragmentation products, but not directly their structures or their fragmentation pathways. They can only be elucidated with the knowledge of the Scheme 1. (a) Schematic representation of the cationic ring-opening polymerization of EtOxs and subsequent hydrolysis into PEIs, (b) schematic representation of the studied PEI polymers 1 to J. Mass. Spectrom. 2012, 47, Copyright 2012 John Wiley & Sons, Ltd. wileyonlinelibrary.com/journal/jms
 and terminating (Y) chain end are depicted in Fig. S1(a) S1(d) (see SI).")
210 E. Altuntaş et al. corresponding fragmentation mechanisms. All three investigated PEIsampleswillbediscussedindetailinthefollowingsection. Mass spectrometry of PEI-1 ESI-Q-TOF and MALDI-TOF mass spectra of PEI-1 with H and OH end groups at the initiating (X) and terminating (Y) chain end are depicted in Fig. S1(a) S1(d) (see SI). Both mass spectra reveal the expected signal spacing correlating to the repeating unit of the investigated PEI (43.04 m/z for C 2 H 5 N monomer unit). The expected PEI chains with hydrogen as initiating end group and hydroxyl as terminating end group were observed as the main distribution in the ESI-Q-TOF and MALDI-TOF mass spectra (labeled as A and B in Figs. S1(c) and S1(d) (SI)). Peak assignments were achieved on the basis of the expected ion m/z values and validated by isotopic pattern information. A represents the desired protonated distribution [H(C 2 H 5 N) n OH) + H] +, and B represents the desired sodiated distribution [H(C 2 H 5 N) n OH) + Na] +. The minor distribution (I) can be explained by the inefficient hydrolysis of PEtOx to PEI, because these oligomer series still have one EtOx monomer unit in their backbone [H(C 5 H 9 NO) 1 (C 2 H 5 N) noh) + H] + or [H(C 5 H 9 NO) 1 (C 2 H 5 N) n OH) + Na] + (labeled as I in Figs. S1(c) and S1(d) (SI)), which are present in the both ESI- Q-TOF and MALDI-TOF mass spectra to a very little extent. This observation is supported by 1 H NMR spectroscopy, revealing a degree of hydrolysis around 99%. The only difference between the ESI-Q-TOF and MALDI-TOF mass spectra arises from some fragments (labeled as Fr in Fig. S1(d) (SI)), which are readily observed in the MALDI-TOF mass spectrum. These fragments were not observed in the ESI-Q-TOF mass spectrum, indicating that these fragments were caused by the MALDI-TOF process. Tandem mass spectrometry of PEI 1 Figures 1 and 2 represent the ESI-Q-TOF and MALDI-TOF tandem mass spectra of PEI-1. The precursor ion at m/z (theoretical m/z ) represents the protonated adduct of the hydrogeninitiated and hydroxyl-terminated oligomer with 20 repeating units [H(C 2 H 5 N) 20 OH + H + ]. There are several series of product ions, which can be distinguished depending on their newly formed end groups. Various kinds of fragmentation mechanisms can be involved in the formation of these ions. The tandem mass spectra contain four major distributions of fragment ion series (A X n,a Y n,b X n, and B Y n) and some minor distributions of fragment ion series (J VV n,j VA n, and J AA n ). These fragment ion series may be formed via a charge-remote fragmentation pathway, as shown in Scheme 2. This mechanism involves a 1,2-hydride shift via a charge-remote rearrangement mechanism through a fourmembered cyclic transition state, resulting in the formation of two different functionalities at the terminal chain ends. The fragment ions were assigned according to the general nomenclature proposed by Wesdemiotis [55] for synthetic polymers to differentiate fragment ions containing different end groups. Superscripts X and Y are used to represent ions containing initiating (X) or termination (Y) end groups, respectively (A X n,a Y n,b X n, and B Y n). In this proposed mechanism, CID spectra of protonated PEIs occur through a charge-remote process, in which the ionizing proton does not play an active role in the cleavage. The main fragment series (A X n, A Y n,b X n,andb Y n) contain one of the original end groups and new end groups (NH 2 or CH = CH 2 ), which are formed by the proposed charge-remote fragmentation mechanisms. The m/z difference between two sequential fragmentation ions within one series corresponds to m/z units, representing the mass of one repeating unit of PEI. The most abundant fragment ions series (A X n,a Y n,b X n,andb Y n) apparently result from this proposed 108 Figure 1. (a, b) ESI-Q-TOF and MALDI-TOF/TOF tandem mass spectra of the protonated PEI-1 parent peak with 20 repeating units marked with a star [H(C 2 H 5 N) 20 OH + H] + (m/z ). wileyonlinelibrary.com/journal/jms Copyright 2012 John Wiley & Sons, Ltd. J. Mass. Spectrom. 2012, 47,
211 Tandem mass spectrometry of PEI by ESI and MALDI Figure 2. (a, b) ESI-Q-TOF and MALDI-TOF/TOF tandem mass spectra of the protonated PEI-1 and a close up of the range between m/z 500 and 600. mechanism; whereas, the less abundant fragment ion series correspond to internal fragments (J VV n,j VA n,andj AA n )producedbya more complex fragmentation process. This charge-remote fragmentation occurs at both sides of the oligomer chains. Internal fragments with a variety of end groups were named as J n species with different superscripts that indicate their end groups such as vinyl/amine (J VA n ), vinyl/vinyl (J VV n ), and amine/amine (J AA n ). It must be noted that the ions of the main fragment series can result from both charge-remote and charge-induced dissociation mechanisms, but it is difficult to evaluate the extent of fragment ions from each pathway. Dissociation via competing charge-induced cleavage leads to similar fragments. Charge-induced cleavage of C-N bond followed by an energetically favorable 1,2-hydride shift could be an alternative to the charge-remote fragmentation. Lattimer [56 58] has already described in his earlier studies that a charge-induced dissociation from the protonated PEIs and polyglycols generates some of the fragment ion series via heterolytic or homolytic cleavage (Scheme 3). Polyethylene glycol (PEG) mainly dissociates via a charge-induced fragmentation mechanism and, to a lesser extent, via 1,4-hydrogen eliminations (especially metalated precursor ions). The same situation could be possible for PEI polymers because of the similar backbone. The cationic nature of PEI would imply a charge-induced dissociation at the site where the proton, as charge carrier, is located, as proposed by Lattimer. However, it is noteworthy that the substitution of O by NH can significantly change the unimolecular chemistry of the corresponding polymer cation. Because of the larger proton affinity of amines compared to ethers, protonation should take place at the NH functionality and form an ammonium cation. These ions posses a well-stabilized charge center and might favor the charge-remote fragmentation mechanism upon CID. Moreover, charge-induced fragmentation mechanisms can only explain some of the found fragment ion series. Unfortunately, it is not possible to explain all fragment series with heterolytic or homolytic cleavage mechanisms. The tandem MS analyses of the PEIs were performed under both collision energy conditions (low energy in ESI-CID and high energy in MALDI-CID), yielding fragments, which suggest that the proposed charge-remote fragmentation reactions, as well as the chargeinduced fragmentation reactions, are the dissociation mechanisms. The tandem mass spectra of the protonated and the sodiated PEI precursor ions revealed some differences. A comparison of the ESI-Q-TOF tandem mass spectra of the protonated PEI precursor ions [M + H] + (observed m/z , theoretical m/z ) and the sodiated PEI precursor ions [M + Na] + (observed m/z , theoretical m/z ) shows that the sodiated precursor ions are more stable than the protonated precursor ions. The protonated species could easily be fragmented at low collision energies (20 60 ev); whereas, the sodiated species could only be fragmented to a small extent even at higher collision energies ( ev). This indicates that sodiated ions are more stable towards collisional dissociation; hence, there is a need to use higher collision energies for obtaining fragments from sodiated species. The fragmentation mechanisms of the collisional dissociation for sodiated and protonated species are also different. The protonated species follow either a 1,2-hydride shift via a charge-remote rearrangement mechanism (Scheme 2) or a charge-induced fragmentation mechanism (heterolytic and homolytic bond cleavage, Scheme 3, similar cleavages were already proposed by Lattimer for PEGs). On the other hand, the sodiated species appear to fragment via a charge-remote 1,4-hydrogen Scheme 2. Schematic representation of the proposed charge-remote rearrangement mechanisms involved in the fragmentation of protonated PEIs and the representation of potential fragmentation products. 109 J. Mass. Spectrom. 2012, 47, Copyright 2012 John Wiley & Sons, Ltd. wileyonlinelibrary.com/journal/jms
212 E. Altuntaş et al. Scheme 3. Schematic representation of (a) heterolytic C-N bond cleavage and (b) homolytic C-C bond cleavage in a PEI chain. elimination pathway that is analogous to that of PEG (Scheme 4) and a 1,2-hydride shift via charge-remote rearrangement mechanism. For the sodiated parent peaks, possible fragmentation pathways, such as the 1,4-hydrogen elimination, were proposed, and the formed structures (B X n,b Y n, C X n,c Y n,d X n, and D Y n) were correlated to the obtained masses of the fragmentation products. The differences between the sodiated and the protonated species for PEI-1 are depicted in Fig. 3. The schematic representation of the proposed charge-remote 1,4-hydrogen elimination mechanisms involved in the fragmentation of the sodiated PEIs and the resulting fragmentation products are shown in Scheme 4. The fragment product ions from the protonated and sodiated species (Table S1 and Table S2, in SI) are distributed throughout the whole mass range. This observation was valid for both tandem MS measurements (ESI and MALDI MS/MS). PEI-2 and PEI-3 The ESI-Q-TOF and MALDI-TOF mass spectra of PEI-2, with methyl as initiating end groups and hydroxyl as terminating end groups, and a close up of the ESI-Q-TOF and MALDI-TOF mass spectra of PEI-2 in the range between m/z 800 and 900 are depicted in Fig. S2 (SI). A represents the protonated distribution of the expected product [CH 3 (C 2 H 5 N) n OH) + H] +, and B represents the sodiated distribution [CH 3 (C 2 H 5 N) n OH) + Na] +. There are two additional minor distributions obtained in the MS analysis (labeled as C and D in Figs. S2(c) and S2(d) (SI)). C represents the protonated side product distribution [H(C 2 H 5 N) n OH) + H] +, and D represents the sodiated side product distribution [H(C 2 H 5 N) n OH) + Na] +. These side products are formed during the living CROP of EtOx, and they can be explained by known chain transfer reactions during 110 Scheme 4. Schematic representation of the proposed charge-remote 1,4-hydrogen elimination mechanisms involved in the fragmentation of the sodiated PEIs and the representation of the potential fragmentation products. wileyonlinelibrary.com/journal/jms Copyright 2012 John Wiley & Sons, Ltd. J. Mass. Spectrom. 2012, 47,
213 Tandem mass spectrometry of PEI by ESI and MALDI Figure 3. (a, b) ESI-Q-TOF tandem mass spectra of the protonated [H(C 2 H 5 N) 20 OH + H] + (m/z ) and sodiated [H(C 2 H 5 N) 20 OH + Na] + PEI-1 parent peak with 20 repeating units (m/z ) and (c, d) a close up of the ESI-Q-TOF tandem mass spectra of the protonated and sodiated PEI-1 in the range between m/z 500 and 600. the CROP, which lead to proton-initiated PEtOx instead of methyl-initiated PEtOx. These proton-initiated PEtOx polymers are later turned into PEIs side products by acidic hydrolysis. The minor distribution (I) can be explained by the inefficient hydrolysis of PEtOx to PEI, as mentioned before. These oligomer series still bear one EtOx monomer unit in their backbone [CH 3 (C 5 H 9 NO) 1 (C 2 H 5 N)nOH) + H] + or [CH 3 (C 5 H 9 NO) 1 (C 2 H 5 N)nOH) + Na] + (labeled as I in Figs. S2(c) and S2(d) (SI)). They are present in both ESI-Q-TOF and MALDI-TOF mass spectra to a minor extent. Figure, 4(a) 4(d) represent the ESI-Q-TOF and MALDI-TOF/ TOF tandem mass spectra of PEI-2. For the tandem mass analysis, the precursor ion (m/z ), which is the protonated adduct of the methyl-initiated and hydroxyl-terminated oligomer with 20 repeating units [CH 3 (C 2 H 5 N) 20 OH + H] +, was selected. The fragment ion series can be explained by the previously mentioned charge-remote fragmentation pathway (Scheme 2), which involves a 1,2-hydride shift via a charge-remote rearrangement mechanism through a four-membered cyclic transition state resulting in the formation of two different functionalities (NH 2 orch = CH 2 ) at the terminal chain ends. Figure S3(a) S3(d) displays the ESI-Q-TOF and MALDI-TOF mass spectra of PEI-3 with methyl as initiating end groups and azide as terminating end groups and a close up of the ESI-Q-TOF and MALDI-TOF mass spectra of PEI-3 in the range between m/z 800 and 900 (SI). A represents the protonated distribution of the desired product [CH 3 (C 2 H 5 N) n N 3 )+H] +, and B represents the sodiated distribution [CH 3 (C 2 H 5 N) n N 3 ) + Na] +. Again, there are two minor distributions obtained in the MS analysis, which are formed by chain transfer reaction in the CROP that led to the proton-initiated PEtOx and were later turned into the protoninitiated PEIs during subsequent hydrolysis (labeled as C and D in Figs. S3(c) and S3(d) (SI)). The comparison of the ESI-Q-TOF and MALDI-TOF mass spectra of PEI-3 shows some differences between these two techniques. In the ESI-Q-TOF mass spectrum, there is one extra distribution (N) obtained for this polymer, which is formed because of the decomposition of the azide end group into nitrene through losing nitrogen (shown in Fig. S3(f)). [59] In a number of cases, loss of nitrogen from azides results in uncharged monovalent nitrogen intermediates called nitrenes. Nitrenes have triplet ground states and a short lifetime. [60] There were several additional distributions (E, F, G, and H) in the MALDI-TOF mass spectrum. A possible explanation for this situation is that the nitrene intermediate is very unstable, and different reactions might occur to stabilize it. The matrix material (2,5-dihydroxybenzoic acid (DHB)) used for this study is acidic. Therefore, it acts as a proton source to promote the 111 J. Mass. Spectrom. 2012, 47, Copyright 2012 John Wiley & Sons, Ltd. wileyonlinelibrary.com/journal/jms
 ESI-Q-TOF and MALDI-TOF/TOF tandem mass spectra of the protonated PEI parent peak with 20 repeating units marked with a star [CH 3 (C 2 H 5 N) 20 OH + H] + (m/z 893.")
214 E. Altuntaş et al. Figure 4. (a, b) ESI-Q-TOF and MALDI-TOF/TOF tandem mass spectra of the protonated PEI parent peak with 20 repeating units marked with a star [CH 3 (C 2 H 5 N) 20 OH + H] + (m/z ) and (c, d) a close up of the ESI-Q-TOF and MALDI-TOF/TOF tandem mass spectra of PEI-2 in the range between m/z 500 and 600. formation of amine end groups from these nitrene intermediates. As a consequence, the main distribution in the MALDI-TOF mass spectrum was the PEI with methyl as the initiating end group and amine as the terminating end group. In contrast, the main distribution in the ESI-Q-TOF mass spectrum was the desired PEI structure with methyl and azide end groups, proving that the ESI technique is the softer ionization method, compared to MALDI, for the analysis of fragile azide end groups. The structural explanation of all distributions (E, F, G, and H) for PEI-3 polymer is depicted in Fig. S3(e) (SI). The tandem mass experiment was carried out with the precursor ion (observed m/z , theoretical m/z ) that possessed 23 repeating units and with sodium as the ionizing agent [CH 3 (C 2 H 5 N) 23 N 3 )+Na] +. Figure 5(a) and 5(b) represent the ESI-Q- TOF tandem mass spectrum of PEI-3 which showed some differences compared to PEI-1 and PEI-2. In the upper molar mass region of the tandem mass spectrum right after the precursor ion, a pronounced loss of nitrogen was observed. This neutral loss can be assigned to the decomposition of the azide end group into nitrene, which was also observed in the single-dimensional MS analysis. [59] The tandem mass spectrum shows the fragment ion series corresponding to the fragment series formed by a 1,2-hydride shift via charge-remote rearrangement mechanism (Scheme 2) and a charge-remote 1,4-hydrogen elimination pathway (Scheme 4), which are already discussed for the previous PEI polymers, within the medium and low molar mass region. A proper selection of a precursor ion for the fragmentation experiments was not possible because of the multiple overlapping fragments observed in the MALDI-MS; therefore, no tandem MS data were obtained for PEI-3 polymer. A comparison of the tandem mass spectra of PEIs with different end groups reveals that only the azide end group has a tendency to cleave easily through the loss of nitrogen in the formation of an unstable nitrene end group which can also be turned into an amine end group in the MALDI-MS analysis. On the other hand, hydrogen, hydroxyl, and methyl end groups do not show any direct fragmentation. This behavior can be explained by the leaving group ability of these end groups; they have no tendency to fragment. Therefore, different chargeremote fragmentation mechanisms may occur along the whole 112 Figure 5. (a) ESI-Q-TOF tandem mass spectrum of the sodiated PEI parent peak with 23 repeating units marked with a star [CH 3 (C 2 H 5 N) 23 N 3 + Na] + (m/z ) and (b) a close up of the ESI-Q-TOF tandem mass spectrum of PEI in the range between m/z 500 and 600. wileyonlinelibrary.com/journal/jms Copyright 2012 John Wiley & Sons, Ltd. J. Mass. Spectrom. 2012, 47,
215 Tandem mass spectrometry of PEI by ESI and MALDI backbone of the PEIs and form various main fragment series that contain one of the original initiating or terminating end groups (A X n,a Y n,b X n,b Y n, C X n,c Y n,d X n, and D Y n). Meanwhile, the less abundant fragment ion series can correspond to internal fragments (J VV n, J VA n, and J AA n ) produced by a more complex fragmentation process where this charge-remote fragmentation occurs in both sides of the oligomer chains. Overall, it is possible to explain all fragmentation products within the whole molar mass region in the tandem mass spectra of PEIs with these proposed mechanisms and the combination of these mechanisms. CONCLUSIONS In this contribution, ESI-Q-TOF and MALDI-TOF mass spectrometers were utilized to elucidate in detail the macromolecular structures of linear PEIs. Tandem mass spectrometry experiments have been performed to investigate the possible fragmentation mechanisms with different initiating and terminating end groups. For PEIs, the type of the cation attached to these polymers was important, because protonated and sodiated species are fragmented via different fragmentation pathways. The presented study provides important information on the fragmentation mechanisms of PEI polymers and the comparison of the tandem mass analysis of these polymers with two different ionization techniques (ESI/MALDI). The information gained from this study will also help to build up a tandem MS product ion library for PEIs with different end groups including fragmentation pathways. This will provide necessary knowledge for the future to make the fast and automated identification of these polymers possible. This kind of studies will form a new research field that can be named as Polymeromics, and the obtained information will facilitate the structural elucidation of polymers (i.e. analysis of the initiating/end groups, the accurate molar mass distributions). Acknowledgements The authors thank the Dutch Polymer Institute (DPI, Technology area HTE, #667) and the Thüringer Ministerium für Bildung, Wissenschaft und Kultur (grant no. B and B ) for the financial support of this study. Kristian Kempe is grateful to the Landesgraduiertenförderung Thüringen for financial support. Supporting Information Supporting information may be found in the online version of this article. REFERENCES [1] O. Boussif, F. Lezoualc h, M. A. Zanta, M. D. Mergny, D. Scherman, B. Demeneix, J. P. Behr. A versatile vector for gene and oligonucleotide transfer into cells in culture and in vivo: polyethylenimine. Proc. Natl. Acad. Sci. U. S. A. 1995, 92, [2] W. T. Godbey, M. A. Barry, P. Saggau, K. K. Wu, A. G. Mikos. Poly(ethylenimine)-mediated transfection: a new paradigm for gene delivery. J. Biomed. Mater. Res. 2000, 51, 321. [3] B. Brissault, A. Kichler, C. Guis, C. Leborgne, O. Danos, H. Cheradame. Synthesis of linear polyethylenimine derivatives for DNA transfection. Bioconjugate Chem. 2003, 14, 581. [4] M. M. Ramos-Tejada, A. Ontiveros-Ortega, E. Gimenez-Martin, M. Espinosa-Jimenez, A. Molina Diaz. Effect of polyethyleneimine ion on the sorption of a reactive dye onto Leacril fabric: electrokinetic properties and surface free energy of the system. J. Colloid Interface Sci. 2006, 297, 317. [5] A. von Zelewsky, L. Barbosa, C. W. Schläpfer. Poly(ethylenimines) as Broensted bases and as ligands for metal ions. Coord. Chem. Rev. 1993, 123, 229. [6] S. Kobayashi, K. Hiroishi, M. Tokunoh, T. Saegusa. Chelating properties of linear and branched poly(ethylenimines). Macromolecules 1987, 20, [7] B. A. Bolto. Soluble polymers in water purification. Prog. Polym. Sci. 1995, 20, 987. [8] G. Jones, H. Roth, Substituted acylated polyimine resins. US Patent 3,40909, [9] G. D. Jones, A. Langsjoen, M. M. C. Neumann, J. Zomlefer. The polymerization of ethyleneimine. J. Org. Chem. 1944, 9, 125. [10] K. F. Weyts, E. J. Goethals. New synthesis of linear polyethyleneimine. Polym. Bull. 1988, 19, 13. [11] T. Saegusa, H. Ikeda, H. Fujii. Crystalline polyethylenimine. Macromolecules 1972, 5, 108. [12] T. Saegusa, S. Kobayashi, A. Yamada. Graft copolymerization of 2-methyl-2-oxazoline onto chloromethylated polystyrene and hydrolysis of graft copolymer to a chelating resin of poly(styrene-gethylenimine). Macromolecules 1975, 8, 390. [13] S. Kobayashi, M. Kaku, T. Saegusa. Grafting of 2-oxazolines onto cellulose and cellulose diacetate. Macromolecules 1988, 10, [14] H. M. L. Lambermont-Thijs, F. S. van der Woerdt, A. Baumgaertel, L. Bonami, F. E. Du Prez, U. S. Schubert, R. Hoogenboom. Linear poly (ethylene imine)s by acidic hydrolysis of poly(2-oxazoline)s: kinetic screening, thermal properties, and temperature-induced solubility transitions. Macromolecules 2010, 43, 927. [15] H. M. L. Lambermont-Thijs, J. P. A. Heuts, S. Hoeppener, R. Hoogenboom, U. S. Schubert. Selective partial hydrolysis of amphilic copoly (2-oxazoline)s and responsive micellization of the resulting poly (ethylene imine) copolymers. Polym. Chem. 2011, 2, 313. [16] S. Navarro, A. Shkilnyy, B. Tiersch, A. Taubert, H. Menzel. Preparation, characterization, and thermal gelation of amphiphilic alkyl-poly (ethyleneimine). Langmuir 2009, 25, [17] J. H. Jeong, S. H. Song, D. W. Lim, H. Lee, T. G. Park. DNA transfection using linear poly(ethylenimine) prepared by controlled acid hydrolysis of poly(2-ethyl-2-oxazoline). J. Controlled Release 2001, 73, 391. [18] L. Wightman, R. Kircheis, V. Rössler, S. Carotta, R. Ruzicka, M. Kursa, E. Wagner. Different behavior of branched and linear polyethylenimine for gene delivery in vitro and in vivo. J. Gene Med. 2001, 3, 362. [19] U. Lungwitz, M. Breunig, R. Liebl, T. Blunk, A. Goepferich. Methoxy poly(ethylene glycol) low molecular weight linear polyethylenimine-derived copolymers enable polyplex shielding. Eur. J. Pharm. Biopharm. 2008, 69, 134. [20] J. W. Wiseman, C. A. Goddard, D. McLelland, W. H. Colledge. A comparison of linear and branched polyethylenimine (PEI) with DCChol/ DOPE liposomes for gene delivery to epithelial cells in vitro and in vivo. Gene Ther. 2003, 10, [21] M. Neu, D. Fischer, T. Kissel. Recent advances in rational gene transfer vector design based on poly(ethylene imine) and its derivatives. J. Gene Med. 2005, 7, 992. [22] Z. Zhong, J. Feijen. Low molecular weight linear polyethylenimineb-poly(ethylene glycol)-b-polyethylenimine triblock copolymers: synthesis, characterization, and in vitro gene transfer properties. Biomacromolecules 2005, 6, [23] J. B. Fenn. Electrospray wings for molecular elephants (Nobel lecture). Angew. Chem. Int. Ed. 2003, 42, [24] K. Tanaka, H. Waki, Y. Ido, S. Akita, Y. Yoshida, T. Yohida. Protein and polymer analyses up to m/z by laser ionization time-of-flight mass spectrometry. Rapid Commun. Mass Spectrom. 1988, 2, 151. [25] M. Karas, F. Hillenkamp. Laser desorption ionization of proteins with molecular mass exceeding Daltons. Anal. Chem. 1988, 60, [26] C. Barner-Kowollik, T. P. Davis, M. H. Stenzel. Probing mechanistic features of conventional, catalytic and living free radical polymerizations using soft ionization mass spectrometric techniques. Polymer 2004, 45, [27] M. Buback, H. Frauendorf, F. Günzler, P. Vana. Electrospray ionization mass spectrometric end-group analysis of PMMA produced by radical polymerization using diacyl peroxide initiators. Polymer 2007, 48, [28] F. Bennet, T. M. Lovestead, P. J. Barker, T. P. Davis, M. H. Stenzel, C. Barner-Kowollik. Degradation of poly(methyl methacrylate) model compounds in the solid state studied via high resolution electrospray ionization mass spectrometry (ESI-MS). Macromol. Rapid Commun. 2007, 28, J. Mass. Spectrom. 2012, 47, Copyright 2012 John Wiley & Sons, Ltd. wileyonlinelibrary.com/journal/jms
216 E. Altuntaş et al. [29] T. Gruendling, M. Guilhaus, C. Barner-Kowollik. Quantitative LC-MS of polymers: determining accurate molecular weight distributions by combined size exclusion chromatography and electrospray mass spectrometry with maximum entropy data processing. Anal. Chem. 2008, 80, [30] T. Gruendling, M. Guilhaus, C. Barner-Kowollik. Design of experiment (DoE) as a tool for the consistent optimization of source conditions in SEC-ESI-MS of functional synthetic polymers synthesized via ATRP. Macrom. Rapid Commun. 2009, 30, 589. [31] F. Günzler, E. H. H. Wong, S. P. S. Koo, T. Junkers, C. Barner-Kowollik. Quantifying the efficiency of photo-initiation processes in methyl methacrylate free radical polymerization via electrospray ionization mass spectrometry. Macromolecules 2009, 42, [32] F. Günzler, T. Junkers, C. Barner-Kowollik. Studying the mechanism of thioketone mediated polymerization (TKMP) via electrospray ionization mass spectrometry. J.Polym.Sci.,PartA:Polym.Chem.2009, 47, [33] M. Buback, H. Frauendorf, F. Günzler, F. Huff, P. Vana. Determining initiator efficiency in radical polymerization by electrospray ionization mass spectrometry. Macromol. Chem. Phys. 2009, 210, [34] T. L. Selby, C. Wesdemiotis, R. P. Lattimer. Dissociation characteristics of [M + X] + ions (X = H, Li, Na, K) from linear and cyclic polyglycols. J. Am. Soc. Mass Spectrom. 1994, 5, [35] T. Gruendling, S. Weidner, J. Falkenhagen, C. Barner-Kowollik, Mass spectrometry in polymer chemistry: a state-of-the-art up-date. Polym. Chem. 2010, 1, 599. [36] S. M. Weidner, S. Trimpin. Mass spectrometry of synthetic polymers. Anal. Chem. 2010, 82, [37] A. T. Jackson, H. T. Yates, J. H. Scrivens, G. Critchley, J. Brown, M. R. Green, R. H. Bateman. The application of matrix-assisted laser desorption/ionization combined with collision-induced dissociation to the analysis of synthetic polymers. Rapid Commun. Mass Spectrom. 1996, 10, [38] A. T. Jackson, H. T. Yates, W. A. MacDonald, J. H. Scrivens, G. Critchley, J. Brown, M. J. Deery, K. R. Jennings, C. Brookes. Time-lag focusing and cation attachment in the analysis of synthetic polymers by matrix-assisted laser desorption-ionization time-of-flight mass spectrometry. J. Am. Soc. Mass Spectrom. 1997, 8, 132. [39] J. H. Scrivens, A. T. Jackson, H. T. Yates, M. R. Green, G. Critchley, J. Brown, R. H. Bateman, M. T. Bowers, J. Gidden. The effect of the variation of cation in the matrix-assisted laser desorption/ionisationcollision induced dissociation (MALDI-CID) spectra of oligomeric systems. Int. J. Mass Spectrom. Ion Processes 1997, 165/166, 363. [40] A. R. Bottrill, A. E. Giannakopulos, C. Waterson, D. M. Haddleton, K. S. Lee, P. J. Derrick. Determination of end groups of synthetic polymers by matrix-assisted laser desorption/ionization: high-energy collisioninduced dissociation. Anal. Chem. 1999, 71, [41] T. Yalcin, W. Gabryelski, L. Li. Structural analysis of polymer end groups by electrospray ionization high-energy collision-induced dissociation tandem mass spectrometry. Anal. Chem. 2000, 72, [42] A. T. Jackson, S. E. Slade, J. H. Scrivens. Characterisation of poly(alkyl methacrylate)s by means of electrospray ionisation tandem mass spectrometry (ESI MS/MS). Int. J. Mass Spectrom. 2004, 238, 265. [43] M. Girod, Y. Carissan, S. Humbel, L. Charles. Tandem mass spectrometry of doubly charged poly(ethylene oxide) oligomers produced by electrospray ionization. Int. J. Mass Spectrom. 2008, 272, 1. [44] K. Chaicharoen, M. J. Polce, A. Singh, C. Pugh, C. Wesdemiotis. Characterization of linear and branched polyacrylates by tandem mass spectrometry. Anal. Bioanal. Chem. 2008, 392, [45] A. C. Crecelius, A. Baumgaertel, U. S. Schubert. Tandem mass spectrometry of synthetic polymers. J. Mass Spectrom. 2009, 44, [46] K. Knop, B. O. Jahn, M. D. Hager, A. C. Crecelius, M. Gottschaldt, U. S. Schubert. Systematic MALDI-TOF CID investigation on different substituted mpeg Macromol. Chem. Phys. 2010, 211, 677. [47] A. Baumgaertel, C. Weber, K. Knop, A. C. Crecelius, U. S. Schubert. Rapid Commun. Mass Spectrom. 2009, 23, 756. [48] E. Altuntaş, K. Kempe, A. C. Crecelius, R. Hoogenboom, U. S. Schubert. Electrospray ionization mass spectrometric (ESI-MS and MS/MS) analysis of poly(2-oxazoline)s with different side groups. Macromol. Chem. Phys. 2010, 211, [49] A. Baumgaertel, E. Altuntaş, K. Kempe, A. C. Crecelius, U. S. Schubert. Characterization of different poly(2-oxazoline) block copolymers by MALDI-TOF MS/MS and ESI-Q-TOF MS/MS. J. Polym. Sci., Part A: Polym. Chem. 2010, 48, [50] L. Tauhardt, K. Kempe, K. Knop, E. Altuntaş, M. Jäger, S. Schubert, D. Fischer, U. S. Schubert. Linear Poly(ethylene imine) Optimized Synthesis and Characterization, On the Way to Pharmagrade Batches. Macromol. Chem. Phys. 2011, 212, [51] H. J. Raeder, W. Schrepp. MALDI-TOF mass spectrometry in the analysis of synthetic polymers. Acta Polym. 1998, 49, 272. [52] C. R. Becer, R. Hoogenboom, U. S. Schubert. Click chemistry beyond metal-catalyzed cycloaddition. Angew. Chem. Int. Ed. 2009, 48, 2. [53] D. Fournier, R. Hoogenboom, U. S. Schubert. Clicking polymers: a straightforward approach to novel macromolecular architectures. Chem. Soc. Rev. 2007, 36, [54] J. E. Girard, M. Konaklieva, J. Gu, C. M. Guttman, S. J. Wetzel. Proc. 51st ASMS Conf. Mass Spectrometry and Allied Products, Montreal, Canada, June 8 12, [55] C. Wesdemiotis, N. Solak, M. J. Polce, D. E. Dabney, K. Chaicharoen, B. C. Katzenmeyer. Fragmentation pathways of polymer ions. Mass Spectrom. Rev. 2011, 30, 523. [56] R. P. Lattimer, H. R. Schulten. Field desorption and fast atom bombardment mass spectrometry of poly(ethylene imine). Int. J. Mass Spectrom. Ion Proc. 1985, 67, 277. [57] R. P. Lattimer. Tandem mass spectrometry of lithium-attachment ions from polyglycols. J. Am. Soc. Mass Spectrom. 1992, 3, 225. [58] R. P. Lattimer. Tandem mass spectrometry of poly(ethylene glycol) lithium-attachment ions. J. Am. Soc. Mass Spectrom. 1994, 5, [59] Y. Li, J. N. Hoskins, S. G. Sreerama, S. M. Grayson. MALDI TOF mass spectral characterization of polymers containing an azide group: evidence of metastable ions. Macromolecules 2010, 43, [60] G. L abbe. Decomposition and addition reactions of organic azides. Chem. Rev. 1969, 69, wileyonlinelibrary.com/journal/jms Copyright 2012 John Wiley & Sons, Ltd. J. Mass. Spectrom. 2012, 47,

217 Publication P9: Drugs as matrix to detect their own drug delivery system of PCL-PEG block copolymers in MALDI-TOF MS K. Knop, S. Stumpf, U. S. Schubert Rapid Commun. Mass Spectrom. 2013, submitted.
218
219 b Katrin Knop, 1,2 Steffi Stumpf, 1,2 and Ulrich S. Schubert 1,2 * Abstract. i.e. block b in vitro in vivo Keywords. e.g. 1. Introduction
220 e.g. e.g. e.g et al ex vivoin vivo
221 2. Experimental Details 2.1. Materials Transtert
222 2.2. Instrumentation 2.3. Experimental details MALDI sample preparation. Preparation of micelles.
223 Figure 1: b b 3. Results and discussion UV investigations. Table 1.
224 Evaluation of drugs as matrix. i.e. Figure 2:
225 blockb Scheme 1:
226 Figure 2: PEG.
227 Figure 3: PMMA.
228 PS. PEtOx.
229 Figure 4:b PEG-b-PCL. b b
230 b Micelle preparation and drug inclusion. b b b
231 Figure 6: Evaluation of micellar solutions in (MA)LDI-MS. b
K + Measurement above m/z 1,000 (65% Laserenergy) Measurement below m/z 1,000 (55% Laserenergy) b) 0 500 1000")
232 a) Intensity (THP)H (THP)K + Measurement above m/z 1,000 (65% Laserenergy) Measurement below m/z 1,000 (55% Laserenergy) b) m/z Figure 7: b b 4. Conclusion b Acknowledgment.
233 Supporting Information.b References J. Nat. Prod J. Pharmacol. Toxicol Science Nat. Rev. Drug Discov Angew. Chem. Int. Ed J. Control. Release Expert Opin. Drug Deliv J. Pharm. Sci Adv. Polym. Sci Adv. Drug Delivery Rev Eur. J. Pharm. Biopharm J. Pharm. Sci Appl. Spectrosc. Rev
234 Chem. Rev Anal. Chem J. Am. Soc. Mass Spectrom J. Proteomics Plant J Antimicrob. Agents Chemother Open Biomed Eng J Bioorg. Med. Chem. Lett J. Am. Chem. Soc Chem. Biol Dyes Pigments Adv. Drug Delivery Rev
235 Angew. Chem. Int. Ed J. Drug Target Blood Int. J. Mass Spectrom Polym. Bull Anal. Chem Anal. Chem Anal. Chem Mass Spectrom. Rev Anal. Bioanal. Chem Anal. Biochem Rapid Commun. Mass Spectrom Analyst
236 Rapid Commun. Mass Spectrom Org. Mass Spectrom Biomed. Mass Spectrom block Colloids Surf., B Int. J. Pharm
237 Synthesis of Poly(ethylene glycol)-block-poly(-caprolactone) (mpeg-b-pcl). Figure S1:
238 Table S1. Figure S2: Determination of the cmc with pyrene. Determination of the cmc with nile red.
239 Synthesis of poly(2-ethyl-2-oxazoline) 2 kda (PEtOx 20 ). Figure S3: Table S2.

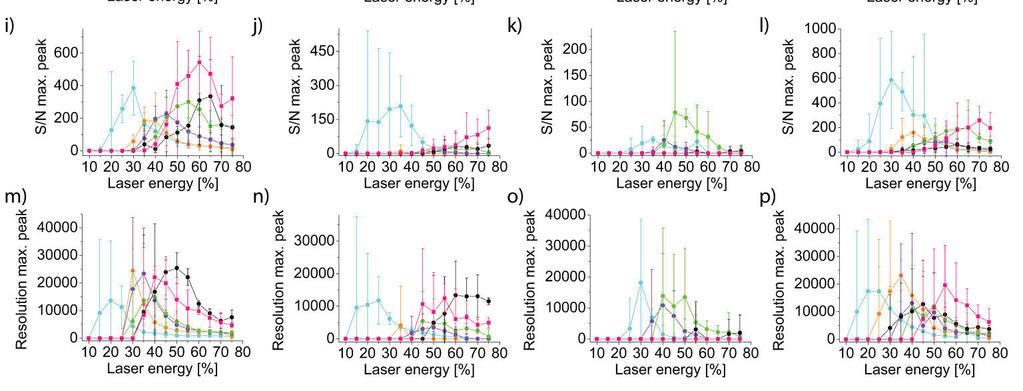
240 Figure S4:
241
242
243 Publication P10: Matrix-free UV-laser desorption/ionization (LDI) mass spectrometric imaging at the single-cell level: distribution of secondary metabolites of Arabidopsis thaliana and Hypericum species D. Hölscher, R. Shroff, K. Knop, M. Gottschaldt, A. C. Crecelius, B. Schneider, D. Heckel, U. S. Schubert, A. Svatoš Plant J. 2009, 60,
244
 mass spectrometric imaging at the single-cell level: distribution of secondary metabolites of Arabidopsis thaliana and Hypericum")

245 The Plant Journal (2009) 60, doi: /j X x TECHNICAL ADVANCE Matrix-free UV-laser desorption/ionization (LDI) mass spectrometric imaging at the single-cell level: distribution of secondary metabolites of Arabidopsis thaliana and Hypericum species Dirk Hölscher 1,*, Rohit Shroff 1, Katrin Knop 2, Michael Gottschaldt 2,3, Anna Crecelius 2,3, Bernd Schneider 1, David G. Heckel 1, Ulrich S. Schubert 2,3,4 and Aleš Svatoš 1,* 1 Department of Entomology, Mass Spectrometry Research Group, and Biosynthesis/NMR Research Group, Max Planck Institute for Chemical Ecology, Hans-Knöll-Strasse 8, Jena, Germany, 2 Laboratory of Organic and Macromolecular Chemistry, Friedrich-Schiller University of Jena, Humboldtstrasse 10, Jena, Germany, 3 Dutch Polymer Institute (DPI), John F. Kennedylaan 2, 5612 AB Eindhoven, The Netherlands, and 4 Laboratory of Macromolecular Chemistry and Nanoscience, Eindhoven University of Technology, Den Dolech 2, 5600 MB Eindhoven, The Netherlands Received 8 May 2009; revised 8 August 2009; accepted 24 August 2009; published online 27 October * For correspondence (fax ; svatos@ice.mpg.de or hoelscher@ice.mpg.de). SUMMARY The present paper describes matrix-free laser desorption/ionisation mass spectrometric imaging (LDI-MSI) of highly localized UV-absorbing secondary metabolites in plant tissues at single-cell resolution. The scope and limitations of the method are discussed with regard to plants of the genus Hypericum. Naphthodianthrones such as hypericin and pseudohypericin are traceable in dark glands on Hypericum leaves, placenta, stamens and styli; biflavonoids are also traceable in the pollen of this important phytomedical plant. The highest spatial resolution achieved, 10 lm, was much higher than that achieved by commonly used matrix-assisted laser desorption/ionization (MALDI) imaging protocols. The data from imaging experiments were supported by independent LDI-TOF/MS analysis of cryo-sectioned, laser-microdissected and freshly cut plant material. The results confirmed the suitability of combining laser microdissection (LMD) and LDI-TOF/MS or LDI-MSI to analyse localized plant secondary metabolites. Furthermore, Arabidopsis thaliana was analysed to demonstrate the feasibility of LDI-MSI for other commonly occurring compounds such as flavonoids. The organspecific distribution of kaempferol, quercetin and isorhamnetin, and their glycosides, was imaged at the cellular level. Keywords: Hypericum perforatum, Hypericum reflexum, LDI mass spectrometric imaging, laser microdissection, naphthodianthrones, flavonoids. INTRODUCTION Recently, a variety of technologies have been successfully used to obtain data from individual plant cells (Lange, 2005). Both laser microdissection (LMD) (Emmert-Buck et al., 1996; Hölscher and Schneider, 2007; Li et al., 2007a) and cell sap sampling using microcapillaries (Brandt et al., 2002) have been reported to improve access to the contents of individual cells; these reports were based on analyses using both post-genomic bioanalytical technologies and spectroscopic methods (Lange, 2005). Techniques such as LMD allow researchers to avoid the averaging effects that occur when heterogeneous tissues, which represent the most abundant cell types, are pooled; however, as amplification methods such as commonly used for DNA and RNA are not available, highly sensitive detection methods are required for metabolites. Methods based on mass spectrometry offer the required high sensitivity and specificity (Sumner et al., 2003). ª 2009 The Authors 907 Journal compilation ª 2009 Blackwell Publishing Ltd
246 908 Dirk Hölscher et al. MS-dependent imaging techniques have been developed in the past to study the localization on a small scale of compounds from complex biological systems. Recently, a method for MS imaging has been developed that offers information about the distribution of proteins, peptides or metabolites with lm spatial resolution (Caprioli et al., 1997; Cooks et al., 2006; Li et al., 2008; Seeley and Caprioli, 2008). Furthermore, when atmospheric pressure infrared matrix-assisted laser desorption/ionization mass spectrometry was used to study plant metabolites in the white lily (Lilium candidum L.) and other plants, over 50 small metabolites were discovered; these were involved in flavonoid biosynthesis and had a spatial resolution of lm (Li et al., 2008). MALDI imaging involves use of a conventional MALDI source to desorb ions of interest from the sample covered by a sprayed (Rubakhin et al., 2005) or spotted matrix (Aerni et al., 2006). MALDI imaging has been used to study the distribution of a wide variety of metabolites, including drugs, peptides and proteins, in animal tissues (Reyzer and Caprioli, 2007; Goodwin et al., 2008), and herbicides (Mullen et al., 2005), peptides (Kondo et al., 2006) and sugars (Burrell et al., 2007; Li et al., 2007a,b) in plants. Recently, ion intensity maps were constructed from MALDI- TOF mass spectra to measure the spatial distribution of some secondary plant metabolites. The matrix 9-aminoacridine was evenly applied to the leaves of Arabidopsis thaliana (Col-0) in order to detect glucosinolates (Shroff et al., 2008). However, applying MALDI matrices to the tissues complicates tissue preparation for imaging and can disturb the native distribution of the studied metabolites (Shroff et al., 2008). Low-molecular-weight metabolites have been profiled and localized using colloidal graphite-assisted LDI (GALDI) MS in A. thaliana (Cha et al., 2008). Profiles and spatially resolved images of phospholipids, cerebrosides, oligosaccharides, flavonoids and other secondary metabolites were obtained in negative and positive ion MS modes. Certain mass imaging methods, such as laser-assisted electrospray ionization (LAESI) (Vertes et al., 2008), can reduce sample handling prior to analysis. However, the infrared laser currently used does not provide cell-like resolution for the obtained MS images. The main secondary plant products of members of the genus Hypericum of the Hypericaceae plant family (Mabberley, 2008) are flavonoids (e.g. quercetin, hyperoside, rutin, quercitrin, isoquercitrin), xanthones (e.g. 1,3,6,7,- tetrahydroxyxanthone), prenylated phloroglucinols such as hyperforin and adhyperforin, biflavonoids [I3,II8-biapigenin and I3,II8-biapigenin (amentoflavone)] and naphthodianthrones (Brockmann et al., 1942; Wolfender et al., 2003; Charchogylan et al., 2007; Smelcerovic et al., 2008) (Figure 1 and Table 1). Multi-cellular, globular or tunnel-shaped aggregates such as secretory canals, and dark and translucent glands have been reported to contain the secondary metabolites (Ciccarelli et al., 2001; Robson, 2003). Dark and pale glands often occur in the stem, leaf, sepal, petal or anthers. In Hypericum, the stamens possess a connective terminating in a dark gland (Figure 2). The gynoecium of H. perforatum has three styles and contains relatively small red stigmata (Figure 2). There is a large variation in the glandularity of sepals in Hypericum, and some species (such Figure 1. Chemical structures for the major secondary metabolites of H. perforatum. ª 2009 The Authors Journal compilation ª 2009 Blackwell Publishing Ltd, The Plant Journal, (2009), 60,
 (Jürgenliemk, 2001) Number Name [M-H] ) (m/z) UV max (nm) (1) Quercetin 301.03 256.8, 372.9 (2) Quercitrin (R: 3-O-a-L-rhamnopyranosyl) 447.")
247 Matrix-free UV-LDI mass spectrometric imaging at the single-cell level 909 Table 1 Names, deprotonated ion mass and UV adsorption wavelengths of the Hypericum sp. natural constituents (see Figure 1 for structural formula) (Jürgenliemk, 2001) Number Name [M-H] ) (m/z) UV max (nm) (1) Quercetin , (2) Quercitrin (R: 3-O-a-L-rhamnopyranosyl) , (3) Isoquercitrin (R: 3-O-b-D-glucopyranosyl) , (4) Hyperoside (R: 3-O-b-D-galactopyranosyl) , (5) Miquelianin (R: 3-O-a-D-glucuronopyranosyl) , (6) Rutin (R: 3-O-b-D-rutinosyl) , (7) Hypericin (R: -CH 3 ) , 317.2, 452.3, 539.5, (8) Pseudohypericin (R: -CH 2 OH) , 324.3, 455.9, 539.5, (9) Protohypericin (R: -CH 3 ) (10) Protopseudohypericin (R: -CH 2 OH) (11) Hyperforin (R: -H) (12) Adhyperfirin (R: -CH 3 ) (13) Hyperfirin (R: -H) (14) Biapigenin (I3,II8-biapigenin) , (15) Amentoflavone (I3,II8-biapigenin) as H. reflexum) have stalked glands (Robson, 2003). These glandular trichomes are often close neighbours of dark glands, which are located near the margins of the sepals (Esau, 1965; Piovan et al., 2004). The short distance (<50 lm) between these glands makes the use of (MA)LDI techniques to acquire information from each dark gland extremely challenging. Controlled clinical trials have shown the therapeutic efficacy of preparations from aerial parts of this medicinal plant for treating mild to moderate depression (Kaul, 2000; Butterweck, 2003; Gädcke, 2003; Müller, 2003). Hyperforin, Anther Stamen (of androecium) Filament Perianth Sepal (of calyx) Petal (of corolla) Stigma Style Ovary Pistil (of gynoecium) Figure 2. Photograph of a flower of H. perforatum, reproduced with permission from S. Imhof (University of Marburg, Germany). The bisexual flower of H. perforatum shows a large number of stamens, collectively called the androecium, and three pistils, collectively called the gynoecium. The pistil comprises three styles with red stigmas. The ovary is the part of the pistil containing the ovules; these are connected to the placenta tissue by a stalk called the funicle (funiculus) (Figure 6a). The perianth of H. perforatum consists of two discrete whorls: the outer green photosynthetic calyx comprising leaf-like sepals, and the yellow corolla comprising individual petals. in particular, a major acylphloroglucinol in Hypericum perforatum L. (Erdelmeier, 1998), exhibits intriguing pharmacological properties (Müller, 2003; Beerhues, 2006). Numerous studies have been published describing the various approaches to analysing the constituents of H. perforatum, commonly known as St John s wort. One of the best-selling herbal medicinal plants worldwide, this species is planted in several hundred hectares in Europe (Gaudin et al., 2003). HPLC and RPLC separations have been performed to identify and quantify active compounds in extracts of St John s wort (Li and Fitzloff, 2001; Seger et al., 2004; Pages et al., 2006). Other publications reported analysis of the major secondary metabolites of H. perforatum based on measurements using LC/MS 2 (Brolis et al., 1998; Ganzera et al., 2002) and LC/NMR/MS (Hansen et al., 1999). Previously, Tatsis et al. (2007) combined liquid chromatography/diode array detector/solid phase extraction/nmr spectroscopy and liquid chromatography/ ultraviolet/tandem MS spectrometry. Generally speaking, modern techniques for identifying compounds are combined with a classical approach, namely extracting whole plant material such as leaves or flowers using organic solvents. The model plant A. thaliana was chosen to investigate the tissue-specific accumulation of flavonoids in its flowers, sepals, petals and leaves, and thus to demonstrate the broader applicability of the matrix-free LDI-MSI method. Recently, flavonoids and cuticular waxes have been profiled and imaged from various plant surfaces, and cross-sections of A. thaliana were successfully probed by colloidal graphite-assisted LDI (GALDI) MS imaging (Cha et al., 2008). The size and fragility of A. thaliana presented challenges when using the GALDI-MSI method to analyse the metabolome. The present paper reports on the use of matrix-free laser desorption/ionization mass spectrometric imaging ª 2009 The Authors Journal compilation ª 2009 Blackwell Publishing Ltd, The Plant Journal, (2009), 60,


 made it difficult to obtain sufficient amounts of the dark glands.")
 was collected and extracted using methanol. Aliquots (1 ll) of the individual sample solutions were dried on the stainless steel plate typically used in MALDI instruments.")
248 910 Dirk Hölscher et al. (LDI-MSI) to study highly localized UV-absorbing secondary metabolites in plant tissues. The applicability of the method is demonstrated on the phytochemical contents of members of the plant genera Arabidopsis and Hypericum, and verified by mass spectrometry of the areas isolated using LMD in Hypericum. RESULTS Laser desorption/ionization time of flight (LDI-TOF) detection of Hypericum sp. and A. thaliana secondary metabolites To prepare samples from various tissues of Hypericum sp. for LDI-TOF/MS analysis, two approaches were used: cell sap sampling using microcapillaries and LMD. The thickness of the plant cell walls and the fragility of the specially prepared fused silica capillaries (Figure 3c) (Kelly et al., 2006; Sproß, 2007) made it difficult to obtain sufficient amounts of the dark glands. Dark glands from petals (Figure 3b) and dark and translucent glands from leaves (Figure 3a,d) were successfully separated by LMD. As a control, green parenchyma tissue from the leaves of H. perforatum (Figure 3a) was collected and extracted using methanol. Aliquots (1 ll) of the individual sample solutions were dried on the stainless steel plate typically used in MALDI instruments. Because phenolic structures deprotonate easily, the MALDI analysis was carried out in negative ion mode using 9-aminacridine as the matrix. Moreover, these analytes did not require a chemical matrix for ionization, probably due to their strong UV absorption. They ionized very well under UV irradiation with a conventional nitrogen laser (k = 337 nm) fitted to the MALDI instrument. A comparison of the MALDI (matrix 9-aminoacridine; Shroff et al., 2007) and LDI spectra of hypericin and pseudohypericin showed no difference in sensitivity. Moreover, the LDI spectra were free of matrix peaks. Both MALDI and LDI methods showed comparable limit of detection for authentic compounds (5 pg). We compared our data with the results of several phytochemical investigations of Hypericum secondary metabolites (Brockmann et al., 1942; Wolfender et al., 2003; Charchogylan et al., 2007; Tatsis et al., 2007; Smelcerovic et al., 2008). In the dark glands of the petals of H. perforatum, we detected the naphthodianthrones hypericin (7) (m/z , [M-H] ) ) and pseudohypericin (8)(m/z , [M-H] ) ) and the flavonoids quercetin (1) (m/z , [M-H] ) ), quercitrin (2) (m/z , [M-H] ) ) and rutin (6) (m/z , [M-H] ) ), as well as isoquercitrin (3) (m/z , [M-H] ) ) and/ or hyperoside (4) (m/z , [M-H] ) ) (indistinguishable by our methods) (Figure 4a) (Tatsis et al., 2007). Compared to the dark glands of the petals, the black nodules of the leaves show two additional compounds: protohypericin (9) (m/z , [M-H] ) ) and protopseudophypericin (10)(m/z , [M-H] ) ) (Figure 4b). The LDI-TOF/MS analysis of the translucent glands of the leaves showed signals for three phloroglucinols: hypeforin (11) (m/z , [M-H] ) ), adhyperfirin (12) (m/z , [M-H] ) ) and hyperfirin (13) (m/z , [M-H] ) ) (Figure 4c) (Tatsis et al., 2007). The LMDprepared dark glandular cells of the connective tissue between the theca of the stamens (Figure 2) showed a signal profile comprising hypericin (7) (m/z , [M-H] ) ), pseudohypericin (8) (m/z , [M-H] ) ), protohypericin (9) (m/z , [M-H] ) ) and protopseudophypericin (10), (m/z , [M-H] ) ) and the flavonoid quercetin (1) (m/z , [M-H] ) ). Furthermore, the most intense signal of this spectrum was produced by the biflavonoid biapigenin (14) (m/z (a) (b) Figure 3. Localization of dark and translucent glands in various tissues of H. perforatum. (a) Part of a green leaf of H. perforatum showing translucent leaf venation, and translucent and dark glands. (b) Dark gland of a petal of H. perforatum. (c) Fused silica capillary (d) Laser-microdissected dark glands of a leaf of H. perforatum. (c) (d) ª 2009 The Authors Journal compilation ª 2009 Blackwell Publishing Ltd, The Plant Journal, (2009), 60,
249 Matrix-free UV-LDI mass spectrometric imaging at the single-cell level 911 Figure 4. Representative LDI mass spectra of various parts of H. perforatum. (a) Laser-microdissected dark glands from a leaf; (b) dark glands from a petal; (c) translucent glands from a leaf; (d) dark connective theca stamens; (e) pollen stamens; (f) red papillae styli , [M-H] ) ) (Figure 4d). In previous reports, only traces of isobaric amentoflavones were found in H. perforatum (Repčák and Martonfi, 1997; Nebelmeir, 2006). The prepared pollen showed the biapigenin signal almost exclusively (14) (m/z , [M-H] ) ), and only traces of the naphthodianthrones hypericin (7) (m/z , [M-H] ) ), pseudohypericin (8) (m/z , [M-H] ) ), protohypericin (9) (m/z , [M-H] ) ) and protopseudohypericin (10) (m/z , [M-H] ) ) (Figure 4e). The spectra of the lighter red papillae of the styli showed signals for hypericin (7) (m/z , [M-H] ) ), pseudohypericin (8) (m/z , [M-H] ) ), protohypericin (9) (m/z , [M-H] ) ), protopseudophypericin (10) (m/z , [M-H] ) ), the flavonoids quercetin (1) (m/z , [M- H] ) ), isoquercitrin (3)(m/z , [M-H] ) ) and/or hyperoside (4) (m/z , [M-H] ) ), and the phloroglucinol hyperforin (11) (m/z , [M-H] ) ). Once again, the strongest signal was produced by the biflavonoid biapigenin (14)(m/z , [M-H] ) ) (Figure 4f). Investigation of the non-secretory parenchyma tissue showed only traces of the flavonoids quercetin (1)(m/z , [M-H] ) ) and rutin (6)(m/z , [M-H] ) ) and the phloroglucinol hyperforin (11) (m/z , [M-H] ) ). Thus, use of LMD and MALDI- or LDI-MS has proven to be a powerful combination for obtaining information about the phytochemical profile of specialized plant areas. The ability to ionize the investigated hypericins without the use of matrix during the LDI process simplifies sample preparation and enables direct profiling of secondary plant metabolites by MSI. Direct profiling/imaging of flavonoids, biflavonoids and hypericins by LDI-MSI The commonly used MS imaging technique, which involves application of a matrix, has certain disadvantages. If the tissue is wetted when the matrix is applied, significant analyte de-localization may occur, leading to artefacts. Additionally, the size of matrix crystals formed after multiple spraying is highly variable and sometimes larger than the required spatial resolution. Hence, the best solution is to analyse the tissue without any chemical treatment in order to observe the native distribution of compounds. However, this is generally not feasible, as most analytes do not strongly absorb UV light and require a matrix to be desorbed. However, the efficient UV absorption of hypericins suggested that the LDI process could be used for imaging these compounds in H. perforatum tissues without the need for a matrix. Preliminary experiments were performed using a MALDI micro instrument (Shroff et al., 2008); however, the laser beam (approximately 50 lm) could not be focused to allow spatial information to be differentiated on a fine scale. Higher resolution could be achieved using the Ultraflex III Ò, in which the laser can be focused on spots of <10 lm. We were able to resolve the localized distribution of hypericin and pseudohypericin in both secretory cavities, separated from each other by the peduncle of the glandular trichomes (Figure 5), in H. reflexum leaves. Additionally, LDI-MSI made it possible to detect hypericin, pseudohypericin, quercetin and rutin in the small red appendices of the placenta; supposedly from one cell, these appendices are easily prepared from cryo-sectioned flower material (Figure 6). Difficulties in performing LDI-MSI experiments with the three-dimensional bulky stamens and styli were overcome by LMD. The filament was removed and samples suitable for measurement were obtained (Figure 7a,b). LDI-MSI allowed hypericin (m/z , [M-H] ) ) (Figure 7c,e) and pseudohypericin (m/z , [M-H] ) ) (Figure 7d,f) to be ª 2009 The Authors Journal compilation ª 2009 Blackwell Publishing Ltd, The Plant Journal, (2009), 60,
 cut-out of measured region; glandular trichomes and secretory cavities are distinguishable; (c, d) molecular images of (b) for m/z 503 (blue) and m/z 519 (green); (e, f) overlays")
250 912 Dirk Hölscher et al. (a) (c) (e) Figure 5. Detection of hypericins in the glandular trichomes of H. reflexum. (a) Detail of H. reflexum leaf; (b) cut-out of measured region; glandular trichomes and secretory cavities are distinguishable; (c, d) molecular images of (b) for m/z 503 (blue) and m/z 519 (green); (e, f) overlays of optical image (b) and molecular images for m/z 503 (blue) and m/z 519 (green), respectively. Scale bar = 200 lm. (b) (d) (f) detected in the dark connective theca stamens. Signals for hypericins and biflavonoids were detectable on the stigma as a result of the presence of pollen grains on the papillae (image not shown, and Figure 8a). Signals typical for the biflavonoids biapigenin (m/z , [M-H] ) ) and amentoflavone (m/z , [M-H] ) ) were found in the pollen (Figure 8b). A laser intensity of 283 lj mm )2 was sufficient for efficient desorption/ionization of the analytes. Images constructed for the whole leaf were composed of approximately 9000 pixels, and the images constructed for smaller structures such as the stamens, styli and pollen were all more than 1000 pixels. Although a spatial resolution of 10 lm was required to differentiate highly localized regions, the high frequency (200 Hz) of the Nd:YAG laser made it possible for the measurements to be performed in a reasonable time span. The ease with which biflavonoids could be analysed using LDI inspired us to study whether other phenolic compounds could be desorbed from plant material. GALDI imaging has shown the distribution of three flavonoids (kaempferol, quercetin and isorhamnetin) and their glycosides at low spatial resolution in sepals and petals from A. thaliana (Cha et al., 2008). Mounting detached A. thaliana Col-0 petals on conductive tape (Figure 9a,f) and LDI-MSI imaging using the Ultraflex III Ò at 10 lm resolution within the scanning range m/z we were able to obtain highly resolved ion images with cell-like structures (Figure 9). Very strong signals for many putative flavonoids and corresponding glycosides were visible, with particular patterns for individual ions. Using CID spectra (TOF/TOF) and published data (Cha et al., 2008), we were able to identify individual ions. The upper two-thirds of most petal surfaces contain kaempferol (m/z , Figure 9b) and kaempferol-rhamnoside (m/z , Figure 9d). Upon closer inspection, petal veins show very low concentrations of these compounds. An identical distribution was observed for highly glycosylated kaempferols (data not shown), e.g. m/z 577 (kaempferol-dirhamno- ª 2009 The Authors Journal compilation ª 2009 Blackwell Publishing Ltd, The Plant Journal, (2009), 60,
 Cryosection of the ovary of H.")
251 Matrix-free UV-LDI mass spectrometric imaging at the single-cell level 913 (a) (c) (e) (b) (d) (f) Figure 6. LDI-MSI detection of hypericins in appendices of the placenta of H. perforatum. (a) Cryosection of the ovary of H. perforatum showing the placenta (ovary wall), the funiculi and ovules; (b) optical image of the measured region of placenta the area circled in orange shows expected localization of secondary metabolites; (c, d) molecular images of (b) for m/z 503 (blue) and m/z 519 (green), respectively; (e, f) overlays of optical image (b) and molecular images for m/z 503 (blue) and m/z 519 (green), respectively. side), m/z 593 (kaempferol-rhamnoside-glucoside) and m/z 739 (kaempferol-dirhamnoside-glucoside). Quercetin and isorhamnetin (m/z 301, Figure 9c and m/z 315, Figure 9e, respectively) are co-localized in the lower third of the petal, and corresponding glycosylated forms showed an identical pattern, e.g. m/z 447 (quercetinrhamnoside), m/z 461 (isorhamnetin-rhamnoside) and m/z 609 (quercetin-rhamnoside-glucoside). In contrast to the kaempferol family, quercetin and isorhamnetin were detected in petal veins. If the images from both distribution patterns are superimposed, all compounds are seen to be co-localized in the lower petal mid-vein, suggesting that they share a common means of transport. In sepals, kaempferol/ quercetin and isorhamnetin show a somewhat less distinct distribution than in petals (Figure 9f j). Kaempferol (Figure 9g) and its rhamnoside (Figure 9i) are more abundant in the internal parts of the plant, whereas quercetin (Figure 9h) and isorhamnetin (Figure 9j) occupy the whole leaf surface. DISCUSSION The detection of variations in the molecular content of cell populations requires analytical methods based on single cells to avoid the pooling of data that occurs when constituents are averaged over multiple cells. Therefore, we used various strategies to acquire information about the distribution of secondary natural products in cryo-sectioned, laser-microdissected or freshly cut plant samples of Hypericum sp. The results show the suitability of combining LMD and LDI-TOF/MS and LDI-MSI to analyse the localization of secondary metabolites of H. perforatum. This approach should minimize the negative effects caused by application of a matrix. No additional chemical interactions, no additional data-distorting diffusion processes, and no additional changes of the matrix-treated surface of the sample are expected. The phytochemical constituents of members of the genus Hypericum, and especially H. perforatum, have been described frequently, allowing us to compare our molecular data for the secondary metabolites with published data. Recent publications that provide an overview of the phytochemical profiles of various parts of leaves and flowers of H. perforatum include those by Berghöfer and Hölzl (1989), Nebelmeir (2006) and Tatsis et al. (2007). Our methods permitted identification of most compounds described in these reports, but could not distinguish the biflavonoids biapigenin and amentoflavone from the flavonoids hyperoside and isoquercitrin, which would have required the use of LC-MS equipment. Naphthodianthrones were detectable in the dark glands of leaves and petals and in certain parts of the connective tissue of the theca of the stamens. With the higher resolution afforded by use of the Ultraflex III Ò apparatus, we were able ª 2009 The Authors Journal compilation ª 2009 Blackwell Publishing Ltd, The Plant Journal, (2009), 60,
 optical image of measured stamens of H.")
 and m/z 519 (green), respectively. (b) (d) (f) 100 μm to analyse the contents of closely adjacent anatomical structures on H.")
252 914 Dirk Hölscher et al. (a) (c) (e) Figure 7. Visualization of hypericins in the stamen connective. (a) Image of stamens of H. perforatum with a dark red region of the connective tissue between the thecae; (b) optical image of measured stamens of H. perforatum the area circled in orange shows expected localization of secondary metabolites; (c, d) molecular images of (b) for m/z 503 (blue) and m/z 519 (green); (e, f) overlays of optical image (b) and molecular images for m/z 503 (blue) and m/z 519 (green), respectively. (b) (d) (f) 100 μm to analyse the contents of closely adjacent anatomical structures on H. reflexum leaves that were separated from each other by only 50 lm; our analysis revealed highly localized hypericins in the glandular trichomes and dark glands of H. reflexum, and avoided the time-consuming steps required to mechanically isolate glandular trichomes and determine their natural products (Piovan et al., 2004). Furthermore, the LDI-MSI results can be easily re-checked by LMD and LDI-TOF/MS or LC/MS/MS analysis. The spatial resolution of the phytochemical profile of neighbouring secretory cavities of Hypericum was excellent, enabling us to investigate even smaller areas such as the small appendices of the placenta to do this requires collection of data on a scale <10 lm. Proof of the presence of naphthodianthrones and flavonoids in the small appendices of the placenta was provided using the Smartbeam Ò optics of the Ultraflex III Ò equipment, which are able to acquire data from localized secondary metabolites. Recently, hyperforin was detected in disc-shaped leaf material containing translucent glands of H. perforatum that was manually isolated using modified syringes (Soelberg et al., 2007). Our approach, namely combining LMD with LDI-TOF/MS and LDI-MSI imaging, allowed phloroglucinols to be detected in individual translucent glands, and confirmed that hyperfirin and adhyperfirin accumulate in these secretory cavities (Soelberg et al., 2007; Tatsis et al., 2007). Surprisingly, adhyperfirin was not detected in our samples. This variability of the phytochemical profile could be due to different environmental factors (Nebelmeir, 2006). LMD was also used to prepare the papillae-containing styli of the stigma. In addition to hypericins, MS signals typical for the biflavonoids biapi- Figure 8. LDI-MS/TOF spectra of styli and pollen. (a) A representative spectrum of styli of H. perforatum containing both hypericins and the signal for the biflavonoids biapigenin and amentoflavone, whose presence is due to pollen. (b) No hypericins were detected in representative spectra of pollen. ª 2009 The Authors Journal compilation ª 2009 Blackwell Publishing Ltd, The Plant Journal, (2009), 60,
 Optical image of an A.")
253 Matrix-free UV-LDI mass spectrometric imaging at the single-cell level 915 (a) (b) (c) (d) (e) (f) (g) (h) (i) (j) Figure 9. Distinct distribution of flavonoids in A. thaliana petals and sepals. (a) Optical image of an A. thaliana Col-0 flower petal; negative ion mode LDI-MSI images constructed for the distribution of (b) the m/z 285 ion corresponding to kaempferol; (c) the m/z 301 ion corresponding to quercetin; (d) the m/z 431 ion corresponding to kaempferol rhamnoside; (e) the m/z 315 ion corresponding to isorhamnetin. (f) Optical image of an A. thaliana Col-0 flower sepal; (g, h, i and j) correspond to the same ion images as described for (b e), respectively. genin and amentoflavone were detected. Both compounds are thought to be localized in the stamens (Repčák and Martonfi, 1997; Nebelmeir, 2006), and, in comparison to biapigenin, only traces of amentoflavone are verifiable. Evidence of biflavonoids in the papillae comes from the presence of pollen on the styli. The compounds were detected and separated using LC-MS techniques on extracts of LMD samples. The presence of flavonoids appears to be connected with hypericin-containing secretory structures. Only traces of quercetin and rutin were detectable in non-secretory parenchyma cells from H. perforatum. The well-known UV demarcations of the flower of H. perforatum result from two categories of pigments, flavonoids and de-aromatized isoprenylated phloroglucinols (Gronquist et al., 2001). Our investigation did not reveal any de-aromatized isoprenylated phloroglucinols. Future investigations will focus on the presence of secondary metabolites during the anatomical development of plant parts such as the leaves, stamens or placenta of Hypericum sp. The ability to analyse cellspecific metabolite patterns makes it possible to study the location of the biosynthesis of secondary metabolites and putative translocations. Furthermore, LDI-MSI will allow us to investigate the influence of genetic and environmental factors on the accumulation of secondary metabolites of Hypericum sp. and other plants without using a matrix. Natural populations and breeding lines of H. perforatum possess a variety of bioactive constituents. LDI-MSI can be used on this important phytomedical plant to address harvest quality, the drying process, and storage of the plant material. Further experimental developments should enable us to analyse active compounds in species at various vegetative stages and in specific parts of the plant. Such analysis will help to define the optimal harvest time for obtaining high-quality raw material. Anthracnose disease of H. perforatum caused by Colletotrichum gloeosporioides Penz. leads to the development of symptoms such as the reddish colour of infected plants (Gaudin et al., 2003). LDI-MSI will be useful for studying the role of secondary plant metabolites such as phytoalexins, whose concentration increases after pathogen attack; it is an elegant tool for investigating the uptake, metabolism and distribution of polycyclic aromatic plant metabolites in host pathogen interactions. Using LDI-MSI on A. thaliana Col-0 petals and sepals provided clear MS images (Figure 9) at cellular resolution (approximately 10 lm), and indicates the broad scope of the method. The previously determined distribution of flavonoids reported by Cha et al. (2008) was re-examined. We found that all the compounds are co-localized in the main basal petal vein, and only glycosides of the quercetin and isorhamnetin type occur in small veins. The mechanistic cause of this pattern cannot be determined from the current dataset, but the transport from other plant parts is likely. A possible function of the observed distribution could be that the localization of highly UV-absorbing pigments (the quercetin and isorhamnetin series) in the petal base directs pollinators to the nectar source. A related UV-absorbing guide mark has been isolated from the petal base of the related species Brassica rapa, and identified as isorhamnetin- 3,7-O-di-b-D-glucopyranoside (Sasaki and Takahashi, 2002). In principle, any UV-absorbing compound could be imaged on the scale of individual cells as performed here. All compounds with condensed aromatic rings, such as flavonoids, flavanes, anthocyanins or similar plant pigments, or indolic alkaloids and related structures, are targets for future application of the LDI-MSI method illustrated here. It is encouraging that plants can be imaged without ª 2009 The Authors Journal compilation ª 2009 Blackwell Publishing Ltd, The Plant Journal, (2009), 60,
254 916 Dirk Hölscher et al. cryo-sectioning, and that organs/glands in the body of the plant tissues are suitable for MSI. The UV laser is able to penetrate a few micrometres into the sample, enough to desorb and ionize the compounds of interest. This method could also be applied to samples of animal or microbial origin. EXPERIMENTAL PROCEDURES Plant material Plants of H. perforatum L. were obtained from Agrarprodukte Ludwigshof eg and Martin Bauer GmbH Co. KG ( martin-bauer.de). They were grown outside close to the greenhouse of the Max Planck Institute for Chemical Ecology. Plants of H. reflexum L. were obtained from the Botanical Garden of Martin Luther University (Halle-Wittenberg, Germany). These plants were grown in either sand or soil (Klasmann Erden ( deilmann.de) clay and sand in the ratio 1:2) under greenhouse conditions (day C, night C; 30 55% relative humidity; the natural photoperiod was supplemented by 8 h of light from a Philips Sun-T Agro 400 W sodium light, philips.com). A. thaliana plants of Columbia accession (Col-0) were grown in a soil:vermiculite mixture (3:1) in a controlled environment chamber at 21 C, 55% relative humidity, 100 lmol m )2 sec )1 photosynthetically active radiation from a mixture of Fluora and Cool White lamps (Osram, and a diurnal cycle of 10 h light/14 h dark. Laser microdissection of secretory cavities Using to the procedure described by Hölscher and Schneider (2007), leaves, sepals and petals of H. perforatum or H. reflexum were fixed between a thin glass slide (0.6 mm thickness, Menzel Gläser, and a specially manufactured metal frame. The dissection of the secretory cavities was made possible by use of a nitrogen solid-state diode laser of a Leica LMD6000 system ( with short pulse duration (355 nm). The microdissected secretory cavities were collected in the lid of an Eppendorf tube by the Leica LMD6000 system. The microtube was briefly centrifuged (1000 g, 25 C, 1 min) to settle the contents. Methanol was added and the mixture was sonicated for 1 min, and then transferred to a MALDI plate for (MA)LDI-TOF/MS investigation. Sap sampling using microcapillaries Fused silica capillaries were used as microcapillaries. Their etching using hydrofluoric acid was performed as described previously (Kelly et al., 2006; Sproß, 2007). The micro-injection apparatus consists of a stereo microscope (Zeiss Stemi SV11, zeiss.com/) with a magnification range of 6 to 60. The microcapillaries were connected with a micromanipulator and a homemade air-pulse controller system manufactured by the Max Planck Institute for Chemical Ecology workshop according to the plans described by Handler (2000). Injection of the microcapillaries and ejection of the contents of the specialized cells of Hypericum sp. were performed in the open air. Mass spectrometry A MALDI micro MX mass spectrometer (Waters, waters.com) fitted with a nitrogen laser (337 nm, 4 nsec laser pulse duration, 10 Hz and 154 lj per pulse) was used in reflectron mode and negative polarity for data acquisition using MassLynx version 4.0 software. The chemical identity of the compounds observed was confirmed by comparing MS/MS spectra of standard compounds and the masses obtained using an LTQ ion trap instrument (Thermo Fisher, with an atmospheric pressure MALDI source equipped with a solid-state Nd:YAG UV laser (MassTech, and running Target 6 (MassTech) and Excalibur version 2.0 (Thermo Fisher) software for data acquisition. Fixation of plant material for Ultraflex III Sepal and petal (A. thaliana), laser-microdissected stigma, untreated leaves, theca and pollen (leaves from H. reflexum, others from H. perforatum) were manually separated from the rest of the stamens using micro chisels (Eppendorf, com) and fixed on carbon conductive adhesive tape (Plano, which was in turn fixed on an ITO slide (Bruker Daltonic, The cryo-sectioned placenta slices (thickness 60 lm) were directly transferred to an indium-tin-oxide (ITO) glass slide. A Staedtler triplus gel-liner (silver, 0.4 mm; Staedtler-Mars, Nürnberg, Germany, was used to place marks close to the samples to define their position. The granular particles of this gel-roller marker were useful to alleviate the laser positioning during LDI-MSI. Stereomicroscopic images were developed using Image J software (National Institutes of Health, Imaging on the Ultraflex III Ò mass spectrometer An Ultraflex III Ò mass spectrometer (Bruker Daltonics) was used for the analysis. The instrument was equipped with a Nd:YAG laser. All spectra were measured in negative reflectron mode. To measure the pixels of ca lm, the minimum laser focus setting (corresponding to a diameter of about 10 lm laser, under-usage of oversampling) was used. For each raster point, a spectrum was accumulated with 40 laser shots and fixed laser intensity. For image reconstruction, FlexImaging version 2.0 software (Bruker Daltonics) was used. For LDI-MSI of the placenta, 4633 raster positions were measured; 4125 positions for the stamens and 1107 positions for the styli and pollen. All signals within a mass range of m/z were recorded. Leaf imaging was performed at 9262 raster positions within a mass range of m/z Forty laser shots per pixel were collected from each position, and then the software calculated the average mass spectrum. ACKNOWLEDGEMENTS We wish to thank Tamara Krügel and the greenhouse team at the Max Planck Institute (Jena, Germany), for raising the Hypericum and Arabidopsis plants. We thank Eva Bremer and Sabine Stahl for providing H. reflexum (Botanical Garden, University Halle-Wittenberg, Halle, Germany), and Louise Hauke (Agrarprodukte Ludwigshof eg, Ranis-Ludwigshof, Germany) and Hans-Jürgen Hannig (Martin Bauer GmbH & Co. KG, Vestenbergsgreuth, Germany) for providing H. perforatum. We are also grateful to Regina Schenk (Humboldt University of Berlin, Germany), Ute Gärber (Julius Kühn- Institut, Bundesforschungsanstalt für Kulturpflanzen, Kleinmachnow, Germany), Wolf-Dieter Blüthner (N.L. Chrestensen GmbH, Erfurt, Germany), Heike Heklau (Botanical Garden University Halle- Wittenberg, Halle, Germany), Hermann Manitz (Herbarium Haussknecht, Jena, Germany) and Johannes Sebastian Nebelmeir (Technical University München-Weihenstephan, Germany) for helpful discussions. We thank Dr Wilmar Schwabe GmbH & Co. KG (Karlsruhe, Germany) for the generous gift of reference compounds, Finzelberg GmbH & Co KG (Andernach, Germany) for larger ª 2009 The Authors Journal compilation ª 2009 Blackwell Publishing Ltd, The Plant Journal, (2009), 60,
255 Matrix-free UV-LDI mass spectrometric imaging at the single-cell level 917 amounts of herba hyperici perforati (minimum 0.1% dianthrone), Roland Kilper (aura optik GmbH, Jena, Germany) for help in establishing the sampling of cell contents using microcapillaries, Jens Sproß for introduction to the preparation of fused silica microcapillaries, and Stephan Imhof (Fachbereich Biologie, University of Marburg, Germany) for permission to use a photograph of a flower of H. perforatum. We also thank Sören-Oliver Deininger (Bruker Daltonics) for technical support and discussion. The authors gratefully acknowledge Emily Wheeler for editing help and Daniel Veit for constructing special slides for LMD and construction of the air-pulse controller system. REFERENCES Aerni, H.R., Cornett, D.S. and Caprioli, R.M. (2006) Automated acoustic matrix deposition for MALDI sample preparation. Anal. Chem. 78, Albert, A. and Ritchie, B. (1942) 9-Aminoacridine. Org. Synth. 22, 5 8. Beerhues, L. (2006) Hyperforin. Phytochemistry, 67, Berghöfer, R. and Hölzl, J. (1989) Isolation of I3,II8-biapigenin (amentoflavone) from Hypericum perforatum. Planta Med. 55, 91. Brandt, S., Kloska, S., Altmann, T. and Kehr, J. (2002) Using array hybridization to monitor gene expression at the single cell level. J. Exp. Bot. 53, Brockmann, H., Pohl, F., Maier, K. and Haschad, M.N. (1942) Über das Hypericin, den photodynamischen Farbstoff des Johanniskrautes (Hypericum perforatum). Justus Liebigs Ann. Chem. 553, Brolis, M., Gabetta, B., Fuzatti, N., Pace, R., Panzeri, F. and Peterlongo, F. (1998) Identification by high-performance liquid chromatography diode array detection mass spectrometry and quantification by high-performance liquid chromatography UV absorbance detection of active constituents of Hypericum perforatum. J. Chromatogr. A, 825, Burrell, M.M., Earnshaw, C.J. and Clench, M.R. (2007) Imaging matrix assisted laser desorption ionization mass spectrometry: a technique to map plant metabolites within tissues at high spatial resolution. J. Exp. Bot. 58, Butterweck, V. (2003) Mechanism of action of St John s wort in depression what is known? CNS Drugs, 17, Caprioli, R.M., Farmer, T.B. and Gille, J. (1997) Molecular imaging of biological samples: localization of peptides and proteins using MALDI-TOF MS. Anal. Chem. 23, Cha, S., Zhang, H., Ilarslan, H.I., Wurtele, E.S., Brachova, L., Nikolau, B.J. and Yeung, E.S. (2008) Direct profiling and imaging of plant metabolites in intact tissues by using colloidal graphite-assisted laser desorption ionization mass spectrometry. Plant J. 55, Charchogylan, A., Abrahamyan, A., Fujii, I., Boubakir, Z., Gulder, T.A.M., Kutchan, T.M., Vardapetyan, H., Bringmann, G., Ebizuka, Y. and Beerhues, L. (2007) Differential accumulation of hyperforin and secohyperforin in Hypericum perforatum tissue cultures. Phytochemistry, 68, Ciccarelli, D., Andreucci, A.C. and Pagni, A.M. (2001) Translucent glands and secretory canals in Hypericum perforatum L. (Hypericaceae): morphological, anatomical and histochemical studies during the course of ontogenesis. Ann. Bot. 88, Cooks, R.G., Ouyang, Z., Takats, Z. and Wiseman, J.M. (2006) Ambient mass spectrometry. Science, 311, Emmert-Buck, M.R., Bonner, R.F., Smith, P.D., Chuaqui, R.F., Zhuang, Z., Goldstein, S.R., Weiss, R.A. and Lotta, L.A. (1996) Laser capture microdissection. Science, 274, Erdelmeier, C.A.J. (1998) Hyperforin, possibly the major non-nitrogenous secondary metabolite of Hypericum perforatum L. Pharmacopsychiatry, 31, 2 6. Esau, K. (1965) Plant Anatomy. New York: Wiley, pp Gädcke, F. (2003) Beispiel: Johanniskraut Herstell- und Qualitätsaspekte pflanzlicher Extrakte. Pharm. Unserer Zeit, 32, Ganzera, M., Zhao, J. and Khan, I.A. (2002) Hypericum perforatum chemical profilingand quantitativeresultsofst. John swortproductsby animproved high-performance liquid chromatography. J. Pharm. Sci. 91, Gaudin, M., Simonnet, X. and Debrunner, N. (2003) Colletotrichum gloeosporioides as the cause of St John s wort (Hypericum perforatum) dieback in Switzerland and breeding for a tolerant variety. In Hypericum: The Genus Hypericum (Ernst, E., ed). London: Taylor & Francis, pp Goodwin, R.J.A., Pennington, S.R. and Pitt, A.R. (2008) Protein and peptides in pictures: imaging with MALDI mass spectrometry. Proteomics, 8, Gronquist, M., Bezzerides, A., Attygalle, A., Meinwald, J., Eisner, M. and Eisner, T. (2001) Attractive and defensive functions of the ultraviolet pigments of a flower (Hypericum calycinum). Proc. Natl Acad. Sci. USA, 98, Handler, A.M. (2000) An introduction to the history and methodology of insect gene transfer. In Insect Transgenesis (Handler, A.M. and James, A.A., eds). Boca Raton, FL: CRC Press, pp Hansen, S.H., Jensen, A.G., Cornett, C., Bjørnsdottir, I., Taylor, S., Wright, B. and Wilson, I.D. (1999) High-performance liquid chromatography on-line coupled to high-field NMR and mass spectrometry for structure elucidation of constituents of Hypericum perforatum L. Anal. Chem. 71, Hölscher, D. and Schneider, B. (2007) Laser microdissection and cryogenic nuclear magnetic resonance spectroscopy: an alliance for cell type-specific metabolite profiling. Planta, 225, Jürgenliemk, G. (2001) Phenolische Inhaltsstoffe aus dem Kraut von Hypericum perforatum L. analytische, biopharmazeutische und pharmakologische Aspekte. PhD Thesis, University of Münster, pp. 69 and 77. Kaul, R. (2000) In Johanniskraut: Botanik, Inhaltsstoffe, Qualitätskontrolle, Pharmakologie, Toxikologie und Klinik. Kapitel 7, Stuttgart, Germany: Wissenschaftliche Verlagsgesellschaft, pp Kelly, R.T., Page, J.S., Luo, Q., Moore, R.J., Orton, D.J., Tang, K. and Smith, R.D. (2006) Chemically etched open tubular and monolithic emitters for nanoelectrospray ionization mass spectrometry. Anal. Chem. 78, Kondo, T., Sawa, S., Kinoshita, A., Mizuno, S., Kakimoto, T., Fukuda, H. and Sakagami, Y. (2006) A plant peptide encoded by CLV3 identified by in situ MALDI-TOF MS analysis. Science, 313, Lange, B.M. (2005) Single-cell genomics. Curr. Opin. Plant Biol. 8, Li, W.K. and Fitzloff, J.F. (2001) High performance liquid chromatographic analysis of St. John s wort with photodiode array detection. J. Chromatogr. B, 765, Li, S.H., Schneider, B. and Gershenzon, J. (2007a) Microchemical analysis of laser-microdissected stone cells of Norway spruce by cryogenic nuclear magnetic resonance spectroscopy. Planta, 225, Li, Y., Shresta, B. and Vertes, A. (2007b) Atmospheric pressure molecular imaging by infrared MALDI mass spectrometry. Anal. Chem. 79, Li, Y., Shresta, B. and Vertes, A. (2008) Atmospheric pressure infrared MALDI imaging mass spectrometry for plant metabolomics. Anal. Chem. 80, Mabberley, D.J. (2008) Mabberley s Plant-Book: A Portable Dictionary of Plants, Their Classification and Uses. Cambridge: Cambridge University Press. Mullen, A.K., Clench, M.R., Crosland, S. and Sharples, K.R. (2005) Determination of agrochemical compounds in soya plants by imaging matrix-assisted laser desorption/ionisation mass spectrometry. Rapid Commun. Mass Spectrom. 19, Müller, W.E. (2003) Current St. John s wort research from mode of action to clinical efficacy. Pharmacol. Res. 47, Nebelmeir, J.S. (2006) Züchtung von Johanniskraut (Hypericum perforatum L.): Entwicklung agronomischer und pharmakologischer Selektionskriterien. PhD Thesis, Technical University of Munich, pp , , Pages, G., Mazarin, M., Sergent, M., Phan-Tan-Luu, R. and Delaurent, C. (2006) Optimization of the assay of naphthodianthrones in dry St John s wort extract by reversed-phase liquid chromatography. Anal. Bioanal. Chem. 385, Piovan, A., Filippini, R., Caniato, R., Borsarini, A., Maleci, L.B. and Cappelletti, E.M. (2004) Detection of hypericins in the red glands of Hypericum elodes by ESI-MS/MS. Phytochemistry, 65, Repčák, M. and Martonfi, P. (1997) The localization of secondary substances in Hypericum perforatum flowers. Biologia, 52, Reyzer, M.L. and Caprioli, R.M. (2007) MALDI-MS-based imaging of small molecules and proteins in tissues. Curr. Opin. Chem. Biol. 11, Robson, N.K.B. (2003) Hypericum botany. In Hypericum: The Genus Hypericum (Ernst, E., ed). London: Taylor & Francis, pp Rubakhin, S.S., Jurchen, J.C., Monroe, E.B. and Sweedler, J.V. (2005) Imaging mass spectrometry: fundamentals and applications to drug discovery. Drug Discov. Today, 10, ª 2009 The Authors Journal compilation ª 2009 Blackwell Publishing Ltd, The Plant Journal, (2009), 60,
256 918 Dirk Hölscher et al. Sasaki, K. and Takahashi, T. (2002) A flavonoid from Brassica rapa flower as the UV-absorbing nectar guide. Phytochemistry, 61, Seeley, E.H. and Caprioli, R.M. (2008) Molecular imaging of proteins in tissues by mass spectrometry. Proc. Natl Acad. Sci. USA, 105, Seger, C., Römpp, H., Sturm, S., Haslinger, E., Schmidt, P.C. and Hadacek, F. (2004) Characterization of supercritical fluid extracts of St. John s wort (Hypericum perforatum L.) by HPCL-MS and GC-MS. Eur. J. Pharm. Sci. 21, Shroff, R., Muck, A. and Svatoš, A.(2007) Analysis of low molecular weight acids by negative mode matrix-assisted laser desorption/ionization timeof-flight mass spectrometry. Rapid Commun. Mass Spectrom. 21, Shroff, R., Vergara, F., Muck, A., Svatoš, A. and Gershenzon, J. (2008) Nonuniform distribution of glucosinolates in Arabidopsis thaliana leaves has important consequences for plant defense. Proc. Natl Acad. Sci. USA, 105, Smelcerovic, A., Zuehlke, S., Spiteller, M., Raabe, N. and Özen, T. (2008) Phenolic constituents of 17 Hypericum species from Turkey. Biochem. Syst. Ecol. 36, Soelberg, J., Jørgensen, L.B. and Jäger, A.K. (2007) Hyperforin accumulates in the translucent glands of Hypericum perforatum. Ann. Bot. 99, Sproß, J. (2007) Monolithic columns for nanolc-esi-ms analysis of proteins and peptides. Diploma Thesis, Friedrich-Schiller-University of Jena, pp Sumner, L.W., Mendes, P. and Dixon, R.A. (2003) Plant metabolomics: largescale phytochemistry in the functional genomics era. Phytochemistry, 62, Tatsis, E.C., Boeren, S., Exarchou, V., Troganis, A.N., Vervoort, J. and Gerothanassis, I.P. (2007) Identification of the major constituents of Hypericum perforatum by LC/SPE/NMR and/or LC/MS. Phytochemistry, 68, Vertes, A., Nemes, P., Shrestha, B., Barton, A.A., Chen, Z.Y. and Li, Y. (2008) Molecular imaging by MID-IR laser ablation mass spectrometry. Appl. Phys. A Mat. Sci. Process, 93, Wolfender, J.-L., Verotta, L., Belvisi, L., Fuzzati, N. and Hostettmann, K. (2003) Structural investigations of isomeric oxidised forms of hyperforin by HPLC- NMR and HPLC-MS. Phytochem. Anal. 14, ª 2009 The Authors Journal compilation ª 2009 Blackwell Publishing Ltd, The Plant Journal, (2009), 60,
257 Publication P11: 4-Deoxyaurone based UV nectar guide formation in Bidens ferulifolia (Jacq.) DC. S. Miosic, K. Knop, D. Hölscher, J. Greiner, C. Gosch, J. Thill, M. Kai, B. Shreshta, B. Schneider, A. C. Crecelius, U. S. Schubert, S. Svatoš, K. Stich, H. Halbwirth J. Exp. Botany 2012, submitted.
258
259 Deoxyaurone based UV nectar guide formation in Bidens ferulifolia (Jacq.) DC. Silvija Miosic 1, Katrin Knop 2, Dirk Hoelscher 3, Jürgen Greiner 1, Christian Gosch 1, Jana Thill 1, Marco Kai 3, Binita Kumari Shrestha 1, Bernd Schneider 3, Anna C. Crecelius 2, Ulrich S. Schubert 2, Aleš Svatoš 3, Karl Stich 1 and Heidi Halbwirth 1 * 1 Institut für Verfahrenstechnik, Umwelttechnik und Technische Biowissenschaften, Technische Universität Wien, Getreidemarkt 9/1665, 1060 Wien, Austria 2 Institut für Organische Chemie und Makromolekulare Chemie (IOMC, Lehrstuhl II/Schubert), Jena Centre for Soft Matter, Friedrich-Schiller Universität of Jena, Humboldtstrasse 10, Jena, Germany 3 Max-Planck-Institut für chemische Ökologie, Hans-Knöll-Str. 8, Jena, Germany *Corresponding author: Phone: , Fax: , hhalb@mail.zserv.tuwien.ac.at Running title: 4-Deoxyaurone formation in Bidens ferulifolia Key words: Bidens ferulifolia, pollinator attraction, floral pattern, yellow flower colour, anthochlor pigments (aurones and chalcones), aurone synthase, chalcone 3-hydroxylase Valid addresses of authors: silvija_miosic@yahoo.de, k.knop@uni-jena.de, hoelscher@ice.mpg.de, j.greiner@fastbone.com, christian.gosch@tuwien.ac.at, jthill@mail.zserv.tuwien.ac.at, mkai@ice.mpg.de, binita.shrestha88@yahoo.com, schneider@ice.mpg.de, anna.crecelius@uni-jena.de, Ulrich.Schubert@uni-jena.de, svatos@ice.mpg.de, kstich@mail.zserv.tuwien.ac.at, Date of submission: April 13, 2012 Number of figures: 7 (2, 4, 5: in colour) Number of tables: 1 Number of supplementary figures: 1 Number of supplementary tables: 2 Total word count: (6612 words). 32 1
260 Summary (250 words) The formation of 4-deoxyaurones, which serve as UV nectar guides in Bidens ferulifolia (Jacq.) DC., was studied by combination of UV photography, mass spectrometry, and biochemical assays. The yellow flowering ornamental plant accumulates deoxy-type anthochlor pigments (6 - deoxychalcones and the corresponding 4-deoxyaurones) in the basal part of the flower surface whilst the apex contains only yellow carotenoids. For UV sensitive pollinating insects, this appears as a bicoloured floral pattern, the so-called bull s eye, which can be visualized in situ by specific ammonia staining of the anthochlor pigments. The petal back side, in contrast, shows a faintly UV absorbing centre and UV absorbing rays along the otherwise UV reflecting petal apex. Matrix-free UV laser desorption/ionisation mass spectrometric imaging (LDI-MSI) indicated the presence of 9 anthochlors in the UV absorbing areas. The prevalent pigments were derivatives of okanin and maritimetin. Enzyme preparations from flowers, leaves, stems and roots of B. ferulifolia and from plants, which do not accumulate aurones e.g. Arabidopsis thaliana, were able to convert chalcones to aurones. Thus, aurone formation could be catalyzed by a widespread enzyme and seems to depend mainly on a specific biochemical background, which favours the formation of aurones at the expense of flavonoids. In contrast to 4-hydroxyaurone formation, hydroxylation and oxidative cyclization to the 4-deoxyaurones does not occur in one single step but is catalyzed by two separate enzymes, chalcone 3-hydroxylase and aurone synthase. Aurone formation shows an optimum at ph 7.5 or above, which is another striking contrast to 4-hydroxyaurone formation in Antirrhinum majus L
261 Abbreviations: ANS: anthocyanidin synthase, AUS: aurone synthase, CH3H: chalcone 3- hydroxylase, CHAPS: 3-[(3-cholamidopropyl)dimethylammonio]-1-propanesulfonate, CHI: chalcone isomerase, CHR: chalcone reductase, CHS: chalcone synthase, DOPA: 3,4- dihydroxyphenylalanine, DFR: dihydroflavonol 4-reductase, FHT: flavanone 3-hydroxylase, F3 H: flavonoid 3 -hydroxylase, FNSII: flavone synthase II, FW: fresh weight; HPLC: high-performance liquid chromatography, LC-MS: liquid chromatography-mass spectrometry, LDI-MSI: matrix-free UV-laser desorption/ionisation mass spectrometric imaging, PPO: polyphenol oxidase, UV: ultraviolet 64 3
262 Introduction Flower colour is a result of the evolutionary development from undirected pollination by wind to directed pollination by a specific vector (Briscoe and Chittka 2001; Chittka et al. 1994; Harborne 1993; Menzel and Shmida 1993). Yellow coloration appeared as an adaptation to the colour sense of insects as the prevalent pollinators in temperate zones (Harborne 1993). Many Asteraceae species accumulate two types of yellow pigments, carotenoids and anthochlors. In Bidens sp., the carotenoids are uniformly distributed across the petal whereas the anthochlors are concentrated at the petal base (Harborne and Smith 1978; Scogin and Zakar 1976). Such patterns are know as nectar guides (synonym: honey guides, pollen guides) (McCrea and Levy 1983). For humans, the flowers are monochromatically yellow; however for UV sensitive insects the flowers appear bicoloured because of the different UV absorbance of carotenoids and anthochlors (Briscoe and Chittka 2001; Daumer 1958). Bidens ferulifolia is an interesting model plant for studying both nectar guide formation and anthochlor biosynthesis, which is not completely understood so far (Davies et al. 2006) Although the occurrence of anthochlors (chalcones and aurones) is not restricted to flower tissues they are mostly noticed as the yellow flower pigments in Asteraceae species, snapdragon (Antirrhinum majus L.) and carnations (Dianthus caryophyllus L.) (Davies et al. 1997; Harborne 1967). Anthochlors are frequently ranked among flavonoids, but their structure cannot be derived from the flavonoid skeleton (Figure 1). Hydroxy-types and deoxy-types are distinguished, depending on whether or not the position 6 of chalcones and the corresponding position 4 of aurones carry a hydroxyl group. In Asteraceae, anthochlor pigments of the deoxy-type are typically found with the exception of Helichrysum bracteatum which accumulates the hydroxy-type pigments as Antirrhinum majus (Harborne 1967). Whereas 6 -hydroxychalcones rapidly isomerise - either chemically or enzymatically - to the corresponding flavanone, the 6 -deoxychalcones are chemically stable and are not converted by common chalcone isomerases (CHI). Anthochlors are easily detected by a specific colour switch from yellow to orange when exposed to ammonia or the alkaline vapour of a cigarette (Harborne 1967). This is due to the ph dependent transition of the undissociated phenol groups to phenolates. Consequently, the absorbance spectrum of the 4
263 pigments shows a bathochromatic shift of approx. 100 nm from the violet to the blue range of the spectrum (Supplementary Figure1). This results in a corresponding shift of the reflected wavelengths, which is perceived as colour switch by the human eye In contrast to the well-studied flavonoid pathway, the knowledge on the formation of anthochlors and particularly of aurones is still limited. The formation of aurones competes with flavonoid formation for chalcones as the immediate biochemical precursors. During the past decade, aurone formation in plants was exclusively studied in A. majus, (Nakayama et al. 2001; Nakayama et al. 2000; Ono et al. 2006a; Ono et al. 2006b; Sato et al. 2001). In addition it was shown that fungal catechol oxidases can also catalyze aurone formation (Nakayama et al., 2000; Sanchez-Gonzalez and Rosazza 2006). Aureusidine synthase from A. majus, a soluble, bifunctional polyphenol oxidase (PPO) homologue (monooxygenase and dioxygenase activity) catalyzes the hydroxylation and oxidative cyclization of chalcones to aurones. In the suggested reaction mechanism (Nakayama 2002), the monoxygenase activity is particularly crucial to explain the occurring 3,4- and 3,4,5-hydroxylation pattern of the aurones present in A. majus. In addition, it is essential for the conversion of the monohydroxylated naringenin chalcone, because oxidative cyclization occurs only in the presence of hydroxyl groups in ortho-position. Aureusidine synthase accepted also 6 - deoxychalcones although they are not native substrates in A. majus. Thus, it was assumed that formation of 4-deoxyaurones in Asteraceae species follows a similar mechanism (Nakayama 2002); however, this was not tested so far in a 4-deoxyaurone producing plant Using a combined approach of mass spectrometry, biochemical assays, and UV photography, we investigated for the first time the formation of 4-deoxyaurones in Bidens ferulifolia (Jacq.) DC. We show that the hydroxylation step of the B-ring requires the presence of an additional hydroxylating enzyme. In addition, we demonstrate for the first time that the ability of aurone formation is frequently present in plants and not necessarily correlated to aurone accumulation, thereby contributing a novel perspective to the knowledge of aurone biosynthesis in general. 5
264 Results (1381 words) Anthochlors and flavonoids in Bidens ferulifolia petals The presence of anthochlor pigments and flavonoids in the Bidens petals was analysed by a combined approach of matrix-free UV laser desorption/ionisation mass spectrometric imaging (LDI- MSI), LC-MS and HPLC with emphasis on identifying the chalcone and aurone core structures. LDI-MSI demonstrated the presence of 9 mass peaks corresponding to 6 core structures of anthochlor pigments or flavonoids and the corresponding monoglucosides, respectively (Figure 2). A mass peak related to isoliquiritigenin 4 -O--D-glucoside (m/z 417) was not detected. Mass peaks m/z 269, 271, 285, 287, 431, 433, 447 and 449 were not clearly related to a specific compound because the presence of several mass isomers could be expected (Figure 3). The compounds were further identified by LC-MS measurement of exact mass and retention time in comparison to commercially available reference compounds (Figure 3). The native methanolic extracts contained anthochlors as aglycones and glycosides. The latter were not identified further because the glucosylation pattern of the pigments is not decisive for the nectar guide formation. The presence of those glycosides, which were not available as commercial references, was investigated after enzymatic hydrolysis and the glucose position was tentatively allocated according to the literature (Halbwirth et al. 1997; Harborne 1967). Thus, the LDI-MSI mass peaks could be allocated to specific compounds as follows: m/z 269 (sulfuretin), m/z 271 (butein), m/z 285 (maritimetin/luteolin), m/z 287 (okanin), m/z 431 (sulfuretin 6-O--D-glucoside), m/z 433 (butein 4 - O--D-glucoside), m/z 447 (maretimein/luteolin 7-O--D-glucoside) and m/z 449 (marein). The presence of 3,4,5,6-tetrahydroxyaurone and robtein and their glycosides could be excluded (Figure 3). The abundance of the main pigments was estimated by HPLC. After enzymatic hydrolysis of methanolic extracts, okanin (2.6 mg ± 0.5/10 g FW) followed by maritimetin (1.3 mg ± 0.7/10 g FW) and butein (0.4 mg ± 0.3/10 g FW) were the prevalent anthochlor pigments. High amounts of the flavone luteolin (1.4 mg ± 0.4/10 g FW) were also present. Nectar guides UV photography of B. feruliulifolia showed the presence of the typical bulls-eye, which is composed of a UV absorbing petal base and a UV reflecting apex (Figure 4 a). The back side, in contrast, 6
265 showed a different pattern with a faintly UV absorbing centre and UV absorbing rays along the otherwise UV reflecting petal apex (Figures 4 e). Staining with ammonia led to a colour switch of the petal base in the same areas (Figure 4 b, c, f, g), indicating that the UV nectar guides are based on the local accumulation of anthochlor pigments as described earlier (Scogin and Zakar 1976). Particularly the veins were intensively stained along the whole petal (Figure 4 d, g, h). The anthochlors are present in the epidermal layer of both sides of the petal base (Figure 4 i, j), whereas in the cross sections of the apex only the veins at the back side were stained (Figure 4 g, k, l). Petals from all developmental stages showed the typical colour switch after ammonia staining. However, petals of closed buds were two times folded and only the back side was visible at the early stages of flower anthesis. In contrast to Bidens sp, Coreopsis grandiflora Hogg ex Sweet and Cosmos sulphureus Cav showed a complete colour switch demonstrating the uniform distribution of anthochlor pigments in their petals (Figure 4 m-p) In the LDI-MS image, all 9 mass peaks showed a similar distribution along the petal and were exclusively present at the base but not in the apex of the petals front side (Figure 2). LDI-MSI was also possible when the petals were stained with ammonia, however, this negatively affected leaf quality, with the exception of imaging of the veins. It appears that the ammonia might soften the relatively stiff structure of the veins thereby facilitating the extraction of the analytes. All mass peaks were found on both petal sides with the exception of the mass peaks m/z 433 and m/z 431, which were present only on the front side. 4-Deoxyaurone formation in B. ferulifolia Incubation of butein with enzyme preparations from B. ferulifolia petals led to the formation of one product which was identified as sulfuretin by comparison with the authentic reference compound (Figure 6 a). No formation of robtein or 5 -hydroxysulfuretin could be observed under standard conditions. Apart from butein, the enzyme accepted the 6 -deoxychalcones okanin and robtein as substrates and converted them into the corresponding aurones maritimetin and 5 - hydroxysulfuretin. Butein 4 -O-glucoside was converted into sulfuretin 6-O-glucoside accordingly. Hydroxylating activity in addition to the ring closure could be observed in none of the assays. When marein was offered as a substrate, the formation of okanin and the corresponding aurone 7
266 maritimetin could be detected. No product formation could be observed when isoliquiritigenin or naringenin chalcone were offered, neither under standard conditions nor in the presence of 3-[(3- cholamidopropyl)dimethyl-ammonio]-1-propanesulfonate (CHAPS) and/or hydrogen peroxide (H 2 O 2 ). Eriodictyol chalcone was also converted to aureusidine and bracteatin but was an unsuitable substrate for enzyme characterisation due to chemical instability in both acidic and alkaline environment Formation of aurones was cataylzed by enzyme preparations from flower tissues, leaves, stems and roots (Supplementary Table 1). Flower tissues included petals from disc florets and 3 developmental stages of ray florets and sepals. Highest activities were observed in roots followed by open flowers; lowest activities were found in leaves. The presence of ascorbate strongly influenced the AUS activity. When no ascorbate was present in the buffer during the enzyme preparation, neither the substrate nor the product could be detected in the assay. The presence of ascorbate concentrations up to 0.02 μm during enzyme preparation did not affect product formation. At higher concentrations, the AUS activity decreased steadily. Aurone formation showed a high dependence on substrate concentration. Thus, highest activities were observed in the presence of a substrate concentration as low as 0.5 mm and decreased steadily with increasing concentrations. However, product formation could be also observed in the presence of 30 mm Using butein as a substrate, the reaction showed highest activities at ph 7.5. At lower ph values, the activity decreased rapidly, at higher ph values slowly. At ph 5.5, 25 % of the activity compared to the ph optimum was observed (Table 1). ph Optima for okanin, robtein and butein 4 O-glucoside were slightly higher (Table 1). Eriodictyol chalcone was converted at acidic and alkaline conditions. Quantification, however, was not possible because of substrate instability. The reaction was characterized in more detail using [ 14 C]butein as substrate. Highest reaction rates were observed at 25 C. At 60 C, reaction rates still reached 21 % of the values measured at 25 C; at temperatures higher than 60 C no AUS activity could be observed. In the presence of heat inactivated preparations, no product formation was observed at any ph or temperature tested. The reaction was linear with time up to 15 min and with protein concentrations up to 3 μg. 8
267 Flavonoid metabolism in Bidens petals Enzyme preparations from petals of B. ferulifolia were analysed for the presence of enzymes activities of the pathways leading to anthochlors and flavonoids. The activities of chalcone synthase/chi, flavanone 3-hydroxylase, flavone synthase II, AUS, flavonoid 3 -hydroxylase, and CH3H could be detected in the petals (Supplementary Table 2). Dihydroflavonol 4-reductase (DFR) activity was not found. A type II CHI activity, which catalyzes the isomerisation of 6 - deoxychalcones to the corresponding 5-deoxyflavanones (Shimada et al. 2003) was not detected either. The presence of a chalcone reductase (synonyms: polyketide reductase, chalcone ketide reductase) (Welle and Grisebach 1988) activity (CHR) could not be demonstrated. All enzymes detected showed higher activities in the petal base compared to the apex but were clearly present in both parts. 4-Deoxyaurone formation with enzyme preparations from further plants Enzyme preparations from further plants which do not naturally accumulate anthochlor pigments, were also able to catalyze the conversion of 6 -hydroxychalcones and 6 -deoxychalcones to the corresponding aurones (Figure 6). This included a number of other ornamental plants from the Asteraceae family e.g. Tagetes erecta and R. hirta, but also members of other plant families e.g. A. majus, Petunia hybrida, D. caryophyllus and A. thaliana (Figure 6). In A. majus, AUS activity was present in enzyme preparations from petals and leaves (Figure 6 c, d). B. ferulifolia and A. majus showed a striking difference in the acceptance of isoliquiritigenin as a substrate (Figure 6 i, j). Enzyme preparations from A. majus catalyzed the formation of butein and sulfuretin from isoliquiritigenin. Addition of H 2 O 2 or CHAPS was not required. The presence of KCN strongly decreased the formation of butein and sulfuretin whereas the cytochrome P450 specific inhibitors ketoconazol and ancymidol did not. B. ferulifolia, in contrast, converted isoliquiritigenin only in the presence of NADPH to butein Discussion (1366 words) The ornamental plant B. ferulifolia is an easily accessible model for studying UV nectar guides because a rapid visualization by ammonia staining instead of UV photography, which needs specialized equipment, is possible. In addition, B. ferulifolia offers the possibility to study for the 9
268 first time the biosynthesis of aurones in plants, which accumulate the deoxy type anthochlors as flower pigments. Studies on the deoxy type pathway have the advantage that the chemically stable 6 -deoxychalcones are the native substrates for aurone formation and no competition for common precursors for flavanone formation by CHI occurs. B. ferulifolia was preferred over other Asteraceae species as model plant because the irregular distribution in the petals and the striking presence particularly in veins offers interesting possibilities for future studies on the regulation and tissue or cell specific formation of anthochlors in the flowers Deoxyaurone formation The presence of 9 compounds belonging to the class of anthochlor pigments was observed. Surprisingly 5 of them were aglycones although in the literature the corresponding glycosides are reported (Scogin and Zakar 1976). Whereas the presence of compounds based on isoliquiritigenin, butein, sulfuretin, okanin and maritimetin was expected for Bidens sp., the presence of anthochlor pigments carrying 3 hydroxyl groups in the B-ring was not reported and could not be demonstrated in our studies either. This allows important clues on the mechanism of 4-deoxyaurone formation, because it demonstrates that AUS does not introduce an additional hydroxyl group in the B-ring as part of the catalytic mechanism as is the case in 4-hydroxyaurone formation Formation of aurones has only been studied in the 4-hydroxyaurone accumulating A. majus so far and was shown to be catalyzed by the so-called aureusidine synthase (Nakayama et al., 2000). However, we favour the more general term aurone synthase (AUS), because the enzyme catalyzes the formation of both aureusidine and bracteatin from eriodictyol chalcone and also accepts other chalcone substrates. This is also in better agreement with the physiological activity in Asteraceae where aureusidine formation is not native. In B. ferulifolia, AUS activity was present in different flower tissues including non-aurone accumulating sepals, but also in roots, stems and leaves. Furthermore, aurone formation could be demonstrated with enzyme preparations from a number of plants which do not naturally accumulate aurones including A. thaliana. Thus, the presence of AUS activity is not specifically correlated with aurone occurrence. One possible explanation is that aurone formation is catalyzed by an unspecific enzyme e.g. a PPO because 10
269 AUS was classified as being a Cu 2+ containing PPO homologue. This is supported by the fact that the suggested reaction mechanism is actually based on an enzymatic o-quinone formation, which is a classical PPO reaction, followed by a non-enzymatic cyclization step (Strack and Schliemann 2001). The argument against is that the purified aureusidine synthase specifically acted on chalcones whereas DOPA, which is one of the most common substrates for PPOs, was not accepted (Nakayama et al., 2000) The observed ability of aurone formation in non-aurone accumulating plants and tissues is obviously not of physiological relevance and could be also due to the presence of PPOs, particularly from chloroplasts in the leaves. On the other hand, enzyme preparations from B. ferulifolia petals, in which aurone formation is of physiological relevance, did not show a specifically higher or different AUS activity than the other tissues and the observed substrate acceptance and product formation was in accordance with the anthochlors identified in the petals. Davies et al. (2006) showed that AUS expression in different A. majus lines did not correlate with aurone formation and suggested the presence of a multigene family An explanation for the absence of aurones in most plants despite the common presence of a PPO type AUS activity is that aurone formation can occur only in a special biochemical background. The formation of 4-deoxyaurones requires a 6 -deoxychalcone precursor, which is provided by a rare CHR (synonyms: polyketide reductase, chalcone ketide reductase) found only in few plants so far (Bomati et al. 2005; Welle and Grisebach 1988). The immediate biochemical precursors of 4- hydroxyaurones, in contrast, are commonly formed in ornamental species (Forkmann and Heller 1999). However, they need to be present in vacuoles where aurone formation is suggested to take place (Ono et al., 2006b). This occurs only in mutants lacking the activities of CHI and of at least one further enzyme in the flavonoid pathway (Forkmann and Dangelmayr 1980). Thus, in the competition between flavanone and aurone formation velocity of the involved enzymes and further unknown factors must be decisive. AUS based biotechnological approaches to introduce yellow flower were not really convincing so far (Bradley et al. 2000; Ono et al., 2006a). It appears that a careful selection of the parental line is essential. 11
270 Our studies have identified several crucial differences between the aurone formation in A. majus and B. ferulifolia. Most important is the lack of the monooxygenase activity during the reaction regardless which 6 -deoxychalcone substrate was used. Thus, butein was converted to sulfuretin only, and isoliquiritigenin was not accepted as substrate. This is supported by the fact that the presence of robtein and tetrahydroxychalcone in Bidens sp. has never been reported in literature and could also not be demonstrated in our investigations. Thus, the presence of two vicinal hydroxy groups in the chalcone precursor is indispensable, which must be introduced by a separate enzyme. Recently, chalcone 3-hydroxylase (CH3H) activity was described for the first time in Cosmos sulphureus (Schlangen et al. 2010) and was also demonstrated in our enzyme preparations from B. ferulifolia petals (Supplementary Table 2). This is in clear contrast to 4- hydroxyaurone formation where hydroxylation and cyclization can be catalyzed in one single step (Sato et al., 2001). This is also supported by the fact that butein formation from isoliquiritigenin by enzyme preparations from A. majus decreased in the presence of the PPO inhibitor KCN whereas cytochrome P450 specific inhibitors had no influence A second important difference was the dependence of the reaction on ph. Highest activities were observed at alkaline conditions. Even though the observed optima for all substrates except butein were above physiological relevance, the activity was still high at ph 7.0, but low in the range of ph , where AUS shows it s ph maximum (Sato et al., 2001). From the observed ph optima it is more likely that 4-deoxyaurone formation takes place in the cytosol and not in the vacuoles as shown for 4-hydroxyaurone formation in A. majus (Ono et al., 2006b) Nectar guides Nectar guides are the most subtle visual signals of flowers aiming at brand recognition and persistent attraction of individual pollinators to ensure directed and specific pollination of a plant species (Leonard and Papaj 2011). They are caused by the irregular spatial distribution of compounds with divergent light absorbance behaviour at the petal s front side. Depending on the absorbance spectrum of the pigments and the visual sense of the target pollinator such floral 12
271 patterns can be invisible to the human s eye and are typically visualized by UV photography (McCrea and Levy 1983). Although the occurrence of UV nectar guides was largely investigated (Clark 1979; Guldberg and Atsatt 1975; Harborne and Smith 1978; Rieseberg and Schilling 1985), in-depth studies on the chemical base are so far limited to the flavonol-based UV nectar guides in R. hirta (Schlangen et al. 2009; Thompson 1972) where it was shown that the spatial distribution of specific flavonols rather than a +/- system of flavonols in general is creating the pattern. In B. ferulifolia, however, nectar guides are based on other pigments and ammonia staining clearly demonstrated the presence of a +/- system of anthochlor pigments on the petal front side. On the back side, in contrast, anthochlor pigments are found at both the base and apex, but are restricted to the veins in the apex. The typical bulls-eye pattern of the front side is established already in the earliest developmental stages but remains hidden to pollinators until the buds are open and the petals unfolded. Recently, LDI-MSI proved to be highly suitable for the localization of secondary metabolites in plant tissues even at single-cell resolution (Hölscher et al. 2009). Our work demonstrates the suitability of this technique for the non-destructive investigation of (UV) colour patterns in plants providing information of the chemical composition and the local distribution simultaneously B. ferulifolia flowers are yellow due to the absence of anthocyanins as a result of lacking DFR activity. The enzyme activities required for the nectar guide formation could be detected in the base and apex of the petals. Because anthochlor pigments are also present in the apex veins on the back side this was not surprising. However, it remains a puzzle in which way the nectar guides are formed. This requires a tight cell specific regulation, resulting in anthochlor pigment formation in the epidermis at the front and back side of the petal base whereas in the apex the pathway is exclusively activated in the veins. For anthocyanin formation in A. majus, it was recently shown that epidermal specific venation is defined by overlapping expression domains of two coregulators of the pathway (Shang et al. 2010) Conclusions Our knowledge on aurone biosynthesis is still limited in many aspects including the question how 13
272 tissue and cell specific formation is regulated. Our studies have shown that the presence of aurone synthase activity is more common than originally assumed. This strongly indicates that the decisive evolutionary step for aurone accumulation rather concerned the provision of suitable chalcone precursors than the actual ring closure step. The establishment of the 4-deoxyaurone pathway (Figure 7) is the first crucial step for future studies on aurone formation at the molecular level. Our studies have demonstrated the advantages of the 4-deoxyaurone system, particularly with respect to the chemical stability of the 6 -deoxychalcone substrates and the absence of immediate competition of CHI and AUS for the same precursors which allows directly studying aurone formation with enzyme preparations from different plant tissues. Thus, Asteraceae species could be an excellent model system to investigate various aspects of aurone formation including regulatory issues EXPERIMENTAL PROCEDURES (1004 WORDS) Plant material The investigations were carried out on Bidens ferulifolia L. flowers purchased as potted plants (Bellaflora, Vienna, Austria, and cultivated in the experimental field of TU Wien in Vienna in summers Three developmental flower stages were collected: buds (folded petals, 5 mm length), opening flowers (unfolding petals, 9 mm length) and open flowers (unfolded petals, 12 mm length). Petals of Rudbeckia hirta L. cv. Indian Summer, Tagetes erecta L. cv. Antigua F 1 gelb and Antirrhinum majus L. cv. Sonnett F 1 gelb, Petunia hybrida cv. White Corso (all grown from seeds of Austrosaat, Vienna, Austria, were also collected from the experimental field, yellow and white carnations were purchased as cut flowers from a local flower shop. Seeds of Arabidopsis thaliana Col-0 were obtained from the European Arabidopsis Stock Centre NASC and cultivated at standard conditions. UV photography For UV photography, flowers or petals were radiated with a Camag Reprostar II at 366 nm (Camag, Muttenz, Switzerland). Pictures were taken with a Nikon D100 digital camera and a UV Nikkor lens (f=105 mm, 1:4.5, Nikon, Vienna, Austria, together with the UV 14
273 pass filter B+W (Schneider, Bad Kreuznach, Germany, and are shown as monochromes. Microsocopy Petals were treated as described (Braune et al. 1967). The tissue was infiltrated with a series of glycerol-water dilutions (v/v 1:10, 1:5, 1:1) for one hour each. After the infiltration process, crosssections were sliced manually from the petals still embedded in the glycerol-water 1:1. The slices were transferred to a microscope slide and were embedded either in water (native) or in a solution of 2 M ammonia in (1:1) glycerol-water. The preparations were examined under a Carl Zeiss Axio Scope A1 microscope (Zeiss, Vienna, Austria, and pictures were taken using a Canon G10 (Canon, Vienna Austria, connected to the microscope via a conversion Canon lens adapter LA-DC58K (Zeiss No ). Chemicals [ 14 C]Isoliquiritigenin and [ 14 C]butein were synthesised as described (Halbwirth et al. 2006) from 4- hydroxy[ring-u- 14 C]benzaldehyde (33.1 MBq/mg) (Amersham International, UK, Isoliquiritigenin, butein, sulfuretin, luteolin, marein, maritimein, luteolin 7-O-glucoside and eriodictyol chalcone were purchased from Extrasynthesis (Genay, France, robtein from TransMIT-MPC (Giessen, Germany, Okanin and maritimetin were obtained by enzymatic hydrolysis from marein and maritimein, respectively. Briefly, 20 μg of the glycoside dissolved in 20 μl ethanol were incubated for 30 min at 30 C with 10 μg naringinase (Sigma-Aldrich, Vienna, Austria, in 80 μl 0.1 M McIlvaine buffer ph 5.5. LC-MS analysis The LC-MS analysis was performed using the Ultimate 3000 series RSLC (Dionex, Sunnyvale, CA, USA, system and the Orbitrap XL mass spectrometer (Thermo Fisher Scientific, Bremen, Germany, equipped with an ESI source. HPLC was accomplished using the Acclaim C18 Column (150 x 2.1 mm, 2.2 μm; Dionex) at a constant flow rate of 300 μl/min using a binary solvent system: solvent A contains water with 0.1 % formic acid (Roth, Karlsruhe, Germany, and solvent B contains acetonitrile 15
274 (hypergrade for LC MS, Merck KGaA, Darmstadt, Germany, with 0.1% formic acid. Ten μl were injected into the HPLC gradient system started with 0.5% B and linearly increased to 10 % B in 10 min and to 80 % in 14 min and was then held for 5 min, before being brought back to the initial conditions and held for 6 min for re-equilibration of the column for the next injection. Capillary voltage was set to 35 V and transfer capillary temperature to 275 C. Measurements were performed in negative mode using the Orbitrap analyzer. Full scan mass spectra (x to y) were generated using 30,000 resolving power and processed and visualized using Xcaliber xx software. Imaging on the Ultraflex III mass spectrometer A carbon conductive adhesive tape (Plano, Wetzlar, Germany, was fixed on an Indium Tin Oxide slide (Bruker Daltonics, Bremen, Germany, to fix the petals on the slide. The rims of the leave were used for the laser positioning during LDI-MSI. An Ultraflex III mass spectrometer (Bruker Daltonics) equipped with a Nd:YAG laser was used for the analysis. All spectra were measured in negative reflectron mode. A raster of 75 x 75 μm and the large laser focus settings with constant laser intensity and a shot rate of 50 Hz were used. For LDI- MSI of the front side, 9494 raster positions were measured; and positions for the back side were recorded within a mass range of m/z For each raster point, a spectrum was accumulated with 230 laser shots for the front side; and 100 laser shots for the back side; respectively. For image reconstruction, FlexImaging version software version 2.0 (Bruker Daltonics) was used. HPLC HPLC analysis was performed on a Perkin Elmer Series 200 system (Perkin Elmer, Vienna, Austria, equipped with a photodiode array detector coupled with a 500TR Flow Scintillation Analyzer for the detection of radiolabeled substances according to Chandra et al. (2001) for assays with okanin and marein as substrates and according to Vande Casteele et al. (1982) for all other compounds. Enzyme preparation 0.5 g plant material, 0.25 g polyclar AT (Serva, Mannheim, Germany, and 16
275 g quartz sand (VWR Vienna, Austria, were homogenized with 3 ml buffer in a mortar. The homogenate was centrifuged for 10 min at 10,000 x g and 4 C. To remove low molecular compounds, crude enzyme preparations were passed through a gel chromatography column (Sephadex G25, GE Healthcare, Freiburg, Germany, Extraction buffers generally contained 0.4 % (v/v) sodium ascorbate (Sigma). For AUS assays, enzyme preparations were liberated from ascorbate during the gel extraction step. Protein content was determined by a modified Lowry procedure (Sandermann and Strominger 1972) using crystalline bovine serum albumine as a standard. Enzyme assays Assays for CHS/CHI, CH3H, DFR, FHT, FNS II and F3 H were performed as described earlier (Halbwirth et al. 2008; Schlangen et al., 2010). Enzyme characterization All data represents an average of at least three independent experiments. Determination of the ph optimum was carried out as described for the standard aurone synthase assay, but using 0.2 M McIlvaine buffers with ph values between 4.5 and 9.0. Standard assay for aurone synthase The reaction mixture in a final volume of 100 L contained: 1 nmol [ 14 C]butein (150 Bq) or 10 nmol unlabelled anthochlor, 3 μg enzyme preparation, 90 μl 0.1 M K 2 HPO 4 /KH 2 PO 4 buffer ph 7.5. The reaction was started by the addition of the enzyme preparation and the assay was incubated for 15 min at 30 C. The reaction was stopped by addition of 10 μl glacial acetic acid and 70 μl methanol (both VWR). After centrifugation for 10 min at 22,000 x g 100 μl of the reaction mixture were subjected to HPLC analysis. 17
276 ACKNOWLEDGEMENTS These investigations were supported by grants from the Austrian Science Fund (FWF): [Projects V18-B03 and P24331-B16]. J. Thill acknowledges her Marie Curie scholarship from EU (MRTN_CT ). H. Halbwirth and J. Greiner would like to thank Dr. Sylvia Plaschil (JKI Quedlinburg, Germany) for the introduction into microscopic techniques. U. S. Schubert thanks the Dutch Polymer Institute (DPI, technology area HTE) for financial support. This work was performed in the frame of Cost Action FA1006. SUPPLEMENTAL INFORMATION Additional information may be found in the online version of this article: Supplementary Figure 1: Absorbance spectra of the chalcone butein and the aurone sulfuretin in acidic and alkaline environment. Supplementary Table 1: AUS activity in different tissues of B. ferulifolia Supplementary Table 2: Flavonoid and 4-deoxyaurone biosynthesis in the base and apex of the petals of buds and flowers
277 References Bomati, E.K., Austin, M.B., Bowman, M.E., Dixon, R.A. and Noel, J.P. (2005) Structural elucidation of chalcone reductase and implications for deoxychalcone biosynthesis. Journal of Biological Chemistry, 280, Bradley, J., Winefield, C., Schwinn, K., Martin, C., Bloor, S., Davies, K. and Spiller, G. (2000) Genetic engineering for yellow flower colours, pp Braune, W., Leman, A. and Taubert, H. (1967) Pflanzenanatomisches Praktikum. Jena: Fischer VEV, pp Briscoe, A.D. and Chittka, L. (2001) The evolution of color vision in insects. Annual Review of Entomology, 46, Chandra, A., Rana, J. and Li, Y. (2001) Separation, identification, quantification, and method validation of anthocyanins in botanical supplement raw materials by HPLC and HPLC-MS. Journal of agricultural and food chemistry, 49, Chittka, L., Shmida, A., Troje, N. and Menzel, R. (1994) Ultraviolet as a component of flower reflections, and the colour perception of Hymenoptera. Vision Research, 34, Clark, C. (1979) Ultraviolet absorption by flowers of the Eschscholzioideae (Papaveraceae). Madroño, 26, Daumer, K. (1958) Blumenfarben, wie sie die Bienen sehen. Journal of Comparative Physiology A: Neuroethology, Sensory, Neural, and Behavioral Physiology, 41, Davies, K., Schwinn, K., Geneve, R., Preece, J. and Merkle, S. (1997) Flower colour. In Biotechnology of ornamental plants. (Geneve, R.L.P., J.E.Merkle, S.A. ed. Wallingford CAB INTERNATIONAL, pp Davies, K.M., Marshall, G.B., Bradley, J.M., Schwinn, K.E., Bloor, S.J., Winefield, C.S. and Martin, C.R. (2006) Characterisation of aurone biosynthesis in Antirrhinum majus. Physiologia Plantarum, 128, Forkmann, G. and Dangelmayr, B. (1980) Genetic control of chalcone isomerase activity in flowers of Dianthus caryophyllus. Biochemical Genetics, 18, Forkmann, G. and Heller, W. (1999) Biosynthesis of flavonoids. In Comprehensive Natural Products Chemistry (D. Barton, K. Nakanishi, O. Meth-Cohn and Sankawa, U. eds): Elsevier Science, Amsterdam, pp Guldberg, L.D. and Atsatt, P.R. (1975) Frequency of reflection and absorption of ultraviolet light in flowering plants. American Midland Naturalist, 93, Halbwirth, H., Kahl, S., Jager, W., Reznicek, G., Forkmann, G. and Stich, K. (2006) Synthesis of (14C)-labeled 5-deoxyflavonoids and their application in the study of dihydroflavonol/leucoanthocyanidin interconversion by dihydroflavonol 4-reductase. Plant Science, 170, Halbwirth, H., Muster, G. and Stich, K. (2008) Unraveling the Biochemical Base of Dahlia Flower Coloration. Nat. Prod. Comm, 3, Halbwirth, H., Wimmer, G., Wurst, F., Forkmann, G. and Stich, K. (1997) Enzymatic glucosylation of 4-deoxyaurones and 6-deoxychalcones with enzyme extracts of Coreopsis grandiflora, Nutt. I. Plant Science, 122, Harborne, J.B. (1967) Comparative Biochemistry of Flavonoids London: Academic Press. Harborne, J.B. (1993) Introduction to ecological biochemistry: Academic Press. Harborne, J.B. and Smith, D.M. (1978) Anthochlors and other flavonoids as honey guides in the Compositae. Biochemical Systematics and Ecology, 6, Hölscher, D., Shroff, R., Knop, K., Gottschaldt, M., Crecelius, A., Schneider, B., Heckel, D.G., Schubert, U.S. and Svatoš, A. (2009) Matrix free UV laser desorption/ionization (LDI) mass spectrometric imaging at the single cell level: distribution of secondary metabolites of Arabidopsis thaliana and Hypericum species. The Plant Journal, 60, Leonard, A.S. and Papaj, D.R. (2011) X marks the spot: The possible benefits of nectar guides to bees and plants. Functional Ecology, 25, McCrea, K.D. and Levy, M. (1983) Photographic visualization of floral colors as perceived by honeybee pollinators. American Journal of Botany, Menzel, R. and Shmida, A. (1993) The ecology of flower colours and the natural colour vision of insect pollinators: the Israeli flora as a study case. Biological Reviews, 68, Nakayama, T. (2002) Enzymology of aurone biosynthesis. Journal of Bioscience and Bioengineering, 94,
278 Nakayama, T., Sato, M., Fukui, Y., Yonekura-Sakakibara, K., Hayashi, H., Tanaka, Y., Kusumi, T. and Nishino, T. (2001) Specificity analysis and mechanism of aurone synthesis catalyzed by aureusidin synthase, a polyphenol oxidase homolog responsible for flower coloration. FEBS letters, 499, Nakayama, T., Yonekura Sakakibara, K., Sato, T., Kikuchi, S., Fukui, Y., Fukuchi-Mizutani, M., Ueda, T., Nakao, M., Tanaka, Y. and Kusumi, T. (2000) Aureusidin synthase: a polyphenol oxidase homolog responsible for flower coloration. Science, 290, Ono, E., Fukuchi-Mizutani, M., Nakamura, N., Fukui, Y., Yonekura-Sakakibara, K., Yamaguchi, M., Nakayama, T., Tanaka, T., Kusumi, T. and Tanaka, Y. (2006a) Yellow flowers generated by expression of the aurone biosynthetic pathway. Proceedings of the National Academy of Sciences, 103, Ono, E., Hatayama, M., Isono, Y., Sato, T., Watanabe, R., Yonekura Sakakibara, K., Fukuchi Mizutani, M., Tanaka, Y., Kusumi, T. and Nishino, T. (2006b) Localization of a flavonoid biosynthetic polyphenol oxidase in vacuoles. The Plant Journal, 45, Rieseberg, L.H. and Schilling, E.E. (1985) Floral flavonoids and ultraviolet patterns in Viguiera (Compositae). American Journal of Botany, 72, Sanchez-Gonzalez, M. and Rosazza, J.P.N. (2006) Biocatalytic synthesis of butein and sulfuretin by Aspergillus alliaceus. Journal of agricultural and food chemistry, 54, Sandermann, H. and Strominger, J.L. (1972) Purification and properties of C55-isoprenoid alcohol phosphokinase from Staphylococcus aureus. Journal of Biological Chemistry, 247, Sato, T., Nakayama, T., Kikuchi, S., Fukui, Y., Yonekura-Sakakibara, K., Ueda, T., Nishino, T., Tanaka, Y. and Kusumi, T. (2001) Enzymatic formation of aurones in the extracts of yellow snapdragon flowers. Plant Science, 160, Schlangen, K., Miosic, S., Castro, A., Freudmann, K., Luczkiewicz, M., Vitzthum, F., Schwab, W., Gamsjäger, S., Musso, M. and Halbwirth, H. (2009) Formation of UV-honey guides in Rudbeckia hirta. Phytochemistry, 70, Schlangen, K., Miosic, S., Thill, J. and Halbwirth, H. (2010) Cloning, functional expression, and characterization of a chalcone 3-hydroxylase from Cosmos sulphureus. Journal of Experimental Botany, 61, Scogin, R. and Zakar, K. (1976) Anthochlor pigments and floral UV patterns in the genus Bidens. Biochemical Systematics and Ecology, 4, Shang, Y., Venail, J., Mackay, S., Bailey, P.C., Schwinn, K.E., Jameson, P.E., Martin, C.R. and Davies, K.M. (2010) The molecular basis for venation patterning of pigmentation and its effect on pollinator attraction in flowers of Antirrhinum. New Phytologist. Shimada, N., Aoki, T., Sato, S., Nakamura, Y., Tabata, S. and Ayabe, S. (2003) A cluster of genes encodes the two types of chalcone isomerase involved in the biosynthesis of general flavonoids and legume-specific 5-deoxy (iso) flavonoids in Lotus japonicus. Plant Physiology, 131, Strack, D. and Schliemann, W. (2001) Bifunctional polyphenol oxidases: Novel functions in plant pigment biosynthesis. Angewandte Chemie International Edition, 40, Thompson, W.R., Meinwald, J., Aneshansley, D., Eisner, T. (1972) Flavonols: responsible for ultraviolet absorption in nectar guide of flower. Science, 177, Vande Casteele, K., Geiger, H. and Van Sumere, C.F. (1982) Separation of flavonoids by reversed-phase high-performance liquid chromatography. Journal of Chromatography A, 240, Welle, R. and Grisebach, H. (1988) Isolation of a novel NADPH-dependent reductase which coacts with chalcone synthase in the biosynthesis of 6'-deoxychalcone. FEBS Letters, 236,
279 Table 1: Dependence of the 4-deoxyaurone formation on ph. Relative activities were calculated in comparison to the activity at the optimal ph which was defined as being 100%. Substrate preference cannot be concluded from comparison of the activities. Substrate ph optimum activity at optimal relative activity relative activity ph (mol/s.g) at ph 7.0 [%] at ph 5.5 [%] butein ± okanin ± robtein ± butein 4-O-glucoside ±
280 Figure legends Figure 1: The basic chalcone-, aurone- and flavonoid structure. Please note the divergent ring numbering. Figure 2: LDI-MS of a Bidens ferulifolia petal. a: a representative spectrum of the petal base containing nine m/z signals of anthochlors. b: no anthochlors were detected in representative spectra of the petal apex. For the allocation of m/z signals to compounds refer to Figure 3. Figure 3: Anthochlors and flavonoids present or absent in Bidens ferulifolia petals Figure 4: UV nectar guides. Bidens ferulifolia flower UV photography of front (a) and back (e) side, daylight photographies (b, f) and after (c, g) ammonia staining. Cross sections of Bidens ferulifolia petals base native (i) and stained (j) and petal apex native (k) and stained (l). Epi-illumination mode microscopic view of stained epidermis of petal front side base (d) and apex (h). Coreopsis grandiflora flower before (m) and after (n) ammonia staining. Cosmos sulphureus flower before (o) and after (p) ammonia staining. Figure 5: Spatial distribution of okanin (m/z 287) along a Bidens petal fixed by adhesive tape on a Indium Tin Oxide glass slide, first row: front side, second row: back side; from left to right: daylight photos, UV photos, negative ion mode LDI-MSI images (green area indicates the presence of the target compound), negative ion mode LDI-MSI images overlapping the daylight photos. All mass peaks related to anthochlor pigments showed a similar distribution. Figure 6: HPLC chromatograms from incubation of enzyme preparations from B. ferulifolia petals (a) and leaves (b), Antirrhinum majus petals (c) and leaves (d), Arabidopsis thaliana col-0 plants (e), Tagetes erecta petals (f), Dianthus caryophyllus petals (g), and Petunia hybrida petals (h) with butein and of enzyme preparations from B. ferulifolia petals (I) and Antirrhinum majus petals (j) with isoliquiritigenin. Figure 7: Overview on flavonoid and anthochlor formation from p-coumaroyl-coa. abbrev.: ANS: 22
281 anthocyanidin synthase, AUS: aurone synthase, CH3H: chalcone 3-hydroxylase, CHI: chalcone isomerase, CHR: Chalcone reductase, CHS: chalcone synthase, DFR: dihydroflavonol 4- reductase, FHT: flavanone 3-hydroxylase, F3 H: flavonoid 3 -hydroxylase, FNSII: flavone synthase II 23
282 Figure 1: The basic chalcone-, aurone- and flavonoid structure. Please note the divergent ring numbering. 4' 5' 3' A 6' 2 1 2' 1' O Chalcone 3 B A 4 1 O CH 2 3 O Aurone 2' 3' 1' B 4' 6' 5' A 1 O 5 4 Flavan 2' 2 1' 3 3' B 6' 4' 5' 24

283 Figure 2: LDI-MS image of a Bidens ferulifolia petal. above: no anthochlors were detected in representative spectra of the petal apex. below: a representative spectrum of the petal base containing nine m/z signals of anthochlors. For the allocation of m/z signals to compounds refer to Figure 3. a b 25
284 Figure 3: Anthochlor pigments and flavonoids in Bidens ferulifolia petals R 4 R 3 OH R 1 OH R 2 R 4 R 3 O CH R 1 OH R 2 R 4 R 3 O R 1 OH R 2 O Chalcone (A) O Aurone (B) OH O Flavanone (C)/Flavone (D) Compounds present in B. ferulifolia petals Type R 1 R 2 R 3 R 4 FW (g/mol) [M-H] - : m/z R t detected by Isoliquiritigenin C 15 H 12 O 4 A H H H OH LDI-MSI Sulfuretin C 15 H 10 O 5 B OH H H OH LC-MS Butein C 15 H 12 O 5 A H OH H OH LC-MS Maritimetin C 15 H 10 O 6 B OH H OH OH LC-MS Luteolin C 15 H 10 O 6 D OH H H OH LC-MS Okanin C 15 H 12 O 6 A OH H OH OH LC-MS Sulfuretin 6-O--D-glucoside B OH H H OGlu LDI-MSI C 21 H 20 O 11 Butein 4 -O--D-glucoside A OH H H OGlu LDI-MSI C 21 H 22 O 10 Maritimetin 6-O--D-glucoside B OH H OH OGlu LC-MS (Maritimein) C 21 H 20 O 11 Luteolin 7-O--D-glucoside D OH H H OGlu LDI-MSI C 21 H 20 O 11 Okanin 4 - O--D-glucoside A OH H OH OGlu LC-MS (Marein) C 21 H 22 O 11 Mass isomers not present 2 Apigenin C 15 H 10 O 5 D H H H OH Naringenin C 15 H 12 O 5 C H H H OH ,4,5,6-Tetrahydroxyaurone B OH OGlu H OH C 15 H 10 O 6 Robtein C 15 H 12 O 6 A OH OH H OH Eriodictyol C 15 H 12 O 6 C OH H H OH Isoliquiritigenin 4 -O--Dglucoside A H H H OGlu C 21 H 22 O 9 Apigenin 7- O--D-glucoside D H H H OGlu C 21 H 20 O 10 Naringenin 7-O--D-glucoside C H H H OGlu C 21 H 22 O 10 3,4,5,6-Trihydroxyaurone B OH OGlu H OH O--D-glucoside C 21 H 20 O 11 Robtein 4 -O--D-glucoside A OH OH OH OGlu C 21 H 22 O 11 Eriodictyol 7-O--D-glucoside C OH H H OGlu C 21 H 22 O 11 1 exact mass obtained by LC-MS, 2 presence excluded by LC-MS 26


 side,")

 ammonia")

 and")

.")


 and apex")

")

285 Figure 4: UV nectar guides. Bidens ferulifolia flower UV photography of front (a) and back (e) side, daylight photographies (b, f) and after (c, g) ammonia staining. Cross sections of Bidens ferulifolia petals base native (i) and stained (j) and petal apex native (k) and stained (l). Epi-illumination mode microscopic view of stained epidermis of petal front side base (d) and apex (h). Coreopsis grandiflora flower before (m) and after (n) ammonia staining. Cosmos sulphureus flower before (o) and after (p) ammonia staining. a b d c e f g h i j k l m o p n 27
, negative ion mode LDI-MSI images overlapping the daylight photos.")
286 Figure 5: Spatial distribution of okanin (m/z 287) along a Bidens petal fixed by adhesive tape on a Indium Tin Oxide glass slide, first row: front side, second row: back side; from left to right: daylight photos, UV photos, negative ion mode LDI-MSI images (green area indicates the presence of the target compound), negative ion mode LDI-MSI images overlapping the daylight photos. All mass peaks related to anthochlors showed a similar distribution. 28
287 Figure 6: HPLC chromatograms from incubation of enzyme preparations from B. ferulifolia petals (a) and leaves (b), Antirrhinum majus petals (c) and leaves (d), Arabidopsis thaliana col-0 plants (e), Tagetes erecta petals (f), Dianthus caryophyllus petals (g), and Petunia hybrida petals (h) with butein and of enzyme preparations from B. ferulifolia petals (i) and Antirrhinum majus petals (j) with isoliquiritigenin. 100,00 a 150,00 b 50,00 sulfuretin butein 100,00 50,00 sulfuretin butein 0,00 0, c 150,00 d 100,00 sulfuretin 100,00 sulfuretin 50,00 butein 50,00 butein 0,00 0, ,00 e butein 100,00 f 50,00 sulfuretin 50,00 sulfuretin butein 0,00 0, ,00 g 250,00 h 100,00 50,00 sulfuretin butein 200,00 150,00 100,00 50,00 sulfuretin butein 0, , ,00 100,00 i isoliquiritigenin 100,00 50,00 j isoliquiritigenin butein 50,00 sulfuretin 0,00 0,
288 Figure 7: Overview on flavonoid and aurone formation from p-coumaroyl-coa. abbrev.: ANS: anthocyanidin synthase, AUS: aurone synthase, CH3H: chalcone 3-hydroxylase, CHI: chalcone isomerase, CHR: Chalcone reductase, CHS: chalcone synthase, DFR: dihydroflavonol 4- reductase, FHT: flavanone 3-hydroxylase, F3 H: flavonoid 3 -hydroxylase, FNSII: flavone synthase II O O 3 OH CoAS Malonyl-CoA CHS + OH CHR CoAS O CHS p-coumaroyl-coa OH OH HO OH?? HO O Isoliquiritigenin (6 -Deoxychalcone) HO OH OH OH CH3H OH HO O Butein (6 -Deoxychalcone) CHI HO OH OH O OH HO AUS OH FNSII Deoxy type O O CH Sulfuretin (4-Deoxyaurone) OH Hydroxy type HO O OH OH OH O Eriodictyol chalcone (6 -Hydroxychalcone) HO AUS O CH OH AUS OH OH O Naringenin chalcone (6 -Hydroxychalcone) HO AUS O CH OH OH OH O Naringenin (Flavanone) FHT DFR HO OH O Apigenin (Flavone) F3 H O OH OH OH O Bracteatin (4-Hydroxyaurone) OH OH O Aureusidin (4-Hydroxyaurone) ANS OH OH O Luteolin (Flavone) HO OH O + OH Pelargonidin (Anthocyanidin) 30
289 Publication P12: Spatially-resolved qualitative and quantitative analysis of Gossypium hirsutum L. leaf pigments at single cell level D. Hölscher, K. Knop, M. Kai, R. Maddula, C. Ritter, A. C. Crecelius, D. Heckel, B. Schneider, U. S. Schubert, T. Alexandrov, B. Zimmermann, A. Svatoš Plant J. 2012, submitted.
290
291 Spatially-resolved qualitative and quantitative analysis of Gossypium hirsutum L. leaf pigments at single cell level. ABSTRACT Gossypium hirsutum G. hirsutum
292 Keywords: Gossypium hirsutum L., LDI mass spectrometric imaging, laser microdissection, UPLC/MS, HPLC/MS, capillary electrophoresis, edge-preserving image denoising and clustering, segmentation map, gossypol, hemigossypolone, heliocides H 1, H 2, H 3, H 4 and B 1, Abbreviation INTRODUCTION et al. et al. A. thaliana Hypericum et al. et al. et al. Dilatris pillansii
293 et al. Gossypium hirsutum G. hirsutum Gossypium et al.et al. et al. et al.et al. et al. et al.et al.et al. S G. hirsutumr et al.et al. R et al.r et al. et al. et al. et al. et al. Gossypium barbadense R et al. Gossypiumet al.
294 G. hirsutum G. hirsutum G. hirsutum et al. RESULTS Qualitative analysis of gossypol and related secondary plant metabolite compounds using LDI-MSI and edge-preserving image denoising Arabidopsis thaliana Hypericum perforatum et al. Gossypiumm/z Gossypium et al.et al.et al.m/z m/z m/zm/z m/z et al. G. hirsutum
295 Quantitative analysis of gossypol by LMD, UPLC-MS, HPLC-MS, and CE Dilatris pillansii G. hirsutum et al. G. hirsutum et al.
296 et al.et al. m/z Gossypium. hirsutum DISCUSSION in situ Citrus aurantium et al. et al. et al. et al.
297 et al. et al. et al.et al MATERIALS and METHODS / EXPERIMENTAL PROCEDURES Plant material G. hirsutum
298 Laser microdissection of pigment glands G. hirsutum Fixation of plant material for Ultraflex III mass spectrometer G. hirsutum LDI-MSI on the Ultraflex III mass spectrometer m/z
299 UPLC-MS HPLC-MS and CE m/z
300 Spatial segmentation with edge-preserving image denoising et al. : et al. m/z m/z m/zm/z m/z et al. m/z
301 m/z m/z Search for masses and their visualization m/z m/z m/z m/z ACKNOWLEDGEMENTS Gossypium
302 Tables and figures captions Table 1. CHO O CHO O HO HO HO HO CHO O O (1) O (4) HO CHO O CHO O HO HO HO O (5) HO H 3 CO O (2) O (6) CHO O CHO OH OR 1 HO HO OH HO R 2 O O (3) Figure 1. OH CHO R 1, R 2 = H (7) R 1 = H, R 2 = OCH 3 (8) R 1, R 2 = OCH 3 (9)

303 Figure 2. G. hirsutum
304 Figure 3. G. hirsutum m/z a m/z b m/z c m/z d m/z m/zfm/z
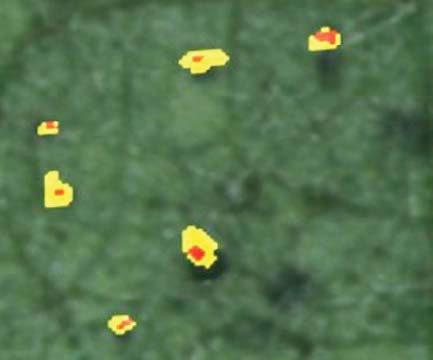
305 Figure 4.
306 Figure 5. G. hirsutum
307 REFERENCES Alexander, J., Benford, D., Cockburn, A., Cravedi, J.-P., Dogliotti, E., Di Domenico, A., Férnandez-Cruz, M.L., Fürst, P., Fink-Gremmels, J., Galli, C.L., Grandjean, P., Gzyl, J., Heinemeyer, G., Johansson, N., Mutti, A., Schlatter, J., van Leeuwen, R., Van Peteghem, C. and Verger, P. The EFSA Journal908 Adams, R., Geissman, T.A. and Edwards, J.D. Chem. Rev.60 Alexandrov, T., Becker, M., Deininger, S.O., Ernst, G., Wehder, L., Grasmair, M., von Eggeling, F., Thiele, H. and Maass, P. J. Proteome Res.9 Bauer, J.A., Trask, D.K. and Kumar, B. Mol. Cancer Ther. 4 Bell, A.A. Phytopathology59 Bell, A.A., Stipanovic, R.D., O Brien, D.H. and Fryxell P.A. Phytochemistry17 Bell, A.A. and Stipanovic, R.D. Mycopathologia65 Boatner, C.H. and Hall, C.M. J Am Oil Chem Soc23 Boatner, C.H., Hall, C.M., O Connor, R.T. and Castillon, L.E. Bot Gaz109 Cai, Y., Zhang, H., Zeng, Y., Mo, J., Bao, J., Miao, C., Bai, J., Yan, F. and Chen, F. J. Biosci.29
308 Cass, Q.B., Oliveira, R.V. and de Pietro, A.C. J. Agric. Food Chem.52 Denis, L., Lorenz, D.A. and Trede, D. Inverse Probl25[artnum ]. Elliger, C.A., Chan, B.G. and Waiss, A.C. J. Econ. Entomol.71 Essenberg, M., Grover, P.B. and Cover, E.C. GossypiumPhytochemistry 29 European Commission Freedman, T.B., Cao, X., Oliveira, R.V., Cass, Q.B. and Nafie, L.A. Chirality15 Fryxell, P.A.Gossypium Rheedea 2 Heinemann, M. and Zenobi, R.Curr. Opin. Biotechnol. 22 Hölscher, D. and Schneider, B. Planta225 Hölscher, D., Shroff, R., Knop, K., Gottschaldt, M., Crecelius, A., Schneider, B., Heckel, D.G., Schubert, U.S. and Svatoš, A. Arabidopsis thalianahypericumplant J.60 Jaroszewski, J.W., Strøm-Hansen, T., Hansen, L.L. Chirality4 Kaspar, S., Peukert, M., Svatoš, A., Matros, A. and Mock, H.-P. Proteomics11
309 Kenar, J.A.J Am Oil Chem Soc 83 Li, S.H., Schneider, B. and Gershenzon, J. Planta225 Marchlewski, L.Adv. Synth. Catal. 60 McCormick, J.P.ACS Symposium Series189 Opitz. S., Kunert, G. and Gershenzon, J. GossypiumhirsutumJ. Chem. Ecol.34 Qian, S.Z. and Wang, Z.G.Annu. Rev. Pharmacol. Toxicol.24 Ritter, C., Zimmermann, B.F. and Galensa R. Anal Bioanal Chem 397 Schwartze, E.M. and Alsberg, C.L. J Agric Res 25 Shresta, B., Patt, J.M. and Vertes, A. Anal. Chem.83 Stanford, E.E. and Viehoever, A. J Agric Res13 Stansbury, M.F., Cucullu, A.F. and den Hartog, G.T. J. Agric. Food Chem2 Stipanovic, R.D. Bell, A.A. and Lukefahr, M.J. GossypiumAmerican Chemical Society Stipanovic, R.D., Altman, D.W., Begin, D.L., Greenblatt, G.A., Benedict, J.H. J. Agric. Food Chem.36
310 Stipanovic, R.D., Puckhaber, L.S., Reibenspies, J.H. and Williams, H.J. Phytochemistry67 Stipanovic, R.D., López, J.D., Dowd, M.K., Puckhaber, L.S. and Duke, S.E. Heliothis virescens Environmental. Entomol.37 Stipanovic, R.D., Puckhaber, L.S., Liu, J. and Bell, A.A. GossypiumbarbadenseJ. Agric. Food Chem.57 Sunilkumar, G., Campbell, L.M., Puckhaber, L., Stipanovic, R.D. and Rathore, K.S. Proc. Natl. Acad. Sci. U.S.A.103 Svatoš, A.Trends Biotechnol.28 Svatoš, A. Anal. Chem.83 Thunig, J., Hansen, S.H. and Janfelt, C. Anal. Chem.83 Waites, G.M.H., Wang, C. and Griffin, P.D. Int. J. Androl.21 Withers, W.A. and Carruth, F.E. J Agric Res5


311 Suppl. Figure 1.m/z Suppl. Figure 2. G. hirsutum
312

313 Publication P13: Phenalenone-type phytoalexins mediate resistance of banana plants (Musa spp.) to the burrowing nematode Radopholus similis D. Hölscher, S. Dhakshinamoorthy, T. Alexandrov, M. Becker, T. Bretschneider, A. Bürkert, A. C. Crecelius, D. De Waele, D. G. Heckel, H. Heklau, C. Hertweck, M. Kai, K. Knop, C. Krafft, R. K. Madulla, C. Matthäus, J. Popp, B. Schneider, U. S. Schubert, R. Sikora, A. Svatoš, R. Swennen Nature Chem. Biol. 2013, in preparation.
314
315 Journal: Nature Chemical Biology Musa Radopholus similis 1
316 2 Radopholus similis R. similis Musa Musa Musa Radopholus 2
317 similis R. similis Piper nigrumcitrus Coffea Musa R. similis R. similis R. similis Musa 3
318 4 Mycosphaerella fijiensis Colletotrichum musae Fusarium oxysporumcubense R. similis R. similisr. similis Musa Radopholus similis 4
319 R. similis n R similis R. similis Musa 1H,3H de 1H,3H de SR Arabidopsis thaliana Hypericum 5
320 6 m/z m/z m/z m/zm/z O m/z m/z R. similis in vitror. similis 6
321 R. similis R. similis versus P R. similis 7
322 8 R. similism/z R. similis R. similis 8
323 R. similis R. similis Musa R. similis Musa Musa Arabidopsis thaliana Hypericum MusaR. similis Musa In vitro R. similis R. similisin situ 9
324 10 R. similis in vitro R. similis R. similis R. similismusa R. similis R. similis R. similis Caenorhabditis elegans 10
325 R. similis R. similis R. similis C. elegans C. elegans R. similis C. elegans C. elegans R. similis MusaR. similis C. elegans R. similis 11
326 12 Musa acuminata R. similismusamusaacuminata R. similismusa Musa acuminata Radopholus similisradopholus similis 12
327 in vitro R. similis n d 6 13
328 14 Musa m/z m/z m/z R. similis m/z 14
329 R. similis in vitro R. similis R. similis Musa Anigozanthos R. similis 15
330 16 P R. similis P vs via 16
331 Food and Agriculture Organization of United Nations. Screening of germplasm for resistance and tolerance to nematodes Diseases of, and Plant Parasitic Nematodes in Subtropical and Tropical Agriculture Radopholus similis sensu lato Annu. Rev. Phytopathol. Plant Parasitic Nematodes in Subtropical and Tropical Agriculture Nature The burrowing nematode of bananas, Cobb. Radopholus similis Eppo Bulletin Radopholus similis Agric., Ecosyst. Environ., Appl. Soil Ecol. 17
332 18 Annu. Rev. Phytopathol. MusaEuphytica et al N Occup. Environ. Med. PloS Pathog. Annu. Rev. Entomol. Radopholus similisnematology Musa Fundam. Appl. Nematol. Radopholus similis Phytopathology Physiol. Mol. Plant Pathol. et al Radopholus similis MusaPlant Pathol. et al Musa paradisiacaj. Org. Chem. Musa acuminataphytochemistry 18
333 Musa Radopholus similisj. Agric. Food Chem. Prog. Chem. Org. Nat. Prod. Musa acuminata Radopholus similisnematology Environ. Sci. Technol. et al Biosci. Biotechnol. Biochem. et almusa Molecules et al Photochem. Photobiol. Sci. Musella lasiocarpaj. Chin. Chem. Soc. et al Musa acuminata Mycosphaerella fijiensisj. Nat. Prod. Musa acuminata Sporobolomyces salmonicolorphytochem. Lett Musa acuminata Tetrahedron Biosci. Biotechnol. Biochem. 19
334 20 et al Musa acuminataphytochemistry Musa acuminataphytochemistry Anigozanthos rufusaust. J. Chem. Musa Nat. Prod. Lett. Anigozanthos flavidusphytochemistry et al Arabidopsis thalianahypericumplant J. et al J. Proteome Res. et al Caenorhabditis elegans J. Lipid Res. et al Caenorhabditis elegansj. Mol. Biol. Caenorhabditis elegans J. Exp. Zool. Part A Comp. Exp. Biol. et al C. elegans Biogerontology et al Caenorhabditis elegans Nature 20
335 CaenorhabditisFront. Physiol. J. Nematol. On the Origin of Species by Means of Natural Selection Guide to the medicinal and poisonous plants of Queensland et al Photochem. Photobiol. Curr. Opin. Biotechnol Nature Annu. Rev. Phytopathol et almusa acuminata Nature Musa Plant Cell Rep. et al Radopholus similis in vitro Musa Arabidopsis thaliana J. Nematol. Global evaluation of Musa germplasm for resistance to Fusarium wilt, Mycosphaerella leaf spot diseases and nematodes 21
336 22 Planta J. Nematol. et al Theor. Chem. Acc. Musa 22
337 23
338 24 Radopholus similis Musa 2S,3R HH de HH de HH de HH de 24
339 Radopholus similis HH de 25
 b (1)")
 d (1)")
340 26 (1) a (1) b (1) c 2cm 1cm (1) d (1) e Musa Radopholus similis 26
341 OR R OH R O O OH R O R 1 R=H; R =H; R =H 2 R=OH; R =H; R =H 10 R=H; R =CH 3 ; R =H 11 R=H; R =CH 3 ; R =OH 3 R=(S)OH 12 R=(R)OH 4 R=H 5 R=OH 6 R=OCH 3 R O O O R HO O O H H O O OH R O 7 R=H 8 R=OH 9 R=H; R =H 13 R=OH; R =H 14 R=OH;R =OH 15 R. similis SR HHde HH de 27


342 28 a, b optical image c m/z 271 d m/z 273 e m/z 287 f m/z 289 g m/z 301 m/z 28

343 m/z R. similis versus 29


344 30 40 μm 20 μm 25 μm 25 μm R. similis R. similis R. similis R. similis R.similis 30

345 m/z R. similis m/z R. similis m/z 31
Technical Challenges in the Analysis of PEGylated Proteins by Capillary Electrophoresis
 Technical Challenges in the Analysis of PEGylated Proteins by Capillary Electrophoresis Ying-Chen Chen Biologics Process & Product Development Hopewell, NJ Outline PEGylation background information CE-SDS
CDER Risk Assessment to Evaluate Potential Risks from the Use of Nanomaterials in Drug Products
 CDER Risk Assessment to Evaluate Potential Risks from the Use of Nanomaterials in Drug Products Celia N. Cruz, Ph.D. CDER Nanotechnology Working Group Office of Pharmaceutical Science 1 Disclaimer The
SECTION 9: Kinetics. Chapter 12 in Chang Text
 SECTION 9: Kinetics Chapter 12 in Chang Text Outline for Section 9 Part I 9.1. Kinetics in Pharmaceutical Science 9.2. Rates of Reactions 9.3. Reaction Order: Zero-Order, 1 st Order 9.1. Chemical Kinetics
Nanoparticles for Drug Delivery
 Introduction Systemic Drug Delivery Examples : Methods of Drug Delivery Advantages of ral Delivery Inhalation Transdermal Implantation Injection University of Illinois, Urbana-Champagne Examples of Examples
Introduction to E&Ls 1
 Introduction to E&Ls 1 Overview What industries need to determine E&Ls Define extractables and leachables Basic overview of an E&L study Regulatory landscape 2 A leader in plastics analysis Jordi Labs
Delivery. Delivery Processes. Delivery Processes: Distribution. Ultimate Toxicant
 Delivery Ultimate Toxicant The chemical species that reacts with the endogenous target. Toxicity depends on the concentration (dose) of the ultimate toxicant at the target site Delivery Processes Absorption
Material Chemistry KJM 3100/4100. Synthetic Polymers (e.g., Polystyrene, Poly(vinyl chloride), Poly(ethylene oxide))
, Poly(ethylene oxide))") Material Chemistry KJM 3100/4100 Lecture 1. Soft Materials: Synthetic Polymers (e.g., Polystyrene, Poly(vinyl chloride), Poly(ethylene oxide)) Biopolymers (e.g., Cellulose derivatives, Polysaccharides,
Material Chemistry KJM 3100/4100 Lecture 1. Soft Materials: Synthetic Polymers (e.g., Polystyrene, Poly(vinyl chloride), Poly(ethylene oxide)) Biopolymers (e.g., Cellulose derivatives, Polysaccharides,
Saba Al Fayoumi. Tamer Barakat. Dr. Mamoun Ahram + Dr. Diala Abu-Hassan
 1 Saba Al Fayoumi Tamer Barakat Dr. Mamoun Ahram + Dr. Diala Abu-Hassan What is BIOCHEMISTRY??? Biochemistry = understanding life Chemical reactions are what makes an organism (An organism is simply atoms
NANO 243/CENG 207 Course Use Only
 L12: Drug Loading & Quantification May 15, 2018 1. Drug loading techniques 1.1 Physical approaches Nanprecipitation Single emulsion Double emulsion Encapsulation Remote loading 1.2 Chemical approaches
Interaction of Gold Nanoparticle with Proteins
 Chapter 7 Interaction of Gold Nanoparticle with Proteins 7.1. Introduction The interfacing of nanoparticle with biomolecules such as protein is useful for applications ranging from nano-biotechnology (molecular
The hazards of chemicals vary widely and appropriate caution must always be used. Every chemical can be hazardous in certain circumstances.
 1 The hazards of chemicals vary widely and appropriate caution must always be used. Every chemical can be hazardous in certain circumstances. An understanding of the hazards of chemicals and how they enter
PREREQUISITE CHECKLIST
 PREREQUISITE CHECKLIST UNIVERSITY OF CALIFORNIA, BERKELEY SCHOOL OF OPTOMETRY ADMISSIONS AND STUDENT AFFAIRS OFFICE Name: Date: Email: Status (complete, in progress, or planned) Prerequisite Course Requirements
Advanced TRS - ZEOLITE IN A COLLOIDAL SUSPENSION
 Advanced TRS - ZEOLITE IN A COLLOIDAL SUSPENSION The need for this product is summarized in the following graphic Since this data was collected the numbers of deaths have gone up yearly. 25 MARCH 2014
Regulation and signaling. Overview. Control of gene expression. Cells need to regulate the amounts of different proteins they express, depending on
 Regulation and signaling Overview Cells need to regulate the amounts of different proteins they express, depending on cell development (skin vs liver cell) cell stage environmental conditions (food, temperature,
Characterization Methods of Manufactured Nanomaterials for EHS Studies
 Characterization Methods of Manufactured Nanomaterials for EHS Studies Steven W Brown, MS, CIH International Standards Organization Technical Committee #229 on Nanotechnologies Convener Work Group #3 Environmental
Chapter 2 1. Using an annotated diagram, describe the structure of a plant cell. (12 marks)
") Essays Chapter 2 1. Using an annotated diagram, describe the structure of a plant cell. 2. Compare and contrast the structure of prokaryotic cells and eukaryotic cells. 3. Describe the correct procedures
Essays Chapter 2 1. Using an annotated diagram, describe the structure of a plant cell. 2. Compare and contrast the structure of prokaryotic cells and eukaryotic cells. 3. Describe the correct procedures
Risk assessment of nanomaterials further considerations
 Risk assessment of nanomaterials further considerations The risks of nanomaterials and how to assess them has been given a lot of attention over the past years. Efforts by scientists, regulators and industry
PHARMACOKINETIC DERIVATION OF RATES AND ORDERS OF REACTIONS IN MULTI- COMPARTMENT MODEL USING MATLAB
 IJPSR (2016), Vol. 7, Issue 11 (Research Article) Received on 29 May, 2016; received in revised form, 07 July, 2016; accepted, 27 July, 2016; published 01 November, 2016 PHARMACOKINETIC DERIVATION OF RATES
The general concept of pharmacokinetics
 The general concept of pharmacokinetics Hartmut Derendorf, PhD University of Florida Pharmacokinetics the time course of drug and metabolite concentrations in the body Pharmacokinetics helps to optimize
Site-Specific Prodrug Release Using Visible Light
 Site-Specific Prodrug Release Using Visible Light Michael Y. Jiang and David Dolphin* J. Am. Chem. Soc., 2008, 130, 4236-4237 Li Zhang Current literature presentation 04-26-2008 Li Zhang @ Wipf Group Page
Supplementary Figure 1. Fullerence has poor solubility in water while the C60S and LC60S nanoparticles can be stably dispersed in water.
 Supplementary Figure 1. Fullerence has poor solubility in water while the C60S and LC60S nanoparticles can be stably dispersed in water. (a) A typical photograph of fullerence (C60), C60S nanoparticles,
Medicinal Application of Dendrimers. Literature Seminar Shogo HASHIZUME (M2) (Tue.)
 (Tue.)") Medicinal Application of Dendrimers Literature Seminar Shogo HASHIZUME (M2) 11. 12. 6. (Tue.) 1 Prologue - What is the Dendrimer?? Dendrimer = a family of nanosized, 3D polymer a class of macromolecules
Medicinal Application of Dendrimers Literature Seminar Shogo HASHIZUME (M2) 11. 12. 6. (Tue.) 1 Prologue - What is the Dendrimer?? Dendrimer = a family of nanosized, 3D polymer a class of macromolecules
Drug Delivery with Alginate Dr. J. Vernengo and Dr. S. Farrell
 Objectives Drug Delivery with Alginate Dr. J. Vernengo and Dr. S. Farrell Define a hydrogel. Define the chemical structure and ionic crosslinking of alginate to form hydrogels. Discuss the role of hydrogels
Supramolecular DNA nanotechnology. Faisal A. Aldaye
 Supramolecular DA nanotechnology Faisal A. Aldaye Department of Chemistry, McGill University Current address: Department of Systems Biology, Harvard University 200 Longwood Avenue, Boston, MA 02115, USA
The Logic of Biological Phenomena
 The Logic of Biological Phenomena molecules are lifeless yet, in appropriate complexity and number, molecules compose living things What makes living things distinct? they can grow they can move they can
 There are two types of polysaccharides in cell: glycogen and starch Starch and glycogen are polysaccharides that function to store energy Glycogen Glucose obtained from primary sources either remains soluble
Introduction to Polymerization Processes
 Introduction to Polymerization Processes Reference: Aspen Polymers: Unit Operations and Reaction Models, Aspen Technology, Inc., 2013. 1- Polymer Definition A polymer is a macromolecule made up of many
Biomaterial Scaffolds
 Biomaterial Scaffolds Biomaterial Properties Surface properties Bulk properties Biological properties Types of Biomaterials Biological materials Synthetic materials Surface Properties The body reads the
Chemical Engineering Seminar Series
 Effect of Reaction Conditions on Copolymer Properties Loretta Idowu Keywords: copolymer composition distribution; radical polymerization kinetics; semi-batch starved feed; hydroxyl-functionality Non-functional
Recognition and Absorption of the Water-soluble X-ray Contrast Medium Iodixanol using Molecularly Imprinted Polymers for Biomedical Applications
 Recognition and Absorption of the Water-soluble X-ray Contrast Medium Iodixanol using Molecularly Imprinted Polymers for Biomedical Applications Zhan Liu 1, David G. Buckanll 1, and Mark G. Allen 2 1 School
CHEMISTRY (CHEM) CHEM 5800 Principles Of Materials Chemistry. Tutorial in selected topics in materials chemistry. S/U grading only.
 CHEM 5800 Principles Of Materials Chemistry. Tutorial in selected topics in materials chemistry. S/U grading only.") Chemistry (CHEM) 1 CHEMISTRY (CHEM) CHEM 5100 Principles of Organic and Inorganic Chemistry Study of coordination compounds with a focus on ligand bonding, electron counting, molecular orbital theory,
Chemistry (CHEM) 1 CHEMISTRY (CHEM) CHEM 5100 Principles of Organic and Inorganic Chemistry Study of coordination compounds with a focus on ligand bonding, electron counting, molecular orbital theory,
Introduction to Pharmaceutical Chemical Analysis
 Introduction to Pharmaceutical Chemical Analysis Hansen, Steen ISBN-13: 9780470661222 Table of Contents Preface xv 1 Introduction to Pharmaceutical Analysis 1 1.1 Applications and Definitions 1 1.2 The
Chapter 002 The Chemistry of Biology
 Chapter 002 The Chemistry of Biology Multiple Choice Questions 1. Anything that occupies space and has mass is called A. Atomic B. Living C. Matter D. Energy E. Space 2. The electrons of an atom are A.
Formulation and Ocular Bioavailability of Certain Drugs from Ophthalmic Preparations
 Formulation and Ocular Bioavailability of Certain Drugs from Ophthalmic Preparations Thesis presented by Ghada Saad Ahmed El-Moursy B. Pharm. Mansoura University (2007) Submitted in Partial Fulfillment
Graduate Course Offerings
 Graduate Course Offerings CHM 400. First Year Graduate Seminar Course (0) First year graduate student seminar course and introduction to research. Topics include: research opportunities in the department,
COMPUTER AIDED DRUG DESIGN (CADD) AND DEVELOPMENT METHODS
 AND DEVELOPMENT METHODS") COMPUTER AIDED DRUG DESIGN (CADD) AND DEVELOPMENT METHODS DRUG DEVELOPMENT Drug development is a challenging path Today, the causes of many diseases (rheumatoid arthritis, cancer, mental diseases, etc.)
COMPUTER AIDED DRUG DESIGN (CADD) AND DEVELOPMENT METHODS DRUG DEVELOPMENT Drug development is a challenging path Today, the causes of many diseases (rheumatoid arthritis, cancer, mental diseases, etc.)
Definition and regulation in terms of mechanism of action and intended use
 Definition and regulation in terms of mechanism of action and intended use 1 - Nanomaterial-containing medical devices 2 - (Ingestible) medical devices composed of substances IMDRF-3 / 20 March 2013 /
Biomedical Approach of Nanomaterials for Drug Delivery
 International Journal of Chemistry and Chemical Engineering. ISSN 2248-9924 Volume 3, Number 2 (2013), pp. 95-100 Research India Publications http://www.ripublication.com Biomedical Approach of Nanomaterials
Section II Assessing Polymers
 26 Clean Production Action GreenScreen v1.4 (January 2018) Section II Assessing Polymers 13. Purpose Section II outlines the procedure to be used to assess and classify hazards of polymers. Follow the
CH MEDICINAL CHEMISTRY
 CH 458 - MEDICINAL CHEMISTRY SPRING 2011 M: 5:15pm-8 pm Sci-1-089 Prerequisite: Organic Chemistry II (Chem 254 or Chem 252, or equivalent transfer course) Instructor: Dr. Bela Torok Room S-1-132, Science
CHEMISTRY (CHE) CHE 104 General Descriptive Chemistry II 3
 CHE 104 General Descriptive Chemistry II 3") Chemistry (CHE) 1 CHEMISTRY (CHE) CHE 101 Introductory Chemistry 3 Survey of fundamentals of measurement, molecular structure, reactivity, and organic chemistry; applications to textiles, environmental,
Chemistry (CHE) 1 CHEMISTRY (CHE) CHE 101 Introductory Chemistry 3 Survey of fundamentals of measurement, molecular structure, reactivity, and organic chemistry; applications to textiles, environmental,
Surface Modification of Biomaterials
 Lecture 9: Surface Modification of Biomaterials Supporting notes 3.051J/20.340J Materials for Biomedical Applications, Spring 2006 1 Purpose: Alter surface properties to enhance performance in biological
Introduction and. Properties of Enzymes
 Unit-III Enzymes Contents 1. Introduction and Properties of enzymes 2. Nomenclature and Classification 3. Mechanism of enzyme-catalyzed reactions 4. Kinetics of enzyme-catalyzed reactions 5. Inhibition
High Sensitivity Polyethylene Glycol (PEG) ELISA Kit
 ELISA Kit") High Sensitivity Polyethylene Glycol (PEG) ELISA Kit Cat. No.:DEIA6158 Pkg.Size:96T Intended use High Sensitivity Polyethylene Glycol (PEG) ELISA Kit is High Sensitivity ELISA for the Measurement of PEG
High Sensitivity Polyethylene Glycol (PEG) ELISA Kit Cat. No.:DEIA6158 Pkg.Size:96T Intended use High Sensitivity Polyethylene Glycol (PEG) ELISA Kit is High Sensitivity ELISA for the Measurement of PEG
Toxicological Targets. Russell L. Carr Department of Basic Sciences College of Veterinary Medicine
 Toxicological Targets Russell L. Carr Department of Basic Sciences College of Veterinary Medicine Toxicology Definitions = study of poisons Poison = any agent capable of producing a deleterious response
RECENT TRENDS IN PHARMACEUTICAL CHEMISTRY FOR DRUG DISCOVERY
 INTERNATIONAL JOURNAL OF RESEARCH IN PHARMACY AND CHEMISTRY Available online at www.ijrpc.com Review Article RECENT TRENDS IN PHARMACEUTICAL CHEMISTRY FOR DRUG DISCOVERY Sathyaraj A Department of Chemistry,
Polymer Chemistry - Ring-Opening-Polymerisation (ROP)
") Polymer Chemistry - Ring-Opening-Polymerisation (ROP) Aims of this part: General Mechanism Polyesters from Ring-Opening Polymerisation Formation of Nylon 6 (and similar) Polymerisation of N-Carboxy-Anhydrids
Polymer Chemistry - Ring-Opening-Polymerisation (ROP) Aims of this part: General Mechanism Polyesters from Ring-Opening Polymerisation Formation of Nylon 6 (and similar) Polymerisation of N-Carboxy-Anhydrids
Hydrogels and Their Biomedical Uses. M. R. Naimi-Jamal
 Hydrogels and Their Biomedical Uses M. R. Naimi-Jamal 2013 1 Overview Hydrogels Structure Swelling properties Biomedical Uses Common Hydrogels? Can you think of hydrogels in your everyday life? - Contact
e e = expected individuals with observed genotype Unit 1- Intro to AP and Taxonomy
 Unit 1- Intro to AP and Taxonomy 1. The Galapagos Islands were extremely important to Darwin and the Theory of Evolution. Darwin discovered many organisms and scientific ideas that were instrumental to
Lec.1 Chemistry Of Water
 Lec.1 Chemistry Of Water Biochemistry & Medicine Biochemistry can be defined as the science concerned with the chemical basis of life. Biochemistry can be described as the science concerned with the chemical
FACULTY OF PHARMACY. M. Pharmacy I Semester (Suppl.) Examination, November 2015 (Common To All) Subject: Pharmaceutical Analytical Techniques
 Examination, November 2015 (Common To All) Subject: Pharmaceutical Analytical Techniques") M. Pharmacy I Semester (Suppl.) Examination, November 2015 (Common To All) Subject: Pharmaceutical Analytical Techniques Code No. 6001 / S Note: Answer any Five questions. All questions carry equal marks.
M. Pharmacy I Semester (Suppl.) Examination, November 2015 (Common To All) Subject: Pharmaceutical Analytical Techniques Code No. 6001 / S Note: Answer any Five questions. All questions carry equal marks.
Development of a MATLAB model for estimating the amount of Protein adsorption on nanoparticles covered with poly (ethylene glycol)
") Development of a MATLAB model for estimating the amount of Protein adsorption on nanoparticles covered with poly (ethylene glycol) A thesis submitted to the Faculty of Drexel University School of Biomedical
Development of a MATLAB model for estimating the amount of Protein adsorption on nanoparticles covered with poly (ethylene glycol) A thesis submitted to the Faculty of Drexel University School of Biomedical
The Chinese University of Hong Kong Department of Chemistry
 Prof. Yue Zhao University of Sherbrooke Canada Control of Stimult-Responsive Polymers by New Methods December 1, 2014 (Monday) 2:30 p.m. Room G35 Lady Shaw Building Prof. Chi Wu Prof. Petr Štěpánek Institute
FACULTY OF PHARMACY. M. Pharmacy I Semester (Suppl.) Examination, November 2015 (Common To All) Subject: Pharmaceutical Analytical Techniques
 Examination, November 2015 (Common To All) Subject: Pharmaceutical Analytical Techniques") M. Pharmacy I Semester (Suppl.) Examination, November 2015 (Common To All) Subject: Pharmaceutical Analytical Techniques Code No. 6001 / S 1 a) Describe the instrumentation and applications of UV-visible
M. Pharmacy I Semester (Suppl.) Examination, November 2015 (Common To All) Subject: Pharmaceutical Analytical Techniques Code No. 6001 / S 1 a) Describe the instrumentation and applications of UV-visible
Nonlinear pharmacokinetics
 5 Nonlinear pharmacokinetics 5 Introduction 33 5 Capacity-limited metabolism 35 53 Estimation of Michaelis Menten parameters(v max andk m ) 37 55 Time to reach a given fraction of steady state 56 Example:
Determination of Solubility Parameters using Inverse Gas Chromatography
 Determination of Solubility Parameters using Inverse Gas Chromatography Anett Kondor PhD IGC-SEA Product Manager and igc Product Specialist 7 th April 017 Overview Introduction Inverse Gas Chromatography
Modern Additive Technology - a view into the future
 Introduction Modern Additive Technology - a view into the future Dr. Jürgen Omeis, Dr. Guillaume Jaunky BYK-Chemie GmbH, Wesel, Germany Reviewing the current literature of colloids and interfacial materials,
Internal dose assessment of 177 Lu-DOTA-SP for quantification of arginine renal protection effect
 Internal dose assessment of 177 Lu-DOTA-SP for quantification of arginine renal protection effect 1 Puerta N., 1 Rojo A., 2 Crudo J., 2 Zapata A., 2 Nevares N., 2 López Bularte A., 2 Perez J., 2 Zaretzky
Biology of Humans: Concepts, Applications, and Issues, 6e (Goodenough) Chapter 2 Chemistry Comes to Life
 Chapter 2 Chemistry Comes to Life") Biology of Humans: Concepts, Applications, and Issues, 6e (Goodenough) Chapter 2 Chemistry Comes to Life 2.1 Multiple Choice Questions 1) A neutral atom must contain. A) an equal number of protons and
Biology of Humans: Concepts, Applications, and Issues, 6e (Goodenough) Chapter 2 Chemistry Comes to Life 2.1 Multiple Choice Questions 1) A neutral atom must contain. A) an equal number of protons and
PCBs and the Great Lakes
 Note to students: This presentation received a 50/50 as graded by me and their fellow students. Keep in mind, the grade also reflects things you didn t see (delivery, presentation, participation, etc.).
MULTIPLE CHOICE. Choose the one alternative that best completes the statement or answers the question.
 MULTIPLE CHOICE. Choose the one alternative that best completes the statement or answers the question. 1) A neutral atom must contain. A) an equal number of protons, neutrons, and electrons B) an equal
12U Biochemistry Unit Test
 1 12U Biology: Biochemistry Test 12U Biochemistry Unit Test Modified True/False Indicate whether the statement is true or false. If false, change the identified word or phrase to make the statement true.
Glyphosate in all its forms
 Glyphosate in all its forms S. Goscinny and V. Hanot Scientific Institute for Public Health Pesticides Unit A breakthrough molecule Since its first appearance on the market in 1974, glyphosate has become
Assessment of toxicological properties and establishment of risk profiles - genotoxic properties of selected spice compounds
 Assessment of toxicological properties and establishment of risk profiles - genotoxic properties of selected spice compounds Frankfurt/Main, September 25 th 212 V.J. Koller 1, V. Auwärter 2, G. Zlabinger
FRAUNHOFER IME SCREENINGPORT
 FRAUNHOFER IME SCREENINGPORT Design of screening projects General remarks Introduction Screening is done to identify new chemical substances against molecular mechanisms of a disease It is a question of
Luke Chimuka. School of Chemistry, University of Witwatersrand
 Preparation, characterization and application of NaHCO 3 leached bulk U(VI) imprinted polymers endowed with γ-mps coated magnetite in contaminated water Luke Chimuka School of Chemistry, University of
CHEMICAL ENGINEERING (CHE)
") Chemical Engineering (CHE) 1 CHEMICAL ENGINEERING (CHE) CHE 2033 Introduction to Chemical Process Engineering Prerequisites: CHEM 1515 and ENSC 2213 Description: Concurrent enrollment in MATH 2233 or 3263,
Chemical Engineering (CHE) 1 CHEMICAL ENGINEERING (CHE) CHE 2033 Introduction to Chemical Process Engineering Prerequisites: CHEM 1515 and ENSC 2213 Description: Concurrent enrollment in MATH 2233 or 3263,
Biochemistry: A Review and Introduction
 Biochemistry: A Review and Introduction CHAPTER 1 Chem 40/ Chem 35/ Fundamentals of 1 Outline: I. Essence of Biochemistry II. Essential Elements for Living Systems III. Classes of Organic Compounds IV.
MME 4506 Biomaterials. Protein adsorption to biomaterial surfaces
 MME 4506 Biomaterials Protein adsorption to biomaterial surfaces After implantation of a biomaterial in a living system, proteins have been observed on the surface in a short time, less than 1 second later.
Hazard Communication. What You Need to Know. Southeastern OSHA Training Institute Education Center
 Hazard Communication What You Need to Know Session Objectives By the end of this session, participants will be able to: Describe the 6 required label elements. Identify the 9 GHS pictograms. Recognize
Chapter 6 Magnetic nanoparticles
 Chapter 6 Magnetic nanoparticles Magnetic nanoparticles (MNPs) are a class of nanoparticle which can be manipulated using magnetic field gradients. Such particles commonly consist of magnetic elements
2. In regards to the fluid mosaic model, which of the following is TRUE?
 General Biology: Exam I Sample Questions 1. How many electrons are required to fill the valence shell of a neutral atom with an atomic number of 24? a. 0 the atom is inert b. 1 c. 2 d. 4 e. 6 2. In regards
Fairfield Public Schools Science Curriculum. Draft Units
 Fairfield Public Schools Science Curriculum Draft Units Human Anatomy and Physiology - Blood, Guts, Senses, and Defenses 1 Human Anatomy and Physiology - Blood, Guts, Senses, and Defenses: Description
Passaic County Technical Institute. Wayne, NJ. Anatomy and Physiology II Curriculum. August 2015
 Passaic County Technical Institute Wayne, NJ Anatomy and Physiology II Curriculum August 2015 Anatomy and Physiology II Curriculum August 2015 I. Course Description Anatomy and Physiology II is a full
Exercise 9 - Petrochemicals and Climate
 113 Exercise 9 - Petrochemicals and Climate 1. The year of the first U.S. drilled oil well. c. 1859 2. Approximately, what percent of the world's remaining oil reserves are in the United States? a. 2%
SHORT ANSWER. Write the word or phrase that best completes each statement or answers the question.
 ch 2 chemical basis of life Name SHORT ANSWER. Write the word or phrase that best completes each statement or answers the question. Fill in the blank or provide a short answer: 1) When a change in matter
Acid-Base Properties
 TAMMAR H. Ali Lecture 1 Course No. 326 Faculty of Pharmacy University Of Al-Muthanna 1 Physicochemical Principles of Drug Action Physicochemical Principles of Drug Action To design better drugs: Molecular
Chapter 2 Water: The Solvent for Biochemical Reactions
 Chapter 2 Water: The Solvent for Biochemical Reactions SUMMARY Section 2.1 Water is a polar molecule, with a partial negative charge on the oxygen and partial positive charges on the hydrogens. There are
Preview Slides for Introduction to Protein Formulation and Delivery
 Preview Slides for Introduction to Protein Formulation and Delivery Tim Kelly, Ph.D. VP, Biopharmaceutical Development KBI Biopharma, Inc Durham, NC Pooja Arora, Ph.D. Senior Manufacturing Technical Specialist
CELL PRACTICE TEST
 Name: Date: 1. As a human red blood cell matures, it loses its nucleus. As a result of this loss, a mature red blood cell lacks the ability to (1) take in material from the blood (2) release hormones to
CELL STRUCTURE & FUNCTION
 CELL STRUCTURE & FUNCTION CELL TYPES Living cells can be classified into 2 different types on the basis of their internal structure: 4. Prokaryotic Cells 5. Eukaryotic Cells 1. Prokaryotic Cells Are the
Overview. Lecture 5 Colloidal Dispersions
 Physical Pharmacy Lecture 5 Colloidal Dispersions Assistant Lecturer in Pharmaceutics Overview Dispersed Systems Classification Colloidal Systems Properties of Colloids Optical Properties Kinetic Properties
CHAPTER 7 SUMMARY AND CONCLUSIONS. constitutes the objective of many a research project in the field of pharmaceutical
 CHAPTER 7 SUMMARY AND CONCLUSIONS Taste masking and development of palatable dosage forms of bitter drugs constitutes the objective of many a research project in the field of pharmaceutical technology.
PROPERTIES OF SOLUTIONS A S S T. P R O F. D R. A L A A J. M A H R A T H M E D I C A L C H E M I S T R Y
 PROPERTIES OF SOLUTIONS A S S T. P R O F. D R. A L A A J. M A H R A T H M E D I C A L C H E M I S T R Y LEARNING GOAL Identify a mixture as a solution, a colloid, or a suspension. Describe how the number
Global Product Strategy (GPS) Safety Summary. Tetrahydrofuran
 Safety Summary. Tetrahydrofuran") Global Product Strategy (GPS) Safety Summary Tetrahydrofuran This GPS Safety Summary is a high-level summary intended to provide the general public with an overview of product safety information on this
Global Product Strategy (GPS) Safety Summary Tetrahydrofuran This GPS Safety Summary is a high-level summary intended to provide the general public with an overview of product safety information on this
Evaluating Human Health Risks from Nanomaterials
 Evaluating Human Health Risks from Nanomaterials September 7, 2006 John R. Bucher, Ph.D., Director Toxicology Operations, NTP/NIEHS National Institute of Environmental Health Sciences/National Institutes
The microparticle system has become an indispensable part of the controlled drug delivery fields for the past few decades since it can
 Microencapsulation Microencapsulation is a process or technique by which thin coatings can be applied reproducibly to small particles of solids, droplets of liquids, or dispersions, thus, forming microcapsules.
Organic Chemistry of Drug Degradation
 Organic Chemistry of Drug Degradation Li New Jersey Email: minli88@yahoo.com Publishing Contents Chapter 1 Introduction 1 1.1 Drug Impurities, and the Importance of Understanding Drug Chemistry 1 Characteristics
Magnetic Nano Particles for In-Vitro Diagnostics
 Magnetic Nano Particles for In-Vitro Diagnostics has utilized its many years of experience in creating a Magnetic Nano Particles Developer Kit for in-vitro biomedical applications. The kit offers a unique
2: CHEMICAL COMPOSITION OF THE BODY
 1 2: CHEMICAL COMPOSITION OF THE BODY Although most students of human physiology have had at least some chemistry, this chapter serves very well as a review and as a glossary of chemical terms. In particular,
Middle School Science. (8) Science concepts. The student knows that matter is composed of atoms. The student is expected to:
 Science concepts. The student knows that matter is composed of atoms. The student is expected to:") Middle School Science 112.24. Science, Grade 8. (b) Knowledge and skills. (8) Science concepts. The student knows that matter is composed of atoms. The (A) describe the structure and parts of an atom;
Middle School Science 112.24. Science, Grade 8. (b) Knowledge and skills. (8) Science concepts. The student knows that matter is composed of atoms. The (A) describe the structure and parts of an atom;
Polyethylene Glycol (PEG), High Sensitive ELISA
, High Sensitive ELISA") K-ASSAY Polyethylene Glycol (PEG), High Sensitive ELISA For the high sensitive quantitative determination of PEG and PEGylated proteins in serum or plasma Cat. No. KT-657 For Research Use Only. 1 K-ASSAY
K-ASSAY Polyethylene Glycol (PEG), High Sensitive ELISA For the high sensitive quantitative determination of PEG and PEGylated proteins in serum or plasma Cat. No. KT-657 For Research Use Only. 1 K-ASSAY
Peptides as Radiopharmaceuticals: CMC Perspectives
 s as Radiopharmaceuticals: CMC Perspectives Ravindra K. Kasliwal, Ph.D. Office of New Drug Products (ONDP) Office of Pharmaceutical Quality (OPQ) Center for Drug Evaluation and Research (CDER) Food and
LABORATORY CHEMICAL HYGIENE PLAN
 Page 1 LABORATORY CHEMICAL HYGIENE PLAN What is not a poison? All things are poison and nothing is without poison. It is the dose only that makes a thing not a poison - Paracelsus (15 th Century) As part
Advanced Anatomy and Physiology
 Lakeshore Technical College 10806179 Advanced Anatomy and Physiology Course Outcome Summary Course Information Alternate Title Description Total Credits 4 Total Hours 90 Adv Anatomy & Physiology Advanced
CHAPTER 2 THE CHEMICAL BASIS OF LIFE
 CHAPTER 2 THE CHEMICAL BASIS OF LIFE CHAPTER OVERVIEW This chapter introduces very basic concepts of chemistry, emphasizing the structure of atoms and how they combine (form bonds). The types of bonds,
3.051J/20.340J Problem Set 2 due 2/28/06
 1 1. (21 pts) CoCrMo alloys form a passivating oxide on their surface that renders them useful for orthopaedic implants. Such implants remain susceptible, however, to fretting corrosion, which occurs as
Model Solutions Spring 2003
 Exam I BE.462J/3.962J Model Solutions Spring 2003 (60 points total) 1. (5 points) Explain the following observation: autocatalysis generally has a smaller influence on the degradation rate of surface-eroding
PHRC 4110 Pharmaceutics I
 CO01: Use interpretive tools for proper data handling CO01.01: Describe basic mathematics and statistic to interpret pharmaceutical data CO01.02: Work with exponents, powers, roots, logarithms, and antilogarithms
of 2-Phenoxyethanol in B6D2F1 Mice
 Summary of Drinking Water Carcinogenicity Study of 2-Phenoxyethanol in B6D2F1 Mice June 2007 Japan Bioassay Research Center Japan Industrial Safety and Health Association PREFACE The tests were contracted