CHAPTER-2 SYNTHESIS AND CHARACTERIZATION OF MODIFIED METAL OXIDES AND METAL SULPHIDES NANOPARTICLES
|
|
|
- Verity Grant
- 6 years ago
- Views:
Transcription
1 CHAPTER-2 SYNTHESIS AND CHARACTERIZATION OF MODIFIED METAL OXIDES AND METAL SULPHIDES NANOPARTICLES Nanoparticles have recently attracted significant attention from the science community. Nanoparticles with diameters in the range of 1 to 2 nm, promise to play a significant role in developing technologies. They exhibit unique physical properties that give rise to many potential applications in areas such as nonlinear optics, luminescence, electronics, catalysis, solar energy conversion, and optoelectronics. Modified metal oxide and metal sulphides nanostructure materials have unique size dependent chemical and physical properties that render them applicable in the emerging field of medicine, solar cell 12, antibacterial agents 121, geological materials 122, etc. The introduction of impurity atom into semiconducting nanomaterial is primary for controlling the properties of semiconductor such as band gap or electrical conductivity. The band gap energy and surface area of nanoparticles increases with decreasing particle size. Hence, nanosized semiconductor particles can possess photo redox properties with reduction reactions which might not otherwise proceed in bulk materials, being able to occur readily using sufficiently small particles therefore used as photocatalysts, and catalysts in organic transformations 123. This chapter focused the attention on synthesis of cheaper, ecofriendly, reusable, effective metal oxide, metal sulphide, doped metal oxides, doped metal sulphide nanoparticles catalyst for the photodegradation of organic dyes, and organic transformations. Their structure and morphology were characterized by UV-DRS, IR, X-ray diffraction, SEM, EDAX, TEM, SAED, ESR, PL, TGA, and BET surface area measurement method. 36
2 This chapter is further divided in four sections Section A: Synthesis and characterization of semiconducting PbO and Ni doped PbO nanoparticles Section B: Synthesis and characterization of semiconducting CdO and Cs doped CdO nanoparticles Section C: Synthesis and characterization of semiconducting PbS and Co doped PbS nanoparticles Section D: Synthesis and characterization of semiconducting ZnS and Sm doped ZnS nanoparticles 37
3 Section-A Synthesis and Characterization of Semiconducting PbO and Ni Doped PbO Nanoparticles 2.1A. Introduction: Metal oxides play a vital role in many areas of chemistry, physics, and materials science 124. These metals are able to form a large diversity of oxide compounds, and have number of structural geometries with an electronic structure that can exhibit metallic, semiconductor or insulator character. Oxide nanoparticles can exhibit unique physical and chemical properties due to their limited size and a high density of corner or edge surface sites. Particle size is expected to influence the structural characteristics, the lattice symmetry, and cell parameters. These nanomaterials have attracted a great deal of attention from researchers of various fields due to their numerous technological applications such as control of NO x emissions from automotive engines, removal of other environmental pollutants, catalysts, sensors, supercapacitors, lubricants, biological applications, and adsorbers The wurtize phase is essential in catalysis applications, e.g. TiO 2, WO 3, and SnO 2 have been used as catalysts but it possesses poor catalytic activity. The oxides like MgO, SiO 2 are found to be inactive since most metal oxide, and sulphides cannot be reused hence such photo conductors are not suitable for long term treatment processes. Lead oxide (PbO) is a member of the relatively small family of lead (II) binary oxides. Lead oxide (PbO) nanomaterials itself has two forms, red α PbO (litharge) which is stable at low temperature, and yellow β PbO (massicot) which is stable at high temperature. The α PbO phase transformation to β PbO takes place at about 38
4 49 o C 131, and both are photoactive semiconductors with band gaps of 1.92 ev and 2.7 ev. Lead oxide is an important industrial material due to its unique electronic, optical and mechanical properties, its potential applications in functionalized materials and nanodevices 132, lead acid batteries 133, and lithium secondary batteries 134. Due to its high power density, wide application temperature range, complete recycling system, relatively low price electro deposition used in deposition onto precious metals 135, lead oxide-matrix composite 136, high pressure phase transformation 137, oriented lead oxide on silica 138, biomedical applications 139, and Pb (II) selective electrode 14. Due to unique property of PbO it is used as modifiers in luminescent glassy materials 141, gas sensors 142, paints 143, and pigments 144. Recently, lead oxide nanoparticles used in studying electron structure of insulator metal interface 145. Due to simplicity of design, low cost of manufacturing, reliability, relative safety there is a high interest to improve characteristics of lead oxide to obtain more discharge capacity, and more cycle life. Therefore, research to improve discharge capacity of lead oxide is still in demand. After the doping of nickel ion into lead oxide nanoparticles, the interactions between the lead oxide, and nickel ion may change the electronic properties of PbO which results in the further enhancement of discharge capacity 146. Lead oxide nanoparticles have been synthesized by several physicochemical methods including, spray pyrolysis 147, thermal decomposition 148, selected control synthesis 149, sonochemical 15, synthesis by coordination polymers 151, pulsed current electrochemical method 152, microwave irradiation 153, sol-gel 154, soft template synthesis 155, and hydrothermal method 156. Today the chemical synthesis is one of the important techniques for nanocrystalline materials. It can be performed using a range of precursor and synthesis conditions such as temperature, time, and concentration. Variation of these 39
5 parameters leads to different size, surface morphology, and geometries of resulting materials. The organic dyes are one of the main environmental contaminants due to their toxic and non biodegradable nature. Although these organic dyes are present in very low amounts in industrial effluents, they have shown ample potential to disturb the environment. These dyes are insufficiently removed by conventional sewage treatment plants due to their high biochemical stability, water solubility, and high molecular weight. Therefore, there is a need of new technology which is more efficient, consume less energy, environmental benign protocol for the clean, and green environment. In order to achieve a better solution for this problem, and application of lead oxide nanoparticles as a catalyst in organic transformations, the lead oxide nanoparticles were synthesized using hydrothermal method. Nickel doped lead oxide nanoparticles were also synthesized to extend the light absorption spectrum of lead oxide nanoparticles towards the visible region. Transition metal ion (nickel) encapsulation enhances the interfacial charge transfer reaction of lead oxide and decrease the crystallite size of lead oxide nanoparticles. The goal of this study is to investigate the effect of nickel ion doping on the catalytic activity of lead oxide nanoparticles. The synthesized lead oxide (PbO), and nickel ion doped lead oxide nanoparticles is characterized by using different analytical techniques like UV-visible diffused reflectance (UV-DRS), Fourier-transform infrared spectroscopy (FT-IR), X-ray powder diffraction (XRD), scanning electron microscopy (SEM), energy dispersive analysis of X-ray (EDAX), transmission electron microscopy (TEM), thermogravimetric analysis (TGA), electron spin resonance spectroscopy (ESR), photoluminescence spectroscopy (PL), and BET surface area measurements technique. 4
6 2.2A. Experimental: The starting materials lead nitrate (Sigma Aldrich, 99. %), citric acid (Loba Chemie, 99.5 %), methanol (Loba Chemie, 99.5 %), nickel sulphate (Sigma Aldrich, 99. %), and sodium hydroxide (Sigma Aldrich, 98.5 %) were used as reactants for the synthesis of PbO and Ni doped PbO nanoparticles. Double distilled water was used throughout the experiment A. Synthesis of PbO nanoparticles: An aqueous solution of citric acid (2.5 mol) was added to a magnetically stirred methanolic solution of lead nitrate (2. mol) at room temperature, then the reaction mixture was stirred well over 2 minutes. The aqueous solution of sodium hydroxide was added slowly and stirred until solution becomes alkaline. The complex formation was obtained as a precipitate and it was stirred for another 2 hrs at room temperature. The white solid product obtained was filtered, washed thoroughly with distilled water for the complete removal of nitrate, and hydroxide ion. The precipitate was dried in oven at 11 o C for 2 hrs and ground mechanically to fine powder. The resulting dry powder was calcinized at 5 o C for 2 hrs at the rate of 2 o C per minute. The calcinized PbO used for further characterization A. Synthesis of Ni doped PbO nanoparticles: The synthesized lead oxide (PbO) nanoparticles were used as precursor material, and nickel sulphate (NiSO 4 ) as dopant. A lead oxide nanoparticle (1. mol) was mixed with 3 % and 7 % NiSO 4 solution along with sodium hydroxide solution (1 N, 1 ml). The slurry obtained was stirred well, transferred into Teflon autoclave and kept in oven at 11 o C for 2 hrs. The precipitate obtained was vacuum filtered, washed with distilled water for the removal of soluble impurities, and dried at 11 o C 41
7 for 2 hrs. These samples were calcinized at 5 o C for 2 hrs, these calcinized 3 % and 7 % Ni doped lead oxide nanoparticles are used for characterization. The UV-visible diffuse reflectance spectra (UV-DRS) were recorded using diffuse reflectance UV-visible spectrophotometer (Shimadzu UV-245 diffuse reflectance mode) using BaSO 4 as a reflectance standard. Photoluminescence (PL) spectrum at room temperature was recorded by Perkins Elmer spectrophotometer by using Xenon arc lamp (λ = 325 nm) as the light source. Infra red spectra were run on a 84s Shimadzu FT-IR spectrophotometer as KBr pellets. The X-ray diffraction (XRD) patterns were recorded on a multipurpose X-ray diffractometer (Philips-171 diffractometer CuKα, λ = A o ) at a scan rate of.17 o 2θ sec -1. The scanning electron microscopy (SEM), and energy dispersive analysis of X-rays (EDAX) was carried out by using scanning electron microscope (JEOL JEM-636A model) equipped with JEOL JEC-56 auto carbon coater SEM. The transmission electron microscopy (TEM) images recorded with selected area electron diffraction (SAED) using CM-2 Philips Microscope. The thermal stability was studied by thermogravimetric analysis (TGA) using Perkins Elmer, USA instrument at heating rate of.1 o C-1 o C per minute in the temperature range from room temperature to 1 o C. An electron spin resonance (ESR) spectrum was recorded on E-112 EPR spectrometer VARIAN, USA. The Brunauer, Emmet, and Teller (BET) surface area was recorded with the help of Quantachrome Autosorb Automated gas sorption system. 2.3A. Results and Discussion: 2.3.1A. UV-DRS analysis: Figure 2.1 depicts the UV-visible diffused reflectance spectra (UV-DRS) of the nanocrystalline PbO, 3 %, and 7 % Ni doped PbO nanoparticles. It shows broad 42
8 band at 396, 42, and 47 nm for PbO, 3 %, and 7 % Ni doped PbO nanoparticles respectively. The blue shift arises from that of bulk PbO due to quantum confinement effects. The band shifted to higher wavelength with increase in the amount of the dopant. The band gap energies obtained by using UV-DRS of the synthesized PbO, 3 %, and 7 % Ni doped PbO nanoparticles are 3.13, 3.8, and 3.4 ev respectively on the basis of equation 157, Eg = /λ, where λ is the wavelength (nm) of the exciting light. These results reveals that after the encapsulation of nickel ion in synthesized PbO nanoparticles, the absorption goes in the visible region in comparison with undoped PbO nanoparticles. It means that the doped metal oxide nanoparticles are sensitive to visible light. The shifting of band is arising due to doping effect on band gap of semiconducting PbO nanoparticles. The photocatalytic activity of nickel doped PbO nanoparticles is greatly enhanced due to increased photo generation rate of charge transfer between Ni +2 electrons and the PbO nanoparticles conduction band to valence band A. FT-IR analysis: The FT-IR spectra for the synthesized PbO, 3 %, and 7 % Ni doped PbO nanoparticles in KBr matrix is shown in Fig The broad band at cm -1 in PbO is associated with the vibration of Pb-O bond 159. There is a broad band with very low intensity at cm -1 corresponds to the stretching vibration of the OH group and it may be due to small amount of water adsorbed on the surface of PbO nanoparticles 16. The band at cm -1 is due to the -OH deformation vibration of water molecule. The water is in dissociated form because no band at cm -1, which is characteristic of the deformation vibration of water adsorbed in the molecular form. Further, careful inspection of FT-IR spectra shows strong absorption band at 43
9 498.2 cm -l indicates presence of β PbO (massicot) form of PbO synthesized nanoparticles 161. The bands at 92.1 cm -1 and cm -1 of very low intensities attributed due to oxygen stretching and bending frequency. In 3 % and 7 % Ni doped PbO nanoparticles the bands at 92.1 cm -1 and cm -1 are more pronounced due to the presence of nickel ion A. X-ray diffraction (XRD) analysis: The XRD pattern of synthesized PbO, 3 %, and 7 % Ni doped PbO is shown in Fig The diffraction peaks indicate the nanocrystalline nature of synthesized powder. It shows peaks at an angle 29.1, 3.4, 32.5, 37.7, 49.4, 5.9, 53.3, 56.2, and 63.7 corresponds to the reflection from 111, 2, 2, 21, 22, 22, 222, 311, and 131 crystal planes respectively. The XRD pattern is an agreement with the orthorhombic structure of PbO (JCPDS Card No ) with a space group Pca 2 1 (29). Sharp diffraction peak indicates good crystallinity of PbO nanoparticles, and the broadening of peaks indicates that the particles are of nanometer size. The XRD pattern of 3 % and 7 % Ni doped PbO sample is almost coincide with that of pure PbO, it can be found that nickel doping do not change crystalline structures of PbO nanoparticles. It indicates that nickel is present in ionic state bonded with oxygen of the PbO inside the frame work. The average particle size was calculated using Debye- Scherrer s equation 162. The XRD data shows that the particle size of synthesized PbO is 69 nm, 64 nm for 3 % Ni doped PbO, and 61 nm for 7 % Ni doped PbO nanoparticles. It shows that the average particle size of PbO nanoparticles with increase in amount of dopant and this method produce the fine particles. In comparison with pure PbO nanoparticles sample the nickel encapsulated PbO nanoparticles have relatively small particle size indicating that the doping can improve the morphology, and retard the grain growth 44
10 Reflectance ( %) Wavelength (nm) 7% Ni-PbO 3%Ni-PbO PbO Fig. 2.1: UV-DRS spectra of synthesized PbO, and (3 %, and 7 %) Ni doped PbO Fig. 2.2: FT-IR spectra of synthesized PbO, and (3 %, and 7 %) Ni doped PbO Fig. 2.3: XRD pattern of synthesized PbO, and (3 %, and 7 %) Ni doped PbO 45
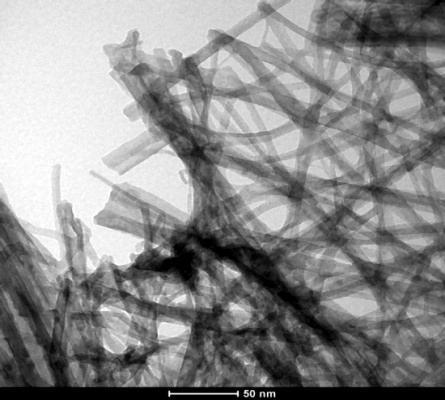
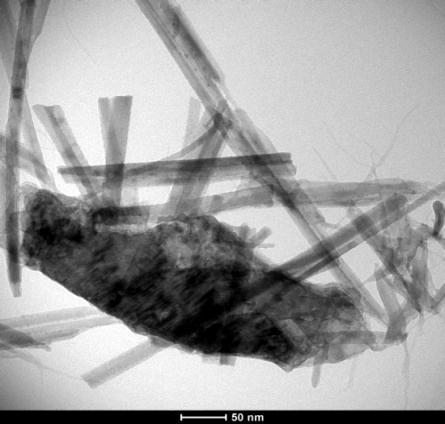
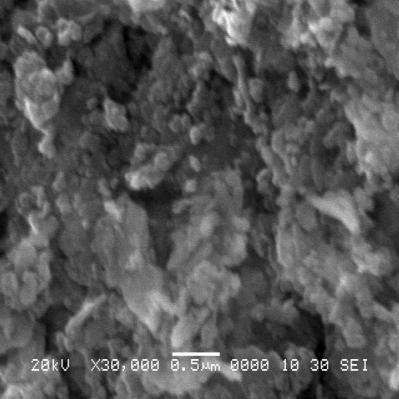
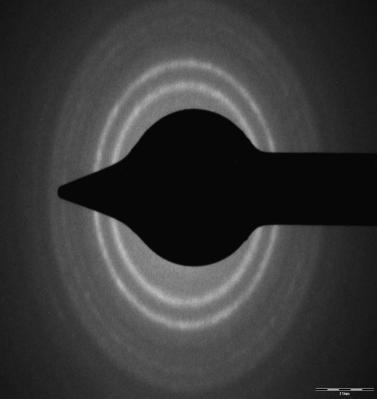
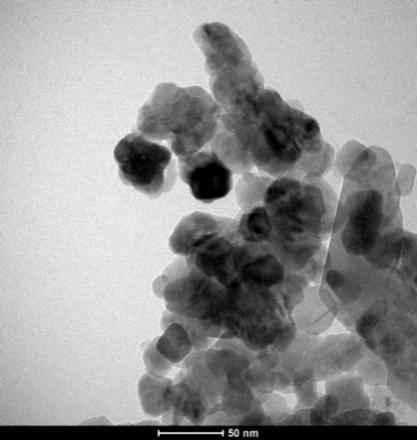
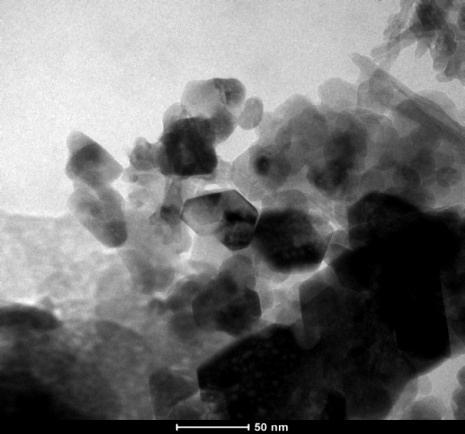
11 of PbO nanoparticles. This may be due to the fact that dopant ions inhibit crystal growth, and sintering between grainsduring the heat treatment, Pb +2 atoms in crystal lattice is replaced by Ni +2 ions A. SEM and EDAX analysis: Figure 2.4 represents SEM images of synthesized PbO, 3 %, and 7 % Ni doped PbO nanoparticles. The crystal morphology of the particles is quite similar to each other, and likely become spongy discrete particle nature. The SEM image shows that the synthesized PbO, 3 %, and 7 % Ni doped PbO materials are agglomerates. However, the size of the particles varies in the range of 69 to 61 nm as measured using the XRD patterns. The EDAX analysis of synthesized PbO, 3 %, and 7 % Ni doped PbO materials are shown by Fig Strong peaks of Pb and O are found in the EDAX spectrum, and detectable amounts of nickel indicate that nickel ion has doped into PbO nanocrystallites. It indicates that 2.97 % and 6.94 % of nickel ion is present in the doped PbO nanoparticles. The slight decrease in the amount of nickel is due to the leaching of unbound nickel ion during the washing A. TEM and SAED analysis: The particle size and crystal morphological information of the sample was further investigated by TEM, SAED analysis, and are depicted in Fig The TEM image of PbO, 3 %, and 7 % Ni doped PbO nanoparticles shows that the orthorhombic structure with agglomerate nature. Moreover, the particle size of the sample obtained from TEM analysis is comparable to those estimated from Debye- Scherrer equation 162 and varies in the range of 69 to 61 nm. The dark spot in the TEM micrograph can be associated with synthesized PbO, 3 %, and 7 % Ni doped PbO nanoparticles as SAED pattern associated with such spots reveals the occurrence of PbO, 3 %, and 7 % Ni doped PbO nanoparticles in total agreement with the XRD 46

")
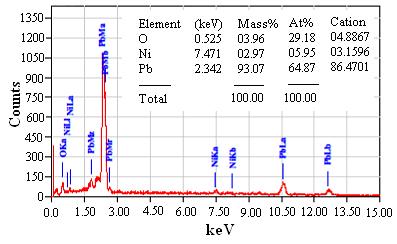
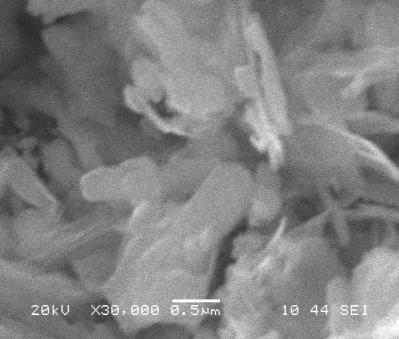
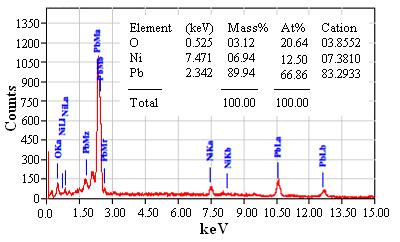
12 (a) (b) Fig. 2.4: SEM and EDAX of a) synthesized PbO, b) 3 % Ni doped PbO, and c) 7 % Ni doped PbO (c) 47
13 data. The SAED pattern of PbO, 3 %, and 7 % Ni doped PbO nanoparticles shows similar d-values as obtained by XRD data A. Thermogravimetric analysis (TGA): Figure 2.6 shows the TGA curve of synthesized PbO nanoparticles before the calcination process. It reveals that the thermal decomposition takes place up to 45 o C. The decomposition of hydrocarbon takes place in this temperature range. From 45 o C to 6 o C temperature region the material are stable, and it shows stability of the synthesized material A. Electron spin resonance (ESR) analysis: Interaction of nickel ion and the host PbO semiconducting nanoparticles studied by ESR spectrum and is shown in Fig This technique has been used to characterize the environment of the paramagnetic species in host lattice of different species 163. The ESR signal of 3 % Ni doped PbO nanoparticle was recorded at room temperature. The ESR spectrum characterization indicates that the doping of transition metal (nickel) is homogeneous, and there is no secondary phase present. The ESR signal also shows that the effective g factor is greater than 2 (2.277) indicates a clear evidence of ferromagnetism in this synthesized materials. This g value also used to determine the number of unpaired electrons in the molecule A. Photoluminescence analysis (PL): The photoluminescence spectrum of synthesized PbO is shown by Fig. 2.8, which exhibits a broad blue emission band at 473 nm (2.62 ev) and strong greenyellow emission band around 5 nm (2.48 ev). The visible band arises due to the defects in PbO nanostructures. The peak at 473 nm is probably caused due to, i) transition from monovalent interstitial lead (Pb +2 ) or oxygen vacancy (V o o) to the monovalent vacancy (V + o), and ii) transition from conduction band to the monovalent 48


 7 %")
14 (a) (b) (c) Fig. 2.5: TEM, and SAED of a) synthesized PbO, b) 3 % Ni doped PbO, and c) 7 % Ni doped PbO 49
15 Intensity Fig. 2.6: TGA curve of synthesized PbO nanoparticles Fig. 2.7: ESR spectra of 3 % Ni doped PbO nanoparticles Wavelength (nm) Fig. 2.8: PL spectrum of synthesized PbO nanoparticles 5
16 vacancy (V + o). The origin of blue emission from the undoped PbO nanoparticles is associated with the intrinsic defect centers such as oxygen vacancy (V o o) lead vacancy or the oxygen interstitial vacancy A. BET surface area analysis: The BET surface area measurement analysis of synthesized PbO, 3 %, and 7 % Ni doped PbO nanoparticles are shown by Fig The N 2 adsorption-desorption isotherms, and BJH pore size distribution of PbO nanoparticles reveals that the prepared sample have typical IV N 2 adsorption-desorption isotherms with H 1 hysteresis. The BJH pore size distribution demonstrates that all the samples have a narrow pore diameter range. Using N 2 adsorption-desorption isotherm the specific surface area (S BET ) of PbO, 3 %, and 7 % Ni doped PbO nanoparticles are m 2 /g, m 2 /g, and m 2 /g respectively. The average pore volumes (V P ) were.1889 cc/g,.2256 cc/g, and.2386 cc/g for PbO, 3 %, and 7 % Ni doped PbO nanoparticles respectively. The pore diameter (dp) was A o, A o, and 3.86 A o for PbO, 3 %, and 7 % Ni doped PbO nanoparticles respectively. The specific surface area (S BET ) increases from undoped PbO to Ni doped PbO nanoparticles, and also increase with increase in the concentration of the dopant. The results reveal that the Ni doped PbO nanoparticles have high surface area, so it act as efficient catalyst in heterogeneous catalysis and photodegradation of various organic dyes. In catalysis greater the surface area of the catalyst, the faster the reaction will proceed because catalytic action takes place at a surface
17 Volume (cc/gm) Dv(logd)[m 2 /gm] Volume (cc/gm) Dv(logd)[m 2 /gm] Volume (cc/gm) Dv(logd)[m 2 /gm] Relative pressure (P/Po) Pore diameter (A ) (a) Relative pressure (P/Po) Pore diameter (A ) (b) Relative presure (P/Po) Pore diameter (A ) (c) Fig. 2.9: BET surface area, and pore size of a) synthesized PbO, b) 3 % Ni doped PbO, and c) 7 % Ni doped PbO 52
18 Section-B Synthesis and Characterization of Semiconducting CdO and Cs Doped CdO Nanoparticles 2.1B. Introduction: The semiconductor nanoparticles belong to state of matter in the transition region between molecules and bulk solids in which the relevant dimension changes 165. Nanocrystalline materials are attracting much attention due to their increasing applications in solar energy conversion, non linear optics, heterogeneous catalysis, microelectronics, and photocatalysis 166. Cadmium oxide (CdO) nanomaterial is an II- VI n-type of semiconductor with a direct band gap of 2.5 ev 167 and 1.98 ev an indirect band gap 168. The difference in band gap originates from cadmium, oxygen vacancies, and strongly depends on the method of synthesis 167. In nanocrystalline size affects the spacing between energy levels which becomes the cause of increase of energy gap. The equilibrium and dynamic properties of nanomaterials are completely different with their bulk materials. The optical transmittance of CdO in the visible region of the spectrum has very low value 169. It has interesting properties such as large band gap, low electrical resistivity, and high transmission in the visible region. Cadmium oxide nanoparticles have unique physical properties that are size, and shape dependent due to which it is useful for a wide range of applications such as photo transistors, solar cells, lithium ion batteries, transparent electrodes, photodiodes, and gas sensors 17. A cadmium oxide nanoparticle has distinguished properties 171 and is widely used as a transparent conductive oxide (TCO) in optoelectronic devices 172, nonlinear materials 167, and catalysts 173. The modified CdO nanoparticles are used as sensor for the study of 53
19 biological active compounds 174. A cadmium oxide nanoparticle is transparent conducting oxide material with high carrier mobility, and has great potential in optoelectronic devices 175. Nanostructured materials are attracting a great deal of attention due to their ability for achieving specific process, selectivity in biological, and pharmaceutical applications 176. Nanoparticles antimicrobial formulations could be used as effective bactericidal materials 177. Based on the metal ions, the nanomaterials exhibit broad spectrum of biocidal activity towards different bacteria, fungi, and viruses 178. The effect of nanoparticles on bacteria is very important since they have low level, and hence enter the food chain of the ecosystems 179. Cadmium oxide nanomaterials have been reported for antibacterial properties and used as an antibacterial agents 18. Cadmium oxide nanoparticles are non toxic, chemically stable under high temperature, and capable of photocatalytic oxidation 181. The cadmium oxide nanocrystalline materials also used as catalyst in organic transformation like acylation of alcohols, phenols, and amines 182. The physical and chemical properties of cadmium oxide nanoparticles are relative to its stoichiometry as well as particle size, shape which depend on its preparation methods, and condition 183. Cadmium oxide nanoparticles have been synthesized by several physicochemical methods including, sol-gel method 184, thermal evaporation 171, chemical bath deposition 185, vapour transport 186, solid-vapour deposition 187, precipitation method 188, photosynthesis using flowers extract 189, solvothermal method 19, mechanochemical reaction 191, solid state synthesis 192, microemulsion method 18, sonochemical 193, and hydrothermal method 194. The physical and chemical properties of cadmium oxide nanomaterials were improved by modifying the synthesis methods 195. Hydrothermal method can be a beneficial 54
20 technique to prepare various nanostructures among the other methods so that more researchers prefer it 196. Cadmium oxide nanoparticles has not only unique optical, and optoelectrical characteristics but also has the selective catalytic properties that can be used for photodegradation some of the organic compounds, dyes, pigments, and many of environmental pollutants 197. So in order to remove such dyes, environmental pollutants, and to bring organic transformations using CdO nanoparticles, we synthesize the CdO nanoparticles, and Cs doped CdO nanoparticles by hydrothermal method. The metal doped CdO nanoparticles have large grain size as compared to undoped CdO nanoparticles 198. Therefore, the catalytic activity of the CdO nanoparticles was improved by doping the cesium ion into it. Keeping above aspects in view, we report in this section the synthesis of CdO and Cs doped CdO fine nanostructured photocatalyst. The composition and crystallinity of these materials have been determined by using different analytical techniques including, UV-DRS, PL, FT-IR, XRD, SEM, EDAX, TEM, SAED, TGA, and BET surface area measurements technique. 2.2B. Experimental: All chemicals used were of analytical grade and used without further purification. The starting materials cadmium chloride (Sigma Aldrich, 99.9 %), triton X-1 (Qualigens, 99. %), methanol (Loba Chemie, 99.5 %), cesium nitrate (Sigma Aldrich, 99.9 %), and sodium hydroxide (Sigma Aldrich, 98.5 %) were used for the synthesis of CdO and Cs doped CdO nanoparticles B. Synthesis of CdO nanoparticles: A triton X-1 as a capping agent (.5 mol) was added to a magnetically stirred methanolic solution of cadmium chloride (1. mol) at room temperature then 55
21 the reaction mixture was stirred well over 2 mins. The aqueous solution of sodium hydroxide (1. N) was added slowly and stirred until solution becomes alkaline. The complex formation was obtained as a precipitate and it was stirred for another 2 hrs at room temperature. The white solid product obtained was filtered, washed thoroughly with distilled water for the complete removal of chloride, hydroxide ion, and to remove the soluble impurities. The precipitate was dried in oven at 11 o C for 2 hrs, and ground mechanically to fine powder. The resulting dry powder was calcinized at 4 o C for 4 hrs at the rate of 2 o C per minute. These calcinized cadmium oxide (CdO) nanoparticles are used for characterization B. Synthesis of Cs doped CdO nanoparticles: The synthesized cadmium oxide (CdO) nanoparticles were used as precursor material, and cesium nitrate [Cs (NO 3 ) 2 ] as dopant for the synthesis of Cs doped CdO nanoparticles. Initially cadmium oxide (1. mol) nanoparticles were mixed with 3 %, and 7 % cesium nitrate solution along with sodium hydroxide solution (1. N, 1 ml). The slurry obtained was stirred well, and transferred into Teflon autoclave, and kept in oven at 11 o C for 2 hrs. The precipitate obtained was vacuum filtered, washed with distilled water for the removal of soluble impurities, and dried at 11 o C for 2 hrs. These samples were calcinized at 4 o C for 2 hrs. These calcinized 3 %, and 7 % Cs doped cadmium oxide are used for further characterization. 2.3B. Results and Discussion: 2.3.1B. UV-DRS analysis: The UV-visible diffused reflectance spectra of the nanocrystalline CdO, 3 %, and 7 % Cs doped CdO nanoparticles are shown in Fig The spectra show broad bands at 34, 346, and 353 nm for CdO, 3 %, and 7 % Cs doped CdO nanoparticles respectively. The blue shift observed as compared to bulk CdO is due to quantum 56
22 confinement effects. With increase in the amount of the dopant, the band position shifted to higher wavelength side. The band gap energies of the synthesized CdO, 3 %, and 7 % Cs doped CdO nanoparticles are 3.64, 3.58, and 3.52 ev respectively. The shifting of band is arising due to doping effect on band gap of CdO semiconducting nanoparticles B. FT-IR analysis: Figure 2.11 depicts FT-IR spectra for the synthesized CdO, 3 %, and 7 % Cs doped CdO nanoparticles in KBr matrix. The absorption bands at 3523 cm -1 are attributed to the stretching vibration of the OH group due to small amount of water adsorbed on the surface of CdO nanoparticles 16. The strong broad absorption band at about 148 cm -1 is due to the asymmetric stretching vibrations of water molecule 192. The broad absorption band at 858 cm -1 shows presence of Cd-O bond 199. The FT-IR spectra shows absorption band at 51 cm -l also confirms the presence of Cd-O bond 2 and frequency at 1 cm -1 due to oxygen stretching. The absorption band at 51 cm -1 becomes broad due to the presence of cesium ion in CdO nanoparticles B. X-ray diffraction (XRD) analysis: Figure 2.12 shows XRD pattern of synthesized CdO, 3 %, and 7 % Cs doped CdO nanoparticles. The diffraction peaks indicate the nanocrystalline nature of synthesized materials, and peaks at 2θ values of 15.4, 17.2, 29.4, 31.6, 35.8, 38.7, 39.5, and 43.6 corresponds to the reflection from 111, 2, 311, 222, 4, 331, 42, and 422 crystal planes. The XRD pattern is in agreement with cubic structure of CdO nanoparticles (JCPDS card no ) indicated the formation of cadmium oxide phase. Sharp diffraction peak indicates good crystallinity of CdO nanoparticles and all XRD patterns show obvious size broadening effects, due to small crystallite size. It can be found that cesium doping do not change crystalline structure of CdO 57
23 nanocrystals. The average particle size was calculated using Debye-Scherrer s equation 162. The XRD data shows that the particle size is found to be 47 nm for CdO, 44 nm for 3 % Cs doped CdO, and 7 % Cs doped CdO have 41 nm. It shows that the crystalline size of CdO nanoparticles decreases due to presence of cesium dopant. In comparison with pure CdO nanoparticles the cesium encapsulated CdO have relatively small particle size indicating that the doping can improve the morphology and retard the grain growth of CdO nanoparticles B. SEM and EDAX analysis: The SEM images along with EDAX of synthesized CdO, 3 %, and 7 % Cs doped CdO samples are presented by Fig The morphology of the CdO nanoparticles is cubic in nature with agglomerates while 3 % and 7 % Cs doped CdO nanoparticles shows rod like structure along with cubic morphology. The average particle size varies in the range of 47 to 41 nm as measured using the XRD patterns. Strong peaks of Cd and O are found in the EDAX spectrum and also definite amount of cesium indicate that cesium ion has doped into CdO nanoparticles. The EDAX spectrum shows that 2.98 % and 6.93 % of cesium ion is present in the Cs doped CdO nanoparticles which indicate the doping of cesium ion into the nanocrystalline CdO material. The slight decrease in the amount of cesium in Cs doped CdO nanoparticles are due to the washing B. TEM and SAED analysis: The size and morphological information of the sample was investigated by TEM and SAED analysis and are depicted in Fig The TEM image of CdO nanoparticles shows the cubic structure, while 3 % or 7 % Cs doped CdO nanoparticles shows rod like structure along with cubic morphology. Moreover, the particle size of the synthesized CdO nanoparticles obtained from TEM analysis is 58
24 Fig. 2.1: UV-DRS spectra of synthesized CdO, 3 %, and 7 % Cs doped CdO Fig. 2.11: FT-IR spectra of synthesized CdO, 3 %, and 7 % Cs doped CdO Fig. 2.12: XRD pattern of synthesized CdO, 3 %, and 7 % Cs doped CdO 59

 3 % Cs")

25 (a) (b) Fig. 2.13: SEM and EDAX of a) synthesized CdO, b) 3 % Cs doped CdO, and c) 7 % Cs doped CdO (c) 6
26 similar to those estimated from Debye-Scherrer equation 162 and in the range of 47 to 41 nm. The dark spot in the TEM micrograph can be alluded to the synthesized CdO, 3 %, and 7 % Cs doped CdO nanoparticles as SAED pattern associated with such spots reveals the occurrence of CdO, 3 %, and 7 % Cs doped CdO nanoparticles in total agreement with the XRD data. The SAED pattern of CdO, 3 %, and 7 % Cs doped CdO nanoparticles shows similar d-values as obtained from XRD data B. Thermogravimetric analysis (TGA): Figure 2.15 illustrates the curve of thermogravimetric analysis of the CdO nanoparticles. TGA curve shows the decomposition of CdO nanoparticles is performed in a two step pattern of the weight loss. The first weight loss of % is observed in the range of temperature between o C, which can be related to decomposition of adsorbed water molecules. The second weight loss of % is observed in the temperature range o C can be associated with decomposition of the organic contents in the precursor. It was found that the weight loss terminates at 4 C and stable in 4-5 o C, so this temperature was determined as the calcinations temperature of the intermediate molecules and reaching the CdO phase B. Photoluminescence analysis (PL): The photoluminescence spectrum of the CdO nanoparticles shows blue shift in relation to the bulk, and the band gap (bulk CdO, 538 nm) is shown by Fig The emission wavelength of the CdO nanoparticles is at ~563 nm (E= 2.2 ev), dependent on the particles size (quantum size effect) which is the band edge or near band edge emission, and considered due to transition between valence and the conduction bands. The relatively large width of the emission band of the CdO nanoparticles is due to the broad distribution of intra-band states associated with different trapping sites. The 61


27 (a) (b) Fig. 2.14: TEM and SAED of a) synthesized CdO, b) 3 % Cs doped CdO, and c) 7 % Cs doped CdO (c) 62
28 blue shift in the excitation absorption reflects the correspondingly gradual removal of the initial trap, and surface states during the crystallization process of nanoparticles. By controlling the morphology, the optical property of CdO nanostructures can be tunable which will be useful for the photodegradation applications B. BET surface area analysis: The BET surface area measurement curves for synthesized CdO, 3 %, and 7 % Cs doped CdO nanoparticles are shown in Fig The N 2 adsorption-desorption isotherms and BJH pore size distribution of CdO nanoparticles reveals that the sample have typical IV N 2 adsorption-desorption isotherms with H 1 hysteresis. All the samples have a narrow pore diameter range. Based on the N 2 adsorption-desorption isotherms the specific surface area (S BET ) of CdO nanoparticles is m 2 /g, the average pore volume (V P ) and pore diameter (dp) were.463 cc/g, and A o respectively. In 3 %, and 7 % Cs doped CdO nanoparticles the specific surface area (S BET ) obtained from BET method is m 2 /g, and m 2 /g, the average pore volume (V P ), and pore diameter (dp) were.4832 cc/g,.5769 cc/g, 3.92 A o, and 31.9 A o respectively. The modified (Cs-doped) CdO nanoparticles have large surface area, average pore volume and pore diameter than pure CdO nanoparticles. 63

29 Intensity Fig. 2.15: TGA curve of synthesized CdO nanoparticles Wavelength (nm) Fig. 2.16: PL spectrum of synthesized CdO nanoparticles 64
30 Volume (cc/gm) Dv (logd)[m 2 /gm] Volume (cc/gm) Dv(logd)[m 2 /gm] Volume (cc/gm) Dv(logd)[m 2 /gm] Relative pressure (P/Po) Pore diameter (A ) (a) Relative pressure (P/Po) Pore diameter (A ) (b) Relative pressure (P/Po) Pore diameter (A ) (c) Fig. 2.17: BET surface area, and pore size of a) synthesized CdO, b) 3 % Cs doped CdO, and c) 7 % Cs doped CdO 65
31 Section-C Synthesis and Characterization of Semiconducting PbS and Co Doped PbS Nanoparticles 2.1C. Introduction: Nanocrystals of inorganic semiconductors are well suited for the development of novel optoelectronic devices due to their flexibility and simple processability combined with optical properties. Nanocrystals exhibit photoluminescence with high quantum efficiencies and emission as well as the absorption is strongly size tunable due to their strong quantum confinement 21. The lead sulphide (PbS) nanoparticles is an IV-VI group semiconductor materials with direct narrow band gap of.41 ev at room temperature 22, a large excitation Bohr radius of 18 nm 23, high dielectric constant (18) 24, and very high carrier mobility (.44 cm 2 /V/s) 25. There is a broad spectrum of sulphide materials used in semiconductor material science and technology 26. Among the inorganic nanoparticles lead sulphide (PbS) semiconducting nanoparticles have received great attention because of their potential uses as photonic material, and Pb +2 ion selective sensors 27. Due to its optical and electronic properties it used in photography 28, IR detector 29, and solar absorption 21. The PbS nanoparticles have non linear optical properties therefore have extensive applications in optical device like optical switch 211. A lead sulphide nanomaterial has promising photosensitive properties and act as a good photocatalyst 212. Lead sulphide nanoparticles have unique photoconductive properties therefore it is used in mid infrared lasers 213, photoresistants, humidity and temperature sensors, decorative and solar control coatings, and diode lasers 214. The lead sulphide nanoparticles have 66
32 diverse applications including telecommunications 215, and microscopic imaging in the biological transparency window 216. Oleic acid capped PbS nanoparticles has antiwear, friction-reduction properties, and used as an additive in liquid paraffin 217. Lead sulphide detectors have great demand as sensors for military systems, industrial, commercial, and medical applications 218. Lead sulphide (PbS) nanoparticles can show multiple exciton generation (MEG) in which the impact of single photon produces two or more excitons 219, these phenomenon has raised photo conversion efficiency of the material 22. The size, shape, capping material, and surface characteristics have a strong influence on the optical properties of PbS nanocrystals. The large ratio of surface to volume in semiconductor nanoparticles results in strong influence of the surface states on their optical properties 221. Lead sulphide (PbS) nanoparticles have been synthesized by several physico-chemical methods including solvothermal 222, electron beam irradiation 223, sonochemical 224, solid state reaction 225, microemulsion 226, chemical precipitation 227, sol-gel process 228, chemical co-deposition 217 precursor, and dual source method 229, chemical method 23, chemical bath deposition 231, hydrothermal method 232, and gas phase synthesis 233. Chalcogenides of cadmium, lead, and zinc have proved their potential as efficient absorbers of electromagnetic radiation 234. In order to achieve more efficient lead sulphide (PbS) nanoparticles, they were synthesized by hydrothermal method. The modified nanoparticles have shown high absorption of visible light, and good electron transfer properties 235, therefore cobalt doped lead sulphide nanoparticles was also synthesized. The goal of this study is to investigate the effect of cobalt ion doping on the catalytic activity of lead sulphide nanoparticles. The synthesized PbS, and cobalt doped PbS nanoparticles was characterized by using different analytical 67
33 techniques like UV-DRS, PL, FT-IR, XRD, SEM, EDAX, TEM, SAED, TGA, ESR, and BET surface area measurements. 2.2C. Experimental: The starting materials lead nitrate (Sigma Aldrich, 99. %), triton X-1 (Qualigens, 99. %), sodium sulphide (Loba Chemie, 6. %), cobalt nitrate (Loba Chemie, 99. %), and sodium hydroxide (Sigma Aldrich, 98.5 %) were used for the synthesis of PbS and Co doped PbS nanoparticles C. Synthesis of PbS nanoparticles: A triton X-1 as a capping agent (.5 mol) was added to a magnetically stirred solution of lead nitrate (1. mol) at room temperature. The solution of sodium sulphide (1. mol) was added in the reaction mixture and reaction mixture was homogenized by stirring over 2 mins at room temperature. The aqueous solution of sodium hydroxide (1. N) was added slowly in above solution and stirred until solution becomes alkaline. The complex formation was obtained as a precipitate and it was stirred for further 2 hrs at room temperature. The white solid product obtained was filtered, washed thoroughly with distilled water for the complete removal of nitrate, hydroxide ion, and to remove the soluble impurities. The precipitate was dried in oven at 12 o C for 2 hrs and ground mechanically to fine powder. The resulting dry powder was calcinized at 5 o C for 4 hrs at the rate of 2 o C per minute C. Synthesis of Co doped PbS nanoparticles: The synthesized lead sulphide (PbS) nanoparticles were used as precursor material and cobalt nitrate as dopant. An initially lead sulphide nanoparticle (1. mol) was mixed with 5 % and 1 % cobalt nitrate solution along with sodium hydroxide solution (1. N, 1 ml). The slurry obtained was stirred well and transferred into teflon autoclave and kept in oven at 11 o C for 2 hrs. The precipitate obtained was 68
34 filtered, washed with distilled water for the removal of soluble impurities, and dried at 12 o C for 2 hrs. These samples were calcinized at 5 o C for 2 hrs. The calcinized 5 %, and 1 % Co doped PbS nanoparticles are used for characterization. 2.3C. Results and Discussion: 2.3.1C. UV-DRS analysis: The UV-DRS of the nanocrystalline PbS, 5 %, and 1 % Co doped PbS nanoparticles is shown in Fig The spectra show broad band at 295, 298, and 34 nm for PbS, 5 %, and 1 % Co doped PbS nanoparticles respectively. With increase in the amount of dopant the band position shifted to higher wavelength side. From these the band gap energy of the synthesized PbS, 5 %, and 1 % Co doped PbS nanoparticles are 4.2, 4.16, and 4.7 ev respectively. The shifting of band arises due to doping effect on band gap of lead sulphide (PbS) semiconducting nanoparticles. The band gap of PbS nanoparticles can be significantly blue shifted from the near infra red to the near ultraviolet region with decreasing particle size compared to bulk counterpart C. FT-IR analysis: The FT-IR spectra for the synthesized PbS, 5 %, and 1 % Co doped PbS nanoparticles in KBr matrix is shown in Fig The absorption band at cm -1 are attributed to the stretching vibration of the OH group due to small amount of water adsorbed on the surface of PbS nanoparticles 16. The absorption band at about cm -1 is due to the CH 2 vibration. The absorption band at 48.29, , , and cm -1 showed characteristic frequency of Pb-S bond and bands at around and cm -1 are broadened due to encapsulation of cobalt ion into the PbS nanoparticles. The band at cm -1 becomes more pronounced in Co 69
35 doped PbS nanoparticles, and the broad nature of band increases with increase in amount of cobalt ion C. X-ray diffraction (XRD) analysis: Figure 2.2 shows the XRD patterns of synthesized PbS with various Co 2+ doping. The diffraction peaks indicate the nanocrystalline nature of synthesized materials. It shows peaks at an angle 28.5, 32.7, 48.2, 52.6, 58.7, and 67.4 corresponds to the reflection from 111, 2, 22, 311, 222, and 4 crystal planes respectively. The XRD pattern is in agreement with the cubic structure of lead sulphide sample (JCPDS Card No ) with space group Fm3m (225). Sharp diffraction peak indicates good crystallinity of PbS nanoparticles. The XRD pattern of 5 % and 1 % Co doped PbS sample is almost coincide with that of pure PbS also showing no significant diffraction peaks due to encapsulation of cobalt ion. It indicates that cobalt is present in ionic state bonded with sulphur of the PbS inside the frame work. The average particle size was calculated using Debye-Scherrer s equation 162, and particle size obtained for PbS is 31 nm, 5 % Co doped PbS nanoparticles is 29 nm, and 1% Co doped PbS nanoparticles is 26 nm. In comparison with pure PbS nanoparticles the Co encapsulated PbS nanoparticles has relatively small particle size indicating that the doping can improve the morphology, and retard the grain growth of PbS nanoparticles. This may be due to the fact that dopant ion inhibits crystal growth and sintering between grains during the heat treatment Pb +2 atoms in crystal lattice is replaced by Co +2 ion. Transition metal ion (cobalt) encapsulation enhances the interfacial charge transfer reaction of PbS nanoparticles and decreases the crystallite size of lead sulphide (PbS) nanoparticles. 7
36 Reflectance % Co-PbS 5% Co-PbS PbS Wavelength (nm) Fig. 2.18: UV-DRS spectra of synthesized PbS, and (5 %, and 1 %) Co doped PbS Fig. 2.19: FT-IR spectra of synthesized PbS, and (5 %, and 1 %) Co doped PbS Fig. 2.2: XRD pattern of synthesized PbS, and (5 %, and 1 %) Co doped PbS 71
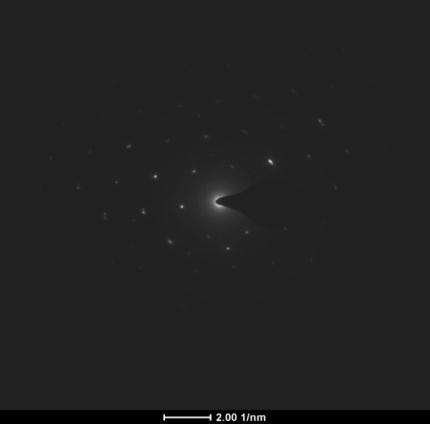
37 2.3.4C. SEM and EDAX analysis: The SEM images of synthesized PbS, 5 %, and 1 % Co doped PbS nanoparticles are shown by Fig The SEM image of synthesized PbS nanoparticles shows dumbell shaped morphology. The SEM images of 5 % Co doped PbS nanoparticles shows rod like structure and the SEM image of 1 % Co doped PbS nanoparticles shows agglomerates. However, the size of the particles varies in the range of 31 to 26 nm, which is similar to values obtained by XRD data. The EDAX analysis of synthesized PbS, 5 %, and 1 % Co doped PbS nanoparticles are shown in Fig Strong peak of Pb and S are found in the EDAX spectrum and amount of cobalt indicate that cobalt ion has doped into PbS nanocrystallites. The spectrum indicates that 4.95 %, and 9.98 % of cobalt ion is present in the doped PbS nanoparticles. The slight decrease in the amount of cobalt is due to the leaching of unbound cobalt ion during the washing C. TEM and SAED analysis: The size and morphological information of the sample was further investigated by TEM, SAED analysis, and are depicted in Fig The TEM image of PbS, 5 %, and 1 % Co doped PbS nanoparticles shows cubic structure along with agglomerates. Moreover, the particle size of the sample obtained from TEM analysis is comparable to those estimated from Debye-Scherrer equation 162 and in the range of 31 to 26 nm. The dark spot in the TEM micrograph can be alluded to the synthesized PbS, 5 %, and 1 % Co doped PbS nanoparticles as SAED pattern associated with such spots reveals the occurrence of PbS, 5 %, and 1 % Co doped PbS nanoparticles, and is in total agreement with the XRD data. The SAED pattern of PbS, 5 %, and 1 % Co doped PbS nanoparticles shows similar d-values as obtained by XRD data. 72


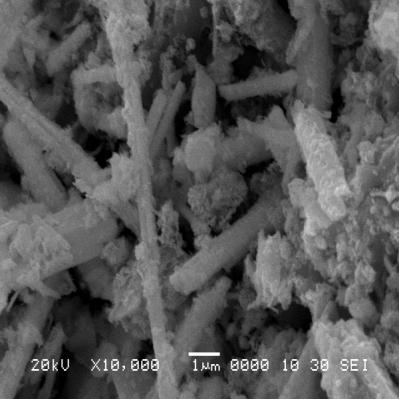
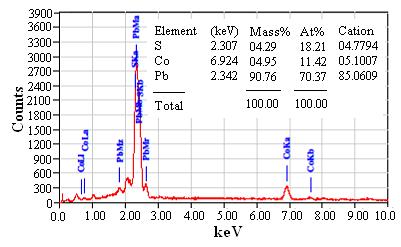
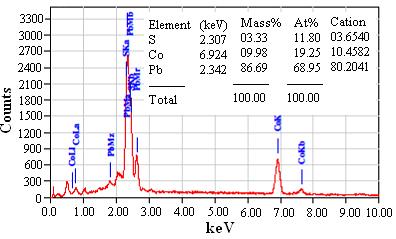
38 (a) (b) Fig. 2.21: SEM and EDAX of a) synthesized PbS, b) 5 % Co doped PbS, and c) 1 % Co doped PbS (c) 73
39 2.3.6C. Thermogravimetric analysis (TGA): Figure 2.23 illustrates the curve for thermogravimetric analysis of the PbS nanoparticles. According to this curve the weight loss of 1.15 % is observed in the range of temperature between -45 o C, which can be related to decomposition of adsorbed water molecules, and decomposition of the organic contents in the precursor. It was found that the weight loss terminates at 45 o C, so this temperature was determined as the calcination temperature of the intermediate molecules, and reaching the PbS phase. The PbS nanoparticles are stable within the 45 o C to 65 o C temperature region bcause it shows steady nature C. Electron spin resonance (ESR) analysis: Interaction of the cobalt ion, and the host PbS semiconducting nanoparticles studied by ESR spectrum and represented in Fig This technique has been used to characterize the environment of the paramagnetic species in host lattice of different species 163. The ESR signal of 5 % Co doped PbS nanoparticles was recorded at room temperature. The ESR spectrum indicates that the doping of transition metal (cobalt) is homogeneous, and there is no secondary phase present. The ESR signal also shows that the effective g factor is greater than 2 (2.224) indicates a clear evidence of ferromagnetism in this synthesized materials. This g value also used to determine the number of unpaired electrons in the molecule C. Photoluminescence analysis (PL): The PL property of PbS nanoparticles is measured at room temperature, and obtained PL spectrum is shown in Fig The emission wavelength of the PbS nanoparticles is at 476 nm (E = 2.6 ev), and 52 nm (E = 2.47 ev), this confirms the quantum size effect, strong confinement compared with bulk PbS, and due to the 74


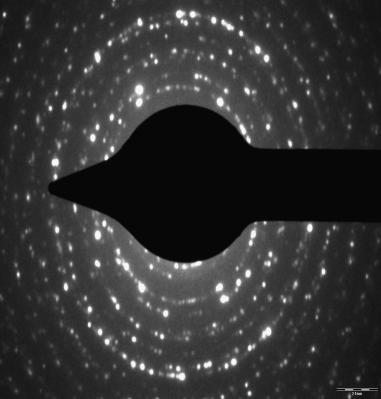
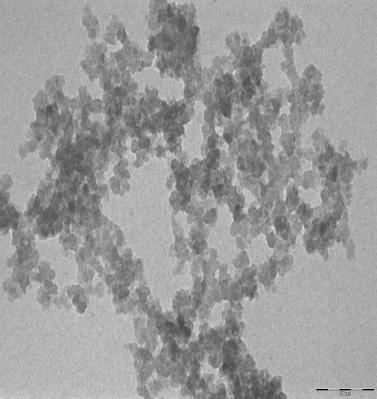
40 (a) (b) Fig. 2.22: TEM and SAED of a) synthesized PbS, b) 5 % Co doped PbS, and c) 1 % Co doped PbS (c) 75
41 transitions from the conduction band to interstitial sulphur or lead vacancies and from these vacancies to valence band. However, it should be pointed out that the photoluminescence peak observed in this work is relatively broad indicating in order to achieve semiconductor nanoparticles with a narrow size distribution. The relatively large width of the emission band of the PbS nanoparticles is due to the broad distribution of intra-band states associated with different trapping sites C. BET surface area analysis: The BET surface area measurement curve of synthesized PbS, 5 %, and 1 % Co doped PbS nanoparticles is shown by Fig It shows that all the sample have a narrow pore diameter range. Based on the N 2 adsorption-desorption isotherms, the specific surface area (S BET ) of PbS, 5 %, and 1 % Co doped PbS nanoparticles are m 2 /g, m 2 /g, and 42.8 m 2 /g. The average pore volumes (V P ) were.2649 cc/g,.5631 cc/g and.7414 cc/g for PbS, 5 %, and 1 % Co doped PbS nanoparticles. The pore diameter (dp) were 24.8 A o, A o, and 38.7 A o for PbS, 5 %, and 1 % Co doped PbS nanoparticles. The surface area, average pore volume, and pore diameter of synthesized Co doped PbS nanoparticles increases with increase in amount of cobalt ions. 76

42 Intensity Fig. 2.23: TGA curve of synthesized PbS nanoparticles Fig. 2.24: ESR spectra of PbS, and 5 % Co doped PbS nanoparticles Wavelength (nm) Fig. 2.25: Photoluminescence spectrum of synthesized PbS nanoparticles 77
43 Volume (cc/gm) Dv(logd)[m 2 /gm] Volume (cc/gm) Dv(logd)[m 2 /gm] Volume (cc/gm) Dv(logd)[m 2 /gm] Relative presure (P/Po) Pore diameter (A ) (a) Relative pressure (P/Po) Pore diameter (A ) (b) Relative pressure (P/Po) Pore diameter (A ) (c) Fig. 2.26: BET surface area, and pore size of a) synthesized PbS, b) 5 % Co doped PbS, and c) 1 % Co doped PbS 78
44 Section-D Synthesis and Characterization of Semiconducting ZnS and Sm Doped ZnS Nanoparticles 2.1D. Introduction: The optical properties of II-VI sulphide semiconductor nanomaterial have been studied due to their wide application in electroluminescence devices, light emitting devices, bioimaging technologies, sensors, biological sensors, catalysis, and solar energy cells 236, 237 because of their unique size dependent electronic, magnetic, optical, and electrochemical properties. Zinc sulphide (ZnS) semiconducting nanoparticles with zinc blende and wurtzite crystal structure having band gap energies of 3.68 and 3.8 ev at room temperature respectively therefore, widely used in electroluminescence, photoluminescence, and cathodoluminescence devices 238. The zinc sulphide nanoparticles exhibit size dependent properties such as tuning of band gap with particle size a blue shift of absorption and an enhancement of photocatalytic activities with decreasing crystallite size which arises due to large number of surface atoms, and three dimension confinement of electrons 239. The ZnS nanoparticles also used in photovoltaic devices, transducers optical coating, field effect transistors, flat panel displays, solar cells, and field emission devices 24. Luminescent properties of semiconductor nanoparticles have been applied in different field including luminescence tagging, light emitting devices, cellular imaging, immunoassay, and drug delivery 241. The semiconducting nanoparticles used in chemical or electrochemical reaction due to its chemiluminescence property which combines chemical reaction with electromagnetic reaction 242. The nanoparticles are used as active catalyst for catalyzing the gas phase chemiluminescence 243. In zinc 79
45 sulphide nanoparticles the photoluminescence phenomenon produced by photoexcitation, electroluminescence, and cathodoluminescence 244. The enhanced properties of zinc sulphide nanoparticles used in chemical industry, semiconductor technology, environment protection, and medicine 245. The excitonic Bohr radius of zinc sulphide (ZnS) nanoparticles is 2.5 nm 246, it is used in small biomolecular probes for fluorescence, and laser scanning microscopy. The number of surface atom increases as the materials becomes smaller, and its surface energy increases. The increased surface energy and quantum confinement effect have a tremendous effect on the absorption spectra, and photo luminescence property. The metal doped ZnS have very high quantum efficiency with luminescence decay faster than in the bulk crystals, it is used in biolabeling due to its long luminescence life time 247 and field emission devices 248. The doped ion act as recombination centers for the excited electron hole pairs and result in different optical properties therefore have application in photoluminescence, and electroluminescence fields 249. The metal doped ZnS nanoparticles are efficient light-emitting material 25 and exhibit interesting magneto-optical properties 251. The metal doped ZnS nanoparticles give the luminescence in various regions as well as improve the properties of ZnS nanoparticles 252. The surface modified ZnS nanoparticles have antiwear ability, and used as an additive in liquid paraffin 253. The size, shape, capping material and surface characteristics have a strong influence on the optical properties of the nanocrystals. Zinc sulphide (ZnS) nanoparticles have been synthesized by several physicochemical methods including, hydrothermal 254, gamma irradiation 255, solvothermal 256, microwave 257, sonochemical 258, micro-emulsion 259, mechano-chemical 237, sol-gel method 246, reverse 8
46 micelle method 26, solid state reaction 261, solid-liquid chemical reaction 262, sputtering 263, co-evaporation 264, and wet chemical method 265. In order to achieve more efficient zinc sulphide (ZnS) nanoparticles, it was synthesized by hydrothermal method. Samarium doped zinc sulphide (ZnS) nanoparticles were also synthesized to extend the light absorption spectrum of zinc sulphide nanoparticles towards the visible region. The goal of this study is to investigate the effect of samarium ion doping on the catalytic activity of zinc sulphide (ZnS) nanoparticles. The synthesized ZnS and Sm doped ZnS nanoparticles are characterized by analytical techniques like UV-DRS, photoluminescence spectroscopy (PL), FT-IR, XRD, SEM, EDAX, TEM, SAED, TGA, ESR, and BET surface area measurements. 2.2D. Experimental: All reagents used in experiments are of analytical grade and used without further purification. The starting materials zinc nitrate (Sigma Aldrich, 99. %), sodium dodecyl sulphate (Loba Chemie, 99.5 %), sodium sulphide (Loba Chemie, 99. %), samarium nitrate (Sigma Aldrich, 99.9 %), and sodium hydroxide (Sigma Aldrich, 98.5 %) were used for the synthesis of ZnS and Sm doped ZnS nanoparticles D. Synthesis of ZnS nanoparticles: A sodium dodecyl sulphate as a capping agent (.2 mol) was added to a magnetically stirred solution of zinc nitrate (1. mol) at room temperature. The solution of sodium sulphide (1. mol) was drop wise added in the reaction mixture, and reaction mixture was homogenized by stirring over 2 mins at room temperature. The aqueous solution of sodium hydroxide (1. N) was added slowly and stirred until solution becomes alkaline. The complex formation was obtained as a precipitate and it was stirred for 5 hrs at room temperature. The white solid precipitate obtained was 81
47 filtered, washed thoroughly with distilled water for the complete removal of nitrate, hydroxide ion, and to remove the soluble impurities. The precipitate was dried in oven at 12 o C for further 2 hrs and ground mechanically to fine powder. The resulting dry powder was calcinized at 4 o C for 2 hrs at the rate of 2 o C per mins and the calcinized sample used for characterization D. Synthesis of Sm doped ZnS nanoparticles: Above prepared ZnS nanoparticles were used as precursor material and samarium nitrate as dopant. Initially zinc sulphide nanoparticles (1. mol) were mixed with 3 % and 7 % samarium nitrate solution along with sodium hydroxide solution (1N, 1 ml). The slurry obtained was stirred well, transferred into teflon autoclave and kept in an oven at 12 o C for 2 hrs. The precipitate obtained was vacuum filtered, washed with deionized water for the removal of soluble impurities, and dried at 12 o C for 2 hrs. The prepared powders were calcinized at 4 o C for 2 hrs. These calcinized 3 % and 7 % Sm doped zinc sulphide are used for characterization. 2.3D. Results and Discussion: 2.3.1D. UV-DRS analysis: Figure 2.27 shows the room temperature reflectance spectra for ZnS, 3 %, and 7% Sm doped ZnS nanoparticles. The UV-DRS of ZnS, and modified ZnS has absorption edge cut-off at 34, 311, and 318 nm with corresponding band gap 4.7, 3.98, and 3.89 ev respectively. The absorption edge shifted towards the longer wavelength side in Sm doped ZnS nanoparticles. The results obtained shows that after the encapsulation of Sm ion in synthesized ZnS nanoparticles, the absorption goes in the visible region in comparison with undoped ZnS nanoparticles. It means that the doped metal sulphide nanoparticles are sensitive to visible light. The shifting of band is arises due to doping effect on band gaps of ZnS semiconducting nanoparticles and 82
48 fundamental absorption corresponds to the transmission from valence band to conduction band. The band gap of ZnS nanoparticles can be significantly blue shifted with increasing the content of Sm ion, and decreasing particle size compared to bulk counterpart. Transition metal ion encapsulation enhances the interfacial charge transfer reaction of zinc sulphide, and decrease the crystallite size of zinc sulphide nanoparticles D. FT-IR analysis: IR spectroscopy was used to confirm the formation of the crystalline material. Figure 2.28 represents the FT-IR spectra for the synthesized ZnS, 3 %, and 7 % Sm doped ZnS nanoparticles in KBr matrix. The absorption band at 3421 cm -1 is attributed to the stretching vibration of the OH group due to small amount of water adsorbed on the surface of ZnS nanoparticles. The absorption band at about 1627 cm -1 is due to the bending vibration of OH group. The absorption band at 42, 96, and 1118 cm -1 are associated with Zn-S bond D. X-ray diffraction (XRD) analysis: The powder X-ray diffraction patterns of synthesized ZnS, 3 %, and 7 % Sm doped ZnS nanoparticles are shown in Fig The diffraction peaks indicate the nanocrystalline nature of synthesized materials. It shows peak at an angle 12.2, 21.4, 32.3, 33.5, 35.4, and 47.6 corresponds to the reflection from 1, 11, 23, 21, 15, and 215 crystal planes respectively. The XRD pattern is in good agreement with the hexagonal wurtzite structure of zinc sulphide sample (JCPDS Card No ) with a space group P6 3 mc (186), which show obvious size broadening effects, indicating the finite size of the nanoparticles. The XRD pattern of 3 %, and 7 % Sm doped ZnS sample is almost coincide with that of pure ZnS also showing no significant diffraction peaks due to encapsulation of samarium ion. It indicates that samarium is 83
49 Fig. 2.27: UV-DRS spectra of synthesized ZnS, and (3 %, and 7 %) Sm doped ZnS Fig. 2.28: FT-IR spectra of synthesized ZnS, and (3 %, and 7 %) Sm doped ZnS Fig. 2.29: XRD pattern of synthesized ZnS, and (3 %, and 7 %) Sm doped ZnS 84
50 present in ionic state bonded with sulphur of the ZnS inside the frame work. The average particle size was calculated using Debye-Scherrer s equation 162. The particle size of ZnS is 2 nm, 18 nm for 3 % Sm, and 16 nm for 7 % Sm doped ZnS nanoparticles. It clearly reveals that the crystallite size of ZnS decreases in presence of samarium dopant and this method produce the fine particles. In comparison with pure ZnS nanoparticles the Sm encapsulated ZnS nanoparticles have relatively small crystallite size, indicating that the doping can improve the morphology, and retard the grain growth of ZnS nanoparticles. This may be due to the fact that dopant ion inhibits crystal growth, and sintering between grains during heat treatment during the heat treatment Zn +2 atoms in crystal lattice is replaced by Sm +3 ion. The XRD pattern gives sharper diffraction peaks indicating that it has a better crystallinity of synthesized ZnS and Sm doped ZnS nanoparticles D. SEM and EDAX analysis: The SEM images of synthesized ZnS and modified ZnS nanoparticles are shown by Fig The SEM image of synthesized ZnS semiconducting nanoparticles shows hexagonal structure morphology. The SEM image of 3 % and 7 % Sm doped ZnS nanoparticles shows hexagonal morphology and are agglomerates in nature. However, the size of the particles varies in the range of 2 to 16 nm, which is similar to values obtained by X-ray diffraction data. The EDAX analysis of synthesized ZnS, 3 %, and 7 % Sm doped ZnS materials shown by Fig Strong peaks of Zn and S in the EDAX spectrum shows that 2.88 % and 6.84 % of samarium ion is present in the Sm doped ZnS nanoparticles. 85

 3 % Sm")

51 (a) (b) Fig. 2.3: SEM and EDAX of a) synthesized ZnS, b) 3 % Sm doped ZnS, and c) 7 % Sm doped ZnS (c) 86
52 2.3.5D. TEM and SAED analysis: The morphology and structure was investigated by TEM. The image of pure ZnS, and Sm doped ZnS nanoparticles are depicted in Fig The average particle size of pure ZnS and Sm doped ZnS nanoparticles are in between 16 to 2 nm. The results obtained by TEM agree with XRD analysis. The SAED rings mainly indicate the polycrystalline nature of the synthesized ZnS and Sm doped ZnS nanoparticles D. Thermogravimetric analysis (TGA): Figure 2.32 illustrates the curve of thermogravimetric analysis of the ZnS nanoparticles. According to this curve, the decomposition of synthesized ZnS performed in a two step pattern. The first weight loss of 3.75 % is observed in the range of temperature between o C, which can be related to decomposition of adsorbed water molecules 266. The second weight loss of 3.75 % is observed in the temperature range o C can be attributed to decomposition of the organic contents in the precursor. It was found that the weight loss terminates at 28.3 o C, so this temperature was determined as the calcination temperature of the intermediate molecules. The ZnS nanoparticles are stable within the 28.3 o C to 54 o C temperature region D. Electron spin resonance (ESR) analysis: The ESR technique has been used to characterize the environment of the paramagnetic species. Interaction of the samarium ion the host ZnS semiconducting nanoparticles studied by ESR spectrum, and are shown by Fig The ESR signal of synthesized 3 % Sm doped ZnS nanoparticles were recorded at room temperature. The detail structural characterization indicates that the doping of rare earth metal (samarium) is homogeneous and there is no secondary phase present. The ESR signal also shows that the effective g factor greater than 2 (2.2) indicates a clear 87


53 (a) (b) Fig. 2.31: TEM and SAED of a) synthesized ZnS, b) 3 % Sm doped ZnS, and c) 7 % Sm doped ZnS (c) 88
A COMPARATIVE STUDY ON CHARACTERIZATION AND PHOTOCATALYTIC ACTIVITIES OF PbS AND Co DOPED PbS NANOPARTICLES
 Chalcogenide Letters Vol. 9, No. 7, July 2012, p. 299-306 A COMPARATIVE STUDY ON CHARACTERIZATION AND PHOTOCATALYTIC ACTIVITIES OF PbS AND Co DOPED PbS NANOPARTICLES A.V.BORHADE a*, B.K.UPHADE b a Department
CHAPTER 3. OPTICAL STUDIES ON SnS NANOPARTICLES
 42 CHAPTER 3 OPTICAL STUDIES ON SnS NANOPARTICLES 3.1 INTRODUCTION In recent years, considerable interest has been shown on semiconducting nanostructures owing to their enhanced optical and electrical
SYNTHESIS OF CADMIUM SULFIDE NANOSTRUCTURES BY NOVEL PRECURSOR
 Nanomaterials: Applications and Properties (NAP-2011). Vol. 1, Part I 107 SYNTHESIS OF CADMIUM SULFIDE NANOSTRUCTURES BY NOVEL PRECURSOR M. Salavati Niasari 1,2* 1 Department of Inorganic Chemistry, Faculty
The characterization of MnO nanostructures synthesized using the chemical bath deposition method
 The characterization of MnO nanostructures synthesized using the chemical bath deposition method LF Koao 1, F B Dejene 1* and HC Swart 2 1 Department of Physics, University of the Free State (Qwaqwa Campus),
Photocatalytic degradation of dyes over graphene-gold nanocomposites under visible light irradiation
 Photocatalytic degradation of dyes over graphene-gold nanocomposites under visible light irradiation Zhigang Xiong, Li Li Zhang, Jizhen Ma, X. S. Zhao* Department of Chemical and Biomolecular Engineering,
Synthesis and Study of Magnesium Oxide and Cadmium Doped Magnesium Oxide Nanoparticles
 Synthesis and Study of Magnesium Oxide and Cadmium Doped Magnesium Oxide Nanoparticles Prateek Kumar Gour 1, Sanchita Dass Roy 2 gourprateek0000@gmail.com Abstract Magnesium Oxide play a very important
Supporting Information. CdS/mesoporous ZnS core/shell particles for efficient and stable photocatalytic hydrogen evolution under visible light
 Electronic Supplementary Material (ESI) for Energy & Environmental Science. This journal is The Royal Society of Chemistry 2014 Supporting Information CdS/mesoporous ZnS core/shell particles for efficient
Hydrothermal synthesis and characterization of undoped and Eu doped ZnGa 2 O 4 nanoparticles
 Chapter 3 Hydrothermal synthesis and characterization of undoped and Eu doped ZnGa 2 O 4 nanoparticles 3.1 Introduction Phosphors are substance that exhibits the phenomenon of luminescence. Efficient phosphors
International Journal of Scientific & Engineering Research, Volume 5, Issue 3, March-2014 ISSN
 156 Copper Nanoparticles: Green Synthesis Characterization Y.Suresh*1, S.Annapurna*2, G.Bhikshamaiah*3, A.K.Singh#4 Abstract Present work describes the synthesis nanoparticles using papaya extract as a
Synthesis of nano-sized anatase TiO 2 with reactive {001} facets using lamellar protonated titanate as precursor
 Supporting Information Synthesis of nano-sized anatase TiO 2 with reactive {001} facets using lamellar protonated titanate as precursor Liuan Gu, Jingyu Wang *, Hao Cheng, Yunchen Du and Xijiang Han* Department
Adsorption of Methylene Blue on Mesoporous SBA 15 in Ethanol water Solution with Different Proportions
 2015 2 nd International Conference on Material Engineering and Application (ICMEA 2015) ISBN: 978-1-60595-323-6 Adsorption of Methylene Blue on Mesoporous SBA 15 in Ethanol water Solution with Different
CHAPTER IV SYNTHESIS AND CHARACTERIZATION OF METAL IONS DOPED ZINC SELENIDE NANOPARTICLES
 132 CHAPTER IV SYNTHESIS AND CHARACTERIZATION OF METAL IONS DOPED ZINC SELENIDE NANOPARTICLES 4.1 Introduction Introducing impurity atoms into a semiconductor host leads to an increase in the free-carrier
CHAPTER 4. SYNTHESIS, CHARACTERIZATION OF TiO 2 NANOTUBES AND THEIR APPLICATION IN DYE SENSITIZED SOLAR CELL
 93 CHAPTER 4 SYNTHESIS, CHARACTERIZATION OF TiO 2 NANOTUBES AND THEIR APPLICATION IN DYE SENSITIZED SOLAR CELL 4.1 INTRODUCTION TiO 2 -derived nanotubes are expected to be applicable for several applications,
Catalytic Decomposition of Formaldehyde on Nanometer Manganese Dioxide
 Modern Applied Science April, 29 Catalytic Decomposition of Formaldehyde on Nanometer Manganese Dioxide Xiujuan Chu & Hua Zhang (Corresponding author) Tianjin Municipal Key Lab of Fibres Modification and
PREPARATION AND CHARACTERIZATION OF CdO/PVP NANOPARTICLES BY PRECIPITATION METHOD
 Indian Journal of Pure and Applied Physics (IJPAP) Vol.1.No.1 2013 pp 1-6 available at: www.goniv.com Paper Received :05-03-2013 Paper Published:28-03-2013 Paper Reviewed by: 1. Dr.S.Selvakumar 2. Hendry
College of Mechanical Engineering, Yangzhou University, Yangzhou , China; 2
 Proceedings Light-Assisted Room-Temperature NO2 Sensors Based on Black Sheet-Like NiO Xin Geng 1,2,3, Driss Lahem 4, Chao Zhang 1, *, Marie-Georges Olivier 3 and Marc Debliquy 3 1 College of Mechanical
Supplementary Information for Self-assembled, monodispersed, flowerlike γ-alooh
 Supplementary Information for Self-assembled, monodispersed, flowerlike γ-alooh hierarchical superstructures for greatly fast removal of heavy metal ions with high efficiency Yong-Xing Zhang, a,b Yong
Supporting Information
 Supporting Information Dynamic Interaction between Methylammonium Lead Iodide and TiO 2 Nanocrystals Leads to Enhanced Photocatalytic H 2 Evolution from HI Splitting Xiaomei Wang,, Hong Wang,, Hefeng Zhang,,
PREPARATION, CHARACTERISATION AND PHOTOCATALYTIC ACTIVITY OF TERNARY GRAPHENE-Fe 3 O 4 :TiO 2 NANOCOMPOSITES
 Digest Journal of Nanomaterials and Biostructures Vol. 13, No. 2, April - June 2018, p. 499-504 PREPARATION, CHARACTERISATION AND PHOTOCATALYTIC ACTIVITY OF TERNARY GRAPHENE-Fe 3 O 4 :TiO 2 NANOCOMPOSITES
Novel fluorescent matrix embedded carbon quantum dots enrouting stable gold and silver hydrosols
 Novel fluorescent matrix embedded carbon quantum dots enrouting stable gold and silver hydrosols Shouvik Mitra a, Sourov Chandra b, Prasun Patra a, Panchanan Pramanik b *, Arunava Goswami a * a AERU, Biological
driving agent and study of photocatalytic activity Mohammad Salehi Department of Chemistry, Iran University of Science and Technology, Narmak, Tehran
 A simplified microwave-assisted synthesis of NiMoO 4 nanoparticles by using organic driving agent and study of photocatalytic activity Azadeh Tadjarodi *, Raheleh Pradehkhorram, Mina Imani, Samaneh Ebrahimi,
A novel Ag 3 AsO 4 visible-light-responsive photocatalyst: facile synthesis and exceptional photocatalytic performance
 Electronic Supplementary Material (ESI) for Chemical Communications Supporting Information A novel Ag 3 AsO 4 visible-light-responsive photocatalyst: facile synthesis and exceptional photocatalytic performance
Supporting Information. Nanoscale Kirkendall Growth of Silicalite-1 Zeolite Mesocrystals with. Controlled Mesoporosity and Size
 Electronic Supplementary Material (ESI) for ChemComm. This journal is The Royal Society of Chemistry 2015 Supporting Information Nanoscale Kirkendall Growth of Silicalite-1 Zeolite Mesocrystals with Controlled
Electronic Supplementary Information (ESI) Tunable Phase and Visible-Light Photocatalytic Activity
 Tunable Phase and Visible-Light Photocatalytic Activity") Electronic Supplementary Information (ESI) Metallic-Zinc Assistant Synthesis of Ti 3+ Self-Doped TiO 2 with Tunable Phase and Visible-Light Photocatalytic Activity Zhaoke Zheng, a Baibiao Huang,* a Xiaodong
Electronic Supplementary Information (ESI) Metallic-Zinc Assistant Synthesis of Ti 3+ Self-Doped TiO 2 with Tunable Phase and Visible-Light Photocatalytic Activity Zhaoke Zheng, a Baibiao Huang,* a Xiaodong
Supplementary Information
 Electronic Supplementary Material (ESI) for RSC Advances. This journal is The Royal Society of Chemistry 2016 Supplementary Information Multifunctional Fe 2 O 3 /CeO 2 Nanocomposites for Free Radical Scavenging
Department of Chemistry of The College of Staten Island and The Graduate Center, The City University of
 Electronic Supplementary Material (ESI) for Journal of Materials Chemistry A. This journal is The Royal Society of Chemistry 2014 Fe 3 O 4 /Carbon quantum dots hybrid nanoflowers for highly active and
Synthesis and photocatalytic activity of TiO2 Nanoparticles
 Journal of Babylon University/Pure and Applied Sciences/ No.(1)/ Vol.(22): 2012 College of Science/Babylon University Scientific Conference Synthesis and photocatalytic activity of TiO2 Nanoparticles MAJEED
Supporting Information
 Supporting Information Photocatalytic Suzuki Coupling Reaction using Conjugated Microporous Polymer with Immobilized Palladium Nanoparticles under Visible Light Zi Jun Wang, Saman Ghasimi, Katharina Landfester
Visible-light Driven Plasmonic Photocatalyst Helical Chiral TiO 2 Nanofibers
 Visible-light Driven Plasmonic Photocatalyst Ag/AgCl @ Helical Chiral TiO 2 Nanofibers Dawei Wang, Yi Li*, Gianluca Li Puma, Chao Wang, Peifang Wang, Wenlong Zhang, and Qing Wang Fig. S1. The reactor of
(IJIRSE) International Journal of Innovative Research in Science & Engineering ISSN (Online)
 International Journal of Innovative Research in Science & Engineering ISSN (Online)") Synthesis, Size Characterization and Photocatalytic Activities of Zinc Ferrites and Cobalt Ferrites Nanoparticles Using Oxidative Degradations of Methylene Blue, Crystal Violet and Alizarin Red s in Aqueous
Synthesis, Size Characterization and Photocatalytic Activities of Zinc Ferrites and Cobalt Ferrites Nanoparticles Using Oxidative Degradations of Methylene Blue, Crystal Violet and Alizarin Red s in Aqueous
Hetero-crystals with Enhanced Photocatalytic Properties and Stabilities
 Supporting Information for Facile Synthesis of Rhombic Dodecahedral AgX/Ag 3 PO 4 (X=Cl, Br, I) Hetero-crystals with Enhanced Photocatalytic Properties and Stabilities Yingpu Bi, Shuxin Ouyang, Junyu Cao,
-:Vijay Singh(09CEB023)
") Heterogeneous Semiconductor Photocatalyst -:Vijay Singh(09CEB023) Guided by Azrina Abd Aziz Under Dr. Saravanan Pichiah Preparation of TiO 2 Nanoparticle TiO 2 was prepared by hydrolysis and poly-condensation
Heterogeneous Semiconductor Photocatalyst -:Vijay Singh(09CEB023) Guided by Azrina Abd Aziz Under Dr. Saravanan Pichiah Preparation of TiO 2 Nanoparticle TiO 2 was prepared by hydrolysis and poly-condensation
Supplementary Information for
 Supplementary Information for Facile transformation of low cost thiourea into nitrogen-rich graphitic carbon nitride nanocatalyst with high visible light photocatalytic performance Fan Dong *a, Yanjuan
PHOTOCATALYTIC DEGRADATION STUDIES OF POLYANILINE BASED ZnO-Al 2 O 3 NANOCOMPOSITE
 PHOTOCATALYTIC DEGRADATION STUDIES OF POLYANILINE BASED ZnO-Al 2 O 3 NANOCOMPOSITE Baiju V 1, Dedhila Devadathan 2, Biju R 3, Raveendran R 4 Nanoscience Research Laboratory, Department of Physics, Sree
Fabrication and characterization of poly (ethylene oxide) templated nickel oxide nanofibers for dye degradation
 templated nickel oxide nanofibers for dye degradation") Electronic Supplementary Material (ESI) for Environmental Science: Nano. This journal is The Royal Society of Chemistry 2014 Supplementary Information Fabrication and characterization of poly (ethylene
Electronic Supplementary Material (ESI) for Environmental Science: Nano. This journal is The Royal Society of Chemistry 2014 Supplementary Information Fabrication and characterization of poly (ethylene
Photocatalytic degradation of methylene blue and crystal violet by sulfur/reduced graphene oxide composite
 Photocatalytic degradation of methylene blue and crystal violet by sulfur/reduced graphene oxide composite RahmatollahRahimi, MahsaMoshari, MahboubehRabbani Department of Chemistry, Iran University of
Nanoporous TiO 2 Nanoparticle Assemblies with Mesoscale Morphologies: Nano-Cabbage versus Sea-Anemone
 Electronic Supplementary Material (ESI) for Nanoscale. This journal is The Royal Society of Chemistry 2014 Supplemental Documents Nanoporous TiO 2 Nanoparticle Assemblies with Mesoscale Morphologies: Nano-Cabbage
A Highly efficient Iron doped BaTiO 3 nanocatalyst for the catalytic reduction of nitrobenzene to azoxybenzene
 Electronic Supplementary Material (ESI) for RSC Advances. This journal is The Royal Society of Chemistry 2014 A Highly efficient Iron doped BaTiO 3 nanocatalyst for the catalytic reduction of nitrobenzene
The CdS and CdMnS nanocrystals have been characterized using UV-visible spectroscopy, TEM, FTIR, Particle Size Measurement and Photoluminiscence.
 Synthesis of CdS and CdMns Nanocrystals in Organic phase Usha Raghavan HOD, Dept of Information Technology VPM s Polytechnic, Thane Maharashtra Email id: usharagha@gmail.com Abstract: The present work
Xiufang Chen, Jinshui Zhang, Xianzhi Fu, Markus Antonietti, and Xinchen Wang*
 -Catalyzed Oxidation of Benzene to Phenol Using Hydrogen Peroxide and Visible Light Xiufang Chen, Jinshui Zhang, Xianzhi Fu, Markus Antonietti, and Xinchen Wang* Supporting Information: Synthesis of :
Sulfur-bubble template-mediated synthesis of uniform porous g-c 3 N 4 with superior photocatalytic performance
 Electronic Supplementary Material (ESI) for ChemComm. This journal is The Royal Society of Chemistry 2014 Electronic Supplementary Information Sulfur-bubble template-mediated synthesis of uniform porous
TECHNICAL INFORMATION. Quantum Dot
 Quantum Dot Quantum Dot is the nano meter sized semiconductor crystal with specific optical properties originates from the phenomenon which can be explained by the quantum chemistry and quantum mechanics.
Supporting Information for
 Supporting Information for 2D/2D g-c 3 N 4 /MnO 2 nanocomposite as a direct Z-scheme photocatalyst for enhanced photocatalytic activity Pengfei Xia, Bicheng Zhu, Bei Cheng, Jiaguo Yu, *,, and Jingsan Xu
CHAPTER 4. PREPARATION AND CHARACTERIZATION OF Cr-DOPED, Co-DOPED AND Fe-DOPED NIO NANOPARTICLES
 59 CHAPTER 4 PREPARATION AND CHARACTERIZATION OF Cr-DOPED, Co-DOPED AND Fe-DOPED NIO NANOPARTICLES 4.1 INTRODUCTION Extensive research has been carried out on transition metal ion doped semiconductors
Photocatalysis: semiconductor physics
 Photocatalysis: semiconductor physics Carlos J. Tavares Center of Physics, University of Minho, Portugal ctavares@fisica.uminho.pt www.fisica.uminho.pt 1 Guimarães Where do I come from? 3 Guimarães 4 Introduction>>
Photocatalytic degradation of 4-nitrophenol in aqueous N, S-codoped TiO 2 suspensions
 Photocatalytic degradation of 4-nitrophenol in aqueous N, S-codoped TiO 2 suspensions Rahmatollah Rahimi, Samaneh Safalou moghaddam, Mahboubeh Rabbani Department of Chemistry, Iran University of Science
Polymer Semiconductors for Artificial Photosynthesis: Hydrogen Evolution by Mesoporous Graphitic Carbon Nitride with Visible Light
 Polymer Semiconductors for Artificial Photosynthesis: Hydrogen Evolution by Mesoporous Graphitic Carbon Nitride with Visible Light Xinchen Wang*, Kazuhiko Maeda, Xiufang Chen, Kazuhiro Takanabe, Kazunari
Sacrifical Template-Free Strategy
 Supporting Information Core/Shell to Yolk/Shell Nanostructures by a Novel Sacrifical Template-Free Strategy Jie Han, Rong Chen and Rong Guo* School of Chemistry and Chemical Engineering, Yangzhou University,
A triazine-based covalent organic polymer for efficient CO 2 adsorption
 Electronic Supplementary Material (ESI) for Chemical Communications. This journal is The Royal Society of Chemistry 2015 Supporting Information A triazine-based covalent organic polymer for efficient CO
Permeable Silica Shell through Surface-Protected Etching
 Permeable Silica Shell through Surface-Protected Etching Qiao Zhang, Tierui Zhang, Jianping Ge, Yadong Yin* University of California, Department of Chemistry, Riverside, California 92521 Experimental Chemicals:
photo-mineralization of 2-propanol under visible light irradiation
 Electronic Supplementary Information for WO 3 modified titanate network film: highly efficient photo-mineralization of 2-propanol under visible light irradiation Experimental Preparation of STN, and WO
Synthesis and characterization of silica titania core shell particles
 PRAMANA c Indian Academy of Sciences Vol. 65, No. 5 journal of November 2005 physics pp. 787 791 Synthesis and characterization of silica titania core shell particles SUCHITA KALELE 1, RAVI DEY 1, NEHA
Trapping Lithium into Hollow Silica Microspheres. with a Carbon Nanotube Core for Dendrite-Free
 Supporting Information Trapping Lithium into Hollow Silica Microspheres with a Carbon Nanotube Core for Dendrite-Free Lithium Metal Anodes Tong-Tong Zuo,, Ya-Xia Yin,, Shu-Hua Wang, Peng-Fei Wang,, Xinan
Preparation of One-dimensional ZnO/Bi2O3 Heterostructures Nanomaterial for Visible Light Photocatalysis
 2016 International Conference on Material Science and Civil Engineering (MSCE 2016) ISBN: 978-1-60595-378-6 Preparation of One-dimensional ZnO/Bi2O3 Heterostructures Nanomaterial for Visible Light Photocatalysis
Experimental details. General
 Experimental details General TiO 2 P25 was purchased from Degussa; methyl methacrylate (MMA, 99%), 2,2 -azobis(2- methylpropionamidine) dihydrochloride (97%), titanium (IV) isopropoxide (97%), concentrated
One-pot Solvent-free Synthesis of Sodium Benzoate from the Oxidation of Benzyl Alcohol over Novel Efficient AuAg/TiO 2 Catalysts
 Electronic Supplementary Information One-pot Solvent-free Synthesis of Sodium Benzoate from the Oxidation of Benzyl Alcohol over Novel Efficient AuAg/TiO 2 Catalysts Ying Wang, Jia-Min Zheng, Kangnian
Efficient Co-Fe layered double hydroxide photocatalysts for water oxidation under visible light
 Supplementary Information Efficient Co-Fe layered double hydroxide photocatalysts for water oxidation under visible light Sang Jun Kim, a Yeob Lee, a Dong Ki Lee, a Jung Woo Lee a and Jeung Ku Kang* a,b
CHAPTER III. ORGANIC LIGANDS PASSIVATED ZnSe NANOSTRUCTURES AND FUNCTIONAL PROPERTIES
 82 CHAPTER III ORGANIC LIGANDS PASSIVATED ZnSe NANOSTRUCTURES AND FUNCTIONAL PROPERTIES 3.1 INTRODUCTION Semiconductor nanocrystals have size tunable optical properties that open up possibilities for revolutionary
Electronic Supplementary Information
 Electronic Supplementary Material (ESI) for Energy & Environmental Science. This journal is The Royal Society of Chemistry 2016 Electronic Supplementary Information Self-supported formation of hierarchical
Electronic Supplementary Information. Precursor Salt Assisted Syntheses of High-Index Faceted Concave Hexagon and Nanorod like Polyoxometalates
 Electronic Supplementary Material (ESI) for Nanoscale. This journal is The Royal Society of Chemistry 2014 Electronic Supplementary Information Precursor Salt Assisted Syntheses of High-Index Faceted Concave
Precious Metal-free Electrode Catalyst for Methanol Oxidations
 Electronic Supplementary Material (ESI) for Energy & Environmental Science. This journal is The Royal Society of Chemistry 2015 Supporting information SnO 2 Nanocrystals Decorated-Mesoporous ZSM-5 Spheroidicity
Supporting Information
 Electronic Supplementary Material (ESI) for RSC Advances. This journal is The Royal Society of Chemistry 214 Supporting Information Lei Liu, ab Yijie Xia, b Jie Zhang* b a) China Center for Modernization
I. Kornarakis, I. N. Lykakis, N. Vordos and G. S.
 Efficient visible-light photocatalytic activity by band alignment in mesoporous ternary polyoxometalate Ag2S CdS I. Kornarakis, I. N. Lykakis, N. Vordos and G. S. semiconductors Armatas Department of Materials
Facile Synthesis and Catalytic Properties of CeO 2 with Tunable Morphologies from Thermal Transformation of Cerium Benzendicarboxylate Complexes
 Electronic Supplementary Information Facile Synthesis and Catalytic Properties of CeO 2 with Tunable Morphologies from Thermal Transformation of Cerium Benzendicarboxylate Complexes Yuhua Zheng, Kai Liu,
Two-dimensional dendritic Ag 3 PO 4 nanostructures and their photocatalytic properties
 Supporting Information for Two-dimensional dendritic Ag 3 PO 4 nanostructures and their photocatalytic properties Yingpu Bi, *a Hongyan Hu, a Zhengbo Jiao, a Hongchao Yu, a Gongxuan Lu, a and Jinhua Ye
Synthesis and Luminescence Properties of Ni Doped ZnS Nanoparticles
 IJSTE - International Journal of Science Technology & Engineering Volume 2 Issue 11 May 2016 ISSN (online): 2349-784X Synthesis and Luminescence Properties of Ni Doped ZnS Nanoparticles B. Hariprasad Reddy
Facile synthesis of nanostructured CuCo 2 O 4 as a novel electrode material for high-rate supercapacitors
 Facile synthesis of nanostructured CuCo 2 O 4 as a novel electrode material for high-rate supercapacitors Afshin Pendashteh, a Mohammad S. Rahmanifar, b Richard B. Kaner, c and Mir F. Mousavi* a,c a Department
Bandgap engineering through nanocrystalline magnetic alloy grafting on. graphene
 Electronic Supplementary Material (ESI) for Physical Chemistry Chemical Physics. This journal is the Owner Societies 2014 Electronic Supplementary Information (ESI) for Bandgap engineering through nanocrystalline
Synthesis of nano sized TiO 2 and its application in photocatalytic removal of methylene blue
 Available online at www.pelagiaresearchlibrary.com Advances in Applied Science Research, 213, 4(6):212-218 ISSN: 976-861 CODEN (USA): AASRFC Synthesis of nano sized TiO 2 and its application in photocatalytic
RESULTS AND DISCUSSION Characterization of pure CaO and Zr-TiO 2 /CaO nanocomposite
 RESULTS AND DISCUSSION 4.1. Characterization of pure CaO and Zr-TiO 2 /CaO nanocomposite 4.1.1. Scanning electron microscopy analysis (SEM) SEM images of prepared CaO are shown in Fig. 4.1 (a and b). CaO
Supporting Information s for
 Supporting Information s for # Self-assembling of DNA-templated Au Nanoparticles into Nanowires and their enhanced SERS and Catalytic Applications Subrata Kundu* and M. Jayachandran Electrochemical Materials
Synthesis and characterization of nanophased silver tungstate
 PRAMANA c Indian Academy of Sciences Vol. 65, No. 5 journal of November 2005 physics pp. 793 799 Synthesis and characterization of nanophased silver tungstate THRESIAMMA GEORGE 1, SUNNY JOSEPH 1 and SURESH
INVESTIGATIONS OF Mn, Fe, Ni AND Pb DOPED
 INVESTIGATIONS OF Mn, Fe, Ni AND Pb DOPED ZINC SULPHIDE NANOPARTICLES A thesis submitted to the University of Pune FOR THE DEGREE OF DOCTOR of PHILOSOPHY IN PHYSICS by PRAMOD H. BORSE DEPARTMENT OF PHYSICS
Ethylenediaminetetraacetic Acid-Assisted Synthesis of Nano Antimony Oxide by Microwave Method
 Ethylenediaminetetraacetic Acid-Assisted Synthesis of Nano Antimony Oxide by Microwave Method Azadeh Tadjarodi*, Mohammad karimpour Department of Chemistry, Iran University of Science and Technology, Narmak,
Synthesis of 2 ) Structures by Small Molecule-Assisted Nucleation for Plasmon-Enhanced Photocatalytic Activity
 Structures by Small Molecule-Assisted Nucleation for Plasmon-Enhanced Photocatalytic Activity") Electronic Supplementary Material (ESI) for ChemComm. This journal is The Royal Society of Chemistry 2015 Electronic Supplementary Information Synthesis of Au@UiO-66(NH 2 ) Structures by Small Molecule-Assisted
Electronic Supplementary Material (ESI) for ChemComm. This journal is The Royal Society of Chemistry 2015 Electronic Supplementary Information Synthesis of Au@UiO-66(NH 2 ) Structures by Small Molecule-Assisted
CH676 Physical Chemistry: Principles and Applications. CH676 Physical Chemistry: Principles and Applications
 CH676 Physical Chemistry: Principles and Applications Crystal Structure and Chemistry Synthesis of Tetrahexahedral Platinum Nanocrystals with High-Index Facets and High Electro-Oxidation Activity Na Tian
International Journal of Pure and Applied Sciences and Technology
 Int. J. Pure Appl. Sci. Technol., 9(1) (2012), pp. 1-8 International Journal of Pure and Applied Sciences and Technology ISSN 2229-6107 Available online at www.ijopaasat.in Research Paper Preparation,
Shuo Li, Qidong Zhao, Dejun Wang and Tengfeng Xie *
 Electronic Supplementary Material (ESI) for RSC Advances. This journal is The Royal Society of Chemistry 2016 Work Function Engineering Derived All-solid-state Z-scheme Semiconductor-Metal-Semiconductor
Synthesis of Mesoporous ZSM-5 Zeolite Crystals by Conventional Hydrothermal Treatment
 Synthesis of Mesoporous ZSM-5 Zeolite Crystals by Conventional Hydrothermal Treatment Ming Zhou,* Ali A. Rownaghi, and Jonas Hedlund,* *Chemical Technology, Luleå University of Technology, SE-971 87 Luleå,
Shape Assisted Fabrication of Fluorescent Cages of Squarate based Metal-Organic Coordination Frameworks
 Supporting Information Shape Assisted Fabrication of Fluorescent Cages of Squarate based Metal-Organic Coordination Frameworks Kolleboyina Jayaramulu, a Katla Sai Krishna, a Subi J. George, b Muthuswamy
OPTICAL PROPERTIES AND SPECTROSCOPY OF NANOAAATERIALS. Jin Zhong Zhang. World Scientific TECHNISCHE INFORMATIONSBIBLIOTHEK
 OPTICAL PROPERTIES AND SPECTROSCOPY OF NANOAAATERIALS Jin Zhong Zhang University of California, Santa Cruz, USA TECHNISCHE INFORMATIONSBIBLIOTHEK Y World Scientific NEW JERSEY. t'on.don SINGAPORE «'BEIJING
A novel AgIO 4 semiconductor with ultrahigh activity in photodegradation of organic dyes: insights into the photosensitization mechanism
 Supporting Information for: A novel AgIO 4 semiconductor with ultrahigh activity in photodegradation of organic dyes: insights into the photosensitization mechanism Jianting Tang*, Datang Li*, Zhaoxia
Supporting Information High Activity and Selectivity of Ag/SiO 2 Catalyst for Hydrogenation of Dimethyloxalate
 Supporting Information High Activity and Selectivity of Ag/SiO 2 Catalyst for Hydrogenation of Dimethyloxalate An-Yuan Yin, Xiao-Yang Guo, Wei-Lin Dai*, Kang-Nian Fan Shanghai Key Laboratory of Molecular
Supporting Information
 Supporting Information German Edition: DOI: High Catalytic Activity of Heteropolynuclear Cyanide Complexes Containing Cobalt and Platinum Ions: Visible-Light Driven Water Oxidation** Yusuke Yamada,* Kohei
Chapter - 8. Summary and Conclusion
 Chapter - 8 Summary and Conclusion The present research explains the synthesis process of two transition metal oxide semiconductors SnO 2 and V 2 O 5 thin films with different morphologies and studies
Preparation of Iron Oxide Nanoparticles Mixed with Calcinated Laterite for Arsenic Removal
 Preparation of Iron Oxide Nanoparticles Mixed with Calcinated Laterite for Arsenic Removal Wint Myat Shwe 1, Dr. Mya Mya Oo 2, Dr. Su Su Hlaing 3 Abstract-- To overcome arsenic toxicity; which has become
Supporting Information. Self-assembled nanofibers from Leucine Derived Amphiphiles as Nanoreactors for Growth of ZnO Nanoparticles
 Supporting Information Self-assembled nanofibers from Leucine Derived Amphiphiles as Nanoreactors for Growth of ZnO Nanoparticles Karen T. Johnson, Theodore E. Gribb, Evan M. Smoak, and Ipsita A. Banerjee*
Electronic Supplementary Information. Fang He, Gang Chen,* Yaoguang Yu, Yansong Zhou, Yi Zheng and Sue Hao*
 Electronic Supplementary Material (ESI) for ChemComm. This journal is The Royal Society of Chemistry 2015 Electronic Supplementary Information Synthesis of condensed C-PDA/g-C 3 N 4 composites with superior
Confined Synthesis of CdSe Quantum Dots in the Pores of Metal-Organic Frameworks
 Electronic Supplementary Material (ESI) for Journal of Materials Chemistry C. This journal is The Royal Society of Chemistry 2014 Supporting Information Confined Synthesis of CdSe Quantum Dots in the Pores
Available online at Universal Research Publications. All rights reserved
 Available online at http://www.urpjournals.com International Journal of Nanomaterials and Biostructures Universal Research Publications. All rights reserved Original Article Optical properties of capping
Preparation of New Photocatalyst for Removal of Alizarin Red-S from Aqueous Solution
 Indian Journal of Science and Technology, Vol 7(11), 1882 1887, November 2014 ISSN (Print) : 0974-6846 ISSN (Online) : 0974-5645 Preparation of New Photocatalyst for Removal of Alizarin Red-S from Aqueous
Supplementary Information
 Supplementary Information In situ ion exchange synthesis of the novel Ag/AgBr/BiOBr hybrid with highly efficient decontamination of pollutants Hefeng Cheng, Baibiao Huang*, Peng Wang, Zeyan Wang, Zaizhu
Supplementary Figure 1: (a) Upconversion emission spectra of the NaYF 4 4 core shell shell nanoparticles as a function of Tm
 Upconversion emission spectra of the NaYF 4 4 core shell shell nanoparticles as a function of Tm") Supplementary Figure 1: (a) Upconversion emission spectra of the NaYF 4 @NaYbF 4 :Tm(x%) @NaYF 4 core shell shell nanoparticles as a function of Tm 3+ content in the inner shell layer. The spectra were
Supplementary Figure 1: (a) Upconversion emission spectra of the NaYF 4 @NaYbF 4 :Tm(x%) @NaYF 4 core shell shell nanoparticles as a function of Tm 3+ content in the inner shell layer. The spectra were
Solutions for Assignment-8
 Solutions for Assignment-8 Q1. The process of adding impurities to a pure semiconductor is called: [1] (a) Mixing (b) Doping (c) Diffusing (d) None of the above In semiconductor production, doping intentionally
CHAPTER 6. SOLVENT-FREE SELECTIVE OXIDATION OF -PINENE OVER Co-SBA-15 CATALYST
 135 CHAPTER 6 SOLVENT-FREE SELECTIVE OXIDATION OF -PINENE OVER Co-SBA-15 CATALYST 6.1 INTRODUCTION -Pinene is a terpenoid family of organic compound which is inexpensive, readily available and renewable
Synthesis, Structural, Surface Morphology, Optical and Electrical Properties of Silver Oxide Nanoparticles
 Int. J. Nanoelectronics and Materials 9 (2016) 37-49 Synthesis, Structural, Surface Morphology, Optical and Electrical Properties of Silver Oxide Nanoparticles Suresh Sagadevan* Department of physics,
PREPARATION OF LUMINESCENT SILICON NANOPARTICLES BY PHOTOTHERMAL AEROSOL SYNTHESIS FOLLOWED BY ACID ETCHING
 Phase Transitions Vol. 77, Nos. 1 2, January February 2004, pp. 131 137 PREPARATION OF LUMINESCENT SILICON NANOPARTICLES BY PHOTOTHERMAL AEROSOL SYNTHESIS FOLLOWED BY ACID ETCHING X. LI, Y. HE, S.S. TALUKDAR
Electronic supplementary information. A longwave optical ph sensor based on red upconversion
 Electronic Supplementary Material (ESI) for RSC Advances. This journal is The Royal Society of Chemistry 2014 Electronic supplementary information A longwave optical ph sensor based on red upconversion
Electronic Supplementary Information. Enhanced Photocatalytic/photoelectrocatalytic Activities
 Electronic Supplementary Material (ESI) for CrystEngComm. This journal is The Royal Society of Chemistry 2017 Electronic Supplementary Information Electrospun BiVO 4 Nanobelts with Tailored Structures
Supporting information. Highly Efficient Photocatalytic Degradation of Organic Pollutants by PANI-modified TiO 2 Composite
 Supporting information Highly Efficient Photocatalytic Degradation of Organic Pollutants by PANI-modified Composite Yangming Lin, Danzhen Li*, Junhua Hu, Guangcan Xiao, Jinxiu Wang, Wenjuan Li, Xianzhi