Quantitative Structure-Activity Relationships (QSARs) Tutorial
|
|
|
- Pierce Fisher
- 5 years ago
- Views:
Transcription

1 Quantitative Structure-Activity Relationships (QSARs) Tutorial Single and Multi Linear Regression This tutorial will show you how to perform a QSAR with MLR and PLS statistical tools

2 In the Gnumerics file enclosed (Tutorial Data) you will find 29 sugars with different sucrose relative power and 8 different descriptors as reported in the publication. The objective of this tutorial is to make you use of simple informatics tools to establish QSAR models. QSAR Pagina 2 The tutorial rely on the data available from Singh s paper. You can fine the publication in elearning website

3 Gnumeric QSAR Pagina 3 The gnumeric program will be used. The program can be searched in the net as it is freely available. Anyway it is also available from elarning. Download it and install by double click on the file.

4 Gnumeric QSAR Pagina 4 Answer to the question during the installation as shown in the slides
5 Gnumeric QSAR Pagina 5

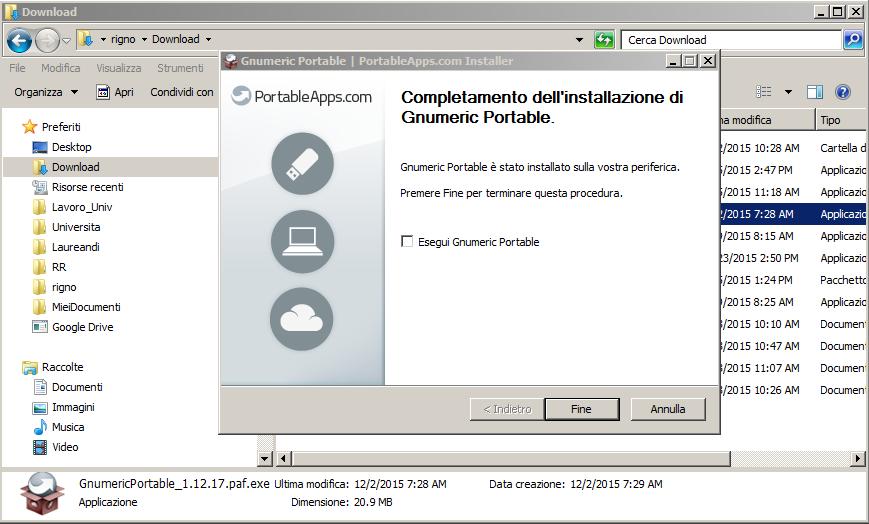
6 Gnumeric QSAR Pagina 6

7 Gnumeric QSAR Pagina 7 Look for the folder where gnumeric has been installed and open up it

8 Open the file QSAR Pagina 8 By mean of the «file» menu

9 Open the file QSAR Pagina 9 From elearning download the file Rajesh.Student.gnumeric and open it with gnumeric
 and 8 descriptors")
10 Initial Table QSAR Pagina 10 The opened file should appear as in the slide. There is a dependent variable (RS = relative sweetness) and 8 descriptors

11 Descriptors DH in the table W in the table EA and IP in the table SE in the table QSAR Pagina 11 Here are described the 8 used descriptors

12 Check dependent variable (RS) QSAR Pagina 12 The first thing to do is to check the linear distribution of the dependent variable RS. So copy the column of data belonging to RS it in the memory.

13 Check dependent variable (RS) QSAR Pagina 13. and paste it the into a new sheet
14 Check dependent variable (RS) QSAR Pagina 14

15 Check dependent variable (RS) QSAR Pagina 15 To check for linearity, just insert a column type chart

16 Check dependent variable (RS) QSAR Pagina 16 As you can see, the preview is showing the plot

17 Check dependent variable (RS) QSAR Pagina 17 Then click in the area of the sheet grid and the plot will appear. Clearly there is no linear distribution of the dependent variable
18 Check dependent variable (RS) QSAR Pagina 18 Let s transform it in the logarithm scale as shown in the slide
19 Check dependent variable (RS) QSAR Pagina 19
20 Check dependent variable (RS) QSAR Pagina 20 Then apply the formula for the cell «I2» to the other cells just grabbing the small square in the cell right bottom corner
21 Check dependent variable (RS) QSAR Pagina 21 And all the data will be transformed
22 Check dependent variable (RS) QSAR Pagina 22 Make the plot as shown before and now the linearity is present.

23 QSAR Pagina 23 Duplicate the sheet by right clicking on the sheet name.
24 Check dependent variable (RS) QSAR Pagina 24 Rename the sheet into «New Table»
25 Check dependent variable (RS) QSAR Pagina 25 Highlight the transformed RS variable and copy into the memory with the right click
26 Check dependent variable (RS) QSAR Pagina 26 Then paste it to the «New Table» sheet. Use the «paste special» option

27 Check dependent variable (RS) QSAR Pagina 27 and select «as value»
28 Check dependent variable (RS) QSAR Pagina 28 Now you have the dependent variable fixed
29 Independent variables analysis Notice that the 8 molecular descriptors have very different magnitudes. To guarantee the comparability of the MLR coefficients (see previous lesson on QSAR), proceed to the normalization of all the descriptors (for instance for the interval [0; 1] ). The first step is to calculate the MAX and MIN values of each descriptor with the functions =MAX(range) and =MIN(range) as described in the following slides QSAR Pagina 29 Once we have checked the dependent variable (RS) we need to analyse the independent variables (descriptors).
30 Independent variables analysis QSAR Pagina 30 First we calculate the maximum and the minimum values for each colum
31 Independent variables analysis QSAR Pagina 31 The method is similar to that already shown. Just do the same as displayed in the slide.
32 Independent variables analysis QSAR Pagina 32

33 Independent variables analysis QSAR Pagina 33
34 Independent variables analysis QSAR Pagina 34 And all the min and max values are promptly calculated
35 Independent variables analysis QSAR Pagina 35 In a new sheet.
36 Independent variables analysis QSAR Pagina 36 renamed «Normalized»

37 Independent variables analysis QSAR Pagina 37 Copy the ID and labels from «New Table» and also the descriptors labels

38 Independent variables analysis QSAR Pagina 38 paste everything in the «Normalized» sheet

39 Independent variables analysis QSAR Pagina 39 Make sure you have the same values for RS
40 Independent variables analysis QSAR Pagina 40 Now apply the normalization as described in the lesson. (see also the formula in the slide). Here the MinMax normalization is being applied: Normalized valued = (original value min) / (max min)

41 Independent variables analysis QSAR Pagina 41 And let s obtain the normalized matrix, that can be checked by calculating min and max. Their values should range all between 0 and 1.
42 Independent variables analysis QSAR Pagina 42 At this point we can continue analysing the data.
43 Independent variables analysis QSAR Pagina 43 Prepare a new sheet «Intercorrelation» as in the slide
44 Independent variables analysis QSAR Pagina 44 And by the proper function calculate the squared pearson coefficients (r2)
45 Independent variables analysis QSAR Pagina 45 First RS vs RS. It should be = 1!
46 Independent variables analysis QSAR Pagina 46 Lock at the formula and define fixed variable (insert $ signs as in the slide)

47 Independent variables analysis QSAR Pagina 47 Then just by drugging the r2 is calculated for all the values in the first row. Make a similar operation in the others rows
48 Independent variables analysis QSAR Pagina 48 And the correlation matrix is obtained
49 Independent variables analysis QSAR Pagina 49 In the first row are reported the r2 values for each variable with the dependent variable, these are monoparametric regressions. The best one is IP that as the highest r^2 value.

50 Independent variables analysis QSAR Pagina 50 In the yellow area are highlighted the intercorrelations among the descriptors to check for any collinearity. As a limit an r2 greater than 0.5 means that two variable are correlated and should not used together.
51 Choice of the best descriptors (stepwise method) In order to get an overview of the uniparametric relationship between the various descriptors we use a linear regression analysis function built into Gnumeric (Statistics > Dependent Observations > Regression) QSAR Pagina 51 In the next slides we are going to make a stepwise building of the QSAR model
52 Choice of the best descriptors (stepwise method) QSAR Pagina 52

53 Choice of the best descriptors (stepwise method) QSAR Pagina 53 We start with the uniparametric regressions using the «Statistic Regression» menu. Then by clicking in the X and Y variable boxes we define the areas containing the values. While doing this operation select also the label of the variables. Then click on the OK button.
» will be created with all the statistical")
54 Choice of the best descriptors (stepwise method) QSAR Pagina 54 and a new sheet «Regression (1)» will be created with all the statistical values

55 Choice of the best descriptors (stepwise method) logrs = * EA QSAR Pagina 55 By analysing the new sheet we can observe the intercept and constant values of the line and thus we can write its equation
56 Choice of the best descriptors (stepwise method) QSAR Pagina 56 Reapeat for all the descriptors
57 Choice of the best descriptors (stepwise method) QSAR Pagina 57
58 Choice of the best descriptors (stepwise method) QSAR Pagina 58
59 Choice of the best descriptors (stepwise method) QSAR Pagina 59
60 Choice of the best descriptors (stepwise method) QSAR Pagina 60
61 Choice of the best descriptors (stepwise method) QSAR Pagina 61
62 Choice of the best descriptors (stepwise method) QSAR Pagina 62
63 Choice of the best descriptors (stepwise method) QSAR Pagina 63 And record the r^2 values in a new sheet «Regressions»
 QSAR Pagina")
64 Choice of the best descriptors (stepwise method) QSAR Pagina 64
 QSAR Pagina 65")

65 Choice of the best descriptors (stepwise method) QSAR Pagina 65 Compare the Regressions with the initial correlations and the they should be the same values.
» the values are")
66 MLR with all variables Overfitting! QSAR Pagina 66 Just to try, instead of highlighting one parameter, select all the 8 descriptors while doung the regressions, in the new sheet «Regression (9)» the values are clearlyindicating that 8 parameters give a perfect regression of r2 = 1! This is overfitting! We are using collinear parameters and the model is LYING!
 we can observe that the results are the same, the only differences are the intercept and")
67 No differences with unscaled data! QSAR Pagina 67 IF we repeated with unscaled data (without normalizing) we can observe that the results are the same, the only differences are the intercept and the variable coefficient values. Although it seems that scaling is not necessary, apply always a normalization in you matrix!
68 Step Forward Multi Linear Regressions QSAR Pagina 68 Going back to the intercorrelation data it is possible to see that the first parameter to use is «IP» and that we can associate with it only «W», «MR», «SASA», «TE» and «DH» values. The ones that display low correlation with «IP». At first glance we could expect a godd correlation by using atriparametric model including «IP»,

69 Step Forward Multi Linear Regressions QSAR Pagina 69 Let s prepare the biparametric combinations
70 Step Forward Multi Linear Regressions QSAR Pagina 70 And by using the «Statistic Regression» menu the five biparametric are easily build.
71 Step Forward Multi Linear Regressions QSAR Pagina 71
72 Step Forward Multi Linear Regressions QSAR Pagina 72
73 Step Forward Multi Linear Regressions QSAR Pagina 73

74 Step Forward Multi Linear Regressions QSAR Pagina 74

75 Biparametric models QSAR Pagina 75 The best combination resulted to be IP + W, but also IP + MR should be analyzed with other descriptor

76 Step Forward Multi Linear Regressions QSAR Pagina 76 So prepare the triparametric combination for IP + W

77 Step Forward Multi Linear Regressions QSAR Pagina 77 And the other threes for IP + MR
78 Step Forward Multi Linear Regressions QSAR Pagina 78 And build the seven triparametric models
79 Step Forward Multi Linear Regressions QSAR Pagina 79
80 Step Forward Multi Linear Regressions QSAR Pagina 80

81 Step Forward Multi Linear Regressions QSAR Pagina 81
82 Step Forward Multi Linear Regressions QSAR Pagina 82
83 Step Forward Multi Linear Regressions QSAR Pagina 83
84 Step Forward Multi Linear Regressions QSAR Pagina 84

85 Triparametric models QSAR Pagina 85 From the results the best triparametric model is that with «IP» + «MR» + «SASA»

86 Triparametric models QSAR Pagina 86 The fitting plot can be made by the «Insert Chart» menu

87 Compare result with those published Are the same! QSAR Pagina 87 Comparing the results with those reported in the publication the same results were obtained using data not normalized. The same results are obtained either with normalized or autoscaled data!
Computer simulation of radioactive decay
 Computer simulation of radioactive decay y now you should have worked your way through the introduction to Maple, as well as the introduction to data analysis using Excel Now we will explore radioactive
Tutorial 12 Excess Pore Pressure (B-bar method) Undrained loading (B-bar method) Initial pore pressure Excess pore pressure
 Undrained loading (B-bar method) Initial pore pressure Excess pore pressure") Tutorial 12 Excess Pore Pressure (B-bar method) Undrained loading (B-bar method) Initial pore pressure Excess pore pressure Introduction This tutorial will demonstrate the Excess Pore Pressure (Undrained
Tutorial 12 Excess Pore Pressure (B-bar method) Undrained loading (B-bar method) Initial pore pressure Excess pore pressure Introduction This tutorial will demonstrate the Excess Pore Pressure (Undrained
An area chart emphasizes the trend of each value over time. An area chart also shows the relationship of parts to a whole.
 Excel 2003 Creating a Chart Introduction Page 1 By the end of this lesson, learners should be able to: Identify the parts of a chart Identify different types of charts Create an Embedded Chart Create a
Moving into the information age: From records to Google Earth
 Moving into the information age: From records to Google Earth David R. R. Smith Psychology, School of Life Sciences, University of Hull e-mail: davidsmith.butterflies@gmail.com Introduction Many of us
Electric Fields and Equipotentials
 OBJECTIVE Electric Fields and Equipotentials To study and describe the two-dimensional electric field. To map the location of the equipotential surfaces around charged electrodes. To study the relationship
Tutorial 23 Back Analysis of Material Properties
 Tutorial 23 Back Analysis of Material Properties slope with known failure surface sensitivity analysis probabilistic analysis back analysis of material strength Introduction Model This tutorial will demonstrate
v WMS Tutorials GIS Module Importing, displaying, and converting shapefiles Required Components Time minutes
 v. 11.0 WMS 11.0 Tutorial Importing, displaying, and converting shapefiles Objectives This tutorial demonstrates how to import GIS data, visualize it, and convert it into WMS coverage data that could be
Comparing whole genomes
 BioNumerics Tutorial: Comparing whole genomes 1 Aim The Chromosome Comparison window in BioNumerics has been designed for large-scale comparison of sequences of unlimited length. In this tutorial you will
Using Microsoft Excel
 Using Microsoft Excel Objective: Students will gain familiarity with using Excel to record data, display data properly, use built-in formulae to do calculations, and plot and fit data with linear functions.
Data Structures & Database Queries in GIS
 Data Structures & Database Queries in GIS Objective In this lab we will show you how to use ArcGIS for analysis of digital elevation models (DEM s), in relationship to Rocky Mountain bighorn sheep (Ovis
1 Introduction to Minitab
 1 Introduction to Minitab Minitab is a statistical analysis software package. The software is freely available to all students and is downloadable through the Technology Tab at my.calpoly.edu. When you
How many states. Record high temperature
 Record high temperature How many states Class Midpoint Label 94.5 99.5 94.5-99.5 0 97 99.5 104.5 99.5-104.5 2 102 102 104.5 109.5 104.5-109.5 8 107 107 109.5 114.5 109.5-114.5 18 112 112 114.5 119.5 114.5-119.5
WISE Regression/Correlation Interactive Lab. Introduction to the WISE Correlation/Regression Applet
 WISE Regression/Correlation Interactive Lab Introduction to the WISE Correlation/Regression Applet This tutorial focuses on the logic of regression analysis with special attention given to variance components.
OECD QSAR Toolbox v.3.0
 OECD QSAR Toolbox v.3.0 Step-by-step example of how to categorize an inventory by mechanistic behaviour of the chemicals which it consists Background Objectives Specific Aims Trend analysis The exercise
Exercise 6: Coordinate Systems
 Exercise 6: Coordinate Systems This exercise will teach you the fundamentals of Coordinate Systems within QGIS. In this exercise you will learn: How to determine the coordinate system of a layer How the
Didacticiel - Études de cas
 1 Theme Comparing the results of the Partial Least Squares Regression from various data mining tools (free: Tanagra, R; commercial: SIMCA-P, SPAD, and SAS). Comparing the behavior of tools is always a
Investigating Factors that Influence Climate
 Investigating Factors that Influence Climate Description In this lesson* students investigate the climate of a particular latitude and longitude in North America by collecting real data from My NASA Data
TALLINN UNIVERSITY OF TECHNOLOGY, INSTITUTE OF PHYSICS 6. THE TEMPERATURE DEPENDANCE OF RESISTANCE
 6. THE TEMPERATURE DEPENDANCE OF RESISTANCE 1. Objective Determining temperature coefficient of metal and activation energy of self-conductance of semiconductor sample. 2. Equipment needed Metal and semiconductor
Lab 1 Uniform Motion - Graphing and Analyzing Motion
 Lab 1 Uniform Motion - Graphing and Analyzing Motion Objectives: < To observe the distance-time relation for motion at constant velocity. < To make a straight line fit to the distance-time data. < To interpret
TECDIS and TELchart ECS Weather Overlay Guide
 1 of 24 TECDIS and TELchart ECS provides a very advanced weather overlay feature, using top quality commercial maritime weather forecast data available as a subscription service from Jeppesen Marine. The
Newton s Second Law of Motion
 Newton s Second Law of Motion Overview The purpose of this investigation is to validate Newton s Second Law of Motion. In Part A a lab cart will be accelerated by various net forces while keeping mass
Tutorial 8 Raster Data Analysis
 Objectives Tutorial 8 Raster Data Analysis This tutorial is designed to introduce you to a basic set of raster-based analyses including: 1. Displaying Digital Elevation Model (DEM) 2. Slope calculations
M&M Exponentials Exponential Function
 M&M Exponentials Exponential Function Teacher Guide Activity Overview In M&M Exponentials students will experiment with growth and decay functions. Students will also graph their experimental data and
OECD QSAR Toolbox v.3.3. Step-by-step example of how to categorize an inventory by mechanistic behaviour of the chemicals which it consists
 OECD QSAR Toolbox v.3.3 Step-by-step example of how to categorize an inventory by mechanistic behaviour of the chemicals which it consists Background Objectives Specific Aims Trend analysis The exercise
Foundations of Computation
 The Australian National University Semester 2, 2018 Research School of Computer Science Tutorial 1 Dirk Pattinson Foundations of Computation The tutorial contains a number of exercises designed for the
OECD QSAR Toolbox v.4.1
 OECD QSAR Toolbox v.4.1 Step-by-step example on how to predict the skin sensitisation potential approach of a chemical by read-across based on an analogue approach Outlook Background Objectives Specific
OECD QSAR Toolbox v.3.3
 OECD QSAR Toolbox v.3.3 Step-by-step example on how to predict the skin sensitisation potential of a chemical by read-across based on an analogue approach Outlook Background Objectives Specific Aims Read
Lab 15 Taylor Polynomials
 Name Student ID # Instructor Lab Period Date Due Lab 15 Taylor Polynomials Objectives 1. To develop an understanding for error bound, error term, and interval of convergence. 2. To visualize the convergence
OECD QSAR Toolbox v.3.4
 OECD QSAR Toolbox v.3.4 Step-by-step example on how to predict the skin sensitisation potential approach of a chemical by read-across based on an analogue approach Outlook Background Objectives Specific
A Scientific Model for Free Fall.
 A Scientific Model for Free Fall. I. Overview. This lab explores the framework of the scientific method. The phenomenon studied is the free fall of an object released from rest at a height H from the ground.
Retrieve and Open the Data
 Retrieve and Open the Data 1. To download the data, click on the link on the class website for the SPSS syntax file for lab 1. 2. Open the file that you downloaded. 3. In the SPSS Syntax Editor, click
Presenting Tree Inventory. Tomislav Sapic GIS Technologist Faculty of Natural Resources Management Lakehead University
 Presenting Tree Inventory Tomislav Sapic GIS Technologist Faculty of Natural Resources Management Lakehead University Suggested Options 1. Print out a Google Maps satellite image of the inventoried block
OECD QSAR Toolbox v.4.1. Tutorial on how to predict Skin sensitization potential taking into account alert performance
 OECD QSAR Toolbox v.4.1 Tutorial on how to predict Skin sensitization potential taking into account alert performance Outlook Background Objectives Specific Aims Read across and analogue approach The exercise
1. Double-click the ArcMap icon on your computer s desktop. 2. When the ArcMap start-up dialog box appears, click An existing map and click OK.
 Module 2, Lesson 1 The earth moves In this activity, you will observe worldwide patterns of seismic activity (earthquakes) and volcanic activity (volcanoes). You will analyze the relationships of those
Experiment: Oscillations of a Mass on a Spring
 Physics NYC F17 Objective: Theory: Experiment: Oscillations of a Mass on a Spring A: to verify Hooke s law for a spring and measure its elasticity constant. B: to check the relationship between the period
NMR Predictor. Introduction
 NMR Predictor This manual gives a walk-through on how to use the NMR Predictor: Introduction NMR Predictor QuickHelp NMR Predictor Overview Chemical features GUI features Usage Menu system File menu Edit
Tutorial. Getting started. Sample to Insight. March 31, 2016
 Getting started March 31, 2016 Sample to Insight CLC bio, a QIAGEN Company Silkeborgvej 2 Prismet 8000 Aarhus C Denmark Telephone: +45 70 22 32 44 www.clcbio.com support-clcbio@qiagen.com Getting started
v Prerequisite Tutorials GSSHA WMS Basics Watershed Delineation using DEMs and 2D Grid Generation Time minutes
 v. 10.1 WMS 10.1 Tutorial GSSHA WMS Basics Creating Feature Objects and Mapping Attributes to the 2D Grid Populate hydrologic parameters in a GSSHA model using land use and soil data Objectives This tutorial
Introduction to Hartree-Fock calculations in Spartan
 EE5 in 2008 Hannes Jónsson Introduction to Hartree-Fock calculations in Spartan In this exercise, you will get to use state of the art software for carrying out calculations of wavefunctions for molecues,
Contents. 9. Fractional and Quadratic Equations 2 Example Example Example
 Contents 9. Fractional and Quadratic Equations 2 Example 9.52................................ 2 Example 9.54................................ 3 Example 9.55................................ 4 1 Peterson,
OECD QSAR Toolbox v.4.1
 OECD QSAR Toolbox v.4. Tutorial illustrating quantitative metabolic information and related functionalities Outlook Aim Background Example for: Visualizing quantitative data within Toolbox user interface
Ligand Scout Tutorials
 Ligand Scout Tutorials Step : Creating a pharmacophore from a protein-ligand complex. Type ke6 in the upper right area of the screen and press the button Download *+. The protein will be downloaded and
Dock Ligands from a 2D Molecule Sketch
 Dock Ligands from a 2D Molecule Sketch March 31, 2016 Sample to Insight CLC bio, a QIAGEN Company Silkeborgvej 2 Prismet 8000 Aarhus C Denmark Telephone: +45 70 22 32 44 www.clcbio.com support-clcbio@qiagen.com
caused displacement of ocean water resulting in a massive tsunami. II. Purpose
 I. Introduction The Great Sumatra Earthquake event took place on December 26, 2004, and was one of the most notable and devastating natural disasters of the decade. The event consisted of a major initial
How to Make or Plot a Graph or Chart in Excel
 This is a complete video tutorial on How to Make or Plot a Graph or Chart in Excel. To make complex chart like Gantt Chart, you have know the basic principles of making a chart. Though I have used Excel
Calculating Conflict Density and Change over Time in Uganda using Vector Techniques
 Calculating Conflict Density and Change over Time in Uganda using Vector Techniques Created by Patrick Florance and Kyle Monahan; revised by Patrick Florance April 2, 2018. OVERVIEW... 1 SET UP... 1 SET
OECD QSAR Toolbox v.4.0. Tutorial on how to predict Skin sensitization potential taking into account alert performance
 OECD QSAR Toolbox v.4.0 Tutorial on how to predict Skin sensitization potential taking into account alert performance Outlook Background Objectives Specific Aims Read across and analogue approach The exercise
Error Analysis, Statistics and Graphing Workshop
 Error Analysis, Statistics and Graphing Workshop Percent error: The error of a measurement is defined as the difference between the experimental and the true value. This is often expressed as percent (%)
Physics. Simple Harmonic Motion ID: 9461
 Simple Harmonic Motion ID: 9461 By Peter Fox Time required 45 minutes Activity Overview In this activity, students collect data on the motion of a simple pendulum. They then graph the acceleration of the
Geography 3251: Mountain Geography Assignment II: Island Biogeography Theory Assigned: May 22, 2012 Due: May 29, 9 AM
 Names: Geography 3251: Mountain Geography Assignment II: Island Biogeography Theory Assigned: May 22, 2012 Due: May 29, 2012 @ 9 AM NOTE: This lab is a modified version of the Island Biogeography lab that
Introduction to Computer Tools and Uncertainties
 Experiment 1 Introduction to Computer Tools and Uncertainties 1.1 Objectives To become familiar with the computer programs and utilities that will be used throughout the semester. To become familiar with
EOS 102: Dynamic Oceans Exercise 1: Navigating Planet Earth
 EOS 102: Dynamic Oceans Exercise 1: Navigating Planet Earth YOU MUST READ THROUGH THIS CAREFULLY! This exercise is designed to familiarize yourself with Google Earth and some of its basic functions while
TRANSIENT MODELING. Sewering
 TRANSIENT MODELING Initial heads must be defined Some important concepts to keep in mind: Initial material properties and boundary conditions must be consistent with the initial heads. DO NOT start with
Curriculum Support Maps for the Study of Indiana Coal (Student Handout)
") Curriculum Support Maps for the Study of Indiana Coal (Student Handout) Introduction In this lesson you will learn how to use a geographic information system (GIS) program (IndianaMap) to investigate coal
Curriculum Support Maps for the Study of Indiana Coal (Student Handout) Introduction In this lesson you will learn how to use a geographic information system (GIS) program (IndianaMap) to investigate coal
Remember that C is a constant and ë and n are variables. This equation now fits the template of a straight line:
 CONVERTING NON-LINEAR GRAPHS INTO LINEAR GRAPHS Linear graphs have several important attributes. First, it is easy to recognize a graph that is linear. It is much more difficult to identify if a curved
Regression analysis is a tool for building mathematical and statistical models that characterize relationships between variables Finds a linear
 Regression analysis is a tool for building mathematical and statistical models that characterize relationships between variables Finds a linear relationship between: - one independent variable X and -
Better Exponential Curve Fitting Using Excel
 Better Exponential Curve Fitting Using Excel Mike Middleton DSI 2010 San Diego Michael R. Middleton, Ph.D. Decision Toolworks Mike@DecisionToolworks.com 415.310.7190 Background The exponential function,
Newton s Second Law. Computer with Capstone software, motion detector, PVC pipe, low friction cart, track, meter stick.
 F = m a F = m a Newton s Second Law 1 Object To investigate, understand and verify the relationship between an object s acceleration and the net force acting on that object as well as further understand
OECD QSAR Toolbox v.4.1. Tutorial illustrating new options for grouping with metabolism
 OECD QSAR Toolbox v.4.1 Tutorial illustrating new options for grouping with metabolism Outlook Background Objectives Specific Aims The exercise Workflow 2 Background Grouping with metabolism is a procedure
Interpolation Techniques
 Interpolation Techniques Using QGIS Tutorial ID: IGET_SA_002 This tutorial has been developed by BVIEER as part of the IGET web portal intended to provide easy access to geospatial education. This tutorial
PHY221 Lab 2 - Experiencing Acceleration: Motion with constant acceleration; Logger Pro fits to displacement-time graphs
 Page 1 PHY221 Lab 2 - Experiencing Acceleration: Motion with constant acceleration; Logger Pro fits to displacement-time graphs Print Your Name Print Your Partners' Names You will return this handout to
Project: Equilibrium Simulation
 UNIT 02: BCLN CHEMISTRY 12 - Rev. July, 2015 Project: Simulation Potential Credits: /20 Name: Goal: In this project you will explore the concept of reversible reactions and calculating K eq using some
MERGING (MERGE / MOSAIC) GEOSPATIAL DATA
 GEOSPATIAL DATA") This help guide describes how to merge two or more feature classes (vector) or rasters into one single feature class or raster dataset. The Merge Tool The Merge Tool combines input features from input
This help guide describes how to merge two or more feature classes (vector) or rasters into one single feature class or raster dataset. The Merge Tool The Merge Tool combines input features from input
SRM assay generation and data analysis in Skyline
 in Skyline Preparation 1. Download the example data from www.srmcourse.ch/eupa.html (3 raw files, 1 csv file, 1 sptxt file). 2. The number formats of your computer have to be set to English (United States).
Part 1: Play Purpose: Play! See how everything works before we try to find any relationships.
 PhET Gas Law Simulation Name: http://phet.colorado.edu/new/simulations/sims.php?sim=gas_properties If the direct link does not work, use Google, and use the search terms Phet Gas properties. You can download
Harvard Life Science Outreach December 7, 2017 Measuring ecosystem carbon fluxes using eddy covariance data ACTIVITIES I. NAME THAT ECOSYSTEM!
 Harvard Life Science Outreach December 7, 2017 Measuring ecosystem carbon fluxes using eddy covariance data ACTIVITIES I. NAME THAT ECOSYSTEM! Objective: Distinguish ecosystems (tropical forest vs. temperate
Lesson 4 Linear Functions and Applications
 In this lesson, we take a close look at Linear Functions and how real world situations can be modeled using Linear Functions. We study the relationship between Average Rate of Change and Slope and how
Petrel TIPS&TRICKS from SCM
 Petrel TIPS&TRICKS from SCM Knowledge Worth Sharing Holiday Tree Facies Model It s that time of year again time for a TIPS&TRICKS with a twist. This article highlights facies modeling using the Truncated
General Physics Laboratory Experiment Report 1st Semester, Year 2018
 PAGE 1/20 Exp. #1-2 : Measurement of the Motion of Objects by Using a Computer Interface and Understanding of Newton s Law of Motion Measurement of the Characteristics of the Frictional Force by Using
Introduction to Spectroscopy: Analysis of Copper Ore
 Introduction to Spectroscopy: Analysis of Copper Ore Using a Buret and Volumetric Flask: 2.06 ml of solution 2.47 ml of solution 50.00 ml delivered delivered Volumetric Flask Reading a buret: Burets are
Experiment 0 ~ Introduction to Statistics and Excel Tutorial. Introduction to Statistics, Error and Measurement
 Experiment 0 ~ Introduction to Statistics and Excel Tutorial Many of you already went through the introduction to laboratory practice and excel tutorial in Physics 1011. For that reason, we aren t going
MEASUREMENT OF THE CHARGE TO MASS RATIO (e/m e ) OF AN ELECTRON
 OF AN ELECTRON") MEASUREMENT OF THE CHARGE TO MASS RATIO (e/m e ) OF AN ELECTRON Object This experiment will allow you to observe and understand the motion of a charged particle in a magnetic field and to measure the ratio
MEASUREMENT OF THE CHARGE TO MASS RATIO (e/m e ) OF AN ELECTRON Object This experiment will allow you to observe and understand the motion of a charged particle in a magnetic field and to measure the ratio
Figure 2.1 The Inclined Plane
 PHYS-101 LAB-02 One and Two Dimensional Motion 1. Objectives The objectives of this experiment are: to measure the acceleration due to gravity using one-dimensional motion, i.e. the motion of an object
Physics Spring 2006 Experiment 4. Centripetal Force. For a mass M in uniform circular motion with tangential speed v at radius R, the required
 Centripetal Force I. Introduction. In this experiment you will study the centripetal force required for a mass in uniform circular motion. You will determine the centripetal forces required for different
Introduction to ArcGIS 10.2
 Introduction to ArcGIS 10.2 Francisco Olivera, Ph.D., P.E. Srikanth Koka Lauren Walker Aishwarya Vijaykumar Keri Clary Department of Civil Engineering April 21, 2014 Contents Brief Overview of ArcGIS 10.2...
Using SkyTools to log Texas 45 list objects
 Houston Astronomical Society Using SkyTools to log Texas 45 list objects You can use SkyTools to keep track of objects observed in Columbus and copy the output into the Texas 45 observation log. Preliminary
CC Algebra 2H Transforming the parent function
 CC Algebra H Transforming the Name: March. Open up the geometer s sketchpad document on Mr. March s website (It s under CC Algebra Unit Algebra Review). Make sure ou maimize both windows once ou open the
Experiment 1: The Same or Not The Same?
 Experiment 1: The Same or Not The Same? Learning Goals After you finish this lab, you will be able to: 1. Use Logger Pro to collect data and calculate statistics (mean and standard deviation). 2. Explain
Quick Start Guide New Mountain Visit our Website to Register Your Copy (weatherview32.com)
") Quick Start Guide New Mountain Visit our Website to Register Your Copy (weatherview32.com) Page 1 For the best results follow all of the instructions on the following pages to quickly access real-time
Quick Start Guide New Mountain Visit our Website to Register Your Copy (weatherview32.com) Page 1 For the best results follow all of the instructions on the following pages to quickly access real-time
41. Sim Reactions Example
 HSC Chemistry 7.0 41-1(6) 41. Sim Reactions Example Figure 1: Sim Reactions Example, Run mode view after calculations. General This example contains instruction how to create a simple model. The example
Kinematics Lab. 1 Introduction. 2 Equipment. 3 Procedures
 Kinematics Lab 1 Introduction An object moving in one dimension and undergoing constant or uniform acceleration has a position given by: x(t) =x 0 +v o t +1/2at 2 where x o is its initial position (its
Your work from these three exercises will be due Thursday, March 2 at class time.
 GEO231_week5_2012 GEO231, February 23, 2012 Today s class will consist of three separate parts: 1) Introduction to working with a compass 2) Continued work with spreadsheets 3) Introduction to surfer software
LAB 2 - ONE DIMENSIONAL MOTION
 Name Date Partners L02-1 LAB 2 - ONE DIMENSIONAL MOTION OBJECTIVES Slow and steady wins the race. Aesop s fable: The Hare and the Tortoise To learn how to use a motion detector and gain more familiarity
M E R C E R W I N WA L K T H R O U G H
 H E A L T H W E A L T H C A R E E R WA L K T H R O U G H C L I E N T S O L U T I O N S T E A M T A B L E O F C O N T E N T 1. Login to the Tool 2 2. Published reports... 7 3. Select Results Criteria...
Hot Spot / Kernel Density Analysis: Calculating the Change in Uganda Conflict Zones
 Hot Spot / Kernel Density Analysis: Calculating the Change in Uganda Conflict Zones Created by Patrick Florance; revised by Carolyn Talmadge, Madeline Wrable, Kyle Monahan on March 28, 2017 OVERVIEW...
MASSACHUSETTS INSTITUTE OF TECHNOLOGY Physics Department. Experiment 03: Work and Energy
 MASSACHUSETTS INSTITUTE OF TECHNOLOGY Physics Department Physics 8.01 Fall Term 2010 Experiment 03: Work and Energy Purpose of the Experiment: In this experiment you allow a cart to roll down an inclined
Working with ArcGIS: Classification
 Working with ArcGIS: Classification 2 Abbreviations D-click R-click TOC Double Click Right Click Table of Content Introduction The benefit from the use of geographic information system (GIS) software is
17-Nov-2015 PHYS MAXWELL WHEEL. To test the conservation of energy in a system with gravitational, translational and rotational energies.
 Objective MAXWELL WHEEL To test the conservation of energy in a system with gravitational, translational and rotational energies. Introduction A wheel is suspended by two cords wrapped on its axis. After
Space Objects. Section. When you finish this section, you should understand the following:
 GOLDMC02_132283433X 8/24/06 2:21 PM Page 97 Section 2 Space Objects When you finish this section, you should understand the following: How to create a 2D Space Object and label it with a Space Tag. How
Physical Chemistry Final Take Home Fall 2003
 Physical Chemistry Final Take Home Fall 2003 Do one of the following questions. These projects are worth 30 points (i.e. equivalent to about two problems on the final). Each of the computational problems
85. Geo Processing Mineral Liberation Data
 Research Center, Pori / Pertti Lamberg 14024-ORC-J 1 (23) 85. Geo Processing Mineral Liberation Data 85.1. Introduction The Mineral Liberation Analyzer, MLA, is an automated mineral analysis system that
Exercise 4 Estimating the effects of sea level rise on coastlines by reclassification
 Exercise 4 Estimating the effects of sea level rise on coastlines by reclassification Due: Thursday February 1; at the start of class Goal: Get familiar with symbolizing and making time-series maps of
Students will explore Stellarium, an open-source planetarium and astronomical visualization software.
 page 22 STELLARIUM* OBJECTIVE: Students will explore, an open-source planetarium and astronomical visualization software. BACKGROUND & ACKNOWLEDGEMENTS This lab was generously provided by the Red Rocks
7. STREAMBED TEXTURE ANALYSIS
 Geomorphology 7. Streambed Texture Analysis 7. STREAMBED TEXTURE ANALYSIS 50 Points The purpose of this exercise is to analyze the size characteristics of the sediment samples collected in the field. We
OECD QSAR Toolbox v.4.1. Tutorial illustrating new options of the structure similarity
 OECD QSAR Toolbox v.4.1 Tutorial illustrating new options of the structure similarity Outlook Background Aims PubChem features The exercise Workflow 2 Background This presentation is designed to familiarize
M61 1 M61.1 PC COMPUTER ASSISTED DETERMINATION OF ANGULAR ACCELERATION USING TORQUE AND MOMENT OF INERTIA
 M61 1 M61.1 PC COMPUTER ASSISTED DETERMINATION OF ANGULAR ACCELERATION USING TORQUE AND MOMENT OF INERTIA PRELAB: Before coming to the lab, you must write the Object and Theory sections of your lab report
1. Write the symbolic representation and one possible unit for angular velocity, angular acceleration, torque and rotational inertia.
 ROTATIONAL DYNAMICS Pre-Lab Questions Page Name: Class: Roster Number: Instructor: 1. Write the symbolic representation and one possible unit for angular velocity, angular acceleration, torque and rotational
How to Create Stream Networks using DEM and TauDEM
 How to Create Stream Networks using DEM and TauDEM Take note: These procedures do not describe all steps. Knowledge of ArcGIS, DEMs, and TauDEM is required. TauDEM software ( http://hydrology.neng.usu.edu/taudem/
Overlay Analysis II: Using Zonal and Extract Tools to Transfer Raster Values in ArcMap
 Overlay Analysis II: Using Zonal and Extract Tools to Transfer Raster Values in ArcMap Created by Patrick Florance and Jonathan Gale, Edited by Catherine Ressijac on March 26, 2018 If you have raster data
Gravity: How fast do objects fall? Teacher Advanced Version (Grade Level: 8 12)
") Gravity: How fast do objects fall? Teacher Advanced Version (Grade Level: 8 12) *** Experiment with Audacity and Excel to be sure you know how to do what s needed for the lab*** Kinematics is the study
Gravity: How fast do objects fall? Teacher Advanced Version (Grade Level: 8 12) *** Experiment with Audacity and Excel to be sure you know how to do what s needed for the lab*** Kinematics is the study