Effect of wind generation on dispatch INVESTIGATION 2
|
|
|
- Evan Miles
- 5 years ago
- Views:
Transcription
1 Effect of wind generation on dispatch INVESTIGATION 2 WIND GENERATION INVESTIGATION PROJECT MAY 2007
2 NOTICE COPYRIGHT 2007 TRANSPOWER New Zealand LIMITED ALL RIGHTS RESERVED The information contained in the report is protected by copyright vested in Transpower New Zealand Limited ( Transpower ). The report is supplied in confidence to you solely for your information. No part of the report may be reproduced or transmitted in any form by any means including, without limitation, electronic, photocopying, recording, or otherwise, without the prior written permission of Transpower. No information embodied in the report which is not already in the public domain shall be communicated in any manner whatsoever to any third party without the prior written consent of Transpower. Any breach of the above obligations may be restrained by legal proceedings seeking remedies including injunctions, damages and costs. LIMITATION OF LIABILITY/DISCLAIMER OF WARRANTY Transpower makes no representation or warranties with respect to the accuracy or completeness of the information contained in the report. Unless it is not lawfully permitted to do so, Transpower specifically disclaims any implied warranties of merchantability or fitness for any particular purpose and shall in no event be liable for, any loss of profit or any other commercial damage, including but not limited to special, incidental, consequential or other damages. Page 2
3 Version Control Version Date Change 1 14/12/2006 Draft for issue. 2 8/3/2007 Draft for issue. Revised following peer reviewer and Technical Stakeholder Group review. 3 16/3/2007 Draft for issue. Revised after Technical Stakeholder Group review. 4 7/4/2007 Final. Prepared By: Graeme Ancell Reviewed by: Chandana Samarasinghe Approved By: John Clarke Page 3
4 CONTENTS Executive Summary... 5 Introduction... 5 Dispatch of generation on the New Zealand power system... 6 Purpose... 6 Assumptions and approach... 6 Wind generation output variability... 6 Methodology... 7 Findings and recommendations Introduction Background Purpose Dispatching generation on the New Zealand power system Assumptions Wind generation investigation project approach General assumptions for this investigation Wind generation development scenarios Wind generation and load variability Methodology Load variability Load variability during morning and evening peaks Operation of Interruptible load Normal demand variability Large load changes Load variability Garrad Hassan analysis Managing generation and load variability Wind generation variability Impact of variability on power system operation Frequency keeping Generation re-dispatch Rapid changes during peak periods Discussion Limitations of the analysis Large changes in wind generation output Conclusions and Recommendations References Appendix 1 New Zealand power system Page 4
5 Executive Summary Introduction The Electricity Commission has initiated the Wind Generation Investigation Project (WGIP) to determine what changes to the Electricity Governance Rules and Regulations (EGRs) and industry arrangements will be necessary to accommodate the connection of large scale wind generation. The Implications phase of the project is an investigation of the impacts of wind generation on the operation of the New Zealand power system and electricity market, for a specified set of wind generation development scenarios. Nine areas where the variability of wind generation output or the technical capability of wind generation may adversely impact on the operation of the New Zealand power system and electricity market were identified. Each of these areas has been investigated to determine the likely impact under the defined scenarios and whether further analysis is required for the Options stage of the Project. Figure 1 shows the nine areas of investigation. Variability of wind generation output Scheduling and dispatch Investigation 1 Effect of unpredictability of wind generation output on pre-dispatch processes Investigation 2 Effect of variability of wind generation output on dispatch of generation Investigation 3 Effect of variability of wind generation output on asset loading Wind generation technical capability Voltage and frequency management Power system stability Investigation 4 Effect of wind generation capability on steady state voltage management Investigation 7 Effect of wind generation capability on power system transient stability Investigation 5 Effect of wind generation capability on management of frequency excursions Investigation 8 Effect of wind generation capability on oscillatory stability Investigation 6 Effect of wind generation capability on voltage stability Investigation 9 Effect of wind generation capability on dynamic voltage stability Figure 1: WGIP investigation areas This report documents Investigation 2 which is concerned with the effects of wind generation output variability on dispatch processes. Dispatch processes are concerned with the operation of the power system in real time. The effect of wind generation on scheduling processes (those processes occurring before dispatch such as publication of generation volume schedules) is considered in Investigation 1. Issues related to large scale wind generation development that are found to be significant will be advanced to the next phase of the WGIP which considers options for addressing these issues. Page 5
6 Dispatch of generation on the New Zealand power system Grid connected generation and embedded generation above 10 MW in size is required to participate within the trading rules in Part G of the EGRs. Generation offered is dispatched through the offer process in real time. Dispatch occurs every five minutes through formal dispatch instructions sent electronically. In New Zealand there is no Automatic Governor Control (AGC). Power system frequency is maintained in the normal band (49.8 to 50.2 Hz) by selected power stations which are dispatched to provide a frequency keeping ancillary service. The New Zealand power system consists of two island power systems (North Island and South Island) connected by an HVDC link. Figure 12 and Figure 13 (see Appendix 1) show the North Island and South Island power systems respectively. Power system frequency is managed by a frequency keeping provider in each island. Generation is dispatched to meet forecast load. Changes in load following dispatch of generation are managed through the frequency keeping providers and subsequent re-dispatch of generation. The output of wind generation is variable and will add to the effects of variability of load. This increase in variability will potentially impact upon dispatch processes and tools. Purpose The purpose of this study is to: determine the effect of variability of wind generation output on the System Operator s dispatch processes and tools, identify the level of wind generation where changes to dispatch processes and tools might be required, and, If necessary, make recommendations as to further investigation in this area. Assumptions and approach Wind generation output variability The Electricity Commission has developed four possible wind generation development scenarios [1] (A, B, C and D) which have been used in the nine investigations analyses. Garrad Hassan has calculated variability in wind generation output for the four wind generation development scenarios [2]. This report considers the impact of output variability of wind generation (as envisaged in the wind generation development scenarios) upon the dispatch processes and tools used by the System Operator. The wind generation output Page 6
7 variability assumed is based on the expected variability stated in the Garrad Hassan Report. Methodology The methodology used to analyse the impact of wind generation output variability on dispatch processes was to identify: 1. How the dispatch processes manage load variability and current levels of load variability. 2. Which dispatch processes are affected by variability in wind generation output. 3. The effects of predicted wind generation output variability on the dispatch processes and tools qualitatively. 4. The increased ancillary services requirements needed to maintain present quality targets in the absence of other solutions. The impact of wind generation output variability on price will not be considered. Findings and recommendations Wind generation output variability of the size predicted in the Garrad Hassan report for wind generation development scenario C will affect the processes and tools used by the System Operator to dispatch generation on the New Zealand power system to a limited extent. In the absence of changes to the EGRs and industry arrangements, it is expected that additional frequency keeping services may need to be procured to maintain frequency quality targets. From this analysis, the amount of additional frequency keeping services is not expected to be great even for the wind generation output variability predicted for wind generation development scenario C. The variability of wind generation output will affect the need to re-dispatch generation during a trading period. It is expected that some additional redispatch will be required for the predicted wind generation output variability for wind generation development scenario C. However, this should not be outside the capability of the present dispatch processes. It is recommended that the issues around the effects of wind generation on the dispatch of generation should be given a moderate priority for the next stage of the Wind Generation Investigation Project. Page 7
8 1. Introduction 1.1 Background The Electricity Commission has initiated the Wind Generation Investigation Project (WGIP) to determine what changes to the Electricity Governance Rules and Regulations (EGRs) and industry arrangements will be necessary to accommodate the connection of large scale wind generation. The Electricity Commission has developed four possible wind generation development scenarios [1] (A, B, C and D) for the New Zealand power system. Garrad Hassan has produced a report [2] for the Electricity Commission which forecasts the unpredictability of output that may be expected for each of the Electricity Commission s wind generation development scenarios. Transpower has been engaged by the Electricity Commission to undertake an investigation into the impact of the connection of wind generation (as envisaged in the wind generation development scenarios) upon the dispatch processes and tools used by the System Operator. The wind generation output variability assumed is based on the expected variability stated in the Garrad Hassan Report[2]. 1.2 Purpose The purpose of this study is to: determine the effect of variability of wind generation output on the System Operator s dispatch processes and tools; identify the level of wind generation where changes to dispatch processes and tools might be required; and, make recommendations, as necessary, as to further investigation in this area. 1.3 Dispatching generation on the New Zealand power system All generation offered under the trading rules in Part G of the EGRs is dispatched through the offer process in real time. Dispatch occurs every five minutes through formal dispatch instructions sent electronically. In New Zealand there is no Automatic Governor Control (AGC). Power system frequency is maintained in the normal band (49.8 to 50.2 Hz) by power stations which are dispatched to provide a frequency keeping ancillary service. The New Zealand power system consists of two island power systems (North Island and South Island) connected by an HVDC link. Figure 12 and Figure 13 (see Appendix 1) show the North Island and South Island power systems respectively. Power system frequency is managed by a frequency keeping provider in each island. Page 8
9 Generation is dispatched to meet forecast load. Changes in load following dispatch of generation are managed through the frequency keeping providers and subsequent re-dispatch of generation. The output of wind generation is variable and will add to the effects of the variability of load. This increase in variability will potentially impact upon dispatch processes and tools. Page 9
10 2. Assumptions 2.1 Wind generation investigation project approach The Wind Generation Investigation Project has identified nine areas where the variability of wind generation output or the capability of wind generation technology could impact upon the operation of the power system and electricity market. The potential impact on each area has been assessed through an assessment of the effects on current power system operating practice and industry arrangements. The approach taken during the analysis was to determine for a worst case 1 credible scenario whether the impact of wind generation would result in significant problems for operation of the power system or electricity market during the next 10 years (assuming that current practices and industry arrangements remain unchanged). If the worst case credible scenario shows no significant effects then no further analysis is required. In keeping with the worst case credible scenario, the following assumptions were made: Wind generation technology is assumed to have minimal capability. For example, wind generation turbines are assumed to have no ability to support voltage or frequency. It is recognised that modern turbines do have a certain ability to support voltage and frequency. Wind generation development scenario C will have the greatest amount of wind generation output variability and is chosen as the basis of the assessment. The displacement by wind generation of other generation will result in the worst case outcome for the area under investigation. The size and urgency of the impacts of wind generation determined during the analysis will allow the issues to be prioritised for attention in the next phase of the Wind Generation Investigation Project. For example, an issue that will have major impacts on the operation of the power system and electricity market for relatively low levels of wind generation will be given high priority whereas an issue that has no significant impacts can be assigned a low priority. 2.2 General assumptions for this investigation It is assumed for the purposes of this investigation: Load variability will increase proportionately with load growth. The current Electricity Governance Rules and Regulations apply. No proposed rule changes are considered. Wind generation is offered and dispatched as per the present electricity market arrangements. 1 This is in terms of potential effects upon the power system. Page 10
11 The System Operator s current suite of tools and processes used to dispatch generation are used. It is noted that the System Operator is currently upgrading its tools but the upgrade is intended to meet the same performance specification as the existing tools. There are no major changes to the New Zealand power system or electricity market. The effects of variability are considered at the daily, weekly and monthly levels. A sudden change that occurs on a daily basis and that requires some operational management may require changes to tools and processes. Similarly, a large change that significantly changes system frequency that occurs once a month may warrant some change to processes and tools. 2.3 Wind generation development scenarios Table 1 shows the location of new wind generation as envisaged in the Electricity Commission s wind generation development scenarios. Island Region Grid Scenario A Scenario B Scenario C Scenario D Connection (high (high (very high (low (for modelling penetration, concentrated penetration, diversified penetration, diversified penetration, diversified purposes) in North across the across the across the Island) country) country) country) North Island Northland Marsden 220KV 100 MW 150 MW Auckland Otahuhu 100 MW 300 MW 30 MW 220 KV Waikato Huntly 100 MW 50 MW 100 MW 30 MW 220 KV Hawkes Bay Redclyffe 300 MW 150 MW 300 MW 30 MW 220 kv Wairarapa Masterton 50 MW 110 KV Manawatu 2 Bunnythorpe 220 kv 450 MW 350 MW 450 MW 250 MW Wellington Wilton 300 MW 150 MW 300 MW 30 MW 220 KV TOTAL NI MW 1150 MW 950 MW 1600 MW 370 MW South Island Marlborough- Nelson Otago/ South Canterbury Southland Blenheim 110KV Timaru 220 kv 50 MW 50 MW 150 MW 300 MW Invercargill 220 kv 100 MW 100 MW 300 MW 50 MW TOTAL SI MW 100 MW 300 MW 650 MW 50 MW Table 1: Location of new and existing wind generation in wind generation development scenarios 2 This includes the existing 250 MW of wind generation (Te Apiti, Tararua I, II and III) located near Bunnythorpe. Page 11
12 2.4 Wind generation and load variability Garrad Hassan [2] has predicted variability of wind generation output for each of the wind generation development scenarios developed by the Electricity Commission. Section 4 contains tables summarising the variability of wind generation output for each of the scenarios. Garrad Hassan [2] has also analysed variability of system load on the New Zealand power system. The Garrad Hassan analysis is based on a limited amount of data hence care should be applied in interpreting the results. A discussion on the implications of the limitations of the analysis for this report is given in Section 6.1. The effect of the predicted wind generation output variability upon dispatch processes and tools is assessed in this report. 2.5 Methodology The methodology used to analyse the impact of wind generation output variability on dispatch processes was to identify: 1. How the dispatch processes manage load variability and current levels of load variability. 2. Which dispatch processes are affected by variability in wind generation output. 3. The effects of predicted wind generation output variability on the dispatch processes and tools qualitatively. 4. The increased ancillary services requirements which would be required to maintain present quality targets in the absence of other solutions. The impact of wind generation output variability on price will not be considered. Page 12
13 3. Load variability The demand on the power system varies constantly. This variation is due to consumers switching on and off loads throughout the day. Large load changes can arise from: rapid increases during morning and evening peaks; interruptible load operation during under frequency excursions; large industrial loads connecting or disconnecting; generation embedded within distribution networks suddenly changing output; and distribution company load control systems operating. Large load changes can be managed if advance notice is provided. For example, the connection or disconnection of a reduction line at Tiwai Point aluminium smelter can normally be managed so that there are no adverse effects on the power system. Similarly, rapid changes in demand during morning and evening peaks are managed through normal generation dispatch processes. The operation of interruptible load during under frequency excursions helps to restore power system frequency. Planned or predictable large load changes can be managed with small impact on the power system and may even provide benefits to power system operation (e.g. the operation of interruptible load during under frequency excursions). The effects of unpredictable load changes need to be managed through means such as frequency keeping and generation re-dispatch. 3.1 Load variability during morning and evening peaks Figure 2 shows the North Island demand on 14 June 2005 which was a typical winter weekday. Island demand is lowest in the early hours and increases rapidly between 5:00 and 8:00. The demand then decreases slowly until the time of the evening peak (16:00 to 20:00) when demand again increases rapidly. The rapid increases in demand at times of morning and evening peak are managed through the dispatch process. Sufficient generation is scheduled to be available to meet the rapid changes. It is the predictability of the demand pattern over a day (i.e. the load forecast is reasonably accurate at the island level) that enables such changes to be managed safely. Page 13
14 North Island Demand - 14 June North Island demand (MW) - 5 minute average :00 02:24 04:48 07:12 09:36 12:00 14:24 16:48 19:12 21:36 00:00 Time Figure 2: North Island demand - typical daily profile Figure 3 shows a rapid increase in demand during morning peak time on 1 March This date was chosen to illustrate a rapid change in load over morning peak times. At 5:05, the North Island demand is 2015 MW. This increases over the next two hours and 15 minutes by 1221 MW. This is an average increase of 540 MW per hour or 9 MW per minute over the period. North Island Demand - 1 March North Island demand (MW) - 5 minute average : : :24 03:36 04:48 06:00 07:12 08:24 09:36 10:48 12:00 Time Figure 3: Rapid increase in system demand during morning peak Page 14
15 3.2 Operation of Interruptible load One cause of sudden changes in power system demand is the operation of interruptible load during under frequency excursions. Distributors and retailers offer interruptible load into the instantaneous reserves market. If the offers are cleared then the interruptible load will be dispatched and will operate during under frequency excursions. Figure 4 shows the operation of interruptible load during an under frequency event on 26 March Around 400 MW of interruptible was shed at about 8:50 and then restored over the next 20 minutes. Note that the data is 5 minute averages. North Island demand - 26 March Demand (MW) :00 07:10 07:20 07:30 07:40 07:50 08:00 08:10 08:20 08:30 08:40 08:50 09:00 09:10 09:20 09:30 09:40 09:50 10:00 10:10 10:20 10:30 10:40 10:50 Time Figure 4: Operation of interruptible load While the operation of interruptible load does cause a large sudden change to system load, the sudden change is beneficial to the power system in helping to restore frequency during an under frequency excursion. 3.3 Normal demand variability Figure 5 shows the evening peak period on 4 March This time was chosen because it shows a load drop of around 50 MW occurring around 18:00 and a rapid increase between 20:00 and 20:30. The North Island 10s demand and 5 minute average demand are shown. Page 15
16 North Island Demand - 4 March s Demand (MW) :14:20 17:22:40 17:31:00 17:39:20 17:47:40 17:56:00 18:04:20 18:12:40 18:21:00 18:29:20 18:37:40 18:46:00 18:54:20 19:02:40 19:11:00 19:19:20 10s demand 19:27:40 19:36:00 Time 19:44:20 19:52:40 20:01:00 20:09:20 20:17:40 5 minute average Figure 5: North Island demand - 10s data and 5 minute averages 20:26:00 20:34:20 20:42:40 20:51:00 20:59:20 21:07:40 21:16:00 21:24:20 21:32:40 21:41:00 Figure 6 shows the probability distribution function for the variation between 10s demand and the 5 minute average demand in Figure 5. North Island Probability Variation from 5 minute average (MW) Figure 6: Probability distribution function for the difference between the 10s demand and the five minute average demand shown in Figure 5 Page 16
17 Most of the 10 second data variation from the 5 minute average is in the range +/- 20 MW. Generally, generation dispatch will follow the five minute average with re-dispatch when there is sufficient change in demand between five minute periods. The effects of the variability between generation re-dispatches will be mitigated by the frequency keeping provider. Part of the variability of load observed at a grid exit point will be due to the variability in output of embedded generation in the distribution network behind the grid exit point. 3.4 Large load changes Distribution companies have the ability to manage load within their networks. This can be disconnection of water heating across the network, the disconnection of non-essential loads or shifting load between grid exit points. Distribution companies will reduce load for a range of reasons ranging from requests from the System Operator to reduce load during grid emergencies to shifting load during maintenance outages. Directly connected industrial loads can cause large changes in demand at grid exit points as industrial processes are brought on or reduced. Similarly, the sudden disconnection of a large generating plant embedded within a distribution network will appear as an increase in net demand upon the system. Planned and notified changes in load can be managed so as to minimise the impact upon the power system. The System Operator requires that load changes are limited to 40 MW per minute with a maximum of 75 MW over five minutes. Larger load changes are agreed with the System Operator. 3.5 Load variability Garrad Hassan analysis Garrad Hassan calculated probability distribution functions for changes in North and South Island load over different time scales. Figure 7 and Figure 8 show the calculated measured load changes for the North Island and South Island respectively. Page 17
18 NI Load changes 10 sec 1 min 5 min 10 min 10-2 Probability Change in load [MW] Figure 7: Measured load changes in North Island (adapted from Figure 3.27 of [2]) SI Load changes 10 sec 1 min 5 min 10 min 10-2 Probability Change in load [MW] Figure 8: Measured load changes in South Island (adapted from Figure 3.28 of [2]) Page 18
19 Large load changes are relatively common in the South Island. Changes of these sizes are typically related to changes in loading at Tiwai when smelter reduction lines (around 150 MW in size) are shut down and restarted. These changes are managed through Manapouri generation increasing or decreasing output to match the change in Tiwai load. Garrad Hassan acknowledges that the tails of the calculated probability distribution functions rely on a few points only and should be taken as being indicative only. Garrad Hassan notes in paragraph 8 of the discussions and conclusions that The Monte Carlo simulations used in this report require a very large number of iterations to produce stable results at the extreme end of tails of distributions. Even with very large number of iterations used in processing the Monte Carlo simulations there will be some variation in results if reprocessed, particularly for events occurring once per month. Table 2 and Table 3 show calculated size of change for North Island and South Island load changes respectively for some return periods. 3 The size of change amounts have been estimated taking into account the accuracy of the calculated probabilities. Return Period Change over 10 seconds (from Table 3.10 of [2]) Probability (from Table 3.1 of [2]) Once per month -73/+59 MW Once per week -62/+50 MW Once per day -41 /+39 MW Table 2: Return periods for changes over 10 seconds for North Island load changes Return Period Change over 10 seconds (from Table 3.10 of [2]) Probability (from Table 3.1 of [2]) Once per month -83/+96 MW Once per week -78/+90 MW Once per day -30 /+24 MW Table 3: Return periods for changes over 10 seconds for South Island load changes Table 4 and Table 5 show calculated size of change for load changes for some return periods for the North Island and South Island respectively. The size of change amounts have been estimated taking in account the accuracy of the calculated probabilities. 3 A return period is a statistical measure of how often a load change of a certain size will occur. Page 19
20 Return Period Change over five minutes (from Table 3.10 of [2])) Probability (from Table 3.1 of [2]) Once per month -112/+154 MW Once per week -99/+121 MW Once per day -75/+102 MW Table 4: Return periods for changes over five minutes for North Island load changes Return Period Change over five minutes (from Table 3.10 of [2])) Probability (from Table 3.1 of [2]) Once per month -169/+172 MW Once per week -157/+139 MW Once per day -64/+61 MW Table 5: Return periods for changes over five minutes for South Island load changes It should be noted that the once per month and once per week changes in the South Island demand are higher than the corresponding changes for the North Island. The once per day changes for the North Island are considerably larger than the once per day changes for the South Island. The reason for this difference is mainly due to the operation of the reduction lines at the Tiwai Point Aluminium smelter. The loading on the reduction lines (around 150 MW in size) is frequently reduced to zero and then restored to full load within a period of several minutes. This change in load is normally managed by Manapouri power station changing output to match the change in load. 3.6 Managing generation and load variability Changes in system demand are managed in dispatch through a combination of manual and automatic processes. Generation dispatch instructions are issued automatically every five minutes and can be issued manually at any stage. The dispatch instructions will be based on a forecast of demand. Generators will take some time to respond to the instructions once received. Demand will change from the time that real time dispatch (RTD) was initiated to the time the updated generation dispatch instructions are implemented. Figure 9 shows an overview of the process. Page 20
21 Actual demand (in the past) Real Dispatch Dispatch Instructions to meet forecast load Time Generators Change output over a short time period Actual dispatch generation Demand changes over time period Frequency Keeping Station manages this difference Actual demand Past Now Figure 9 - Managing load variability during dispatch The frequency keeping provider effectively manages the changes in demand between changes in the dispatch of generation (noting that the governor action of other generating units will provide some support). Table 6 shows the different types of load variation and the management measures employed to minimise the effects on power system operation. Nature of load variation Typical size/rate Management Rapid changes during morning and evening peak periods (e.g. Increases of 10 MW per minute sustained over several hours Sufficient generation is scheduled and dispatched to meet the rapid changes. Frequency keeping manages unders and overs. Normal load variation ±20 MW Frequency keeping Large industrial loads connecting and disconnecting Operation of distribution companies load management systems Operation of interruptible load MW Generation can be scheduled and dispatched if advance warning is provided. Frequency keeping (and free governor action) if no advance warning is provided. Sudden disconnection of tens to hundreds of MW Table 6: Load variability and management No management as operation of interruptible load during under frequency events is expected and beneficial. Predictable changes and changes known in advance can be planned around through scheduling and dispatch processes. Unpredictable changes (e.g. Page 21
22 normal load variation) are managed first through frequency keeping and then generation re-dispatch. The Electricity Commission is considering initiatives to improve demand side bidding and forecasting. Such initiatives may affect demand variability in the following ways: The initiatives may result in demand customers (purchasers) being provided with information about the effect that demand changes will have upon energy prices at grid exit points. This is likely to increase demand variability during dispatch. Some purchasers will now be changing demand in response to price where they would not have done so in the past in addition to all the normal causes of variability. The effect may be more pronounced as price driven demand changes are likely to occur simultaneously at the start of a trading period. The initiatives may result in better information about planned changes in load being available. This will help better management of planned changes in load so that effects on the power system are minimised. Page 22
23 4. Wind generation variability The causes of variability in wind generation output include variability in wind speed and direction, connection and disconnection of turbines, and tripping of part of, or the entire wind farm. It is assumed that major wind farms will have a considerable number of wind turbines and that the loss of a single turbine will make little difference to the total output. The tripping of an entire wind farm 4 will have a similar effect to the tripping of another large generating unit or generating station. The effects of a wind farm tripping will be managed through instantaneous reserves and frequency keeping. The normal variability of output results from changes in wind speed and direction. To illustrate normal variability, Figure 10 shows the variation of Te Apiti wind farm output over a 20 minute period. The output of the wind farm has dropped by about 25 MW over this period. This type of change can be managed by re-dispatch of generation. Changes in output at the 10 second level are small (of the order of 5 MW) but occur nearly all the time. This type of change will be managed by frequency keeping. Te Apiti Output (MW) :10:00 22:11:40 22:13:20 22:15:00 22:16:40 22:18:20 22:20:01 22:21:40 22:23:20 22:25:00 22:26:40 22:28:20 22:30:00 Time 10 second data 5 minute average Figure 10: Te Apiti Output Garrad Hassan calculated probability distribution functions for changes in Te Apiti output. The calculated probability distribution function is shown in Figure The entire wind farm might be disconnected to clear a fault at the wind farm or through the action of a wind farm control system. Page 23
24 Te Apiti change in output 10 sec 1 min 5 min 10 min 10-2 Probability Change in output [MW] Figure 11: Probability distribution function for changes in Te Apiti output (adapted from Figure 3.1 of [2]) The probability distribution functions were calculated from one year s worth of data. This suggests that the probability distribution functions are reasonably accurate for probabilities down to that equivalent to a return period of a month. This report will consider return periods from once a day to once a month for wind generation output variability which is consistent with approach for load variability. Garrad Hassan has predicted wind generation output variability based on the wind generation development scenarios. For each scenario, Garrad Hassan modelled the wind generation by two methods [2]: Method 1. The wind generation output for each region (see Table 1) is modelled as a single wind farm; Method 2. The wind generation output for each region is modelled as 100 MW wind farms with a correlation equal to the inter-correlation of the 10 minute wind data (i.e. modelled with a 10 minute wind shift between wind farms). Table 7 and Table 8 show predicted wind generation output changes over 10 seconds for method 1 and method 2 respectively. Page 24
25 Scenario A Scenario B Scenario C Scenario D Return period NZ NI SI NZ NI SI NZ NI SI NZ NI SI Once per month Once per week Once per day Once per month Once per week Once per day Table 7: 10 second change in output for wind generation scenarios for method 1 (single wind farm in each region) [MW] (Table 3.2 of GH report) Scenario A Scenario B Scenario C Scenario D Return period NZ NI SI NZ NI SI NZ NI SI NZ NI SI Once per month Once per week Once per day Once per month Once per week Once per day Table 8: 10 second change in output for wind generation scenarios for method 2 (100 MW wind farm size) [MW] (Table 3.3 of GH report) Table 9 and Table 10 show predicted wind generation output changes over 10 seconds for method 1 and method 2 respectively. Scenario A Scenario B Scenario C Scenario D Return period NZ NI SI NZ NI SI NZ NI SI NZ NI SI Once per month Once per week Once per day Once per month Once per week Once per day Table 9: 5 minute changes in output for wind generation scenarios [MW] (Table 3.6 of GH report) Scenario A Scenario B Scenario C Scenario D Return period NZ NI SI NZ NI SI NZ NI SI NZ NI SI Once per month Once per week Once per day Once per month Once per week Once per day Table 10: 5 minute changes in output for wind generation scenarios [MW] (Table 3.7 of GH report) Page 25
26 Changes in average wind generation output at the 5 minute level are managed through the re-dispatch of generation similar to changes in demand at the 5 minute level. Instantaneous changes in wind generation output must be managed through frequency keeping. Page 26
27 5. Impact of variability on power system operation 5.1 Frequency keeping Table 11 shows a comparison of the variability of North Island demand and wind generation as envisaged in wind generation development scenario C over the 10 second period. The variability of wind generation output for method 1 is less than the size of North Island demand variation for return periods of a month and a week but is the same a return period of a day. The variability of wind generation output for method 2 is about half that of method 1. Return Period Change in North Island Predicted Change in wind demand over 10 seconds (from Table 2) generation output (MW over 10 seconds) for Scenario C (from Table 7 and Table 8) Method 1 Method 2 Once/ month -75/+60 MW -47/+49 MW -25/+25 MW Once/ week -60/+50 MW -43/+46 MW -24/+23 MW Once/ day -40/+40 MW -39/+40 MW -21/+21 MW Table 11: Comparison of North Island demand and wind generation varability (10 second) Under the present EGRs and industry arrangements, the variability of the predicted wind generation output under wind generation development scenario C may require the frequency keeping band dispatched to be wider to maintain present frequency quality. The increase in band width will depend on the correlation between load changes and observed wind generation output changes amongst other things. It is not possible to quantify for what level of connected wind generation an increase in the dispatched frequency keeping band might be required as there are other factors than increased wind generation output variability that will influence the decision. The maximum ramp rate capability of generating units providing frequency keeping services and the cost of frequency keeping are such factors. The effects of the variability of wind generation output are not major in terms of managing power system security during dispatch. 5.2 Generation re-dispatch Table 12 shows a comparison of the variability of North Island demand and wind generation as envisaged in wind generation development scenario C over the 5 minute period. The variability of wind generation output for method 1 is about the same as the North Island demand variation. The variability of wind generation output for method 2 is about half the North Island demand variation. Page 27
28 Return Period Change in North Island Predicted Change in wind demand over 5 minutes (from Table 4) generation output over 5 minutes for Scenario C (see Table 9) Method 1 Method 2 Once/ month -120/+150 MW -149/+163 MW -61/+67 MW Once/ week -100/+120 MW -117/+125 MW -53/+57 MW Once/ day -75/+100 MW -83/+88 MW -41/+44 MW Table 12: Comparison of North Island demand and wind generation variability (5 minute average) The variability of the predicted wind generation output under wind generation development scenario C will increase the need for generation re-dispatch during the 30 minute trading period as the combined variation of the North Island load and wind generation output will be greater under wind generation development scenario C than the present level of variation. The combined variation will depend on the correlation between load changes and wind generation output at the 5 minute average level. 5.3 Rapid changes during peak periods The prior analysis of wind generation output variability and load variability has assumed that the two are independent of each other. This may not always be the case. There may be times when the variability of wind generation output and load variability are not independent. Power system demand can increase rapidly over the morning and evening peak periods. The behaviour of wind generation during these periods is of interest. If wind generation output tended to drop off or increase during these periods then this would have ramifications for scheduling and dispatch during these periods. The behaviour of Te Apiti wind farm during morning and evening peaks has been examined. Te Apiti wind farm has been chosen primarily because it is the only wind farm for which output measurements are available on the required time scales. While there is considerable variability between days, Te Apiti generation output across morning and evening load peaks on a particular day is generally quite constant. There are no observed patterns of wind generation output consistently increasing or decreasing across these periods. Page 28
29 6. Discussion 6.1 Limitations of the analysis It is important to understand the limitations of the analysis described in this report. The analysis relies upon models of the variability of wind generation output and load. These models were derived from a limited data set (covering six to 12 months). The models are likely to be good at predicting events which occur on an hourly or daily basis (as far as those events are represented in the data) but will not necessarily represent less frequent events (as those events may not have occurred in the measured data). The models also assume that the variability of future wind farm output will be similar to that presently observed at Te Apiti wind farm. The variability of wind at different locations and the use of different wind generating units may result in the observed variability from future wind farms being quite different. The nature of wind may change with climatic conditions so that the variability of wind generation output currently observed at Te Apiti may be different to that observed in the future. The reliance that can be placed on the analysis in this report is limited by the lack of experience of wind generation connected to the New Zealand power system. Nevertheless, the analysis in this report is based on the best information that is available and should provide good guidance in understanding the impact of frequent events. It is strongly recommended that review and monitoring of the variability of wind generation is continued until such time that confidence is gained about the levels of variability that might be expected. 6.2 Large changes in wind generation output The nature of wind generation output variability suggests that large changes in the combined output of all wind generation can occur. Conceptually, as all wind farms continuously vary output, there will be times when the changes in output of many wind farms will be in the same direction. Where wind farms are co-located (e.g. as in the Manawatu region), local weather conditions such as weather fronts moving into the area can cause the outputs of the co-located wind farms to change in the same way. This has already been observed on a number of occasions for the Te Apiti and Tararua wind farms [3]. There is insufficient information available at this stage to determine the probability of such events and what mitigation measures would be appropriate. The effects on the power system of changes of certain sizes can be quantified. It is likely that changes in wind generation output for wind farms located in the same region will produce noticeable effects. For example, if there were only Page 29
30 100 MW of wind generation capacity connected to the North Island power system then the operation of this wind generation will not affect power system security under normal conditions although some effects of this generation may be noticed (e.g. see the report on the impact of Manawatu wind generation on scheduling and dispatch [3]). Large increases in the Manawatu wind generation output over five minutes have been observed to occur on a regular basis (around a dozen times a year). The size of these changes is around 66% of installed wind farm capacity. Wind generation scenario C envisages 450 MW of wind generation capacity in the Manawatu region. If the envisaged Manawatu wind generation shows similar large sudden increases in output then sudden changes of around 300 MW over five minutes would be regularly observed. A sudden increase in generation of 300 MW over five minutes can be managed through generation re-dispatch. However, a frequency excursion outside the normal band (49.8 Hz to 50.2 Hz) is likely before re-dispatch occurs. The extent to which wind farms in a region will change their output in the same manner is not well known. Correlation analysis has been carried out for the Manawatu wind farms (Tararua I and II and Te Apiti) and using wind speed measurements at other locations. It is too early to tell whether the correlations determined for Te Apiti and Tararua wind farms will apply to other wind farms in the region. Much depends on the physical locations of the wind farms (e.g. the present Manawatu wind farms are all located on the same ridgeline). The effects of connection of further wind farms should be monitored so that understanding of regional wind farm correlation improves and that if any mitigation measures should be implemented. It is recommended that the variability of wind generation and correlation between wind farms in a region is further monitored and reviewed. Page 30
31 7. Conclusions and Recommendations Wind generation output variability of the size predicted in the Garrad Hassan report for wind generation development scenario C will affect the processes and tools used by the System Operator to dispatch generation on the New Zealand power system to a limited extent. In the absence of changes to the EGRs and industry arrangements, it is expected that additional frequency keeping services may need to be procured to maintain frequency quality targets. The amount of additional frequency keeping services is not expected to be great even for the wind generation output variability predicted for wind generation development scenario C. The variability of wind generation output will affect the need to re-dispatch generation during a trading period. It is expected that some additional redispatch will be required for the predicted wind generation output variability for wind generation development scenario C however this should not be outside the capability of the present dispatch processes. It is recommended that the issues around the effects of wind generation on the dispatch of generation should be given a moderate priority for the next stage of the Wind Generation Investigation Project. Page 31
32 8. References [1] Wind Generation Scenarios see Wind Generation Investigation Project Website see [2] Garrad Hassan Report Wind Power variability and forecast accuracy in New Zealand, 20 March [3] Transpower, Manawatu wind generation: Observed impacts on the scheduling and dispatch processes, see Page 32
33 Appendix 1 New Zealand power system Page 33


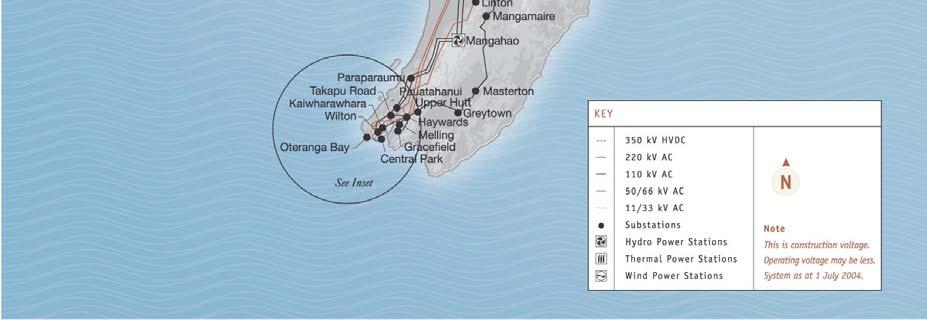
34 Figure 12 - North Island power system Page 34


35 Figure 13 - South Island power system Page 35
UPDATE ELECTRICITY STATEMENT OF OPPORTUNITIES FOR THE NATIONAL ELECTRICITY MARKET
 UPDATE ELECTRICITY STATEMENT OF OPPORTUNITIES FOR THE NATIONAL ELECTRICITY MARKET Published: 26 October 2015 ELECTRICITY STATEMENT OF OPPORTUNITIES IMPORTANT NOTICE Purpose AEMO publishes the Electricity
AN OVERVIEW OF THE PROCESSES AND METHODOLOGY USED BY THE SYSTEM OPERATOR TO PREPARE THE FORECAST OF DEMAND.
 GL-SD-204 LOAD FORECAST METHODOLOGY AND PROCESSES AN OVERVIEW OF THE PROCESSES AND METHODOLOGY USED BY THE SYSTEM OPERATOR TO PREPARE THE FORECAST OF Doc Reference: GL-SD-204 17/03/2016 Version Date Change
Weekly Operational Constraints Update
 Weekly Operational Constraints Update Applicable from 19 November 2018 to 25 November 2018 (Week 47) 16 November 2018 Disclaimer EirGrid plc, the Transmission System Operator (TSO) for Ireland, and SONI
Power System Seminar Presentation Wind Forecasting and Dispatch 7 th July, Wind Power Forecasting tools and methodologies
 Power System Seminar Presentation Wind Forecasting and Dispatch 7 th July, 2011 Wind Power Forecasting tools and methodologies Amanda Kelly Principal Engineer Power System Operational Planning Operations
February Industry Communique
 February 2019 Industry Communique Important notice PURPOSE This communique is to inform on the planned outages required in the North-West Victorian and South-West New South Wales transmission network and
Derogation Criteria for the Requirements for Generators Network Code
 Derogation Criteria for the Requirements for Generators Network Code Decision Paper Reference: CER/17/084 Date Published: 13/04/2017 Closing Date: 0 Executive Summary Commission Regulation (EU) 2016/631
Economic Operation of Power Systems
 Economic Operation of Power Systems Section I: Economic Operation Of Power System Economic Distribution of Loads between the Units of a Plant Generating Limits Economic Sharing of Loads between Different
International Workshop on Wind Energy Development Cairo, Egypt. ERCOT Wind Experience
 International Workshop on Wind Energy Development Cairo, Egypt ERCOT Wind Experience March 22, 21 Joel Mickey Direcr of Grid Operations Electric Reliability Council of Texas jmickey@ercot.com ERCOT 2 2
FORECAST ACCURACY REPORT 2017 FOR THE 2016 NATIONAL ELECTRICITY FORECASTING REPORT
 FORECAST ACCURACY REPORT 2017 FOR THE 2016 NATIONAL ELECTRICITY FORECASTING REPORT Published: November 2017 Purpose The National Electricity Rules (Rules) require AEMO to report to the Reliability Panel
Bringing Renewables to the Grid. John Dumas Director Wholesale Market Operations ERCOT
 Bringing Renewables to the Grid John Dumas Director Wholesale Market Operations ERCOT 2011 Summer Seminar August 2, 2011 Quick Overview of ERCOT The ERCOT Market covers ~85% of Texas overall power usage
California Independent System Operator (CAISO) Challenges and Solutions
 Challenges and Solutions") California Independent System Operator (CAISO) Challenges and Solutions Presented by Brian Cummins Manager, Energy Management Systems - CAISO California ISO by the numbers 65,225 MW of power plant capacity
California Independent System Operator (CAISO) Challenges and Solutions Presented by Brian Cummins Manager, Energy Management Systems - CAISO California ISO by the numbers 65,225 MW of power plant capacity
System Impact Assessment Addendum #2 Greenfield & St. Clair Energy Centres
 IESO_REP_0292 System Impact Assessment Addendum #2 Greenfield & St. lair Energy entres onnection Assessment & Approval Process Issue 3.0 Greenfield Energy entre AA I 2004-167 Applicant: Greenfield Energy
Wind power and management of the electric system. EWEA Wind Power Forecasting 2015 Leuven, BELGIUM - 02/10/2015
 Wind power and management of the electric system EWEA Wind Power Forecasting 2015 Leuven, BELGIUM - 02/10/2015 HOW WIND ENERGY IS TAKEN INTO ACCOUNT WHEN MANAGING ELECTRICITY TRANSMISSION SYSTEM IN FRANCE?
SOUTH AUSTRALIAN WIND STUDY REPORT SOUTH AUSTRALIAN ADVISORY FUNCTIONS
 SOUTH AUSTRALIAN WIND STUDY REPORT SOUTH AUSTRALIAN ADVISORY FUNCTIONS Published: October 2015 IMPORTANT NOTICE Purpose The purpose of this publication is to provide information about wind generation in
Operations Report. Tag B. Short, Director South Region Operations. Entergy Regional State Committee (ERSC) February 14, 2018
 February 14, 2018") Operations Report Tag B. Short, Director South Region Operations Entergy Regional State Committee (ERSC) February 14, 2018 1 Winter Operations Highlights South Region Max Gen Event Regional Dispatch Transfer
Operations Report Tag B. Short, Director South Region Operations Entergy Regional State Committee (ERSC) February 14, 2018 1 Winter Operations Highlights South Region Max Gen Event Regional Dispatch Transfer
Peterborough Distribution Inc Ashburnham Drive, PO Box 4125, Station Main Peterborough ON K9J 6Z5
 Peterborough Distribution Inc. 1867 Ashburnham Drive, PO Box 4125, Station Main Peterborough ON K9J 6Z5 November 15, 2017 Ontario Energy Board PO Box 2319 27 th Floor, 2300 Yonge St Toronto ON M4P 1E4
Total Market Demand Wed Jan 02 Thu Jan 03 Fri Jan 04 Sat Jan 05 Sun Jan 06 Mon Jan 07 Tue Jan 08
 MW This report provides a summary of key market data from the IESO-administered markets. It is intended to provide a quick reference for all market stakeholders. It is composed of two sections: Section
Wind Rules and Forecasting Project Update Market Issues Working Group 12/14/2007
 Wind Rules and Forecasting Project Update Market Issues Working Group 12/14/2007 Background Over the past 3 MIWG meetings, NYISO has discussed a methodology for forecasting wind generation in the NYCA
CAISO Participating Intermittent Resource Program for Wind Generation
 CAISO Participating Intermittent Resource Program for Wind Generation Jim Blatchford CAISO Account Manager Agenda CAISO Market Concepts Wind Availability in California How State Supports Intermittent Resources
International Studies about the Grid Integration of Wind Generation
 International Studies about the Grid Integration of Wind Generation Dr.-Ing. Markus Pöller/DIgSILENT GmbH Internation Studies About Grid Integration of Wind Generation Grid Integration of Wind Generationin
NEW ZEALAND WEATHER. BRIEF REVIEW OF THE WEATHER WINTER 1989 (Fig. 1) MONTHLY HIGHLIGHTS JUNE-AUGUST Weather and Climate (1990) 10: 27-31
 MONTHLY HIGHLIGHTS JUNE-AUGUST Weather and Climate (1990) 10: 27-31") Weather and Climate (1990) 10: 27-31 27 NEW ZEALAND WEATHER BRIEF REVIEW OF THE WEATHER (Fig. 1) WARMER THAN USUAL This was the third warmer than normal winter in a row, but not as warm as those of 1987
Weather and Climate (1990) 10: 27-31 27 NEW ZEALAND WEATHER BRIEF REVIEW OF THE WEATHER (Fig. 1) WARMER THAN USUAL This was the third warmer than normal winter in a row, but not as warm as those of 1987
NEW ZEALAND WEATHER. BRIEF REVIEW OF WINTER AND SPRING 1990 WINTER 1990 (Fig. 1) Weather and Climate (1991) 11: 31-36
 Weather and Climate (1991) 11: 31-36") Weather and Climate (1991) 11: 31-36 31 NEW ZEALAND WEATHER BRIEF REVIEW OF WINTER AND SPRING 1990 WINTER 1990 (Fig. 1) Winter 1990 was very dry in the far south. Northeasterlies brought sunny conditions
Weather and Climate (1991) 11: 31-36 31 NEW ZEALAND WEATHER BRIEF REVIEW OF WINTER AND SPRING 1990 WINTER 1990 (Fig. 1) Winter 1990 was very dry in the far south. Northeasterlies brought sunny conditions
Report on System-Level Estimation of Demand Response Program Impact
 Report on System-Level Estimation of Demand Response Program Impact System & Resource Planning Department New York Independent System Operator April 2012 1 2 Introduction This report provides the details
NATIONAL ELECTRICITY FORECASTING REPORT UPDATE FOR THE NATIONAL ELECTRICITY MARKET
 NATIONAL ELECTRICITY FORECASTING REPORT UPDATE FOR THE NATIONAL ELECTRICITY MARKET Published: December 2014 IMPORTANT NOTICE Purpose The purpose of this publication is to report on the accuracy of the
Activation of unscheduled reserves for Victoria and South Australia 19 January 2018 May 2018
 Activation of unscheduled reserves for Victoria and South Australia 19 January 2018 May 2018 Event report for the National Electricity Market Annexure B of Summer 2017-18 operations review Important notice
POWER SYSTEM OPERATING PROCEDURE LOAD FORECASTING
 POWER SYSTEM OPERATING PROCEDURE LOAD FORECASTING PREPARED BY: PROCEDURE TYPE: DOCUMENT REFERENCE: FINAL APPROVER: Systems Capability System Operating Procedure SO_OP_3710 Christian Schaefer DOC. VERSION:
Systems Operations. PRAMOD JAIN, Ph.D. Consultant, USAID Power the Future. Astana, September, /6/2018
 Systems Operations PRAMOD JAIN, Ph.D. Consultant, USAID Power the Future Astana, September, 26 2018 7/6/2018 Economics of Grid Integration of Variable Power FOOTER GOES HERE 2 Net Load = Load Wind Production
DEMAND FORECASTING PROTOCOL
 FIRST REPLACEMENT VOLUME NO. II Original Sheet No. 443 DEMAND FORECASTING PROTOCOL FIRST REPLACEMENT VOLUME NO. II Original Sheet No. 444 DEMAND FORECASTING PROTOCOL Table of Contents DFP 1 OBJECTIVES,
New Zealand Climate Update No 222, November 2017 Current climate November 2017
 New Zealand Climate Update No 222, November 2017 Current climate November 2017 November 2017 was characterised by higher than normal sea level pressure over New Zealand and the surrounding seas, particularly
Pursuant to Section 205 of the Federal Power Act ( FPA ) 1 and the Commission s
 1 and the Commission s") PJM Interconnection 2750 Monroe Boulevard Norristown, PA 19403-2497 Steven R. Pincus Associate General Counsel 610.666.4370 fax 610.666.8211 steven.pincus@pjm.com July 31, 2017 Honorable Kimberly D. Bose
PJM Interconnection 2750 Monroe Boulevard Norristown, PA 19403-2497 Steven R. Pincus Associate General Counsel 610.666.4370 fax 610.666.8211 steven.pincus@pjm.com July 31, 2017 Honorable Kimberly D. Bose
Colorado PUC E-Filings System
 Page 1 of 10 30-Minute Flex Reserve on the Public Service Company of Colorado System Colorado PUC E-Filings System Prepared by: Xcel Energy Services, Inc. 1800 Larimer St. Denver, Colorado 80202 May 13,
POWER SYSTEM OPERATING PROCEDURE LOAD FORECASTING
 POWER SYSTEM OPERATING PROCEDURE LOAD FORECASTING PREPARED BY: PROCEDURE TYPE: DOCUMENT REFERENCE: FINAL APPROVER: Systems Capability System Operating Procedure SO_OP_3710 Mark Stedwell DOC. VERSION: 19
2018 Annual Review of Availability Assessment Hours
 2018 Annual Review of Availability Assessment Hours Amber Motley Manager, Short Term Forecasting Clyde Loutan Principal, Renewable Energy Integration Karl Meeusen Senior Advisor, Infrastructure & Regulatory
Demand forecasting methodology for Security of Supply
 Demand forecasting methodology for Security of Supply Consultation paper April 2007 Contents 1 EXECUTIVE SUMMARY...4 2 INTRODUCTION AND PROCESS...5 2.1 Background...5 2.2 Submission process...7 3 SCOPE...9
FORECASTING OF WIND GENERATION The wind power of tomorrow on your screen today!
 FORECASTING OF WIND GENERATION The wind power of tomorrow on your screen today! Pierre Pinson 1, Gregor Giebel 2 and Henrik Madsen 1 1 Technical University of Denmark, Denmark Dpt. of Informatics and Mathematical
Put the Weather to Work for Your Company
 SAP Data Network Put the Weather to Work for Your Company Extend the Value of Your Business and Transactional Solutions by Incorporating Weather Data 1 / 7 Table of Contents 3 Enrich Business Data with
Commissioning and Testing of AVR and PSS
 Commissioning and Testing of AVR and PSS Excitation System Upgrade and commissioning challenges Vetti Bala Principal C&I Engineer G E N E S I S E N E R G Y L I M I T E D Contents Asset Testing - AVR AVR
SCHEDULING ERROR 3 AND 4 JULY 2011
 PREPARED BY: Electricity Market Performance DATE: 30 November 2011 FINAL Disclaimer Purpose This report has been prepared by the Australian Energy Market Operator Limited (AEMO) for the purpose of detailing
Short-Term Demand Forecasting Methodology for Scheduling and Dispatch
 Short-Term Demand Forecasting Methodology for Scheduling and Dispatch V1.0 March 2018 Table of Contents 1 Introduction... 3 2 Historical Jurisdictional Demand Data... 3 3 EMS Demand Forecast... 4 3.1 Manual
WIND INTEGRATION IN ELECTRICITY GRIDS WORK PACKAGE 3: SIMULATION USING HISTORICAL WIND DATA
 WIND INTEGRATION IN ELECTRICITY GRIDS WORK PACKAGE 3: SIMULATION USING PREPARED BY: Strategy and Economics DATE: 18 January 2012 FINAL Australian Energy Market Operator Ltd ABN 94 072 010 327 www.aemo.com.au
EBS IT Meeting July 2016
 EBS IT Meeting 18 19 July 2016 Conference Call Details Conference call: UK Numbers Tel: 0808 238 9819 or Tel: 0207 950 1251 Participant code: 4834 7876... Join online meeting https://meet.nationalgrid.com/antonio.delcastillozas/hq507d31
Information Document Calculation of Pool Price and Transmission Constraint Rebalancing Costs During a Constraint Event ID # R
 Information Documents are not authoritative. Information Documents are for information purposes only and are intended to provide guidance. In the event of any discrepancy between an Information Document
Thank you for your interest in the Support Resistance Strength Analyzer!
 This user manual refer to FXCM s Trading Station version of the indicator Support Resistance Strength Analyzer Thank you for your interest in the Support Resistance Strength Analyzer! This unique indicator
Anemos.Rulez: Extreme Event Prediction and Alarming to Support Stability of Energy Grids
 Anemos.Rulez: Extreme Event Prediction and Alarming to Support Stability of Energy Grids Hans-Peter (Igor) Waldl, Philipp Brandt Overspeed GmbH & Co. KG, Marie-Curie-Straße 1, 26129 Oldenburg, Germany,
NIWA Outlook: March-May 2015
 March May 2015 Issued: 27 February 2015 Hold mouse over links and press ctrl + left click to jump to the information you require: Overview Regional predictions for the next three months: Northland, Auckland,
APPENDIX 7.4 Capacity Value of Wind Resources
 APPENDIX 7.4 Capacity Value of Wind Resources This page is intentionally left blank. Capacity Value of Wind Resources In analyzing wind resources, it is important to distinguish the difference between
KEELE UNIVERSITY SNOW AND SEVERE WEATHER MANAGEMENT PLAN
 1.0 Introduction 1.1 It is recognised that severe weather conditions, particularly snow and ice, can make it difficult for people to travel. However, as a residential campus, even during severe weather
OFFSHORE INTEGRATION STUDY. Analysis, benchmark and mitigation of storm and ramping risks from offshore wind power in Belgium 05/02/2018
 OFFSHORE INTEGRATION STUDY Analysis, benchmark and mitigation of storm and ramping risks from offshore wind power in Belgium 05/02/2018 This study has been developed in close collaboration with 1 TABLE
ECE 422/522 Power System Operations & Planning/ Power Systems Analysis II 4 Active Power and Frequency Control
 ECE 422/522 Power System Operations & Planning/ Power Systems Analysis II 4 Active Power and Frequency Control Spring 2014 Instructor: Kai Sun 1 References Chapter 12 of Saadat s book Chapter 11.1 of Kundur
Demand Forecasting. for. Microsoft Dynamics 365 for Operations. User Guide. Release 7.1. April 2018
 Demand Forecasting for Microsoft Dynamics 365 for Operations User Guide Release 7.1 April 2018 2018 Farsight Solutions Limited All Rights Reserved. Portions copyright Business Forecast Systems, Inc. This
1 Descriptions of Function
 Wide-Area Wind Generation Forecasting 1 Descriptions of Function All prior work (intellectual property of the company or individual) or proprietary (non-publicly available) work should be so noted. 1.1
Schedule C By-Law Snow and Ice Control Services - Project Specifications for Various Parking Lots
 SNOW AND ICE CONTROL SERVICES - (4) SEPARATE DEPARTMENTS SCHEDULE C REQUEST FOR PROPOSAL 2244 Schedule C By-Law Snow and Ice Control Services - Project Specifications for Various Parking Lots 1.0 General
Energy Forecasting Customers: Analysing end users requirements Dec 3rd, 2013 Carlos Alberto Castaño, PhD Head of R&D
 IT Solutions for Renewables Energy Forecasting Customers: Analysing end users requirements Dec 3rd, 2013 Carlos Alberto Castaño, PhD Head of R&D carlos.castano@gnarum.com I. Who we are II. Customers Profiles
NEW ZEALAND WEATHER. BRIEF REVIEW OF THE WEATHER WINTER 1991 (Fig. 1) CONTRASTING RAINFALL, COLD IN THE SOUTH-WEST OF THE SOUTH ISLAND
 CONTRASTING RAINFALL, COLD IN THE SOUTH-WEST OF THE SOUTH ISLAND") Weather and Climate (1992) 12: 47-52 47 NEW ZEALAND WEATHER BRIEF REVIEW OF THE WEATHER (Fig. 1) CONTRASTING RAINFALL, COLD IN THE SOUTH-WEST OF THE SOUTH ISLAND An El Nino event (negative phase of the
Weather and Climate (1992) 12: 47-52 47 NEW ZEALAND WEATHER BRIEF REVIEW OF THE WEATHER (Fig. 1) CONTRASTING RAINFALL, COLD IN THE SOUTH-WEST OF THE SOUTH ISLAND An El Nino event (negative phase of the
NIWA Outlook: October - December 2015
 October December 2015 Issued: 1 October 2015 Hold mouse over links and press ctrl + left click to jump to the information you require: Overview Regional predictions for the next three months: Northland,
Estimated Sound Power Level of the ENERCON E-92 Operational Mode I (Data Sheet)
") Estimated Sound Power Level E-92 Page 1 of 3 Estimated Sound Power Level of the ENERCON E-92 Operational Mode I (Data Sheet) Imprint Editor: ENERCON GmbH Dreekamp 5 26605 Aurich Germany Telephone: 04941-927-0
Estimated Sound Power Level E-92 Page 1 of 3 Estimated Sound Power Level of the ENERCON E-92 Operational Mode I (Data Sheet) Imprint Editor: ENERCON GmbH Dreekamp 5 26605 Aurich Germany Telephone: 04941-927-0
Use of Normals in Load Forecasting at National Grid
 Use of Normals in Load Forecasting at National Grid Place your chosen image here. The four corners must just cover the arrow tips. For covers, the three pictures should be the same size and in a straight
Automatic Generation Control. Meth Bandara and Hassan Oukacha
 Automatic Generation Control Meth Bandara and Hassan Oukacha EE194 Advanced Controls Theory February 25, 2013 Outline Introduction System Modeling Single Generator AGC Going Forward Conclusion Introduction
MEDIUM TERM PASA PROCESS DESCRIPTION
 MEDIUM TERM PASA PROCESS DESCRIPTION PREPARED BY: Systems Capability DOCUMENT REF: 42 VERSION: 3.0 DATE: 30 May 2013 FINAL Australian Energy Market Operator Ltd ABN 94 072 010 327 www.aemo.com.au inlo@oemo.com.au
August A report for the National Electricity Market
 August 2018 A report for the National Electricity Market PURPOSE This publication has been prepared by AEMO to provide information about constraint equation performance and related issues, as at the date
PUB NLH 185 Island Interconnected System Supply Issues and Power Outages Page 1 of 9
 PUB NLH 1 Page 1 of 1 Q. Provide Hydro s list of outage cause codes and indicate how troublemen are managed and trained to properly use the codes. Explain the method used to report outage causes. A. Hydro
The Vaisala AUTOSONDE AS41 OPERATIONAL EFFICIENCY AND RELIABILITY TO A TOTALLY NEW LEVEL.
 The Vaisala AUTOSONDE AS41 OPERATIONAL EFFICIENCY AND RELIABILITY TO A TOTALLY NEW LEVEL. Weather Data Benefit For Society The four most important things about weather prediction are quality, reliability,
A Unified Framework for Defining and Measuring Flexibility in Power System
 J A N 1 1, 2 0 1 6, A Unified Framework for Defining and Measuring Flexibility in Power System Optimization and Equilibrium in Energy Economics Workshop Jinye Zhao, Tongxin Zheng, Eugene Litvinov Outline
EXPECTATIONS FOR LOSS OF SUPPLY IN THE NEW ZEALAND POWER SYSTEM
 EXPECTATIONS FOR LOSS OF SUPPLY IN THE NEW ZEALAND POWER SYSTEM Claire Jordan, Henning Rasmussen and Ratneesh Suri Abstract Predicting when, and how much, power may be lost on any given power grid is a
Report on Phase 2: System Performance Evaluation. Prepared for:
 THE EFFECTS OF INTEGRATING WIND POWER ON TRANSMISSION SYSTEM PLANNING, RELIABILITY, AND OPERATIONS Report on Phase 2: System Performance Evaluation Prepared for: THE NEW YORK STATE ENERGY RESEARCH AND
Wainui Beach Management Strategy (WBMS) Summary of Existing Documents. GNS Tsunami Reports
 Summary of Existing Documents. GNS Tsunami Reports") Wainui Beach Management Strategy (WBMS) Summary of Existing Documents GNS Tsunami Reports a) Review of Tsunami Hazard and Risk in New Zealand ( National Risk Report ) b) Review of New Zealand s Preparedness
Wainui Beach Management Strategy (WBMS) Summary of Existing Documents GNS Tsunami Reports a) Review of Tsunami Hazard and Risk in New Zealand ( National Risk Report ) b) Review of New Zealand s Preparedness
NYS Mesonet Data Access Policy
 NYS Mesonet Data Access Policy The New York State Mesonet is a network of 126 weather stations across the state, with at least one station in every county. Each standard station measures temperature, humidity,
elgian energ imports are managed using forecasting software to increase overall network e 칁 cienc.
 Elia linemen install Ampacimon real time sensors that will communicate with the dynamic thermal ratings software to control energy import levels over this transmission line. OV RH AD TRAN MI ION D namic
MISO September 15 Maximum Generation Event Overview. October 11, 2018
 MISO September 15 Maximum Generation Event Overview October 11, 2018 Purpose & Key Takeaways Purpose: Summarize operations during the September 15 South Region Maximum Generation Event Key Takeaways: MISO
DRIVING ROI. The Business Case for Advanced Weather Solutions for the Energy Market
 DRIVING ROI The Business Case for Advanced Weather Solutions for the Energy Market Table of Contents Energy Trading Challenges 3 Skill 4 Speed 5 Precision 6 Key ROI Findings 7 About The Weather Company
Ms. Cheryl Blundon Director Corporate Services & Board Secretary
 Ai\I or newfoundland!abrader k hydro a nalcor energy company Hydro Place. 500 Columbus Drive. P.O. Box 12400. St. John's. NI. Canada Al 4K7 t. 709.737.1400 f. 709.737.1800 www.n1h.nl.ca May 13, 2015 The
Traffic Simulation Toolbox User s Manual
 User s Manual Jesse Haber-Kucharsky Shreyas Sundaram University of Waterloo Department of Electrical and Computer Engineering May 31, 2011 Contents 1 Introduction 1 2 Basic Use 2 2.1 Quick-Start Example.......................
Temperature Profile for 36 Marker Spheres on 3M 788 ACCR Conductor 3M Company
 Temperature Profile for 36 Marker Spheres on 3M 788 ACCR Conductor 3M Company NEETRAC Project Number: 07-113 June 2007 A Research Center of the Georgia Institute of Technology Requested by: Dr. Colin McCullough
Weather Company Energy and Power Products
 Service Weather Company Energy and Power Products This Service (SD) describes the Cloud Service IBM provides to Client. Client means the company and its authorized users and recipients of the Cloud Service.
LEGAL DISCLAIMER. APG Coin (APG) White Paper (hereinafter 'the White Paper', 'the Document') is presented for informational purposes only
 White Paper (hereinafter 'the White Paper', 'the Document') is presented for informational purposes only") LEGAL DISCLAIMER THIS DOCUMENT DOES NOT GIVE PERSONAL LEGAL OR FINANCIAL ADVICE. YOU ARE STRONGLY ENCOURAGED TO SEEK YOUR OWN PROFESSIONAL LEGAL AND FINANCIAL ADVICE. APG Coin (APG) White Paper (hereinafter
LEGAL DISCLAIMER THIS DOCUMENT DOES NOT GIVE PERSONAL LEGAL OR FINANCIAL ADVICE. YOU ARE STRONGLY ENCOURAGED TO SEEK YOUR OWN PROFESSIONAL LEGAL AND FINANCIAL ADVICE. APG Coin (APG) White Paper (hereinafter
TESTING GUIDANCE FOR PROVIDERS OF FIRM FREQUENCY RESPONSE BALANCING SERVICE
 TESTING GUIDANCE FOR PROVIDERS OF FIRM FREQUENCY RESPONSE BALANCING SERVICE Authors Published Version Update Summary Kevin Smethurst Vicci Walsh May 2017 D1 Kevin Smethurst Vicci Walsh Draft 2/6/17 D6
UNITED STATES OF AMERICA BEFORE THE FEDERAL ENERGY REGULATORY COMMISSION. Interconnection for Wind Energy ) Docket No. RM
 Docket No. RM") UNITED STATES OF AMERICA BEFORE THE FEDERAL ENERGY REGULATORY COMMISSION Interconnection for Wind Energy ) Docket No. RM05-4-000 REQUEST FOR REHEARING OF THE NORTH AMERICAN ELECTRIC RELIABILITY COUNCIL
UNITED STATES OF AMERICA BEFORE THE FEDERAL ENERGY REGULATORY COMMISSION Interconnection for Wind Energy ) Docket No. RM05-4-000 REQUEST FOR REHEARING OF THE NORTH AMERICAN ELECTRIC RELIABILITY COUNCIL
PROJECT ECONOMIC ANALYSIS
 Electricity Transmission Expansion and Supply Improvement Project (RRP NEP 41155) PROJECT ECONOMIC ANALYSIS A. Overview 1. The economic analysis undertaken for the Electricity Transmission and Supply Improvement
Renewables and the Smart Grid. Trip Doggett President & CEO Electric Reliability Council of Texas
 Renewables and the Smart Grid Trip Doggett President & CEO Electric Reliability Council of Texas North American Interconnected Grids The ERCOT Region is one of 3 North American grid interconnections. The
SHORT TERM LOAD FORECASTING
 Indian Institute of Technology Kanpur (IITK) and Indian Energy Exchange (IEX) are delighted to announce Training Program on "Power Procurement Strategy and Power Exchanges" 28-30 July, 2014 SHORT TERM
Director Corporate Services & Board Secretary
 March, The Board of Commissioners of Public Utilities Prince Charles Building Torbay Road, P.O. Box 0 St. John s, NL AA B Attention: Ms. Cheryl Blundon Director Corporate Services & Board Secretary Dear
High Wind Speed Shutdown Workgroup Report
 off iv e Stage 01: Workgroup Report Grid Code High Wind Speed Shutdown Workgroup Report This report reviews the work of the High Wind Speed Shutdown Workgroup established by the Grid Code Review Panel
Control Strategies for Microgrids
 Control Strategies for Microgrids Ali Mehrizi-Sani Assistant Professor School of Electrical Engineering and Computer Science Washington State University Graz University of Technology Thursday, November
RESERVE LEVEL DECLARATION GUIDELINES
 RESERVE LEVEL DECLARATION GUIDELINES PREPARED BY: AEMO Operations DOCUMENT REF: RLDG-V2.1-FINAL VERSION: 2.1 EFFECTIVE DATE: 12 December 2018 STATUS: FINAL Approved for distribution and use by: APPROVED
Section 5. TADS Data Reporting Instruction Manual DRAFT Section 5 and Associated Appendices With Proposed Event Type Numbers
 Section 5 TADS Data Reporting Instruction Manual DRAFT Section 5 and Associated Appendices With Proposed Event Type Numbers Rev. 5/10/2010 1 Section 5 Form for Event ID and Event Type Number Data TO s
NATIONAL IRRIGATED LAND SPATIAL DATASET Summary of methodology, assumptions and results.
 NATIONAL IRRIGATED LAND SPATIAL DATASET Summary of methodology, assumptions and results. PREPARED FOR Ministry for the Environment C17042 28/07/2017 PREPARED BY Andrew Dark Birendra K.C. Ayaka Kashima
Integrating Wind Resources Into the Transmission Grid
 Integrating Wind Resources Into the Transmission Grid Gary D. Bachman Wisconsin Public Utility Institute May 26, 2010 Introduction Statement of FERC Chairman Jon Wellinghoff on Efficient Integration of
INSTRUCTION MANUAL FOR MM10 Relay
 INSTRUCTION MANUAL FOR MM10 Relay Motor Protection Relay Front Panel Overview V1 250614 MM10 Motor Protection Relay a I L1 b I L2 I L3 c h i d e I L1 Figure 1: Front panel overview f g I L2 a Run LED b
WCAP-AS5H Aluminum Electrolytic Capacitors
 A Dimensions: [mm] B Recommended hole pattern: [mm] D1 Electrical Properties: Properties Test conditions Value Unit Tol. Capacitance 0.25V; 120Hz C 10 µf ± 20% Rated voltage U R 16 V (DC) max. Leakage
Natura 2000 and spatial planning. Executive summary
 Natura 2000 and spatial planning Executive summary DISCLAIMER The information and views set out in this study are those of the author(s) and do not necessarily reflect the official opinion of the Commission.
Chapter 2. Planning Criteria. Turaj Amraee. Fall 2012 K.N.Toosi University of Technology
 Chapter 2 Planning Criteria By Turaj Amraee Fall 2012 K.N.Toosi University of Technology Outline 1- Introduction 2- System Adequacy and Security 3- Planning Purposes 4- Planning Standards 5- Reliability
Sample Snow Services Proposal Alle Rorie 7157 E Kemper Rd Cincinnati, OH Phone: (800)
") Sample Snow Services Proposal Alle Rorie 7157 E Kemper Rd Cincinnati, OH 45249 Phone: (800) 280-5153 Email: goisales@gisdynamics.com Service Address Corporate America Jim Smith 1 Corporate Way Cincinnati,
Sample Snow Services Proposal Alle Rorie 7157 E Kemper Rd Cincinnati, OH 45249 Phone: (800) 280-5153 Email: goisales@gisdynamics.com Service Address Corporate America Jim Smith 1 Corporate Way Cincinnati,
16 Appendix 16 Electrical Research Association Report
 Guide to the Wiring Regulations 16 Appendix 16 Electrical Research Association Report (ERA) report on armoured cables with external CPCs The attached report was commissioned by the ECA and is copyright
GENERATOR INTERCONNECTION APPLICATION
 GENERATOR INTERCONNECTION APPLICATION FOR BUY-ALL/SELL-ALL PROJECTS WITH AGGREGATE GENERATOR OUTPUT OF MORE THAN 20 KW BUT LESS THAN OR EQUAL TO 1 MW Electric Utility Contact Information Great Lakes Energy
Avery Dennison LW Series Retroreflective Window Sticker Film Issued: July 2013
 LW series window stickers are designed to be variable printed for use inside or outside the vehicle. Reflective permit stickers provide easy verification for authenticity. Performance: L-S-300C Table IV
PSEG Long Island LLC 111 Eighth Avenue, 13th Floor New York, NY 10011
 PSEG Long Island LLC 111 Eighth Avenue, 13th Floor New York, NY 10011 December 31, 2013 Mr. John D. McMahon Chief Operating Officer Long Island Lighting Company d/b/a/ LIPA 333 Earle Ovington Boulevard,
Load Forecasting at Newfoundland and Labrador Hydro Monthly Report: October 2015.
 \ I newfoundland labrador.hydro a nalcor energy company Hydro Place. 00 Columbus Drive. P.O. Box 00. St. John's. NI Canada AB ( t. 0..00 f. 0..00 www.nh.nl.ca November, 0 The Board of Commissioners of
NOVALYNX CORPORATION MODEL 110-WS-16BP BAROMETRIC PRESSURE SENSOR INSTRUCTION MANUAL
 NOVALYNX CORPORATION MODEL 110-WS-16BP BAROMETRIC PRESSURE SENSOR INSTRUCTION MANUAL REVISION DATE: OCT 2005 Receiving and Unpacking Carefully unpack all components and compare to the packing list. Notify
New Zealand Climate Update No 221, October 2017 Current climate October 2017
 New Zealand Climate Update No 221, October 2017 Current climate October 2017 October 2017 was characterised by higher than normal sea level pressure over New Zealand and the surrounding seas. This consistent
O P E R A T I N G M A N U A L
 OPERATING MANUAL WeatherJack OPERATING MANUAL 1-800-645-1061 The baud rate is 2400 ( 8 bits, 1 stop bit, no parity. Flow control = none) To make sure the unit is on line, send an X. the machine will respond