Discovery of Patterns in Global Earth Science Data using Data Mining. Vipin Kumar
|
|
|
- Emmeline Griffith
- 6 years ago
- Views:
Transcription


1 Discovery of Patterns in Global Earth Science Data using Data Mining Vipin Kumar University of Minnesota Collaborators and Group Members: Shyam Boriah, Sudipto Banerjee, Chris Potter Fred Semazzi, Marc Dunham, Ashish Garg, NASA Ames Nagiza Samatova Joe Knight, Varun Mithal, NC State Michael Steinbach Steve Klooster University of Minnesota California State University Auroop Ganguly ORNL Pang-Ning Tan Michigan State University Research funded by ISET-NOAA, NSF, NASA, Planetary Skin Institute, MN Futures program Vipin Kumar UNCC March 2011
 emissions Consequences can be dire Extreme weather events, regional climate and")


2 Climate Change: The defining issue of our era The planet is warming Multiple lines of evidence Credible link to human GHG (green house gas) emissions Consequences can be dire Extreme weather events, regional climate and ecosystem shifts, abrupt climate change, stress on key resources and critical infrastructures There is an urgency to act Adaptation: Manage the unavoidable Mitigation: Avoid the unmanageable The societal cost of both action and inaction is large Russia Burns, Moscow Chokes NATIONAL GEOGRAPHIC, 2010 Key outstanding science challenge: Actionable predictive insights to credibly inform policy The Vanishing of the Arctic Ice cap ecology.com, 2008


3 Data-Driven Knowledge Discovery in Climate Science From data-poor to data-rich transformation Sensor Observations: Remote sensors like satellites and weather radars as well as in-situ sensors and sensor networks like weather station and radiation measurements Model Simulations: IPCC climate or earth system models as well as regional models of climate and hydrology, along with observed data based model reconstructions Data guided processes can complement hypothesis guided data analysis to develop predictive insights for use by climate scientists, policy makers and community at large. "The world of science has changed... data-intensive science [is] so different that it is worth distinguishing [it] as a new, fourth paradigm for scientific exploration." - Jim Gray

4 Data Mining Challenges Spatio-temporal nature of data spatial and temporal autocorrelation. Multi-scale/Multi-resolution nature Scalability Size of Earth Science data sets can be very large, For example, for each time instance, 2.5 x 2.5 :10K locations for the globe 250m x 250m: ~10 billion 50m x 50m : ~250 billion High-dimensionality Noise and missing values NPP. Pressure.. Precipitation SST NPP Pressure Precipitation SST Long-range spatial dependence Latitude Long memory temporal processes grid cell Longitude Time zone Nonlinear processes, Non-Stationarity Fusing multiple sources of data
5 Illustrative Applications of Data Mining Monitoring of global forest cover Understanding the impact of climate change using data driven analysis.


6 Monitoring Forest Cover Change: Motivation Forests are a critical component of planet. Act as sink of carbon from the atmosphere. Provide ecological diversity and protect soil. Livelihood for millions of people. Massive degradation in forest cover due to logging, conversions to cropland or plantations and natural disasters like fires. Quantifiable knowledge about changes in forest cover is critical for effective management of forest resources Carbon Trading UN REDD: monetary payments for preservation of forests. Purveyors of water, consumers of carbon, treasure-houses of species, the world s forests are ecological miracles. They must not be allowed to vanish. The Economist, Sep 23rd 2010 Illegal deforestation in Para, Brazil. Source: Greenpeace


7 State of the Art in Land cover change detection Primarily based on examining differences between two or more high quality satellite images acquired on different dates. Limitations: High quality observations are infrequent in many parts of the world such as the tropics. Unable to detect changes outside the image acquisition window. Difficult to identify when the change has occurred. Parameters such as rate of change, extent, speed, and pattern of growth cannot be derived. Requires training data for each specific change of interest making it inherently unsuitable for global analysis.
 Time series based approaches can be used for Detection of a")
 massive data sets: 10")
8 Alternate approach: Analyzing Vegetation Time Series Daily Remote Sensing observations are available from MODIS aboard AQUA and TERRA satellites. High temporal frequency (daily for multi-spectral data and bi-weekly for the Vegetation index products like EVI, FPAR) Time series based approaches can be used for Detection of a greater variety of changes. Identifying when the change occurred Characterization of the type of change eg. abrupt vs gradual Near-real time change identification Challenges Poor data quality and high variability Coarse spatial resolution of observations (250 m) massive data sets: 10 billion locations for the globe EVI shows density of plant growth on the globe. EVI time series for a location

, segmented regression Statistics Signal processing Control theory Industrial process control Computer")
 Health Care (Statistical Surveillance) Industrial Processes (process control and quality control) Land Cover Change Parameter Change CUSUM-type approaches, Page [1957], Chernoff")
9 Previous work: Time Series Change Detection Time series change detection problem has been addressed in a variety of fields under different names: E.g. statistical process control, curve segmentation (computer graphics & vision), segmented regression Statistics Signal processing Control theory Industrial process control Computer graphics & vision (curve segmentation) Network Intrusion Detection Fraud Detection (telecommunications, etc.) Health Care (Statistical Surveillance) Industrial Processes (process control and quality control) Land Cover Change Parameter Change CUSUM-type approaches, Page [1957], Chernoff and Zacks [1964], Picard[1985] Segmentation Linear Model: Himberg et al. [2001], Keogh et al. [2001], Hawkins and Merriam [1973] Polynomial Model: Guralnik and Srivastava [1999] Wavelet Model: Sharifzadeh et al. [2005] Predictive Ge and Smyth [2000], Roy, Jin, Lewis and Justice [2005] Subspace Approach Moskvina and Zhigljavsky [2003] Anomaly Detection Chan and Mahoney [2005], Yamanishi and Takeuchi [2002], Ide and Kashima [2004], Chandola, Banerjee and Kumar [2008]
10 Novel Time Series Change Detection Techniques Existing Time series change detection algorithms do not address unique characteristics of eco-system data like noise, missing values, outliers, high degree of variability (across regions, vegetation types, and time). Segmentation based approaches Divide time series into homogenous segments. Boundary of segments become the change points. Useful for detection land cover conversions like forest to cropland, etc. EVI time series for a 250 m by 250 m of land in Iowa, USA that changed from fallow land to agriculture land. Prediction based approaches Build a prediction model for the location using previous observations. Use the deviation of subsequent observations from the predicted value by the model to identify changes/disturbances. Useful for detecting deviations from the normal vegetation model. FPAR time series for a forest fire location in California, USA. S. Boriah, V. Kumar, M. Steinbach, et al., Land cover change detection: a case study, KDD V. Mithal, S. Boriah, A. Garg, M. Steinbach, V. Kumar et al., Monitoring global forest cover using data mining. ACM Transactions on Intelligent Systems and Technology, 2011 (In Press)

11 Monitoring of Global Forest Cover l Automated Land change Evaluation, Reporting and Tracking System (ALERT) Planetary Information System for assessment of ecosystem disturbances: Forest fires, droughts, floods, logging/deforestation, conversion to agriculture l This system will help quantify the carbon impact of these changes Understand the relationship to global climate variability and human activity l Provide ubiquitous web-based access to changes occurring across the globe, creating public awareness
12 Case Study 1: Monitoring Global Forest Cover
")
13 Fires in Northern Latitude (Canada/Russia)


14 Fires in Yukon, Canada: Comparison with Ground Truth

15 Fires in Victoria, Australia : Comparison with Ground Truth l l l l Ground Truth : Fire Polygons from Australian Government Pink : True Positives Orange : False Negatives Blue : False Positives

16 Fires in Victoria : True Positive

17 Fires in Victoria : False Negative

18 Fires in Victoria: False Positive
19 Fires in Victoria : Precision-Recall curve


20 Logging in Canada Logging has produced clear cut areas in British Columbia, which can be identified as regular, generally rectangular shapes. The highly reflective clear cut areas stand out in marked contrast to the dark green forested areas. (Source: NASA)

21 Deforestation in the Amazon Rainforest Brazil Accounts for almost 50% of all humid tropical forest clearing, nearly 4 times that of the next highest country, which accounts for 12.8% of the total.

22 Amazon Deforestation Animation

23 Deforestation in the Amazon Rainforest: Comparison with PRODES PRODES is a system for monitoring deforestation in Brazilian Amazon. The blue polygons are deforestation changes marked by PRODES. Yellow dots are events detected by our algorithm.


24 Gold Mine in Protected Forest, Tanzania
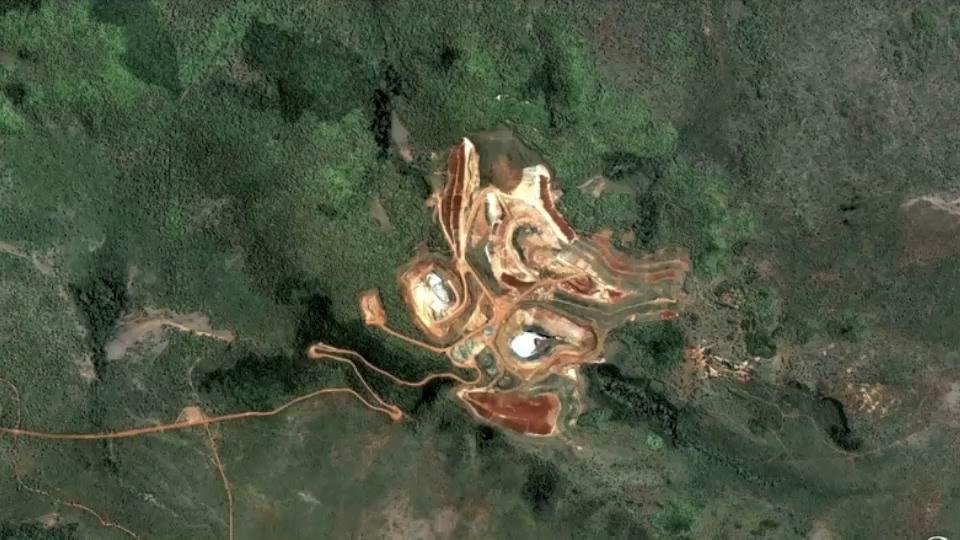
25

26 Reforestation near Guangting Reservoir, China These reforestation events are around Guangting Reservoir, a reservoir around 100 miles away from Beijing. Around 20 years ago, Guanting Reservoir used to play an important role of serving water for people in Beijing and Zhangjiakou. The environment around the reservoir got polluted after years, due to lack of protection. It is located very close to Beijing and plays an important role, therefore the government began to give a comprehensive treatment for this area. Part of the treatment is planting trees around Guangting Reservoir which started in 2003 and is still going on. l l News Articles:


27 Detecting other land cover changes The above methods can be adapted to find other changes reflected in global remote sensing data sets: Reforestation. Floods, expansion and shrinking of water bodies, effects from hurricanes. Changes in agricultural practices. Damage from Hurricane Ike, Source: Houston Chronicle Flood in Queensland, Australia Source: Reuters


28 Shrinking of Lake Chad, Nigeria Lake Chad is economically important, providing water to more than 20 million people living in the four countries that surround it. The lake shrank as much as by 95 percent from about 1963 to 1998 and is continuing to shrink further.(source: UN) Efforts are in progress to divert Ubangi River into Lake Chad.


29 Hurricane Katrina Hurricanes Katrina and Rita hit the Louisiana coast on August and September The hurricanes transformed 217 square miles of Louisiana s coastal land to water by storm surge.
, which")

30 Flooding along Ob River, Russia The river flows north and is blocked by ice (top right), which causes flooding. Under normal circumstances the river flows into the Gulf of Ob. Source: NASA Earth Observatory

 Shifting cropping patterns (multiple crops, change in crop, inter-cropping). 280 farmers were forced to abandon farms in Zimbabwe during political conflict between 2004 and 2008.")
31 Agriculture Monitoring For Global Food Security Food demand will dramatically increase in the next thirty years with rising global population. Farm abandonment in Zimbabwe, Policy makers and NGOs require large-scale intelligence capabilities to: Manage food production with targeted intensification while minimizing environmental impact. Crisis response Adaptation to climate change Land-cover changes of interest: Change in yield (crop failures, intensification, etc.) Shifting cropping patterns (multiple crops, change in crop, inter-cropping). 280 farmers were forced to abandon farms in Zimbabwe during political conflict between 2004 and The country, once the breadbasket of Africa, has also been facing shortages of fertilizer and seed. Source: CBC NEWS March 2010.
32 Application of a Global Land Cover Monitoring System Risk Analysis Input to carbon trading United Nations REDD(Reducing Emissions from Deforestation and Forest Degradation) program for protecting forests. Inform Policy Makers and Public at large Climate Change Research What is the impact of climate change on ecosystems? What is the relationship of bio-fuel subsidy to deforestation dynamics and greenhouse gas emissions?
33 ALERT Platform
![Impact on REDD+ The [Peru] government needs to spend more than $100m a year on high-resolution satellite pictures of its billions of trees.](/docs-images/79/80070260/images/34-0.jpg "But a computing facility developed by the Planetary Skin Institute (PSI) might help cut that budget.")
34 Impact on REDD+ The [Peru] government needs to spend more than $100m a year on high-resolution satellite pictures of its billions of trees. But a computing facility developed by the Planetary Skin Institute (PSI) might help cut that budget. ALERTS, which was launched at Cancún, uses data-mining algorithms developed at the University of Minnesota and a lot of computing power to spot places where land use has changed. - The Economist 12/16/2010


35 What is the impact of climate change on ecosystems? Warmer Winters in Canada makes it a net emitter of Carbon Winters have not been cold enough to kill off mountain beetles Insect Damage and Fires Are Causally Related 2006 Fires in Indonesia were worsened by el Nino says NASA Fire in Yukon Province, Canada Source: CCIAP Project, NASA Peaks of CO coincide with warm phases of El Nino


36 What is the relationship between bio-fuel subsidy and deforestation dynamics? Biofuel Increased corn production A tiny sliver of transitional rainforest is surrounded by hectares of soybean fields in Mato Grosso, Brazil Source: Time, Climate Central

")
 4 th Assessment Report.")
37 Anomalies from (K) Understanding Climate Change Using Physics based Models General Circulation Models: Mathematical models with physical equations based on fluid dynamics Cell Parameterization and non-linearity of differential equations are sources for uncertainty! Clouds Land Ocean Projection of temperature increase under different Special Report on Emissions Scenarios (SRES) by 24 different GCM configurations from 16 research centers used in the Intergovernmental Panel on Climate Change (IPCC) 4 th Assessment Report. Figure Courtesy: ORNL A1B: integrated world balance of fuels A2: divided world local fuels B1: integrated world environmentally conscious IPCC (2007)


 NSF Expedition Project aim: A new and transformative data-driven approach that")


![.. data-intensive science [is] a new, fourth paradigm for scientific exploration.](/docs-images/79/80070260/images/38-8.jpg "\" - Jim Gray Science Contributions Data-guided uncertainty reduction by blending physics models")

38 Understanding Climate Change - A Data-Driven Approach Disagreement between IPCC models Physics-based models are essential but not adequate Models make relatively reliable predictions at global scale for ancillary variables such as temperature But provide the least reliable predictions for variables that are crucial for impact assessment such as regional precipitation The sad truth of climate science is that the most crucial information is the least reliable (Nature, 2010) NSF Expedition Project aim: A new and transformative data-driven approach that complements physics-based models and improves prediction of the potential impacts of climate change Transformative Computer Science Research Predictive Modeling Enable predictive modeling of typical and extreme behavior from multivariate spatio-temporal data Relationship Mining Enable discovery of complex dependence structures: non-linear associations or long range spatial dependencies Complex Networks Enable studying of collective behavior of interacting eco-climate systems High Performance Computing Enable efficient large-scale spatiotemporal analytics on exascale HPC platforms with complex memory hierarchies Regional hydrology exhibits large variations among major IPCC model projections... data-intensive science [is] a new, fourth paradigm for scientific exploration." - Jim Gray Science Contributions Data-guided uncertainty reduction by blending physics models and data analytics A new understanding of the complex nature of the Earth system and mechanisms contributing to adverse consequences of climate change Success Metric Inclusion of data-driven analysis as a standard part of climate projections and impact assessment (e.g., for IPCC)
39 Understanding climate variability using Dipole Analysis Dipoles represent a class of teleconnections characterized by anomalies of opposite polarity at two locations at the same time.
40 Understanding climate variability using Dipole Analysis Dipoles represent a class of teleconnections characterized by anomalies of opposite polarity at two locations at the same time.

41 Understanding climate variability using Dipole Analysis Dipoles represent a class of teleconnections characterized by anomalies of opposite polarity at two locations at the same time. Southern Oscillation: Tahiti and Darwin North Atlantic Oscillation: Iceland and Azores North Atlantic Oscillation: Iceland and Azores
42 Importance of dipoles Crucial for understanding the climate system, especially for weather and climate forecast simulations within the context of global climate change. NAO influences sea level pressure (SLP) over most of the Northern Hemisphere. Strong positive NAO phase (strong Islandic Low and strong Azores High) are associated with above-average temperatures in the eastern US. SOI dominates tropical climate with floodings over East Asia and Australia, and droughts over America. Also has influence on global climate. Correlation of Land temperature anomalies with NAO Correlation of Land temperature anomalies with SOI
43 List of Well Known Climate Indices Index Description SOI Southern Oscillation Index: Measures the SLP anomalies between Darwin and Tahiti NAO North Atlantic Oscillation: Normalized SLP differences between Ponta Delgada, Azores and Stykkisholmur, Iceland AO Arctic Oscillation: Defined as the first principal component of SLP northward of 20 N PDO Pacific Decadel Oscillation: Derived as the leading principal component of monthly SST anomalies in the North Pacific Ocean, poleward of 20 N WP Western Pacific: Represents a low-frequency temporal function of the zonal dipole' SLP spatial pattern involving the Kamchatka Peninsula, southeastern Asia and far western tropical and subtropical North Pacific PNA Pacific North American: SLP Anomalies over the North Pacific Ocean and the North America AAO Antarctic Oscillation: Defined as the first principal component of SLP southward of 20 S NINO1+2 Sea surface temperature anomalies in the region bounded by 80 W-90 W and 0-10 S NINO3 Sea surface temperature anomalies in the region bounded by 90 W-150 W and 5 S-5 N NINO3.4 Sea surface temperature anomalies in the region bounded by 120 W-170 W and 5 S-5 N NINO4 Sea surface temperature anomalies in the region bounded by 150 W-160 W and 5 S-5 N Discovered primarily by human observation


44 Studying Global Climate using Network Representation Constructing Climate Network Area weighted degree distribution of edges with abs correlation > 0.5 Nodes in the Graph correspond to grid points on the globe. Edge weight corresponds to correlation between the two anomaly timeseries Area weighted degree distribution of negative edges Tsonis, et al, Steinbach et al, Donges et al, Steinhaeuser et al.
45 Challenges in Identifying Dipoles from Climate Network Not every negative edge can be labeled as a dipole as The number of negative edges on the globe is very high Single edge might be spurious Many edges come of the same region. Distribution of edges around the Earth Need to find sufficiently large regions sharing negative edges. Too large region will dilute the climate phenomenon Distribution of negative edges

46 Shared Reciprocal Nearest Neighbor Approach Shared Nearest Neighbor (SNN) defines similarity between pair of objects based upon the list of k-nearest neighbors. Additional Reciprocity constraint imposed, i.e. two objects must lie on each others nearest neighbor list. Positive and Negative densities computed by looking at the k nearest neighbors in the positive and the negative correlations. Overall SRNN density is defined as the product of the two densities. After spatial clustering over SRNN density, dipoles are identified as cluster pairs with negative correlation between them. Shared Reciprocal Nearest Neighbors (SRNN) Density Dipoles from SRNN density
47 Summary of Results Most known dipoles discovered Location based definition possible for some known indices that are defined using EOF analysis. New dipoles may represent previously unknown phenomenon. Dynamic versions are often better than static Provide an alternate method to analyze GCM results.
48 Detection of Global Dipole Structure NCEP (National Centers for Environmental Prediction) Reanalysis Data Most known dipoles discovered Location based definition possible for some known indices that are defined using EOF analysis. New dipoles may represent previously unknown phenomenon.

49 Detection of Global Dipole Structure NCEP (National Centers for Environmental Prediction) Reanalysis Data Most known dipoles discovered Location based definition possible for some known indices that are defined using EOF analysis. New dipoles may represent previously unknown phenomenon.
50 Detection of Global Dipole Structure NCEP (National Centers for Environmental Prediction) Reanalysis Data Most known dipoles discovered Location based definition possible for some known indices that are defined using EOF analysis. New dipoles may represent previously unknown phenomenon.

51 Static vs Dynamic NAO Index: Impact on land temperature From the top figures, we see that both the patterns are similar but the dynamic index generates a stronger impact on land temperature anomalies as compared to the static index. Figure to the right shows the aggregate area weighted correlation for the all the network periods.
52 Static vs Dynamic SO Index: Impact on land temperature From the top figures, we see that both the patterns are similar but the dynamic index generates a stronger impact on land temperature anomalies as compared to the static index. Figure to the right shows the aggregate area weighted correlation for the all the network periods. Dynamic Index helps in studying the changes in dipole structure over a period of time.
53 Comparison of Climate Models Hindcast data Useful for quantifying the performance of different climate models. Strength of the dipoles varies in different climate models. SOI is not captured by all models. Fig. shows that both the models show most dipoles as NCEP, but SOI is only simulated by GFDL 2.1 and not by BCM 2.0. Helpful for making regional prediction from models


54 Comparison of Climate Models Hindcast data Forecast data Dipole connections in forecast data provide insights about dipole activity in future. For e.g. both forecasts for show continuing dipole activity in the extratropics but decreased activity in the tropics. SOI activity is reduced in GFDL2.1 and activity over Africa is reduced in BCM 2.0. This is consistent with archaeological data from 3 mil. years ago, when climate was 2-3 C warmer (Shukla, et. al).
55 Summary Data driven discovery methods hold great promise for advancement in the mining of climate and ecosystem data. Scale and nature of the data offer numerous challenges and opportunities for research in mining large datasets. "The world of science has changed... data-intensive science [is] so different that it is worth distinguishing [it] as a new, fourth paradigm for scientific exploration." - Jim Gray
56 Team Members and Collaborators Michael Steinbach, Shyam Boriah, Rohit Gupta, Gang Fang, Gowtham Atluri, Varun Mithal, Ashish Garg, Vanja Paunic, Sanjoy Dey, Jaya Kawale, Marc Dunham, Divya Alla, Ivan Brugere, Vikrant Krishna, Yashu Chamber, Xi Chen, James Faghmous, Arjun Kumar, Stefan Liess Sudipto Banerjee, Chris Potter, Fred Semazzi, Nagiza Samatova, Steve Klooster, Auroop Ganguly, Pang-Ning Tan, Joe Knight, Arindam Banerjee, Peter Snyder Project website Climate and Eco-system:
NSF Expeditions in Computing. Understanding Climate Change: A Data Driven Approach. Vipin Kumar University of Minnesota
 NSF Expeditions in Computing Understanding Climate Change: A Data Driven Approach Vipin Kumar University of Minnesota kumar@cs.umn.edu www.cs.umn.edu/~kumar Vipin Kumar UCC Aug 15, 2011 Climate Change:
Application of Clustering to Earth Science Data: Progress and Challenges
 Application of Clustering to Earth Science Data: Progress and Challenges Michael Steinbach Shyam Boriah Vipin Kumar University of Minnesota Pang-Ning Tan Michigan State University Christopher Potter NASA
Finding Climate Indices and Dipoles Using Data Mining
 Finding Climate Indices and Dipoles Using Data Mining Michael Steinbach, Computer Science Contributors: Jaya Kawale, Stefan Liess, Arjun Kumar, Karsten Steinhauser, Dominic Ormsby, Vipin Kumar Climate
Discovering Dynamic Dipoles in Climate Data
 Discovering Dynamic Dipoles in Climate Data Downloaded 11/22/17 to 37.44.194.188. Redistribution subject to SIAM license or copyright; see http://www.siam.org/journals/ojsa.php Abstract Jaya Kawale Michael
Mining Relationships in Spatio-temporal Datasets
 Mining Relationships in Spatio-temporal Datasets A DISSERTATION SUBMITTED TO THE FACULTY OF THE GRADUATE SCHOOL OF THE UNIVERSITY OF MINNESOTA BY Jaya Kawale IN PARTIAL FULFILLMENT OF THE REQUIREMENTS
Data Mining for the Discovery of Ocean Climate Indices *
 Data Mining for the Discovery of Ocean Climate Indices * Michael Steinbach + Pang-Ning Tan + Vipin Kumar + Steven Klooster +++ Christopher Potter ++ + Department of Computer Science and Engineering, Army
Data Mining for the Discovery of Ocean Climate Indices *
 Data Mining for the Discovery of Ocean Climate Indices * Michael Steinbach + Pang-Ning Tan + Vipin Kumar + Steven Klooster +++ Christopher Potter ++ + Department of Computer Science and Engineering, Army
Mining Climate Data. Michael Steinbach Vipin Kumar University of Minnesota /AHPCRC
 Mining Climate Data Michael Steinbach Vipin Kumar University of Minnesota /AHPCRC Collaborators: G. Karypis, S. Shekhar (University of Minnesota/AHPCRC) V. Chadola, S. Iyer, G. Simon, P. Zhang (UM/AHPCRC)
INCORPORATING NATURAL VARIATION OF TIME SERIES IN THE CHANGE DETECTION FRAMEWORK TO IDENTIFY ABRUPT FOREST DISTURBANCES
 INCORPORATING NATURAL VARIATION OF TIME SERIES IN THE CHANGE DETECTION FRAMEWORK TO IDENTIFY ABRUPT FOREST DISTURBANCES VARUN MITHAL*, ASHISH GARG*, IVAN BRUGERE*, SHYAM BORIAH*, VIPIN KUMAR*, MICHAEL
Discovery of Climate Indices using Clustering
 Discovery of Climate Indices using Clustering Michael Steinbach Pang-Ning Tan Vipin Kumar Department of Computer Science and Engineering University of Minnesota steinbac,ptan,kumar@cs.umn.edu Steven Klooster
Future Climate Change
 Future Climate Change How do you know whether to trust a prediction about the future? All predictions are based on global circulation models (GCMs, AOGCMs) - model accuracy is verified by its ability to
Stefan Liess University of Minnesota Saurabh Agrawal, Snigdhansu Chatterjee, Vipin Kumar University of Minnesota
 Introducing and Finding Tripoles: A Connection Between Central Asia and the Tropical Pacific Stefan Liess University of Minnesota liess@umn.edu Saurabh Agrawal, Snigdhansu Chatterjee, Vipin Kumar University
Chapter Introduction. Earth. Change. Chapter Wrap-Up
 Chapter Introduction Lesson 1 Lesson 2 Lesson 3 Climates of Earth Chapter Wrap-Up Climate Cycles Recent Climate Change What is climate and how does it impact life on Earth? What do you think? Before you
THE CANADIAN CENTRE FOR CLIMATE MODELLING AND ANALYSIS
 THE CANADIAN CENTRE FOR CLIMATE MODELLING AND ANALYSIS As Canada s climate changes, and weather patterns shift, Canadian climate models provide guidance in an uncertain future. CANADA S CLIMATE IS CHANGING
Observed Climate Variability and Change: Evidence and Issues Related to Uncertainty
 Observed Climate Variability and Change: Evidence and Issues Related to Uncertainty David R. Easterling National Climatic Data Center Asheville, North Carolina Overview Some examples of observed climate
Construction and Analysis of Climate Networks
 Construction and Analysis of Climate Networks Karsten Steinhaeuser University of Minnesota Workshop on Understanding Climate Change from Data Minneapolis, MN August 15, 2011 Working Definitions Knowledge
Global Circulation. Local weather doesn t come from all directions equally Everyone s weather is part of the global circulation pattern
 Global Circulation Local weather doesn t come from all directions equally Everyone s weather is part of the global circulation pattern Wind rose shows % frequency of winds around the compass 1 Global Circulation
World Geography Chapter 3
 World Geography Chapter 3 Section 1 A. Introduction a. Weather b. Climate c. Both weather and climate are influenced by i. direct sunlight. ii. iii. iv. the features of the earth s surface. B. The Greenhouse
Website Lecture 3 The Physical Environment Part 1
 Website http://websites.rcc.edu/halama Lecture 3 The Physical Environment Part 1 1 Lectures 3 & 4 1. Biogeochemical Cycling 2. Solar Radiation 3. The Atmosphere 4. The Global Ocean 5. Weather and Climate
Climate Outlook for March August 2018
 The APEC CLIMATE CENTER Climate Outlook for March August 2018 BUSAN, 26 February 2018 The synthesis of the latest model forecasts for March to August 2018 (MAMJJA) from the APEC Climate Center (APCC),
TROPICAL-EXTRATROPICAL INTERACTIONS
 Notes of the tutorial lectures for the Natural Sciences part by Alice Grimm Fourth lecture TROPICAL-EXTRATROPICAL INTERACTIONS Anomalous tropical SST Anomalous convection Anomalous latent heat source Anomalous
Global Climate Patterns and Their Impacts on North American Weather
 Global Climate Patterns and Their Impacts on North American Weather By Julie Malmberg and Jessica Lowrey, Western Water Assessment Introduction This article provides a broad overview of various climate
Teleconnections and Climate predictability
 Southern Hemisphere Teleconnections and Climate predictability Carolina Vera CIMA/CONICET University of Buenos Aires, UMI IFAECI/CNRS Buenos Aires, Argentina Motivation Large scale circulation variability
Ocean in Motion 7: El Nino and Hurricanes!
 Ocean in Motion 7: El Nino and Hurricanes! A. Overview 1. Ocean in Motion -- El Nino and hurricanes We will look at the ocean-atmosphere interactions that cause El Nino and hurricanes. Using vocabulary
CHAPTER 13 WEATHER ANALYSIS AND FORECASTING MULTIPLE CHOICE QUESTIONS
 CHAPTER 13 WEATHER ANALYSIS AND FORECASTING MULTIPLE CHOICE QUESTIONS 1. The atmosphere is a continuous fluid that envelops the globe, so that weather observation, analysis, and forecasting require international
Chapter outline. Reference 12/13/2016
 Chapter 2. observation CC EST 5103 Climate Change Science Rezaul Karim Environmental Science & Technology Jessore University of science & Technology Chapter outline Temperature in the instrumental record
Discovery of Patterns in the Global Climate System using Data Mining
 Discovery of Patterns in the Global Climate System using Data Mining Vipin Kumar University of Minnesota kumar@cs.umn.edu www.cs.umn.edu/~kumar Collaborators: Chris Potter NASA Ames Steve Klooster California
Figure 1. Carbon dioxide time series in the North Pacific Ocean (
 Evidence #1: Since 1950, Earth s atmosphere and oceans have changed. The amount of carbon released to the atmosphere has risen. Dissolved carbon in the ocean has also risen. More carbon has increased ocean
Deke Arndt, Chief, Climate Monitoring Branch, NOAA s National Climatic Data Center
 Thomas R. Karl, L.H.D., Director, NOAA s National Climatic Data Center, and Chair of the Subcommittee on Global Change Research Peter Thorne, PhD, Senior Scientist, Cooperative Institute for Climate and
Module 3, Investigation 1: Briefing 2 The ENSO game: Predicting and managing for El Niño and La Niña
 Part 5. The ENSO game How can prediction help avoid ENSO s tragic human consequences? Scientists from around the world are involved in forecasting, with computer models and sophisticated measurements,
Broader Impacts of the Application of the Combined Use of Data-Driven Methodology and Physics-Based Weather and Climate Prediction Models
 Broader Impacts of the Application of the Combined Use of Data-Driven Methodology and Physics-Based Weather and Climate Prediction Models Professor Fredrick Semazzi North Carolina State University Department
Exploring Climate Patterns Embedded in Global Climate Change Datasets
 Exploring Climate Patterns Embedded in Global Climate Change Datasets James Bothwell, May Yuan Department of Geography University of Oklahoma Norman, OK 73019 jamesdbothwell@yahoo.com, myuan@ou.edu Exploring
SEASONAL CLIMATE OUTLOOK VALID FOR JULY-AUGUST- SEPTEMBER 2013 IN WEST AFRICA, CHAD AND CAMEROON
 SEASONAL CLIMATE OUTLOOK VALID FOR JULY-AUGUST- SEPTEMBER 2013 IN WEST AFRICA, CHAD AND CAMEROON May 29, 2013 ABUJA-Federal Republic of Nigeria 1 EXECUTIVE SUMMARY Given the current Sea Surface and sub-surface
Graphical Models for Climate Data Analysis: Drought Detection and Land Variable Regression
 for Climate Data Analysis: Drought Detection and Land Variable Regression Arindam Banerjee banerjee@cs.umn.edu Dept of Computer Science & Engineering University of Minnesota, Twin Cities Joint Work with:
Weather and climate outlooks for crop estimates
 Weather and climate outlooks for crop estimates CELC meeting 2016-04-21 ARC ISCW Observed weather data Modeled weather data Short-range forecasts Seasonal forecasts Climate change scenario data Introduction
INCREASING HURRICANES, DROUGHTS, & WILDFIRES. Paul H. Carr AF Research Laboratory Emeritus
 INCREASING HURRICANES, DROUGHTS, & WILDFIRES Paul H. Carr AF Research Laboratory Emeritus www.mirrorofnature.org INCREASING HURRICANES, DROUGHTS, & WILDFIRES By Paul H. Carr, NES American Physical Society,
The North Atlantic Oscillation: Climatic Significance and Environmental Impact
 1 The North Atlantic Oscillation: Climatic Significance and Environmental Impact James W. Hurrell National Center for Atmospheric Research Climate and Global Dynamics Division, Climate Analysis Section
Physical Geography: Patterns, Processes, and Interactions, Grade 11, University/College Expectations
 Geographic Foundations: Space and Systems SSV.01 explain major theories of the origin and internal structure of the earth; Page 1 SSV.02 demonstrate an understanding of the principal features of the earth
Climate Outlook for December 2015 May 2016
 The APEC CLIMATE CENTER Climate Outlook for December 2015 May 2016 BUSAN, 25 November 2015 Synthesis of the latest model forecasts for December 2015 to May 2016 (DJFMAM) at the APEC Climate Center (APCC),
Name Date Class. well as the inland, found near the Tropics. 4. In the, or the regions near the Equator, you may find a lush
 WATER, CLIMATE, AND VEGETATION Vocabulary Activity DIRECTIONS: Fill in the Blanks Select a term from below to complete each of the following sentences. CHAPTER 1. The constant movement of water, a process
Lecture 8: Natural Climate Variability
 Lecture 8: Natural Climate Variability Extratropics: PNA, NAO, AM (aka. AO), SAM Tropics: MJO Coupled A-O Variability: ENSO Decadal Variability: PDO, AMO Unforced vs. Forced Variability We often distinguish
Observed State of the Global Climate
 WMO Observed State of the Global Climate Jerry Lengoasa WMO June 2013 WMO Observations of Changes of the physical state of the climate ESSENTIAL CLIMATE VARIABLES OCEANIC ATMOSPHERIC TERRESTRIAL Surface
and Weather extremes Tropical cyclones Today and in the Future Greg Holland c3we.ucar.edu
 Tropical cyclones and Weather extremes Today and in the Future c3we.ucar.edu Greg Holland (gholland@ucar.edu) Supported by NSF, Willis Re, IAG, and Zurich Insurance 1 Topics State of the Climate and its
Analysis of Fall Transition Season (Sept-Early Dec) Why has the weather been so violent?
 Why has the weather been so violent?") WEATHER TOPICS Analysis of Fall Transition Season (Sept-Early Dec) 2009 Why has the weather been so violent? As can be seen by the following forecast map, the Fall Transition and early Winter Season of
WEATHER TOPICS Analysis of Fall Transition Season (Sept-Early Dec) 2009 Why has the weather been so violent? As can be seen by the following forecast map, the Fall Transition and early Winter Season of
5th social studies geography (5thsocstud_geography)
") Name: Date: 1. Many of the Native Americans who lived on the Great Plains were nomadic people. Why did they move from place to place? A. They were finding new areas to mine. B. They were looking for fertile
Name: Date: 1. Many of the Native Americans who lived on the Great Plains were nomadic people. Why did they move from place to place? A. They were finding new areas to mine. B. They were looking for fertile
3. Carbon Dioxide (CO 2 )
") 3. Carbon Dioxide (CO 2 ) Basic information on CO 2 with regard to environmental issues Carbon dioxide (CO 2 ) is a significant greenhouse gas that has strong absorption bands in the infrared region and
3. Carbon Dioxide (CO 2 ) Basic information on CO 2 with regard to environmental issues Carbon dioxide (CO 2 ) is a significant greenhouse gas that has strong absorption bands in the infrared region and
1 What Is Climate? TAKE A LOOK 2. Explain Why do areas near the equator tend to have high temperatures?
 CHAPTER 17 1 What Is Climate? SECTION Climate BEFORE YOU READ After you read this section, you should be able to answer these questions: What is climate? What factors affect climate? How do climates differ
Monthly overview. Rainfall
 Monthly overview 1-10 August 2018 The month started off with light showers over the Western Cape. A large cold front made landfall around the 5th of the month. This front was responsible for good rainfall
What is the IPCC? Intergovernmental Panel on Climate Change
 IPCC WG1 FAQ What is the IPCC? Intergovernmental Panel on Climate Change The IPCC is a scientific intergovernmental body set up by the World Meteorological Organization (WMO) and by the United Nations
Climatic and Ecological Conditions in the Klamath Basin of Southern Oregon and Northern California: Projections for the Future
 Climatic and Ecological Conditions in the Klamath Basin of Southern Oregon and Northern California: Projections for the Future A Collaborative Effort by: CLIMATE LEADERSHIP INITIATIVE INSTITUTE FOR A SUSTAINABLE
Statistical Science: Contributions to the Administration s Research Priority on Climate Change
 Statistical Science: Contributions to the Administration s Research Priority on Climate Change April 2014 A White Paper of the American Statistical Association s Advisory Committee for Climate Change Policy
HOW GEOGRAPHY AND GEOLOGY AFFECT BIOLOGICAL DIVERSITY
 HOW GEOGRAPHY AND GEOLOGY AFFECT BIOLOGICAL DIVERSITY Factors Affecting Extinction Rates Natural Factors Climate change Cataclysmic event (volcano, earthquake) Human Activities Habitat Loss/Fragmentation
1990 Intergovernmental Panel on Climate Change Impacts Assessment
 1990 Intergovernmental Panel on Climate Change Impacts Assessment Although the variability of weather and associated shifts in the frequency and magnitude of climate events were not available from the
WMO Statement on the State of the Global Climate Preliminary conclusions for 2018 and WMO Greenhouse Bulletin
 WMO Statement on the State of the Global Climate Preliminary conclusions for 2018 and WMO Greenhouse Bulletin Dr Elena Manaenkova Deputy Secretary General World Meteorological Organisation Statement on
Climate Outlook for October 2017 March 2018
 The APEC CLIMATE CENTER Climate Outlook for October 2017 March 2018 BUSAN, 25 September 2017 The synthesis of the latest model forecasts for October 2017 to March 2018 (ONDJFM) from the APEC Climate Center
Drought Impacts in the Southern Great Plains. Mark Shafer University of Oklahoma Norman, OK
 Drought Impacts in the Southern Great Plains Mark Shafer University of Oklahoma Norman, OK Causes of Drought: Large-Scale, Stationary High Pressure Air rotates clockwise around high pressure steers storms
CLIMATE READY BOSTON. Climate Projections Consensus ADAPTED FROM THE BOSTON RESEARCH ADVISORY GROUP REPORT MAY 2016
 CLIMATE READY BOSTON Sasaki Steering Committee Meeting, March 28 nd, 2016 Climate Projections Consensus ADAPTED FROM THE BOSTON RESEARCH ADVISORY GROUP REPORT MAY 2016 WHAT S IN STORE FOR BOSTON S CLIMATE?
Greening of Arctic: Knowledge and Uncertainties
 Greening of Arctic: Knowledge and Uncertainties Jiong Jia, Hesong Wang Chinese Academy of Science jiong@tea.ac.cn Howie Epstein Skip Walker Moscow, January 28, 2008 Global Warming and Its Impact IMPACTS
Our climate system is based on the location of hot and cold air mass regions and the atmospheric circulation created by trade winds and westerlies.
 CLIMATE REGIONS Have you ever wondered why one area of the world is a desert, another a grassland, and another a rainforest? Or have you wondered why are there different types of forests and deserts with
ATMOSPHERIC MODELLING. GEOG/ENST 3331 Lecture 9 Ahrens: Chapter 13; A&B: Chapters 12 and 13
 ATMOSPHERIC MODELLING GEOG/ENST 3331 Lecture 9 Ahrens: Chapter 13; A&B: Chapters 12 and 13 Agenda for February 3 Assignment 3: Due on Friday Lecture Outline Numerical modelling Long-range forecasts Oscillations
Climate Outlook for March August 2017
 The APEC CLIMATE CENTER Climate Outlook for March August 2017 BUSAN, 24 February 2017 Synthesis of the latest model forecasts for March to August 2017 (MAMJJA) at the APEC Climate Center (APCC), located
Agricultural Outlook Forum Presented: February 17, 2006 THE SCIENCE BEHIND THE ATLANTIC HURRICANES AND SEASONAL PREDICTIONS
 Agricultural Outlook Forum Presented: February 17, 2006 THE SCIENCE BEHIND THE ATLANTIC HURRICANES AND SEASONAL PREDICTIONS Gerald Bell Meteorologist, National Centers for Environmental Prediction NOAA,
Name: Date: Hour: Comparing the Effects of El Nino & La Nina on the Midwest (E4.2c)
") Purpose: Comparing the Effects of El Nino & La Nina on the Midwest (E4.2c) To compare the effects of El Nino and La Nina on the Midwest United States. Background Knowledge: The El Nino-Southern Oscillation
Purpose: Comparing the Effects of El Nino & La Nina on the Midwest (E4.2c) To compare the effects of El Nino and La Nina on the Midwest United States. Background Knowledge: The El Nino-Southern Oscillation
Seamless weather and climate for security planning
 Seamless weather and climate for security planning Kirsty Lewis, Principal Climate Change Consultant, Met Office Hadley Centre 28 June 2010 Global Climate Models Mitigation timescale changes could be avoided
First-Order Draft Chapter 3 IPCC WG1 Fourth Assessment Report
 0 Figure... Estimates of linear trends in significant wave height (cm decade - ) for the regions along the major ship routes for the global ocean for the period 0 00. Trends are shown only for the locations
Anomaly Construction in Climate Data : Issues and Challenges
 Anomaly Construction in Climate Data : Issues and Challenges Jaya Kawale*, Snighansu Chatterjee, Arjun Kumar, Stefan Liess, Michael Steinbach and Vipin Kumar University of Minnesota Overview What is Anomaly
IMPACTS OF A WARMING ARCTIC
 The Earth s Greenhouse Effect Most of the heat energy emitted from the surface is absorbed by greenhouse gases which radiate heat back down to warm the lower atmosphere and the surface. Increasing the
Stochastic Hydrology. a) Data Mining for Evolution of Association Rules for Droughts and Floods in India using Climate Inputs
 Data Mining for Evolution of Association Rules for Droughts and Floods in India using Climate Inputs") Stochastic Hydrology a) Data Mining for Evolution of Association Rules for Droughts and Floods in India using Climate Inputs An accurate prediction of extreme rainfall events can significantly aid in policy
Stochastic Hydrology a) Data Mining for Evolution of Association Rules for Droughts and Floods in India using Climate Inputs An accurate prediction of extreme rainfall events can significantly aid in policy
Monitoring and Prediction of Climate Extremes
 Monitoring and Prediction of Climate Extremes Stephen Baxter Meteorologist, Climate Prediction Center NOAA/NWS/NCEP Deicing and Stormwater Management Conference ACI-NA/A4A Arlington, VA May 19, 2017 What
How we know the world has warmed
 How we know the world has warmed A comprehensive review of key climate indicators confirms the world is warming and the past decade was the warmest on record. More than 3 scientists from 48 countries analyzed
Climate Prediction Center Research Interests/Needs
 Climate Prediction Center Research Interests/Needs 1 Outline Operational Prediction Branch research needs Operational Monitoring Branch research needs New experimental products at CPC Background on CPC
Warm Up Vocabulary Check
 Warm Up Vocabulary Check Surface current Coriolis Effect global winds upwelling Gulf Stream deep current climate El Nino convection current continental deflection 1.The apparent curving of the path of
Challenges to Improving the Skill of Weekly to Seasonal Climate Predictions. David DeWitt with contributions from CPC staff
 Challenges to Improving the Skill of Weekly to Seasonal Climate Predictions David DeWitt with contributions from CPC staff 1 Outline CPC Background Prediction, monitoring, diagnostics, and climate services
Implications of Climate Change on Long Lead Forecasting and Global Agriculture. Ray Motha
 Implications of Climate Change on Long Lead Forecasting and Global Agriculture Ray Motha Source: http://www.coaps.fsu.edu/lib/climatoons/toon38.shtml ENSO Teleconnections 30 Observed Monthly Sea Surface
Activity 2.2: Recognizing Change (Observation vs. Inference)
") Activity 2.2: Recognizing Change (Observation vs. Inference) Teacher Notes: Evidence for Climate Change PowerPoint Slide 1 Slide 2 Introduction Image 1 (Namib Desert, Namibia) The sun is on the horizon
Activity 2.2: Recognizing Change (Observation vs. Inference) Teacher Notes: Evidence for Climate Change PowerPoint Slide 1 Slide 2 Introduction Image 1 (Namib Desert, Namibia) The sun is on the horizon
Hurricanes. Cause: a low pressure storm system over warm ocean water. Effect: potential massive widespread destruction and flooding.
 Hurricanes Hurricanes Cause: a low pressure storm system over warm ocean water. Effect: potential massive widespread destruction and flooding. Hurricanes also known as: cyclone (Indian Ocean) or typhoon
The ENSEMBLES Project
 The ENSEMBLES Project Providing ensemble-based predictions of climate changes and their impacts by Dr. Chris Hewitt Abstract The main objective of the ENSEMBLES project is to provide probabilistic estimates
The Canadian Climate Model 's Epic Failure November 2016
 The Canadian Climate Model 's Epic Failure November 2016 By: Ken Gregory The Canadian Centre for Climate Modeling and Analysis located at the University of Victoria in British Columbia submitted five runs
The Effect of the North Atlantic Oscillation On Atlantic Hurricanes Michael Barak-NYAS-Mentors: Dr. Yochanan Kushnir, Jennifer Miller
 The Effect of the North Atlantic Oscillation On Atlantic Hurricanes Michael Barak-NYAS-Mentors: Dr. Yochanan Kushnir, Jennifer Miller Abstract Tropical cyclone behavior in the Gulf of Mexico (GM) and East
Ocean s Influence on Weather and Climate
 Earth is often called the Blue Planet because so much of its surface (about 71%) is covered by water. Of all the water on Earth, about 96.5%, is held in the world s oceans. As you can imagine, these oceans
CHAPTER 1: INTRODUCTION
 CHAPTER 1: INTRODUCTION There is now unequivocal evidence from direct observations of a warming of the climate system (IPCC, 2007). Despite remaining uncertainties, it is now clear that the upward trend
1 What Is Climate? TAKE A LOOK 2. Explain Why do areas near the equator tend to have high temperatures?
 CHAPTER 17 1 What Is Climate? SECTION Climate BEFORE YOU READ After you read this section, you should be able to answer these questions: What is climate? What factors affect climate? How do climates differ
North Pacific Climate Overview N. Bond (UW/JISAO), J. Overland (NOAA/PMEL) Contact: Last updated: September 2008
, J. Overland (NOAA/PMEL) Contact: Last updated: September 2008") North Pacific Climate Overview N. Bond (UW/JISAO), J. Overland (NOAA/PMEL) Contact: Nicholas.Bond@noaa.gov Last updated: September 2008 Summary. The North Pacific atmosphere-ocean system from fall 2007
North Pacific Climate Overview N. Bond (UW/JISAO), J. Overland (NOAA/PMEL) Contact: Nicholas.Bond@noaa.gov Last updated: September 2008 Summary. The North Pacific atmosphere-ocean system from fall 2007
Effects of Sea Level Rise in Florida
 Abstract International Research Journal of Earth Sciences ISSN 2321 2527 Int. Res.J. Earth Sci. Effects of Sea Level Rise in Florida Praveen Khanna, Udaya Kumar and Riyaz Ahamed Osankhan Department of
El Niño / Southern Oscillation
 El Niño / Southern Oscillation Student Packet 2 Use contents of this packet as you feel appropriate. You are free to copy and use any of the material in this lesson plan. Packet Contents Introduction on
THE STUDY OF NUMBERS AND INTENSITY OF TROPICAL CYCLONE MOVING TOWARD THE UPPER PART OF THAILAND
 THE STUDY OF NUMBERS AND INTENSITY OF TROPICAL CYCLONE MOVING TOWARD THE UPPER PART OF THAILAND Aphantree Yuttaphan 1, Sombat Chuenchooklin 2 and Somchai Baimoung 3 ABSTRACT The upper part of Thailand
Manfred A. Lange Energy, Environment and Water Research Center The Cyprus Institute. M. A. Lange 11/26/2008 1
 Manfred A. Lange Energy, Environment and Water Research Center The Cyprus Institute M. A. Lange 11/26/2008 1 Background and Introduction Mediterranean Climate Past and Current Conditions Tele-Connections
Global Atmospheric Circulation
 Global Atmospheric Circulation Polar Climatology & Climate Variability Lecture 11 Nov. 22, 2010 Global Atmospheric Circulation Global Atmospheric Circulation Global Atmospheric Circulation The Polar Vortex
Weather Atmospheric condition in one place during a limited period of time Climate Weather patterns that an area typically experiences over a long
 Weather Atmospheric condition in one place during a limited period of time Climate Weather patterns that an area typically experiences over a long period of time Many factors influence weather & climate
Cambridge International Examinations Cambridge Ordinary Level
 Cambridge International Examinations Cambridge Ordinary Level *5500826079* ENVIRONMENTAL MANAGEMENT 5014/12 Paper 1 May/June 2016 2 hours 15 minutes Candidates answer on the Question Paper. No Additional
Current and future climate of the Cook Islands. Pacific-Australia Climate Change Science and Adaptation Planning Program
 Pacific-Australia Climate Change Science and Adaptation Planning Program Penrhyn Pukapuka Nassau Suwarrow Rakahanga Manihiki N o r t h e r n C o o k I s l a nds S o u t h e Palmerston r n C o o k I s l
Cambridge International Examinations Cambridge International General Certificate of Secondary Education
 Cambridge International Examinations Cambridge International General Certificate of Secondary Education *2074084589* ENVIRONMENTAL MANAGEMENT 0680/21 Paper 2 May/June 2016 1 hour 45 minutes Candidates
This table connects the content provided by Education Perfect to the NSW Syllabus.
 Education Perfect Geography provides teachers with a wide range of quality, engaging and innovative content to drive positive student learning outcomes. Designed by teachers and written by our in-house
Extreme Weather Events and Climate Change
 Extreme Weather Events and Climate Change Robert M Rabin NOAA/National Severe Storms Lab Norman, Oklahoma Most material presented is from: Climate Change 2013: The Physical Science Basis. Intergovernmental
Explain the impact of location, climate, natural resources, and population distribution on Europe. a. Compare how the location, climate, and natural
 SS6G10 Explain the impact of location, climate, natural resources, and population distribution on Europe. a. Compare how the location, climate, and natural resources of Germany, the United Kingdom and
Match (one-to-one) the following (1 5) from the list (A E) below.
 the following (1 5) from the list (A E) below.") GEO 302C EXAM 1 Spring 2009 Name UID You may not refer to any other materials during the exam. For each question (except otherwise explicitly stated), select the best answer for that question. Read all
GEO 302C EXAM 1 Spring 2009 Name UID You may not refer to any other materials during the exam. For each question (except otherwise explicitly stated), select the best answer for that question. Read all
Semiblind Source Separation of Climate Data Detects El Niño as the Component with the Highest Interannual Variability
 Semiblind Source Separation of Climate Data Detects El Niño as the Component with the Highest Interannual Variability Alexander Ilin Neural Networks Research Centre Helsinki University of Technology P.O.
New NASA Ocean Observations and Coastal Applications
 New NASA Ocean Observations and Coastal Applications Duane Armstrong Chief, Applied Science & Technology Project Office August 20, 2014 1 Outline NASA s new Earth Science Ocean Science Missions for 2014
Name. El Nino. by Cindy Grigg
 Name El Nino by Cindy Grigg Answer the following questions BEFORE you read this book. It is okay if you do not know as much as you thought. Do the best you can! 1. What do you already know about El Nino?
Extreme Weather Events: Infrastructure Damage and Impact on Vulnerable Populations
 Extreme Weather Events: Infrastructure Damage and Impact on Vulnerable Populations Cindy L. Parker MD, MPH Physicians for Social Responsibility Johns Hopkins Bloomberg School of Public Health 1 Climate