National Climate Centre India Meteorological Department PUNE INDIA
|
|
|
- Aubrey Henry
- 6 years ago
- Views:
Transcription


1
2 IMD Met Monograph No: Synoptic Meteorology No: 7/2009 Government of India India Meteorological Department Edited by Ajit Tyagi, H. R. Hatwar and D. S. Pai National Climate Centre India Meteorological Department PUNE INDIA
3 Copyright India Meteorological Department, 2009 The right of publication in print, electronic or any other for reserved by the India Meteorological Department Short extracts may be reproduced, however the source should be clearly indicated DISCLAIMER & LIMITATIONS The contents published in this report have been checked and authenticity assured within limitations of human errors India Meteorological Department is not responsible for any errors and omissions The geographical boundaries shown in this report do not necessarily correspond to the political boundaries provides more details
4 C o n t e n t s Acknowledgements Preface Chapter- 1 Chapter- 2 Chapter- 3 Chapter- 4 Chapter- 5 Chapter- 6 Onset, advance and withdrawal of southwest monsoon A. K. Srivastava and B. P. Yadav Semi Permanent Systems and Synoptic Features A. B. Mazumdar, Medha Khole, M. Mohapatra and S. Sunitha Devi Rainfall Statistics A. K. Srivastava Global and Regional Circulation Features D. S. Pai and O.P. Sreejith Performance of operational NWP short range forecasts Y.V. Rama Rao, D. R. Pattanaik and A. K. Das Performance of medium range forecasts by NWP models S.K. Roy Bhowmik and V.R. Durai Chapter- 7 Chapter- 8 Chapter- 9 Chapter- 10 Long Range Forecasts of southwest monsoon rainfall D.S. Pai and O. P. Sreejith Use of Satellite Data and Products in Weather forecasting A.K.Sharma and Suman Goyal Utility of Automatic Weather Station (AWS) data for monitoring and prediction of monsoon circulations M. Mohapatra, A. K. Sharma and Suman Goyal Summary and Conclusions Ajit Tyagi, H.R. Hatwar and D.S. Pai
5 ACKNOWLEDGEMENTS We thank all the officers and staff of DGM (Hydromet) for providing rainfall data at various temporal and spatial scales on operational basis. For preparation of the report, technical assistance was provided by the officers and staff of the Long Range Forecasting Section and National Climate Center. We are particularly thankful to Shri. C.N. Shaligram, Ms. Madhuri Musale, Mrs. Priya Mahajani, Mrs. Latha Sridhar and Ms. Jyoti Bhate for their technical support. We are also thankful to Shri. Philipose Abraham and other staff members of the DTP unit of ADGM (R) Office for designing, type setting, printing and publication of the report.
6 PREFACE Each year monsoon exhibits different characteristics posing challenges to the operational as well as scientific/modeling communities. As such, it is important to document the various features of monsoon for quick reference and useful information. With this major goal, the monsoon 008 monograph has been brought out by IMD detailing the different aspects of monsoon During 2008 Southwest Monsoon season (June to September), the rainfall for the country as a whole was near normal (98% of its LPA). This year, the monsoon onset over Kerala took place very close to the normal date. Though further progress of monsoon was rapid over most parts of the country, there was considerable delay in the withdrawal of monsoon from northwest India. The formation of monsoon low pressure systems (Depression and above) also had been subdued in comparison with the immediate past years. The month of July, when the monsoon activity is normally at its peak, was devoid of any monsoon depression. Another important feature of this monsoon was that the spatial distribution of season rainfall was almost uniform. However, the season was marked by large temporal variation. During the season, several states from north, northeast and east coast reported flood situations. The operational long range forecasts issued by the India Meteorological Department were mostly accurate. However, the forecast for seasonal rainfall over northwest India and that for July rainfall for the country as a whole were not accurate. While the forecast highly overestimated the rainfall during July for the country as a whole, it slightly underestimated the seasonal rainfall over northwest India. Thus 2008 monsoon showed many challenging features which call for more focused studies for improving our prediction capabilities. This report has been arranged in different chapters each of which discusses specific aspects of the 2008 southwest monsoon like progress and withdrawal of monsoon, synoptic systems over the Indian region, large scale regional and global features (such as ENSO and
7 Indian Ocean Dipole) observed during the season, rainfall statistics, forecasts at various scales and its verification etc. The report also includes chapters on the utility of the satellite and automatic weather station data in monitoring and prediction of monsoon. The authors have pointed out areas where more in depth research is necessary for better understanding and prediction of various monsoon features. There is no doubt that this report provides useful and authentic information about the 2008 southwest monsoon season. I sincerely appreciate all the authors for their valuable contribution. I also appreciate the efforts made by the National Climate Center in bringing out this met. monograph, which is fourth in the series of monographs published recently and dealing with the diagnostics and prediction of southwest monsoon over India. Ajit Tyagi Director General of Meteorology India Meteorological Department
8 Chapter 1 ONSET, ADVANCE AND WITHDRAWAL OF SOUTHWEST MONSOON A. K. Srivastava and B. P. Yadav This chapter discusses various aspects of the onset, advance and withdrawal of southwest monsoon. Monsoon Onset phase The onset phase of monsoon 2008 was characterized by timely arrival of monsoon over the south Peninsula and rapid advancement over different parts of the country, particularly over Central and Northwest India. This year southwest monsoon set in over parts of southeast Bay of Bengal, Nicobar Islands and Andaman Sea on 10 th May 2008, 5 days earlier than the normal time. It advanced over Kerala on 31 May, a day ahead of the normal date and covered the entire country on 10 July, 5 days ahead of the normal date. Since 2006, IMD has adopted the following new objective criteria for declaring monsoon onset over Kerala based on rainfall, wind field and OLR data. The criteria are Rainfall : If after 10 th May, 60% of the available 14 stations enlisted (Minicoy, Amini, Thiruvananthapuram, Punalur, Kollam, Allapuzha, Kottayam, Kochi, Thrissur, Kozhikode, Talassery, Kannur, Kasargode and Mangalore) report rainfall of 2.5 mm or 1
9 more for two consecutive days, the onset over Kerala be declared on the second day, provided the following criteria are also in occurrence. Wind Field: Depth of westerlies should be maintained up to 600 hpa, in the box equator to Lat 10 0 N and Long 55 0 E to 80 0 E. The zonal wind speed at 925 hpa over the area bounded by 5 0 N N, 70 0 E to 80 0 E should be at least of the order of knots. OLR: INSAT derived OLR value should be below 200 Wm -2 in the box confined by Lat N and Long E. Following the above mentioned criteria, IMD declared the monsoon onset over Kerala on 31 May Fig. 1.1 shows the variation of mean rainfall and percentage of stations recording 2.5 mm or more out of the 14 stations mentioned above. Since 29 May, reported mean rainfall over Kerala was equal or greater than the 2.5 mm. From 30 May onwards, more than 60 % of stations were reporting 2.5 mm or more rainfall. On 31 May, more than 90% of the stations reported rainfall of 2.5 mm or more DAILY MEAN RAINFALL OVER KERALA May 21-May 22-May 23-May 24-May 25-May 26-May MEAN RAINFALL(mm) 27-May 28-May 29-May 30-May 31-May 1-Jun 2-Jun 3-Jun 4-Jun 5-Jun D A T E Fig. 1.1: a) Mean rainfall (mm) over Kerala (average of 14 stations) PERCENTAGE May %OF STATIONS RECEIVING 2.5 MM RF OVER KERALA May 22-May 23-May 24-May 25-May 26-May 27-May 28-May 29-May 30-May 31-May 1-Jun 2-Jun D A T E Jun 4-Jun 5-Jun Fig. 1.1: b) Per cent of stations reporting 2.5 mm or more 2


 at 925 hpa from 28 to 31 May Fig. 1.")

10 Fig. 1.2 shows the zonal wind speed at 925 hpa from 28 to 31 May 2008 and Fig. 1.3 shows the OLR values (derived from the NOAA satellites) for the same period. Zone of maxima in the wind speed was observed over the south west Arabian Sea since 28 May and started extending towards the west coast. On 31 May, wind Maxima was located over Comorin area and adjoining extreme south peninsula. 28 May 29 May 30 May 31 May Fig. 1.2: Zonal wind (m/sec) at 925 hpa from 28 to 31 May Fig. 1.3 shows the spatial distribution of OLR from 28 to 31 May On all the four days, OLR values less than 200 Wm -2 were observed over southwest Arabian Sea off Kerala coast, suggesting persistence of enhanced convection. 3
 from 28 to 31 May Monsoon advance phase Southwest monsoon set in over parts of the Andaman Sea and Nicobar Islands and some")


,a well marked low pressure area over the northeast Arabian Sea (8-12 June) and a")
11 28 May 29 May 30 May 31 May Fig. 1.3: Outgoing Long wave Radiation (W/m 2 ) from 28 to 31 May Monsoon advance phase Southwest monsoon set in over parts of the Andaman Sea and Nicobar Islands and some parts of the southeast Bay on 10 May, about 5 days ahead of the normal schedule. It covered some more parts of the southeast Bay and Andaman Sea on 12 May. Southwest monsoon further advanced northwards into the central and northeast Bay of Bengal on 26 and some parts of the south Arabian Sea on 27 May. Southwest monsoon advanced over Kerala on 31 May, a day ahead of its normal date (1 June). On 1 & 2 June, monsoon covered most parts of the south Arabian Sea, more parts of south peninsula and the Bay of Bengal as a week current. It also covered many parts of northeastern states during the same period, almost as per the normal schedule. Thereafter, formation of a depression over the East central Arabian Sea (4-8 June),a well marked low pressure area over the northeast Arabian Sea (8-12 June) and a low pressure area over Orissa and adjoining central India (10-11 June) strengthened the monsoon current leading to rapid advancement of monsoon. By 10 th June, it covered most parts of Arabian Sea, Maharashtra, entire Peninsula & Bay of Bengal and most parts of East India. The northern limit of monsoon as on 10 th June

12 passed through Lat 23 N/Long 60 E, Lat 23 N/Long 65 E, Okha, Rajkot, Surat, Nasik, Parbhani, Raipur, Daltonganj, Patna and Raxaul. The low pressure area which formed over Orissa on June moved northwestwards causing fairly widespread rains over central India leading to the advance of monsoon over central India. The northern limit of monsoon as on 12 th June 2008 passed through Lat 23 N/Long 60 E, Lat 23 N/Long 65 E, Okha, Rajkot, Surat, Hoshangabad, Satna, Allahabad, Gorakhpur and Nautanwa. Moving further north-northwestwards, the above system as a cyclonic circulation interacted with a western disturbance moving across northern India during June. It led to strengthening of the monsoon current enhancing the rainfall activity over Western Himalayan Region and plains of northwest India. Monsoon advanced over Delhi on 16 th June about 2 weeks earlier than the normal date (29 June). The northern limit of monsoon as on 16 th June 2008 passed through 25 N/60 E, 25 N/65 E, Mount Abu, Jaipur, Churu and Sri Ganganagar. The monsoon stagnated for about three weeks as no significant system affected Rajasthan. Thereafter, formation of a low pressure area over central India and an upper air cyclonic circulation over northeast Rajasthan activated the monsoon trough causing fairly widespread rains and advancement of monsoon over the remaining extreme northwestern parts of the country on 10 July five days ahead of its normal schedule. The isochrones of onset date for 2008 are shown in Fig Fig. 1.4: Progress of southwest monsoon


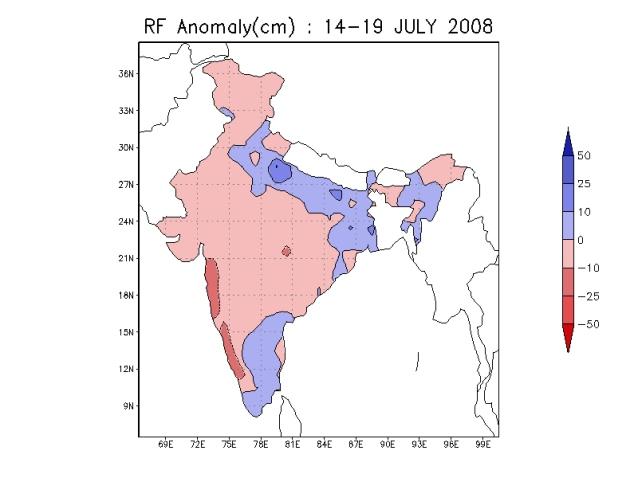
13 Monsoon condition during 17 June to 9 July : The southwest monsoon covered most parts of the country by 16 June. However, it covered the remaining extreme northwestern parts only on 10 July, after a prolonged hiatus of twenty five days. It may be mentioned that during this period, good rainfall activity was observed over other parts of the country. OLR anomaly plot and Rainfall anomaly for the country, for the period 17 June 9 July 2007 are shown in Fig.1.5 and 1.6 respectively. The OLR plot was created using the NOAA OLR data. The OLR anomaly map clearly shows the increased convection (negative OLR anomalies) over the northern and eastern parts. Negative OLR anomalies were also observed over the southeast Indian Ocean. Similarly, wind anomaly at 850 hpa, is shown in Fig An anomalous cyclonic circulation over the northern parts and an anomalous anticyclonic circulation over the peninsular parts were observed. These features suggest weak monsoon flow and presence of enhanced mid latitudinal westerly systems during the period across northern parts of the country. Interestingly, central and peninsular parts also witnessed normal rainfall activity. Fig. 1.5: OLR anomalies (Wm -2 ) during the period 17June 9 July Fig. 1.6: Rainfall anomaly during the period 17June 9 July Fig. 1.7: Wind anomalies at 850 hpa during the period 17June 9 July 6


14 Withdrawal Phase There was an unusual delay in the withdrawal of monsoon from extreme west Rajasthan, due to the prevalence of mid latitude westerly troughs/cyclonic circulations, availability of moisture and sporadic rainfall activity over the northwest region. The southwest monsoon withdrew from western parts of Rajasthan and some parts of Punjab and Haryana on 28 September, with the withdrawal line passing through Mukteswar, Bareilly, Dholpur, Sawai Madhopur, Dessa, Naliya, Lat.23 0 N/Lon.65 0 E, Lat.23 0 N/Lon.60 0 E. The southwest monsoon further withdrew from remaining parts of Uttarakhand, west Uttar Pradesh and east Rajasthan, some parts of east Uttar Pradesh and west Madhya Pradesh and most parts of Gujarat state and north Arabian sea on 11 October. The withdrawal line passed through Lat N/Long E, Lucknow, Nowgong, Indore, Surat, Veraval, Lat N/Long E and Lat N/Long E. There after southwest Monsoon gradually withdrew from northeastern, eastern and central parts of the country from 12 to 15 October. The southwest monsoon withdrew from the entire country on 15 October. Fig 1.8 shows the withdrawal map. Fig. 1.8: 2008 Monsoon withdrawal dates 7
15 Chapter 2 SEMI PERMANENT SYSTEMS AND SYNOPTIC FEATURES A. B. Mazumdar, Medha Khole, M. Mohapatra and S. Sunitha Devi This chapter provides details of the semi permanent systems and synoptic features that prevailed during the 2008 southwest monsoon season. 2.1 Semi Permanent systems Monsoon Trough The heat trough appeared slightly to the north of normal position during 3-6 June. It then gradually shifted southwards, in association with the formation of a low pressure area over the north Bay of Bengal. On 9 June, the eastern part remained to the south of normal position. With the advancement of monsoon over the entire country, monsoon trough got established on 10 July. It remained in its near normal position up to 12 July, started shifting northwards from 13, when another branch of it extended eastwards to northeastern states. It was close to the foothills of Himalayas from July. Though the trough shifted southwards thereafter, it remained north of its normal position up to 26. The formation of a 8
16 low pressure area over the northwest and adjoining west central Bay caused the trough to shift southwards and it remained south of its normal position during 27 July 5 August. Subsequently, it remained in near normal position during 7-15 August. The western end of it shifted northwards during August. After regaining the normal position, it remained there during August. Thereafter the western end remained close to the foothills on 28 & 29 August. The entire trough lay close to the foothills during 30 August 3 September. It shifted southwards on 6 September and thereafter remained south of its normal position, in association with the low pressure area over the west central Bay and neighbourhood, up to 19 September. It then started shifting northwards and the western end lay close to the foothills during September. Subsequent to the withdrawal of monsoon from northwest India, the trough became less delineatable on the sea level chart from 29 September Heat Low The Heat low established at its near normal position by 5 June. However, it was observed to be diffused during major parts of the season viz., from: June; 6-28 July; 1-7 August and from 1-13 September. It became unimportant from 25 September. The lowest and the second lowest pressure values of the heat low were: June: hpa (on 15) and 990 hpa (on 14) July: 990 hpa (on 5) and 992 hpa (on 1) Aug: 992 hpa (on 8 & 10) and 993 hpa (on 12) Sept: 997 hpa (on 14 & 19) and 1000 hpa (on 17) Tibetan Anticyclone/High The Tibetan Anticyclone (TA) was established in its near normal position at 300 & 200 hpa on 26 June. It was noticed upto 15 September. On many days during the later half of July, it remained east of normal position, to the northeast on many days during August and to the north during September Tropical Easterly Jet (TEJ): Though jet speed winds were noticed over Port Blair on 4 May, the southernmost stations started reporting these wind speeds on a regular basis only from 25 May onwards. It was present until the beginning of October. During July and August, on many days, the jet stream was spread over to northern latitudes, sometimes even upto 20 0 N. A core wind speed of 100 kts. was noted over Port Blair on a few days in June, July and September. 9
17 Apart from these, Jet speed winds were also reported over Visakhapatnam, Bhubaneswar, Hyderabad, Nagpur, Kolkata, Ranchi and Ahmedabad during various periods of the season Sub-Tropical Westerly Jet (STWJ) STWJ was seen over Delhi and Guwahati latitudes upto 10 June. It re-appeared over Delhi on 10 September Intensity of Mascarene High (centred at 30 0 S/ 60 0 E) during June to September 2008 The intensity of Mascarene High centered at 30 o S / 50 o E was below normal by 0.9 hpa during the monsoon period June to September It was below normal by 2.0 hpa in the month of August and September 2008 and it was above normal by 0.5 hpa in the month of July In the month of June it was equal to normal. 2.2 Other semi-permanent features: Off-shore trough Off-shore trough along different parts of the west coast at sea level persisted on most of the days from 30 May to 17 September except during 4 5 June and 18 Aug. 5 September. Even though present throughout the month of July, it was quite feeble during the period July Cross Equatorial Flow during June September 2008: The Cross Equatorial flow along the equatorial belt (equator to 5 0 N/ 5 0 S) was stronger than normal by more than 5 kts, during the last week of June and first week of August. Except these, the cross equatorial flow along the equatorial belt was close to the normal during the entire monsoon period, June September The surface winds over Arabian Sea to the north of 5 0 N were stronger than normal by about kts during the second week of June, about 5-10 kts in the third week of June and by about 5 kts in the 4 th week of June. The surface winds were also stronger than normal by about 5-10 kts in the fourth week of July, second week of August, first, second and fourth week of September and by about kts in the third week of September. 10
18 They were weaker than normal by about 5-10 kts in the fourth week of August. They were almost normal for the remaining period during the entire season. The Cross Equatorial flow along the equatorial belt (equator to 5 0 N/ 5 0 S) over the Bay of Bengal to the north of 5 0 N was stronger than normal by about 5-10 kts in the third week of June and fourth week of August and by about kts in the third week of July. The cross equatorial flow was almost normal for the remaining period during the season. The surface winds over the Bay of Bengal to the north of 5 0 N were stronger than normal by about 5 kts in the third week of June and second week of August and by about 5-10 kts in the fourth week of June, third & fourth week of July, first week of August, second, third and fourth week of September. They were almost normal for the remaining period during the season Low Pressure systems over other oceanic areas during June to September There were in all 14 low pressure systems (reaching the intensity of Tropical depression and above) in the northwest Pacific Ocean / South China Sea during June September The month wise break-up is 2 Typhoons each in June: and July; 1 Tropical Depression, 3 Tropical Storms and 1 Typhoon in August and 1 Tropical Depression, 1 Tropical Storm and 3 Typhoons in September. No low pressure system (Tropical Depression, Tropical Storm or Typhoon) was reported in the Southern Hemisphere during June- September Troughs in westerlies south of Lat. 30º N affecting the Indian region and to the north of Lat. 30º S during June September 2008: The number of troughs in westerlies affecting Indian region which penetrated south of 30 o N is 2 each in August and September at 300 and 500 hpa level; 9 at 300 hpa level and 3 at 500 hpa level in the month of September. There were 17 troughs in upper air westerlies which moved across the Indian Ocean from west to east, to the north of Lat.30 0 S, in the Southern Hemisphere, during June to September 2008.The month wise break-up is 4 in June, 5 each in July and September and 3 in August: 11
19 2.2.5 Intensity of Australian High (centred at 30 0 S/ E) during June to September 2008: The intensity of Australian High centred at 30 o S / 140 o E was above normal by an average of about 0.7 hpa during the entire monsoon period June September It was above normal by 1.0 hpa in the month of June 2008 and by 2.0 hpa in the month of August It was equal to normal in the month of July and September A summary of the semi-permanent systems for the years is given in Table 2.3. Synoptic disturbances over the Indian Monsoon Region: Four cyclonic disturbances (depressions and higher intensity systems) developed during the monsoon season (June-September), These included one depression over the Arabian Sea and another over the Bay of Bengal during June, one land depression over coastal Orissa during August and one deep depression over the Bay of Bengal during September. The tracks of these systems are shown in Fig.2.1, the depression over the Arabian Sea during 5 to 6 June moved away westwards and weakened over the Ocean. The second depression over the Bay of Bengal during 16 to 18 June crossed Bangladesh coast and moved across Gangetic West Bengal and Jharkhand. It then moved as a low pressure area upto east Uttar Pradesh and adjoining east Madhya Pradesh. The system caused heavy to extremely heavy rainfall over Gangetic West Bengal, north Orissa and Jharkhand leading to flood over these regions. The third system was a land depression (9 10 August) over coastal Orissa and was short lived with the life period of less than 24 hours. The fourth system was a deep depression (15 19 September) over the northwest Bay of Bengal which crossed Orissa coast near Chandbali and moved across north Orissa, north Chhattisgarh, northeast Madhya Pradesh and central Uttar Pradesh. The remnant low pressure area moved upto northwest Uttar Pradesh. This system caused heavy to extremely heavy rainfall over Orissa and Chhattisgarh leading to severe flood over Orissa. This system also interacted with mid-latitude westerly systems and caused good rainfall over northwest India and led to flood over Haryana and Himachal Pradesh. Apart from the above systems, 8 low pressure areas formed during the season. The salient features of the monsoon disturbances (depressions and higher intensity systems) during 2008 are as follows. (i) Frequency of disturbances over the Indian region was significantly less compared to long period average of about 7 disturbances. However, it was comparable considering recent years, as the average frequency of the disturbances during monsoon season was about 3.5 based on data of
20 (ii) No system developed as remnant of the systems from south China Sea. (iii) The month of July was devoid of any monsoon depression like the previous July of 1995, 1998, 2000, 2001, 2002 and (iv) The first ever land depression developed in August 2008 after (v) The movement of the systems was climatological, as the depressions developing over the Bay of Bengal and coastal Orissa moved west-northwestwards/ northwestwards. No system had a longer track, as no system moved to the west of 80 deg east. The synoptic disturbances which affected the Indian monsoon region in June, July, August and September are given in Tables 2.2 to 2.5 respectively. The number of system days and those for the past 5 years are given in Table 2.6. Fig.2.1: Tracks of the cyclonic disturbances over Indian seas during the southwest monsoon season
21 2.3.1 Depressions The seasonal characteristics of the cyclonic disturbances have been analysed with respect to the cyclogenesis, intensification, movement and rainfall due to the system. Considering the data of , available in cyclone e-atlas of IMD (2008), about 7 cyclonic disturbances develop over the Indian region during the monsoon season with a standard deviation of about 2.5. It includes two each in August and September and 1.5 each in June and July. Hence, compared to the long period average, the frequency of cyclonic disturbances has been less than normal during monsoon season, 2008, with development of only four systems, including one depression each in August and September and two in June (Fig.2.1). However considering the recent years ( ), the number of systems was comparable (Fig.2.2), as on an average 3.5 cyclonic disturbances developed over the Indian region during Fig.2.2: Frequency of Cyclonic Disturbances over The Indian Region during No system developed from remnants of the system from south China Sea. According to Saha et al (1981) and Chen and Wang (1999), about 85-90% of depressions forming over the Bay of Bengal could be traced to the remnants of the western Pacific systems striking south China and adjoining Thailand-Vietnam coasts. The cyclonic disturbances during 2008 developed in association with (i) formation of prominent cloud clusters and their persistence over north Bay of Bengal, (ii) surges in cross equatorial monsoon flow inducing cyclonic shear to the north of wind maxima over south and central Bay of Bengal, (iii) slow descent of the mid-tropospheric cyclonic circulations to the surface level (Sikka and Grey, 1981). 14
22 The month of July was devoid of any monsoon depression like the previous July of 1995, 1998, 2000, 2001, 2002 and The frequencies of cyclonic disturbances over the Indian region during are shown in Fig.2.3. It is observed that the frequency of cyclonic disturbances during July has been nil or one only since Mandke and Bhide (2004) and Mohapatra (2006) have associated the decrease in frequency of cyclonic disturbances with the weakening of the environmental monsoon circulation over the region in recent years. Cyclone eatlas - IMD Annual Frequency of D,CS,SCS for the month of July, Basin(F): BOB+AS+Land, Period : Frequency Year Fig.2.3: Frequency of Cyclonic Disturbances over The Indian Region during July over the period of Considering the total number of low pressure systems (LPS), there were 12 system including 8 lows, 3 depressions and 1 deep depression. There was no cyclonic storm during monsoon season, Recently, Goswami et. al. (2003) have examined the frequency of low pressure systems during monsoon season over Indian region based on data of and found that the frequency of occurrence of LPSs is nearly 3.5 times higher in the active phase compared to the weak phase of monsoon. The frequency of LPSs was higher in September developing in the interval of about a week. Similarly, it was higher during first half of June 15
23 and August, which were the active phases of monsoon with development of 3 and 2 systems respectively. Hence, the frequency of LPS development during 2008 endorses the findings of Goswami et al (2003). There was development of one land depression over coastal Orissa on 9 August. It was short lived and mostly behaved like the depression over the Bay of Bengal in its characteristics. According to Mohapatra and Mohanty (2009), the number of land lows is more in deficient months than in corresponding excess months for Orissa. During deficient rainfall months, some of the land lows (Rao, 1976) develop over northern latitude like over Jharkhand, Bihar and east Uttar Pradesh and move eastwards in association with the extratropical westerly trough during weak monsoon conditions. However, it was the first ever land depression since 1987 (Fig.2.4). Cyclone eatlas - IMD Annual Frequency of D,CS,SCS for the month of August, Basin(F): Land, Period : Frequency Year Fig.2.4: Frequency of Land Depressions over Indian Region developing in the month of August during
24 The average lifetime of the monsoon depressions during monsoon season, 2008 was about 2.2 days. It was significantly less than normal as the average lifetime of the monsoon depression is about five days (Sikka, 2006). The life time varied from 21 hours in case of Orissa land depression to 3 days 21 hrs in case of deep depression during September. No system intensified into the stage of cyclonic storm during monsoon Considering the long period data based on , the probability of intensification of a depression to a cyclonic storm is about 38%, 24%, 15% and 25% in June, July, August and September respectively. Based on data of recent years ( ), it is 35% and 28% in June and September respectively and no cyclonic storm has formed in July and August. Hence, there is no significant change in the rate of intensification during June and September. Considering total number of LPS, the probability of intensification into depressions/cyclones has decreased significantly in recent years, as the number of depressions has significantly decreased and number of lows has increased in recent years (Mooley and Shukla, 1989, Sikka, 2006). The monsoon depressions in general moved in a westerly to northwesterly direction with the climatological speed, i.e., about 5-10 km per hour. No monsoon disturbance moved to the west of long E. According to Pattanaik et al (2004), number of cyclonic disturbances moving to the west of 80 deg E is decreasing in recent years. Pattanaik et al (2004) have tried to associate the above fact with anomalous high over northwest India at 500 hpa level, as it may restrict the westward movement of the system. To verify the above fact, the anomalous circulations over the Indian region at 500 hpa level during individual monsoon months are shown in Fig.2.5. While there was anomalous anti-cyclonic circulation during July and August, there was interaction with mid-latitude westerlies in June and September. According to Sikka (2006), there is no clear relationship between the westward displacement and excess/deficient rainfall over India during the season. Though the westward movement of the systems was limited, the seasonal rainfall of the country was not reflected during According to Sikka (2006), good rainfall years of 1989, 1990, 1994 had a larger longitudinal displacement and bad monsoon years, 1985, 1986, 1987, 2002, 2004 had smaller longitudinal displacement of LPS. According to Pattanaik et al (2006), the limited westward displacement of the systems is associated with higher rainfall over northeast India. However, the seasonal rainfall over the northeast India was 6% less than 17

25 the long period average. Considering individual sub-divisions, the seasonal rainfall during monsoon 2008 was on positive side of the normal over Bihar, West Bengal & Sikkim and on negative side of the normal over Arunachal Pradesh and Assam & Meghalaya. It was deficient over Nagaland, Manipur, Mizoram and Tripura (NMMT). Considering individual months, Bihar and West Bengal and Sikkim received excess/normal rainfall during June- August and deficient rainfall during September. Assam & Meghalaya got excess rainfall during August only. Fig.2.5: Anomalous circulation over Indian region during monsoon season The rainfall over central India sub-divisions like west and east Madhya Pradesh and Vidarbha were adversely affected during monsoon season, It may be due to limited westward movement of the systems during According to Chowdhary and Gaikwad (1983), depression and low pressure areas contribute nearly 30-50% of the normal seasonal 18
26 rainfall over Narbada and Tapi basin. According to Mooley (1973), the potential of a depression as a rain giving system increases sharply in regions to the west of 80 0 E Depression over Arabian Sea 5-6 June, 2008 During the onset phase of monsoon, the southwesterly monsoon current over the Arabian Sea strengthened in the beginning of June and an off shore trough ran along Karnataka and Kerala coast with increase in pressure gradient. An east-west shear zone ran across south peninsula with embedded cyclonic circulation over southeast Arabian Sea during 1-3 June. Under the influence of the above systems, a low pressure area developed over east central Arabian Sea on 4 June morning. The associated cyclonic circulation extended upto mid-tropospheric level. It concentrated into a depression over east central Arabian Sea at 0000 UTC of 5 June, under the favourable conditions of low to moderate vertical wind shear, upper level westward divergent flow and stronger low level convergence to the south of the system. It lay centred at 0000 UTC of 5 June over east central Arabian Sea near Lat N and long E, about 800 km southwest of Mumbai. The system moved in a northerly direction initially and lay centred at 0300 UTC of same day near Lat N and long E, the system further moved in a north-northwesterly direction and lay centred at 1800 UTC of 5 June near Lat N and long E. Thereafter the system moved in a northwesterly direction till 2100 UTC of 6 June and lay centred near Lat N and long E. At this time, with strong low level westerly flow on the southern side of the system and westward divergent flow at the upper troposphere with ridge line roughly running along Lat N, the system lay in a region of moderate easterly vertical wind shear. The system also came under the effect of interaction with land surface. As a result, the system weakened into a well marked low pressure area at 0000 UTC of 7 June over northwest and adjoining west central Arabian Sea and adjoining coastal Oman. The INSAT imageries and outgoing long wave radiation (OLR) distribution in association with the system is shown in Fig.2.6. As this system moved northwestwards away from Indian coast, it did not cause any severe weather over the country. However, it caused fairly widespread rainfall over Lakshadweep Islands during its genesis period. 19

27 Fig.2.6:. Insat imageries at 0600UTC and Olr at 0000UTC over the Indian Region during 5-7 June
28 Depression over Bay of Bengal June, 2008 A convective cloud cluster developed over central and adjoining Bay of Bengal on 13 June. It slowly organized with persistence of the convection over the region. The southwesterly winds over the Bay of Bengal increased in intensity leading to development of a lower level cyclonic circulation embedded with the monsoon trough over the north Bay of Bengal on 14 June. Under its influence, a low pressure area formed over the north Bay of Bengal at 0300 UTC of 15 June. The mean sea level pressure fell by about 2 hpa along west Bengal and Orissa coast at 1200 UTC of 15 June. The adequate upper level divergence continued to support the deep convection over the region. Under the influence of the above favourable conditions, the low pressure area over the North Bay of Bengal concentrated into a depression and lay centred at 0300 UTC of 16 June 2008 over the north Bay of Bengal near lat N and long E, about 220 km southwest of Kolkata. The upper tropospheric ridge ran roughly along 25 0 N at this time. The southeasterly winds prevailed at 200 hpa level over the north Bay of Bengal and adjoining areas favouring northwestward movement of the system. Hence, the depression moved in a northwesterly direction and crossed Bangladesh coast near long E between 1100 and 1200 UTC of 16 June. The system did not intensify further due to moderate to high vertical wind shear over the region. The winds over Kolkata at 0000 and 1200 UTC of 16 were about 090/10kts at 850 hpa level. However, on 17 and 18 June, the lower tropospheric winds became very strong varying between 30 and 40 knots around the system centre. The maximum pressure departure was about hpa in association with the system during16-18 June. It continued to move in a northwesterly direction and lay centred at 0300 UTC of 17 June over Gangetic west Bengal and adjoining Bangladesh near Krishna Nagar in west Bengal. It then moved slightly west-northwestwards and lay centred at 1200 UTC of 17 June near Burdwan in Gangetic West Bengal. It further moved northwestwards and lay centred at 0300 UTC of 18 June over Jharkhand, about 50 km southwest of Dumka. It weakened into a well marked low pressure area over Jharkhand and neighborhood at 0900 UTC of 18 June and into a low pressure over northeast Madhya Pradesh and adjoining areas at 0300 UTC of 19 June. The INSAT imageries along with OLR distribution are shown in Fig.2.7 and DWR imageries of the system are shown in Fig.2.8. The stream line analyses over Indian region during June 2008 at 850, 500 and 200 hpa levels are shown in Fig.2.9. The depression during June caused widespread rainfall with scattered heavy to very heavy falls and isolated extremely heavy falls (>25 cm) over Gangetic west Bengal, north Orissa and Jharkhand during June. The exceptionally heavy rainfall of 53 cm 21

29 was recorded over Kalaikunda in West Bengal at 0300 UTC of 18 June. As a result, It caused severe flood over Gangetic west Bengal, north Orissa and adjoining Jharkhand. Fig.2.7: Insat imageries at 0600UTC and OLR at 0000UTC over the Indian Region during June


30 Fig.2.8: DWR, Kolkata imageries at 1200 UTC of 16 June and 0300 UTC of 17 June
 850hPa, (b) 500 hpa, (c) 200hPa levels At 0000 UTC of (i-iii) 16-18 June 2008 The heavy rainfall occurred mostly in the left forward sector of the depression (Rajamani")
31 Fig.2.9: Stream line analyses of (a) 850hPa, (b) 500 hpa, (c) 200hPa levels At 0000 UTC of (i-iii) June 2008 The heavy rainfall occurred mostly in the left forward sector of the depression (Rajamani and Rao, 1981). However, northern sector of the system covering sub-himalayan West Bengal and Sikkim got heavy rainfall on 18 and 19 June. It may be due to the interaction of the mid-latitude westerly trough over the region interacting with the system. There was also the distant effect of this depression (Mukherjee and Shyamala, 1978) 24


32 causing good rainfall upto Himachal Pradesh and Uttarakhand in the northwest and Arunachal Pradesh in the northeast Land Depression over Orissa August 09-10, 2008 An upper air cyclonic circulation lay over northwest Bay of Bengal and adjoining coastal areas of north Orissa and West Bengal on 7 August. Under its influence, a low pressure area formed over northwest and adjoining west central Bay of Bengal off Orissa- West Bengal coast on 8 August morning. It became well marked over the same region on 9 August morning and concentrated into a depression on the same evening. It lay centred at 1200 UTC of 9 August over coastal Orissa near lat N/long E close to Puri. The depression moved northwestwards and lay centred over north Orissa near lat E/long E, close to Keonjhargarh at 0300 UTC of 10 August. Moving in a northwesterly direction, it weakened into a well marked low pressure area over north Orissa and neighbourhood at 1200 UTC of the same day and lay as a low pressure area over East Madhya Pradesh and neighbourhood on 11 August morning. It became less marked on 12 August morning. However, the associated upper air cyclonic circulation lay over northwest Madhya Pradesh and adjoining East Rajasthan extending upto midtropospheric level on 12 August. The cyclonic circulation lay over East Rajasthan and neighbourhood extending upto 2.1 Km above mean sea level on 13 August and merged with the monsoon trough on 14 August. The INSAT imagery of the system is shown in Fig Fig.2.10: Insat imageries at 0900UTC over the Indian region on 9 and 11 August
33 As the system was short lived, it did not cause much adverse weather and there was no damage reported due to this system. However, it caused widespread rainfall with scattered heavy to very heavy rainfall over Orissa. Like the previous system, the heavy rainfall occurred mostly in the left forward sector of the depression. However, northern sector of the system covering West Bengal and Sikkim and northeastern states also got heavy rainfall. Active/vigorous monsoon condition prevailed upto west coast in the southwest and northeastern states in the northeast unlike the previous system when it extended only in west to northwest direction Deep Depression over Bay of Bengal September, 2008 An upper air cyclonic circulation extending upto mid-tropospheric level lay over North Bay of Bengal on 14 September. Under its influence, a low pressure area formed over northwest Bay of Bengal off Orissa-West Bengal coasts on 15 September morning and it became well marked in same afternoon. Due to strong divergence, moderate vertical wind shear and easterly flow over the region, the system further concentrated into a depression and lay centered at 1200 UTC of 15 September over northwest Bay of Bengal near Lat N and Long E, about 230 kms east-southeast of Paradip. The system was located to the south of the upper level anticyclone with strong divergent easterly flow over the region and moderate vertical wind shear. Under this scenario, it moved westnorthwestwards and further intensified into a deep depression and lay centered at 0300 UTC of 16 September over northwest Bay of Bengal near Lat N and Long E, about 130 kms southeast of Chandbali. Moving northwestwards, the system crossed Orissa coast near Chandbali between 1600 and 1700 UTC of 16 September (Fig. 2.11) and lay centered at 0300 UTC of 17 September over north Orissa near Keonjhargarh. It lay centred at 0300 UTC of 18 September over north Chhattishgarh, about 50 km north of Champa. It further moved northwestwards, weakened into a depression and lay centred at 1730 IST hours over north Chattishgarh near Pendra. The depression lay centred at 0300 UTC of 19 September over northeast Madhya Pradesh close to Satna. The system came under the influence of the mid-latitude westerly trough (Fig.2.5) and moved northward and weakened into a well marked low pressure area central Uttar Pradesh & neighbourhood at 1200 UTC of 19 September. A few INSAT imageries of the system are shown in Fig The maximum 24 hours pressure fall of 15.3 hpa was recorded over Chandbali at 1700 UTC of 16 September. The lowest pressure of hpa was also recorded over Chandbali at 1700 UTC of 16 September. The maximum surface wind of 40 knots was reported by Chandbali at 1700 UTC of 16 26

34 September. The 24 hrs pressure change in association with the system could very well indicate well in advance the likely movement of the system. From Fig.2.11, maximum sustained surface wind of 40 knots was recorded over Chandbali around the time of landfall in association with the thunder squall. As a result, there was breaking of tree branches and uprooting of small trees over coastal Orissa. Fig.2.11: Coastal hourly observations from Orissa during 1300 to 1800 UTC Of 17 September showing point and time of landfall of deep depression near Chandbali A few INSAT imageries of the system are shown in Fig The stream line analyses over Indian region in association with the system at 850, 500 and 200 hpa levels are shown in Fig Widespread rainfall with scattered heavy to very heavy falls and isolated extremely heavy fall was recorded over Orissa at 0300 UTC of 17 and 18 September Scattered heavy to very heavy falls also occurred over Chhattisgarh on 19 September. As a result, flood conditions prevailed over Orissa, especially over the Mahanadi, Brahmani and Baitarani river basins due to this system. There was distant effect of the system influencing the rainfall over western part of the country. Also there was interaction with mid-latitude westerlies leading to increase in rainfall over western Himalayan region and adjoining plains (Ananthakrishnan and Bhatia, 1960). It caused flood over Yamuna river basin affecting Haryana, Delhi and Uttar Pradesh. 27

35 Comparing the rainfall distributions due to the three depressions, they were characteristically different from each other, mainly due to variation in the characteristics of the associated monsoon trough and interaction of mid-latitude westerlies. Fig.2.12: Stream line analyses of (a) 850 hpa, (b) 500 hpa and (c) 200 hpa levels at 0000 UTC of (i-iv) September


36 Fig.2.13: Insat imageries of deep depression over the Bay of Bengal at 0600 UTC of September
37 2.3.2 Low pressure areas/well marked low pressure areas Altogether 7 low pressure areas / well marked low pressure areas formed during the season. Most of them originated as upper air cyclonic circulations. Five of them formed over the Bay of Bengal and 2 over the land. Month wise breakup of the systems is, 2 in June, 2 in July, 1 in August and 2 in September Upper air cyclonic circulations There were 27 upper air cyclonic circulations (in lower and middle tropospheric levels) formed during the season. The month wise break up of these is 9 in June, 5 in July, 6 in August and 7 in September Eastward moving cyclonic circulations/western Disturbances There were 43 eastward moving systems as upper air cyclonic circulations. The month wise break-up is 11 in June, 11 in July, 11 in August and 10 in September. 2.4 Floods and droughts During the southwest monsoon season 2008, many states viz., Assam, West Bengal, Arunachal Pradesh, Orissa, Uttar Pradesh, Punjab, Bihar, Andhra Pradesh and Karnataka experienced flood situations during various parts of the season. Incessant heavy rainfall due to synoptic features including interaction of monsoon flow with the mid-latitude westerly flow regime as well as the northward shift of monsoon trough towards northeast India were the major cause of flooding over the northern plains and northeast India. Unlike last year, no subdivision experienced drought conditions, during the current season. On a district scale, out of 516 meteorological districts, 65 districts (13%) experienced moderate drought and 17 districts (3%) experienced severe drought at the end of the season The meteorological aspects of severe floods during southwest monsoon 2008 The source of the flood data provided in this section is mainly from the website maintained by the Dartmouth flood observatory, supplemented with other media reports and damage reports provided by various RMCs & MCs. 30
38 Northeastern states (Assam, Arunachal Pradesh) (11 June 3 July) Kelegai river flooded many districts of Assam and Arunachal Pradesh. Damage: Flooding in these northeastern states left 8 people dead and displaced nearly 4,00,000 people in 359 villages in Lakhimpur and Sonitpur districts. Cause: Heavy rain. Synoptic situations: By 2 June, the SW monsoon had advanced over most parts of Nagaland-Manipur-Mizoram-Tripura and Assam & Meghalaya and entire Arunachal Pradesh and by 9 June, it covered the entire northeastern states. Heavy rain associated with the active monsoon conditions led to flood situations Assam, Orissa, West Bengal (5-14 July) Three rivers, Damodar, Kharkai and Suvarnarekha were overflowed, which also posed threats to Ranchi and Jamshedpur districts. Cause: Heavy rain. Synoptic situations: (1) A well marked low pressure area formed over the north Bay and adjoining areas of West Bengal Bangladesh coasts and moved inland during 7-12 July. (2) A cyclonic circulation extending upto mid-tropospheric levels lay over Gangetic West Bengal and adjoining Bangladesh on 13 & 14. It lay as a trough extending upto 2.1 km.a.s.l. from Sub-Himalayan West Bengal& Sikkim to north Bay during Karnataka (20-31 July) Rivers Bhadra, Kumudnathi, Varda, Malathi and Dandavati flowed above danger mark. Tunga river in Shimoga overflowed at Korpalayanna Chatra which was submerged in flood water. Also Lakshmanatheertha river originating in Brahmagiri hills catchment area, a tributary to the Cauvery River flooded. Low lying areas and roads were flooded in the urban areas. Damage: Five people lost their lives. More than 10 houses were damaged. Many trees were uprooted and road transport was badly affected. Cause: Heavy rains. Synoptic situations: (1) A cyclonic circulation lay between 1.5 and 3.1 km.a.s.l. over east central and adjoining southeast Arabian Sea off Karnataka-Kerala coasts on 23. (2) During the period July, the formation of a low pressure area over the Bay of Bengal caused a revived of rainfall activity over the peninsular India. 31
39 Assam, Uttar Pradesh and Bihar (20 July 8 Aug.) Brahmaputra and its tributaries flowed above danger mark. In Nepal, unremitting rains for a continuous two weeks, flooded swaths of heavily populated southern plains, known as the Terai region, on the border with India. Damage: Floods affected thousands of people in Assam, Uttar Pradesh and Bihar. Cause: Heavy rains in the northern plains as well as in Bangladesh and Nepal. Synoptic situations: (1) A cyclonic circulation extending upto mid-tropospheric levels lay over the west Bay off West Bengal Bangladesh coasts on 18 and 19 July, Bihar and adjoining east Uttar Pradesh on 20 July and over east Uttar Pradesh and neighbourhood during The system lingered over Uttar Pradesh with an east-west oscillatory movement due to the interaction between mid-latitude westerly flow and the monsoon circulation pattern. The same situation caused enhanced rainfall over Nepal as well as Bangladesh, which inturn caused the downstream flooding Andhra Pradesh (5 11 August) Munneru (tributary of Krishna) and other rivers flooded. Damage: Floods took a toll of 70 lives in Andhra Pradesh. Many low lying areas were inundated. Rail and road traffic were also badly affected. Cause: Heavy rains. Synoptic situations: SW monsoon had been active owing to the formation of a Depression over the northwest and adjoining westcentral Bay off south Orissa north Andhra coasts and its subsequent inland movement Punjab (21-27 August) Rivers Sutlej, Ravi and Ghaggar were swollen. Damage: Twenty-two lives were lost. An infrastructure cum crop loss of Rs. 945 crores were incurred due to incessant rain and flooding. As many as 75,000 to 80,000 acres of crop land have been destroyed. At least 2400 houses were affected in which 1800 houses completely damaged. Floods also damaged barbed wire fencing at several places along the border. Border security force observational posts were also damaged. Cause: Incessant heavy rain. Synoptic situations: Three cyclonic circulations persisted over Punjab, one followed by the other, during the period Aug. 32
40 Bihar (18 Aug. 24 Sept.) Kosi river, originating from the Himalayas flooded and changed its course. Damage: Floods in Bihar claimed 47 human lives, Over 20 lakh people were affected in 14 districts of the state. Cause : Torrential rains caused the Kosi river in neighbouring Nepal to burst its banks. Synoptic situations: Eastward moving systems continued to pass across the Himalayas. Eventhough the monsoon trough remained in its near normal position, the monsoon activity over the country as a whole remained subdued during Aug Assam and Bihar (30 Aug. 8 Sept.) Brahmaputra river and its tributaries flowed above danger level. Damage: About 24 people lost their lives and 2.1 million people were displaced. The worst hit districts were Dhubri, Jorhat, Kamrup, Lakhimpur, Dhemaji and Morigaon. The swirling flood waters of the Brahmaputra river had cut a treacherous swath across Assam, breaching more than 54 vital embankments, besides sweeping away road bridges. Cause: Heavy rains. Synoptic situations: Widespread rainfall activity occurred over northeast India, due to the northward shifting of the monsoon trough. The eastern end of it passed through northern parts of Bihar towards northeast India on 28 and 29 Aug. and remained close to the foothills during 30 Aug. 5 Sept Orissa (22-29 Sept.) The river Mahanadi breached its banks at several places. Damage: Large parts of the state were inundated after opening dozens of sluice gates of the Hirakud dam on the Mahanadi river. Floodwaters swept away highways in some areas. In Boudh district of Orissa, many villages remained marooned. Cause: Heavy rain in the catchment area of Mahanadi river. Synoptic situations: A Deep Depression formed over the northwest Bay during Sept, It crossed Orissa coast near Chandbali and moved westnorthwestwards across the state. 2.5 Conclusions and future scope (i) Frequency of cyclonic disturbances ( depressions and higher intensity systems) over the Indian region during the SW monsoon season of 2008 was significantly low, with development of 4 systems compared to long period average of about 7 disturbances. However, it was comparable considering recent years, as the average frequency of the disturbances during monsoon season was about
41 (ii) (iii) (iv) based on data of No system developed as remnant of the systems from south China Sea. The month of July was devoid of any monsoon depression like the previous July of 1995, 1998, 2000, 2001, 2002 and The first ever land depression developed in August 2008 after The cyclonic disturbances during 2008 developed in association with (i) formation of prominent cloud clusters and their persistence over north Bay of Bengal, (ii) surges in cross equatorial monsoon flow inducing cyclonic shear to the north of wind maxima over south and central Bay of Bengal, (iii) slow descent of the midtropospheric cyclonic circulations to the surface level. The movement of the systems was climatological, as the depressions developing over the Bay of Bengal and coastal Orissa moved west-northwestwards/ northwestwards. No system had a longer track, as no system moved to the left of 80 deg east affecting rainfall over central and western India. The characteristic decrease in frequency of cyclonic disturbances during July and absence of land depressions during August over recent years needs to studied further. In view of decrease in frequency of remnants of disturbances from south China Sea, the relationship between genesis of disturbances over the Bay of Bengal and the westward moving remnants may be looked into to find their relationship. The decreasing tendency of westward movement of cyclonic disturbances needs further investigation with numerical diagnostic tools. The cause of shorter life duration of disturbances and its impact on rainfall in smaller spatial scale need further investigation. The interaction of mid-latitude westerlies with the monsoonal systems was very prominent during monsoon, 2008, resulting in rainfall in other sectors apart from left forward sector. A detailed investigation is essential to monitor and predict the heavy rainfall due to these interactions. The extremely heavy rainfall due to cyclonic disturbances and its region of occurrence still remains a challenge to the forecasters, due to meso-scale nature of heavy rainfall events. This issue needs to be resolved using latest observational tools like satellite and DWR along with high resolution numerical weather prediction models for effective flood management. 34
42 References: Ananthakrishnan, R. and Bhatia, K. L., 1960, Tracks of monsoon depressions and their recurvature towards Kashmir, Int. Symp., Monsoon of the world, IMD, New Delhi. Chen, T. C. and Wang, S. P., 1999, Interannual and intraseasonal variations in monsoon depressions and their westward propagating predecessors, Mon. Wea. Rev., 121, Choudhary, A. and Gaikward, S. D., 1983, On some characteristic features of rainfall associated with monsoon depression, Mausam, 34, 35. Goswami, B. N., Ajayamahan, R. S., Xavier, P. K. and Sengupta, D., 2003, Clustering of synoptic activity by summer monsoon intraseasonal oscillations, Geophys. Es. Lett., 30, IMD, 1979, Tracks of Storms and depressions over Bay of Bengal and Arabian Sea : ; Published by India Meteorological department IMD, 1996, Tracks of Storms and depressions over Bay of Bengal and Arabian Sea, ; Published by India Meteorological department. IMD, 2008, Tracks of Storms and depressions over Bay of Bengal and Arabian Sea, ; Cyclone e-atlas of IMD, Published by India Meteorological department Jadhav, S. K. and Munot, A. A., 2004, Statistical study of low pressure systems during summer monsoon season over Indian region; Mausam, 55, Mandke, S. K. and Bhide, U. V., 2003, A study of decreasing storm frequency over Bay of Bengal, J. Ind. Geophys. Union, 7, Mohapatra, M, 2006, Some physical characteristics of southwest monsoon circulation and precipitation over Orissa, Ph. D. Thesis, Utkal University. Mohapatra, M. and Mohanty, U. C., 2009, Excess and deficient rainfall over Orissa during monsoon season in relation to low pressure systems, Mausam, 60 (In press) Mooley, D. A. and Shukla, J., 1989, Main features of the westward moving low pressure systems which form over the Indian region during the summer monsoon season and their relation to the monsoon rainfall; Mausam, 40, Mooley, D. A., 1973, Some aspects of the Indian summer monsoon depressions, Mon. Wea. Rev., 101, Mukherjee, A. K. and Shyamala, B., 1978, Distant effects of monsoon depressions on weather over west Rajasthan; Indian J. Met. Geophys., 29, Pattanaik, D. R., Lamba, B. S. and Thapliyal, V., 2004, Decadal trends in westward movement of monsoon depressions over India; Mausam, 55,
43 Rajamani,S. and Rao,K.V., 1981, On the occurrence of rainfall over southwest sector of monsoon depression', Mausam, 32, Rao, Y.P., 1976, 'Southwest monsoon. Met Monograph. Synop. Met. 1/1976, Saha, K. R., Sanders, F. And Shukla, J., 1981, Westward propagating predecessors of monsoon depressions, Mon. Wea. Rev., 109, Sikka, D. R. and Grey, W. M., 1981, Formation of monsoon disturbances in north Indian Ocean with the passage of baroclinic waves across the southern Indian Ocean, Proc. Int. Conf. on Sci., Results of the monsoon experiment (Bali, Indonesia), WMO, Geneva, Sikka, D. R., 2006, Excess and drought conditions over India during summer monsoon season in relation to low pressure systems, COLA Technical Report, CTC
44 37 1) Monsoon Trough 2) Heat Low TABLE 2.1 POSITIONS OF SEMI-PERMANENT SYSTEMS FOR THE YEARS 2003 TO Established on 5 July. Less marked on 16 Sept. No Breaks. Appeared on 22 May, seen till 15 Sept. Lowest Pressure hpa 3) T. A. Established on 15 June. Not seen at 500 hpa during June and first half of July. Less marked on 14 Sept. 4) TEJ Seen from 9 May to 25 Sept. Maximum wind speed 125 kts at 116 hpa over Minicoy on 25 July. Established on 18 July. Less marked in the last week of Sept. Breaks during June & 26 Aug.-8 Sep. Appeared on 15 May, seen till 20 Sept. Lowest Pressure hpa Established on 13 June. Not seen at 500 hpa during many of the days. Less marked on 19 Sept. Seen from 10 May to 30 Sept. Maximum wind speed 180 kts at 118 hpa over Minicoy on 22 June. Established on 30 June. Less marked on 2 September. Break like situation during & Aug. Appeared 4 June. Seen till 8 Sept. Lowest pressure 988 hpa Established on 26 June. Less marked 27 Sept. Seen from 6 June Maximum wind speed 110 kts : over Thiruvananthapuram on 31 July at 100 hpa and on 8 July over Chennai. Established on 24 July. Got diffused in later part of the Sept., gradually Break like situation during 6 to 13 September. Appeared on 23 May, seen till 4 Sept. Lowest Pressure 985 hpa Established on 7 June. Not seen at 500 & 300 hpa on most of the days during June & July. Less marked from 10 September onwards. Seen from 11 May to 4 October. Maximum wind speed 100 kts at 128 hpa on 1 July over TRV and over Minicoy on 25 July & 31 Aug. at 202 & 200 hpa respectively Established on 4 July. Remained close to the foothills during July, July, August and September. Became less marked from 24 September. Appeared on 13 June. Seen till 23 September. Lowest pressure 987 hpa Established on 21 June. Absent at 500 & 300 hpa during later half of July and was to the northeast of normal position in August and to the west in September. Less marked from 30 September onwards. Seen from 16 May to 9 October. Core wind speed of 100 kts. was reported over TRV, MNC, PBL and VSK on a few days in June, July and August. Established on 10 July. Remained close to the foothills of Himalayas from July and 30 August 3 September. the trough became less delineatable on the sea level chart from 29 September Appeared on 5 June. Seen till 25 September. Lowest pressure hpa Established on 26 June. It was noticed upto 15 September. On many days during the later half of July, it remained east of normal position, to the northeast on many days during August and to the north during September. Seen on a regular basis from 25 May onwards. It was present until the beginning of October. A core wind speed of 100 kts. was noted over Port Blair on a few days in June, July and September.
45 (.table 2.1 contd.) 5) STWJ Seen over Srinagar on 5 June. Reappeared on 1 Oct. Seen over Srinagar on 23 June. Reappeared during the first week of Oct. Seen over Srinagar upto 22 June. It then shifted northwards and made casual re-appearances over many stations. Seen over Srinagar and Delhi latitudes upto 11 June. It then shifted northwards thereafter, made casual reappearances. It was seen over Delhi and Srinagar from 29 September onwards. Seen over Srinagar and Ranchi latitudes upto 27 June. It appeared over Srinagar on 3 October and over Delhi on 7 October. STWJ was seen over Delhi and Guwahati latitudes upto 10 June. It re-appeared over Delhi on 10 September. 38
46 TABLE 2.2 Details of low pressure systems for the month of June Sr. No. System Duration Place of first location Direction of movement Final location (1) (2) (3) (4) (5) (6) (7) I Depressions 1. Depression 5-6 Eastcentral Arabian Sea 2. Depression North Bay off Bangladesh coast II Low Pressure Area/ Well marked low pressure area 1. Well marked low pressure area 9-11 Saurashtra & Kutch and neighbourhood 2. Low pressure area Jharkhand and adjoining Bihar Northwest Northwest and adjoining westcentral Arabian Sea Remarks Weakened over the ocean and moved away westwards. Northwest Jharkhand Remnant low pressure area moved upto east Uttar Pradesh and adjoining east Madhya Pradesh and became less marked on 21. Westnorthwest Quasi-Stationary Northwest and adjoining northeast Arabian Sea. Jharkhand and adjoining Bihar and Gangetic West Bengal Moved away westwards. The associated upper air cyclonic circulation became less marked on 26. III Upper air cyclonic circulations 1. Between 2.1 & 4.5 km. a.s.l. 2-3 Lakshadweep area and neighbourhood Quasi Stationary - Merged with the low pressure area over the eastcentral Arabian Sea on 4.
47 (.table 2.2 contd.) (1) (2) (3) (4) (5) (6) (7) 2. Upto the mid tropospheric levels 8-11 Northwest and adjoining westcentral Bay off south Orissanorth Andhra coasts 3. -do Chattisgarh and neighbourhood 4. Between 2.1 & 4.5 km. a.s.l Saurashtra & Kutch and neighbourhood Northwest Orissa and adjoining Gangetic West Bengal Became less marked on 12. Stationary Insitu Became less marked on 13. Northeast East Rajasthan and adjoining Haryana Became less marked on Upto mid tropospheric levels Central parts of Uttar Pradesh Oscillatory East Uttar Pradesh and neighbourhood 6. -do Gangetic West Bengal and neighbourhood 7. Upto lower tropospheric levels 8. Upto mid tropospheric levels 9. Between 1.5 & 4.5 km a.s.l. 24 June 11 July 26 June 1 July 29 June 2 July West Uttar Pradesh and neighbourhood Gangetic West Bengal and adjoining north Orissa Eastcentral Arabian Sea off south Gujarat north Maharashtra coasts Quasi-Stationary Oscillatory Northwest Quasi-Stationary Gangetic West Bengal and adjoining Bangladesh West Rajasthan and neighbourhood Jharkhand and neighbourhood Gujarat region and neighbourhood Became less marked on 19. Became less marked on 21. Became less marked on 12 July. Became less marked on 2 July Became less marked on 3 July.
48 (.table 2.2 contd.) (1) (2) (3) (4) (5) (6) (7) IV Eastward moving upper air Cyclonic Circulations 1. Upto mid tropospheric levels 4-8 North Pakistan and adjoining Jammu & Kashmir Northeast Jharkhand and neighbourhood Moved away on 9 2. Upto lower tropospheric levels 2-4 West Rajasthan and neighbourhood Stationary Insitu Became less marked on Upto 3.6 km.a.s.l North Pakistan and adjoining Jammu & Kashmir 4. Upto 2.1 km a.s.l Central Pakistan and adjoining west Rajasthan 5. Upto mid tropospheric levels 6. Upto mid tropospheric levels North Pakistan and adjoining Jammu & Kashmir Northeast -do- Jammu & Kashmir and neighbourhood. Punjab and neighbourhood Moved away on 13 Became less marked on 19 -do- Jammu & Kashmir Moved away on do- Eastnortheast Eastern parts of Jammu & Kashmir Moved away on do do- Northeast Jammu & Kashmir and neighbourhood Moved away on Upto mid tropospheric levels North Pakistan and neighbourhood Northeast Jammu & Kashmir and neighbourhood Moved away on do Punjab and neighbourhood Stationary Insitu Became less marked on do- 27 North Pakistan and 28 t neighbourhood Northeast Jammu & Kashmir and neighbourhood Moved away on 29
49 (table 2.2 contd) (1) (2) (3) (4) (5) (6) (7) 11. -do- 29 June- 2 July -do- -do- -do- Moved away on 2 July. V Troughs 1. Lower level westerlies Central Pakistan and adjoining west Rajasthan Stationary insitu Became less marked on
50 TABLE 2.3 DETAILS OF LOW PRESSURE SYSTEMS FOR THE MONTH OF JULY Sr. No. I System Duration Place of first location Direction of movement Final location Remarks (1) (2) (3) (4) (5) (6) (7) Low Pressure Areas 1. Well marked low pressure areas 7-12 North Bay and adjoining West Bengal-Bangladesh coasts 2. -do Northwest Bay and adjoining south Orissa coast II Upper air cyclonic circulations 1. Upto midtropospheric levels 2. Between 2.1 & 4.5 km a.s.l. 3. Between 1.5 & 3.1 km.a.s.l North Bay off West Bengal Bangladesh coasts Gujarat region and adjoining north Maharashtra South Tamil Nadu and neighbourhood Westnorthw est -do- Northwest Madhya Pradesh and neighbourhood Vidarbha and adjoining Chattisgarh and east Madhya Pradesh Northwest East Uttar Pradesh and neighbourhood Quasi- Stationary Northwest Gujarat region and neighbourhood Eastcentral and adjoining southeast Arabian Sea off Karnataka Kerala coasts Became less marked on 13. The associated upper air cyclonic circulation persisted over north Madhya Pradesh and neighbourhood upto 31 July and became less marked on 1 August. Became less marked on 28. Became less marked on 23. Became less on 24.
51 (table 2.3 contd ) (1) (2) (3) (4) (5) (6) (7) 4. Between 2.1 & 5.8 km. a.s.l. 27July-5 August Gujarat region and neighbourhood Stationary Insitu Became less on 6 August. 5. Upto midtropospheric levels 30 July- 1 August Orissa and neighbourhood Westnorthwest - Merged with the cyclonic circulation over east Madhya Pradesh and neighbourhood on 2 August. III Eastward moving upper air Cyclonic Circulations 1. Upto lower tropospheric levels 1-7 Northwest Rajasthan and neighbourhood Northeast Punjab and neighbourhood Became less marked on Upto mid tropospheric levels 4-8 North Pakistan and adjoining Jammu & Kashmir Northeast Jammu & Kashmir and neighbourhood Moved away on do North Pakistan and neighbourhood 4. -do Northwest Rajasthan and adjoining Punjab 5. -do North Pakistan and neighbourhood -do- -do- Moved away on 15. Stationary Insitu Became less marked on 16. Northeast Jammu & Kashmir and neighbourhood Moved away on Upto lower tropospheric levels 7. Upto mid tropospheric levels Punjab and neighbourhood North Pakistan and neighbourhood Stationary insitu Became less marked on 23. Northeast Eastern parts of Jammu & Kashmir Moved away on 22.
52 (table 2.3 contd ) (1) (2) (3) (4) (5) (6) (7) 8. -do do- -do- Jammu & Kashmir and neighbourhood Moved away on Upto lower tropospheric levels Northwest Rajasthan and adjoining Punjab Stationary Insitu Became less marked on Upto mid tropospheric levels North Pakistan and adjoining Jammu & Kashmir -do- Eastern parts of Jammu & Kashmir Moved away on do Jammu & Kashmir and neighbourhood -do- Eastern parts of Jammu & Kashmir Moved away on 31 st. IV Troughs Lower level westerlies Sub-Himalayan West Bengal and Sikkim to North Bay Stationary Insitu Became less marked on 18 th.
53 TABLE -2.4 Details of low pressure systems for the month of August Sr. No. I Systems Duration Place of first location Direction of movement Final Location (1) (2) (3) (4) (5) (6) (7) Depressions 1. Depression 9-10 Northwest and adjoining westcentral Bay off south Orissanorth Andhra coasts II Low pressure areas 1. Low pressure area 2-5 Northwest and adjoining westcentral Bay off Orissa-Andhra coasts III Upper air cyclonic circulations 1. Upto lower tropospheric levels 2-3 East Madhya Pradesh and neighbourhood 2. Between 1.5 & 5.8 km a.s.l. 13 Gangetic West Bengal and neighbourhood Remarks Northnorthwest Interior Orissa It rapidly weakened over land. However, the remnant cyclonic circulation moved upto Punjab and neighbourhood and caused heavy rainfall over there. Westnorthwest South chattisgarh and neighbourhood The associated upper air cyclonic circulation lay over north Chattisgarh and adjoining Jharkhand on 6 t and merged with the above system, in its formative stage on 7. Stationary Insitu Became less marked on 4 -do- -do- It lay as a trough extending from Sub-Himalayan West Bengal & Sikkim to north Bay on 14and became less marked on 15.
54 (table 2.4 contd ) (1) (2) (3) (4) (5) (6) (7) 3. Upto lower tropospheric levels West Uttar Pradesh and neighbourhood Oscillatory Insitu Became less marked on Upto mid tropospheric levels Northwest Bay and adjoining coastal areas of West Bengal and Orissa Westnorthwest West Madhya Pradesh and east Rajasthan Became less marked on do South Tamil Nadu and neighbourhood Stationary Insitu Became less marked on Upto mid tropospheric levels 31 Aug- 5 Sep South Tamil Nadu and adjoining Kerala Northwest Eastcentral and southeast Arabian Sea and adjoining coastal areas of Karnataka and Kerala Became less marked on 6. IV Eastward moving upper air Cyclonic Circulations 1. Upto lower tropospheric levels 3-6 Southwest Rajasthan and neighbourhood Northeast Punjab and neighbourhood Became less marked on do- 6 South Rajasthan and neighbourhood Stationary insitu Became less marked on Upto mid tropospheric levels 3-7 North Pakistan and neighbourhood Northeast Jammu & Kashmir and neighbourhood Moved away on do do- -do- -do- Moved away on do North Pakistan and adjoining Jammu & Kashmir -do- -do- Moved away on 19.
55 (table 2.4 contd ) (1) (2) (3) (4) (5) (6) (7) 6. -do North Pakistan and neighbourhood 7. -do East Uttar Pradesh and adjoining east Madhya Pradesh 8. -do Punjab and neighbourhood -do- -do- Eastern parts of Jammu & Kashmir. East Uttar Pradesh and adjoining northeast Madhya Pradesh Moved away on 26 Became less marked on 24 Stationary insitu Became less marked on Upto lower tropospheric levels 27 Aug- 12 Sep. -do- -do- -do- Became less marked on 13 September Upto mid tropospheric levels 25 27Mornin g North Pakistan and neighbourhood Northeast Jammu & Kashmir and neighbourhood Moved away on 27 evening. 11. Upto midtroposhperic levels 27 Aug 1 Sep. North Pakistan and neighbourhood Northeast -do- Moved away on 2 September. V Troughs 1. Mid and upper tropospheric westerlies Lat. 40 N/ Long. 80 E to Lat. 24 N/ Long. 68 E at 7.6 km a.s.l. Stationary Insitu Became less marked on 20.
56 TABLE 2.5 Details of low pressure systems for the month of September Sr. No. System Duration Place of first location Direction of movement Final Location (1) (2) (3) (4) (5) (6) (7) I Depressions 1. Deep Depression North Bay and neighbourhood II Low pressure areas 1. Well marked low pressure area 9-13 Westcentral Bay off north Andhra coast Westnorthwest and then northnorthwest West Northeast Madhya Pradesh close to Satna Marathwada and neighbourhood Remarks Remnant low pressure area moved upto northwest Uttar Pradesh and neighbourhood and became less on 21. The associated upper air cyclonic circulation persisted over east Uttar Pradesh and neighbourhood upto 25. The associated upper air cyclonic circulation lay over west Madhya Pradesh and neighbourhood on 14 and became less marked on 15.
57 (table 2.5 contd) (1) (2) (3) (4) (5) (6) (7) 2. Low pressure area III 22evenin g 28. Upper air cyclonic circulations North Bay and neighbourhood North and then west Gangetic West Bengal and neighbourhood It persisted over the north Bay and neighbourhood as a feeble low pressure area during The associated upper air cyclonic circulation moved upto east Uttar Pradesh and adjoining east Madhya Pradesh and persisted there upto 3 Oct Upto lower tropospheric levels 1-4 North Tamil Nadu and neighbourhood 2. -do- 8-9 Marathwada and neighbourhood 3. -do Eastcentral Arabian Sea off south Gujarat Maharashtra coasts Stationary Insitu Became less marked on 5. Northwest Quasi-stationary Madhya Maharashtra and neighbourhood Gujarat region and neighbourhood Became less marked on 10. Became less marked on Between 1.5 & 3.6 km.a.s.l. 24 Gujarat region and neighbourhood Stationary insitu Became less marked on Upto mid tropospheric levels 30 Sep- 4 Oct. Northwest Bay off Orissa-West Bengal coasts Drifted southwards along the east coast Southwest Bay off Tamil Nadu coast Became less marked on 5 Oct.
58 (table 2.5 contd) (1) (2) (3) (4) (5) (6) (7) 6. Between 3.1 & 5.8 km. a.s.l. 25 Sept. -5 Oct. Eastcentral Arabian Sea off Maharashtra- Goa coasts. Quasi-stationary Southeast Arabian Sea off Karnataka- Kerala coasts Became less marked on 6 Oct. 7. Upto lower tropospheric levels 30 Sep. 6 Oct. West UttarPradesh and neighbourhood -do- West Uttar Pradesh and adjoining Uttarakhand Became less marked on 7 Oct. IV Eastward moving upper air Cyclonic Circulations Upto mid tropospheric levels 2-5 North Pakistan and neighbourhood 2. -do West Rajasthan and neighbourhood 3. -do- 4-7 North Pakistan and neighbourhood Northeast Jammu & Kashmir and neighbourhood Moved away on 6. Stationary Insitu Became less marked on 12 Northeast Jammu & Kashmir and neighbourhood Moved away on do do- -do- -do- Moved away on do do- -do- -do- Moved away on do do- -do- -do- Moved away on do do- Eastnortheast -do- Moved away on do do- Northeast -do- Moved away on do do-- -do- -do- Moved away on 27.
59 (table 2.5 contd) (1) (2) (3) (4) (5) (6) (7) 10. -do do- -do- -do- Moved away on 1 Oct. V Troughs 1. Lower level westerlies 2. Mid & upper tropspheric westerlies 3-6 Sub-Himalayan West Bengal & Sikkim to north Bay Along Long. 72 E to the north of Lat. 25 N at 7.6 km a.s.l. Stationary Insitu Became less marked on 7. Eastnortheast Along Long. 87 E to the north of Lat. 20 N. Moved away on
60 TABLE 2.6 NUMBER OF SYSTEMS AND DURATION Nos. Days Nos. Days Nos. Days Nos. Days Nos. Days Nos. Days 1) Storms: Jun Jul Aug Sept ) Depressions: Jun Jul Aug Sept Total (2) Total ) Low pressure areas: Jun Jul Aug Sept Total (3) Total ) Cyclonic Circulations: Jun Jul Aug Sept Total (4) Total ) Eastward Moving Systems : Jun Jul Aug Sept Total
61 Chapter 3 RAINFALL STATISTICS A. K. Srivastava This chapter provides various statistical information of the southwest monsoon rainfall at various spatial and temporal scales General Features The 2008 southwest monsoon rainfall over the country as a whole was near normal of its long period average. Rainfall activity during the season was not well distributed over space and time. Monsoon rainfall exhibited strong intra-seasonal variability during the season. Monsoon was active throughout June (except in fourth week), first fortnight of August and first three weeks of September. However, subdued monsoon conditions (break conditions) prevailed for several days at a stretch in July and second fortnight of August. Onset of monsoon took place over Kerala on 31 May, a day ahead of the normal date. Subsequently, southwest monsoon rapidly and regularly advanced westwards and northwards and by 16 June, it covered most parts of the country except the extreme northwest parts of the country. Thereafter, monsoon became weak and subdued rainfall activity prevailed throughout country almost for a week. Subsequently also, monsoon remained as a weak current over the Peninsula and central India. However, good rainfall 54
 was 98% of its Long Period Average (LPA).")
62 activity was observed over the northern and eastern parts of the country. Monsoon covered remaining parts of West Rajasthan on 10 July, five days ahead of its normal schedule. For the country as a whole, seasonal rainfall at the end of the southwest monsoon season (June to September) was 98% of its Long Period Average (LPA). The LPA value of southwest monsoon rainfall over the country as a whole, calculated with the data of is 89 cm. During the season, out of 36 meteorological subdivisions, 2 subdivisions received excess rainfall, 31 subdivisions received normal rainfall and remaining 3 subdivisions viz: Kerala (-22%), Vidarbha (-20%), West Madhya Pradesh (-21%) received deficient rainfall (Fig 3.1)). Out of 516 meteorological districts for which rainfall data were available, 76% of the meteorological districts received excess/ normal rainfall and the remaining 24% districts received deficient rainfall (rainfall deficiency more than 19%). During the season, 65 districts (13%) experienced moderate drought conditions (rainfall deficiency of 26% to 50%) and 17 districts (3%) experienced severe drought conditions (rainfall deficiency 51% and more). Fig.3.1: Sub-division wise seasonal rainfall (percentage departure) 55
63 Percent of districts with excess/normal and deficient/scanty rainfall for the years is given in the table below. Year Excess/Normal Deficient/Scanty Seasonal (June to September) rainfall anomaly, calculated using station wise rainfall data is shown in Fig The long period average is based on the data of period. Seasonal rainfall was above normal over most parts of the eastern and northern (except J & K) region, Konkan & Goa and parts of Peninsula and were below normal else where. Positive rainfall anomaly generally exceeded 30 cm over most parts of Uttar Pradesh, Bihar, Orissa, Punjab, Konkan & Goa and south Gujarat. Over parts of south western Maharashtra, positive rainfall anomaly exceeded 60 cm. Over northern parts of the Peninsula and adjoining central parts, negative rainfall anomaly exceeded 30 cm. Fig.3.2: Seasonal (June-Sept) rainfall anomaly (cm) calculated using stationwise data 56
64 Fig.3.3 shows number of deficient sub divisions during the last ten years and Fig.3.4 shows percentage of districts affected by the moderate or severe droughts conditions during the last ten years. 25 NO. OF DEFICIENT SUB-DIVISIONS DURING NUMBER Y E A R Fig.3.3: Number of deficient sub-divisions during the last 10 years 60 PERCENTAGE OF DISTRICTS AFFECTED BY MODERATE AND SEVERE DROUGHT % OF DISTRICTS Y E A R Fig.3.4: Percent of districts affected by moderate and severe drought 57
65 3.1 Monthly rainfall distribution During June, rainfall activity over the country as a whole was above normal. Except for the last week, there was good amount of rainfall during the month. Central and northern parts of the country received excess rainfall. Punjab, West Uttar Pradesh and Harayana, Chandigarh & Delhi received more than thrice of its normal rainfall, while Jammu & Kashmir, East Madhya Pradesh, East Uttar Pradesh, East Rajasthan and Himachal Pradesh received more than twice of its normal rainfall. However, parts of peninsula viz. Marathwada, Madhya Maharashtra, Rayalaseema, North Interior Karnataka, Kerala and parts of Gujarat and extreme northeastern region viz. Assam & Meghalaya, received deficient rainfall. For June 2008, rainfall over the country as a whole was 124% of its Long Period Average (LPA) value. During the month, out of 36 meteorological subdivisions, 16 received excess rainfall, 11 received normal rainfall and remaining 9 subdivisions received deficient rainfall (Fig.3.5a). During July, rainfall activity over the country as a whole was below normal. West coast, central, northwestern and extreme northeastern parts of the country received deficient rainfall. However, Indian islands, Bihar and East Uttar Pradesh received excess rainfall. For July 2008, rainfall for the country as a whole was 83 % of its Long Period Average (LPA) value. During the month, out of 36 meteorological subdivisions, 4 received excess rainfall, 12 received normal rainfall and remaining 20 subdivisions received deficient rainfall (Fig.3.5b). During August, rainfall activity over the country as a whole was near normal. Rainfall activity was over good over most parts of the country, barring central India, parts of Jammu & Kashmir and Kerala. For August 2008, rainfall for the country as a whole was 101 % of its Long Period Average (LPA) value. During the month, out of 36 meteorological subdivisions, 11 subdivisions received excess, 18 subdivisions received normal and 7 subdivisions received deficient rainfall (Fig.3.5c). During September, rainfall activity over the country as a whole was below normal. Saurashtra & Kutch received rainfall more than thrice of its Long Period Average value, while Madhya Maharashtra, Konkan & Goa, Marathwada, Gujarat region, Orissa and Kerala also received rainfall, nearly more than one and half times of their LPA value. For September 2008, rainfall over the country as a whole was 95 % of its Long Period Average (LPA) value. During the month, out of 36 meteorological subdivisions, 7 received excess rainfall, 12 received normal rainfall and 17 received deficient rainfall (Fig.3.5d). 58

66 (a) (b) (c) (d) Seasonal and monthly rainfall statistics for the 2008 monsoon season are given in Table


67 Table 3.1 Rainfall (mm) for each month and season as a whole (June-September) 60 60
68 The following table gives the respective number of subdivisions receiving excess, normal, deficient and scanty rainfall during the four months of monsoon season MONTH EXCESS NORMAL DEFICIENT SCANTY JUNE JULY AUGUST SEPTEMBER Daily rainfall distribution Averaged daily rainfall for the country as a whole and for four homogeneous regions for the period 1 June to 30 September is shown in Fig 3.6. All India daily rainfall was above normal on many days in June, first fortnight of August and September. It was below normal for several days at a stretch in July and second fortnight of August. All India daily rainfall was continuously above normal from 1 June to 21 June, 1 August to 15 August, and again from 6 to 21 September. It was below normal from 3 to 25 July (except on 10, 11 and 17 July) and 16 August to 5 September (expect on 27 and 31 August). Over south peninsula, daily rainfall was above normal during second and fourth week of June, 24 July to 15 August (except on 6, 7 and 8 August) and again from 26 August to 13 September.. It was below normal for several days at a stretch from 3 July to 23 July (except on 16 July) and on many days in the second fortnight of September. Over central India, daily rainfall was continuously above normal from 6 to 16 June, 28 June to 2 July, 26 to 30 July, 9 to 15 August and 9 to 21 September. It was below normal from 3 July to 25 July (except on 11 July), second fortnight of August and the last week of September. Over the northeast region, daily rainfall was above normal in the first three week of June, 12 to 24 July (except on 17 and 18 July), 11 to 31 August (except from 21 to 25). It was below normal on many days in the last week of July and first week of August and in September. Over the northwest region, daily rainfall was above normal during most of days up to 20 August and was below normal on many days during the remaining season.. RAINFALL (mm) ALL INDIA ACTUAL NORMAL JUN JUL AUG SEP
69 40 35 NORTHWEST INDIA RAINFALL(mm) JUN JUL AUG SEP RAINFALL(mm) JUN JUL AUG CENTRAL INDIA SEP NORTHEAST INDIA RAINFALL(mm) JUN JUL AUG SEP SOUTH PENINSULAR INDIA RAINFALL(mm) JUN JUL AUG D A T E SEP Fig.3.6: Daily mean rainfall (mm) averaged over the plains (vertical bars) and its long term ( ) average (continuous line) over the country as whole and the four homogeneous regions during the season 62
70 3.3 Weekly rainfall distribution Area weighted cumulative weekly rainfall percentage departure for the country as a whole and for four homogeneous regions (NW India, NE India, Central India and South Peninsula) for the period 1 June to 30 September is shown in Fig.3.7. Cumulative weekly rainfall percentage departure for the country as a whole was above normal for the first seven weeks and was slighly below normal in all the remaining weeks of the season (except for weeks ending 13 and 20 August). At the end of the monsoon season, cumulative rainfall was 2% below the long period average. Over the NW region, cumulative weekly rainfall percentage departure was positive in all the weeks of the season. At the end of the season, cumulative rainfall departure was 6.5% above its long period average. Over the NE region, cumulative weekly rainfall percentage departure was above normal till the week ending 23 July (except for the second week of the season). It was negative for the remaining week of the season. At the end of monsoon season, cumulative rainfall percentage departure was 5.7% below its long period average. Over the central region, cumulative weekly rainfall percentage departure was positive in the first six weeks (week ending 9 July) and was negative in all the subsequent weeks of the season. At the end of the season, monsoon rainfall was 3.7% below the long period average. Over the south peninsula, cumulative weekly rainfall percentage departure was positive in the first two weeks and again in the weeks ending 10 and 17 September and remained negative during all the subsequent weeks of the season. At the end of the season, cumulative rainfall departure was 4.2% below its long period average. Week by week and cumulative weekly rainfall departures for each of 36 meteorological subdivisions from 1 June to 30 September are shown in Figures 3.8 and 3.9 respectively. Rainfall was normal or excess on most of weeks (more than 50% of the week) in all subdivisions of the Northeast and Northwest India (except West Uttar Pradesh). However, weekly rainfall was normal or excess on the most of the weeks only in four meteorological sub-divisions (Orissa, West Madhya Pradesh, Konkan & Goa and Madhya Maharashtra) in the central India and in five meteorological sub-divisions (A&N Islands, coastal A P, Rayalseema, Tamilnadu, South Interior Karnataka). Cumulative weekly rainfall was normal or excess on most of weeks over as many as 34 out of 36 subdivisions except over Kerala and Marathwada. 63
71 FOR WHOLE INDIA PERIOD ENDING 250 FOR NORTH WEST INDIA PERIOD ENDING FOR NORTH EAST INDIA PERIOD ENDING FOR CENTRAL INDIA PERIOD ENDING FOR SOUTH PENINSULA PERIOD ENDING Fig.3.7: Area weighted cumulative weekly rainfall percentage departure for the country as a whole and the four homogeneous regions 64
72 WEEK ENDINGS S.NO. MET.SUBDIVISION 4-Jun 11-Jun 18-Jun 25-Jun 2-Jul 9-Jul 16-Jul 23-Jul 30-Jul 6-Aug 13-Aug 20-Aug 27-Aug 3-Sep 10-Sep 17-Sep 24-Sep 1 A & N ISLANDS 2 ARUNACHAL PRADESH 3 ASSAM &MEGHALAYA 4 NAG.,MANI.,MIZO.,TRIPURA 5 S.H.W.B.&SIKKIM 6 GANGATIC W.B. 7 ORISSA 8 JHARKHAND 9BIHAR 10 EAST U.P. 11 WEST U.P. 12 UTTARANCHAL 13 HAR., CHANDI., DELHI 14 PUNJAB 15 HIMACHAL PRADESH 16 JAMMU & KASHMIR 17 WEST RAJASTHAN 18 EAST RAJASTHAN 19 WEST M.P. 20 EAST M.P. 21 GUJARAT REGION 22 SAURASHTRA & KUTCH 23 KONKAN & GOA 24 MADHYA M'RASHTRA 25 MARATHAWADA 26 VIDARBHA 27 CHATTISGARH 28 COASTAL A.P. 29 TELANGANA 30 RAYALASEEMA 31 TAMIL NADU 32 COASTAL KARNATAKA 33 N.I.KARNATAKA 34 S.I.KARNATAKA 35 KERALA 36 LAKSHADWEEP EXCESS DEFICIENT NO RAIN +20%OR MORE -20%TO-59% NORMAL SCANTY +19% TO -19% -60% OR LESS Fig 3.8: Sub-division wise weekly rainfall 65
73 WEEK ENDINGS S.NO. MET.SUBDIVISION 4-Jun 11-Jun 18-Jun 25-Jun 2-Jul 9-Jul 16-Jul 23-Jul 30-Jul 6-Aug 13-Aug 20-Aug 27-Aug 3-Sep 10-Sep 17-Sep 24-Sep 30-Sep 1 A & N ISLANDS 2 ARUNACHAL PRADESH 3 ASSAM &MEGHALAYA 4 NAG.,MANI.,MIZO.,TRIPURA 5 S.H.W.B.&SIKKIM 6 GANGATIC W.B. 7 ORISSA 8 JHARKHAND 9BIHAR 10 EAST U.P. 11 WEST U.P. 12 UTTARANCHAL 13 HAR., CHANDI., DELHI 14 PUNJAB 15 HIMACHAL PRADESH 16 JAMMU & KASHMIR 17 WEST RAJASTHAN 18 EAST RAJASTHAN 19 WEST M.P. 20 EAST M.P. 21 GUJARAT REGION 22 SAURASHTRA & KUTCH 23 KONKAN & GOA 24 MADHYA M'RASHTRA 25 MARATHAWADA 26 VIDARBHA 27 CHATTISGARH 28 COASTAL A.P. 29 TELANGANA 30 RAYALASEEMA 31 TAMIL NADU 32 COASTAL KARNATAKA 33 N.I.KARNATAKA 34 S.I.KARNATAKA 35 KERALA 36 LAKSHADWEEP EXCESS DEFICIENT NO RAIN +20%OR MORE -20%TO-59% NORMAL SCANTY +19% TO -19% -60% OR LESS Fig 3.9: Sub-division wise cumulative weekly rainfall 66
74 3.4 Heavy Rainfall Events During the 2008 southwest monsoon season, heavy rainfall was reported at many stations. At some stations, record rainfall was also reported. The month wise and station wise distribution of extremely heavy rainfall events ( 25 cm in 24 hours) is given in Table 3.2. Record rainfall reported during the season is given in Table 3.3. Table List of stations, which reported extremely heavy rainfall ( 25 cm in 24 hours) during the monsoon season. DATE (JUNE) STATION NAME OF SUBDIVISION RAINFALL (cm) COOCH BEHAR SUB-HIMALAYAN W.B.& SIKKIM 35 JAMNAGAR SAURASHTRA,KUTCH & DIU 30 NAHARIAGUN ARUNACHAL PRADESH 26 ITANAGAR ARUNACHAL PRADESH 25 KAMRAJ GUJARAT REGION,DNH & DAMAN 25 RAIRANGPUR ORISSA 32 JALESWAR ORISSA 25 MIDANAPORE GANGETIC WEST BENGAL 37 JAMSHEDPUR JHARKHAND 34 RAIRANGPUR ORISSA 32 JALESWAR ORISSA 29 RAJGHAT ORISSA BOMDILA ARUNACHAL PRADESH DEOMALI ARUNACHAL PRADESH BOMDILA ARUNACHAL PRADESH 26 DATE RAINFALL STATION NAME OF SUBDIVISION (JULY) (cm) 2 VARANASI AP EAST UTTAR PRADESH 33 5 CHERRAPUNJI ASSAM & MEGHALAYA 28 KANPUR EAST UTTAR PRADESH 26 6 KANPUR EAST UTTAR PRADESH 34 KALPI WEST UTTAR PRADESH CHERRAPUNJI ASSAM & MEGHALAYA CHERRAPUNJI ASSAM & MEGHALAYA CHERRAPUNJI ASSAM & MEGHALAYA CHERRAPUNJI ASSAM & MEGHALAYA 34 ROHA KONKAN & GOA MANGAON KONKAN & GOA 26 MUMBAI KONKAN & GOA 25 (COLABA) 67
75 DATE (AUG) STATION NAME OF SUBDIVISION RAINFALL (cm) 2 ANAND GUJARAT REGION,DNH & DAMAN 26 4 SIRONCH VIDARBHA 28 MAHABALESHWAR MADHYA MAHARASHTRA GAGANBAVDA MADHYA MAHARASHTRA 36 BHIRA KONKAN & GOA 27 MAHABALESHWAR MADHYA MAHARASHTRA 49 BHIRA KONKAN & GOA GANDEVI GUJARAT REGION,DNH & DAMAN 31 KOTTIGEHARA SOUTH INTERIOR KARNATAKA 28 JABALPUR EAST MADHYA PRADESH 26 AGUMBE SOUTH INTERIOR KARNATAKA 25 JAWHAR KONKAN & GOA JAMBUGHODA GUJARAT REGION,DNH & DAMAN 35 BARODA GUJARAT REGION,DNH & DAMAN 27 MATHERAN KONKAN & GOA 26 AGUMBE SOUTH INTERIOR KARNATAKA DAHEGAM GUJARAT REGION,DNH & DAMAN 27 MAHUDA GUJARAT REGION,DNH & DAMAN RAJGHAT EAST UTTAR PRADESH CHERRAPUNJI ASSAM & MEGHALAYA CHERRAPUNJI ASSAM & MEGHALAYA CHERRAPUNJI ASSAM & MEGHALAYA 39 DATE RAINFALL STATION NAME OF SUBDIVISION (SEPT) (cm 15 UPLETA SAURASHTRA,KUTCH & DIU 27 AKHUPADA ORISSA JENAPUR ORISSA 30 LAKHTAR SAURASHTRA,KUTCH & DIU 30 DHANDHUKA GUJARAT REGION,DNH & DAMAN 50 LAKHATAR SAURASHTRA,KUTCH & DIU MADHUBAN GUJARAT REGION,DNH & DAMAN 37 PATNAGARH ORISSA 27 RANPUR GUJARAT REGION,DNH & DAMAN 27 KANTAMAL ORISSA 26 BISWAN EAST UTTAR PRADESH 37 SARDANAGAR EAST UTTAR PRADESH ROHA KONKAN & GOA 27 KASAULI HIMACHAL PRADESH 26 DHARAMPUR HIMACHAL PRADESH BANBASA UTTARANCHAL 28 68
76 S. No. STATTION Table Rainfall records during the monsoon season RAINFALL DURING PAST 24 Hrs. (mm) DATE (June 08) PREVIOUS RECORD (mm) Date of record Year of record 1 Cooch Behar Jamshedpur AP Chandigarh Nowgong Damoh Tikamgarh (July 08) 1 Varanasi AP Shajanpur Tiruchirapalli AP Cial Cochi (Aug 08) 1 Amritsar IAF Baroda City Mahabaleshwar* Tuni Chennai city Thiruvanthapuram Vijaywada AP Tiruchirapalli AP (Sept 08) 1 Sambalpur Bhuntar AP Visakhapatnam
77 Chapter 4 GLOBAL AND REGIONAL CIRCULATION FEATURES D. S. Pai and O.P. Sreejith This chapter discusses observed global and regional circulation anomalies and associated convective anomalies during the southwest monsoon season Sea Surface Temperature Anomalies Equatorial Pacific The La Niña conditions that were originated since August, 2007 peaked in February 2008 and then started to weaken to reach ENSO-neutral conditions in June. Evolution of SST anomalies in the four NINO regions since November, 2007 is shown in the Fig During February 2008, the SSTs in the NINO3.4 region were much below average ( degrees C anomaly), and for the Dec-Jan-Feb season were degrees C from average, indicating that the La Niña event continued to strengthen in February. The SST anomalies in the NINO 3.4 region continuously increased from mid February and crossed the threshold value of -0.5 Degree C during the month of June. For June 2008, the SSTs in the NINO3.4 region were slightly below average ( C). During the subsequent months, the neutral ENSO conditions prevailed with SST anomaly in the NINO3.4 region becoming positive during July and most part of August. In the Niño 1+2 and NINO 3 regions, SST anomalies were positive since middle of June. 70
, Niño-4 (150ºW-160ºE and 5ºN-5ºS)]. (Source: Climate Prediction centre) Monthly anomalies of sea surface temperature (SST) for the period May to September are shown in Fig.4.2 As seen in Fig.")
78 Fig. 4.1: Time series of area-averaged sea surface temperature (SST) anomalies ( C) in the Niño regions [Niño-1+2 (0-10 S, 90 W-80 W), Niño 3 (5 N-5 S, 150 W-90 W), Niño-3.4 (5 N-5 S, 170 W-120 W), Niño-4 (150ºW-160ºE and 5ºN-5ºS)]. (Source: Climate Prediction centre) Monthly anomalies of sea surface temperature (SST) for the period May to September are shown in Fig.4.2 As seen in Fig.4.2, during May, negative SST anomalies were observed in the central and east-central equatorial Pacific and weak positive SST anomalies were observed in the eastern Pacific indicating weak La Nina conditions. The below average SSTs over central and eastern equatorial Pacific continued to weakening during the monsoon season (June to September). At the same time, the warm SST anomalies over extreme east equatorial Pacific showed slight westward spreading during June to August and they were again restricted over eastern Pacific during September. 71


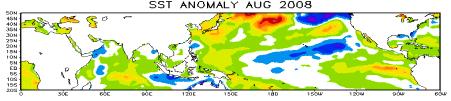
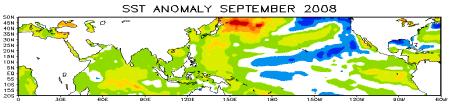
79 Fig. 4.2: Monthly SST anomalies in the Indo-Pacific region for May to September
 for the year 2008.")
80 Indian Ocean While the SSTs over the Pacific reached ENSO neutral conditions in June, evolution of positive IOD started in the Indian Ocean. This was evident in the Fig.4.3 which shows the time series of Dipole Mode Index (DMI) for the year The positive IOD was also clearly evident in the monthly distribution of the SST anomalies over equatorial Indian Ocean (Fig.4.2) with negative anomalies over eastern part and positive over western part of the equatorial Indian Ocean. The DMI represents the intensity of the IOD defined as the anomalous SST gradient between the western equatorial Indian Ocean (50 o E-70 o E and 10 o S-10 o N) and the south eastern equatorial Indian Ocean (90 o E-110 o E and 10 o S-0 o N). The IOD influences the India summer monsoon rainfall through the modulation of monsoon- ENSO relationship (Ashok et al. 2001). There is positive correlation between DMI and rainfall over monsoon trough zone (Ashok et al. 2007). During throughout the monsoon season, the DMI values were positive with highest values during July. However, though rainfall during June was above normal, the July rainfall was deficient (83% of LPA) with above normal rainfall over north India along the foot hills of Himalaya, normal along the east coast and below normal over all other parts of the country. The rainfall during August and September was close to normal. The season as a whole, the rainfall was near normal (98% of LPA) with deficient normal over some parts of central India and southern parts of Peninsula. Fig. 4.3: The time series of Dipole mode Index (DMI) representing Indian Ocean Dipole Condition (Source: JAMTEC) during OLR anomalies Monthly spatial distribution of Outgoing Long wave radiation (OLR) anomalies during June to September months is shown in Fig.4.4. The negative (positive) OLR anomalies indicate above (below) normal convection. In the month of June, negative OLR anomalies were observed over north India north of about 15 o N extending from north Arabian Sea to 73

81 Fig. 4.4: Monthly OLR anomalies during June to September 2008 north Bay of Bengal in the lower latitudes. Just south of this zone of negative OLR anomalies, positive OLR anomalies are seen with maximum magnitudes over equatorial northeast Indian Ocean. The magnitudes of positive OLR anomalies over Bay of Bengal exceeded more than 20 W/m 2. These positive OLR anomaly region along with negative OLR region over equatorial west Indian Ocean formed a dipolar convective pattern generally observed in associated with positive IOD. The negative OLR anomalies over southwest Pacific indicated that the south Pacific convergence zone (SPCZ) was also active. The convective pattern associated with the positive IOD persisted during July, but weakened during the subsequent monsoon months. During July, the negative anomalies over north India weakened but persisted. But the OLR anomalies over northwest India became positive. The positive OLR anomalies over southern part showed shift towards north and were strengthened over Arabian Sea side. As a whole, the July OLR anomaly pattern over Indian 74

82 region showed below normal convection over south and central India and above normal convection over north India and equatorial Indian Ocean. During August and September, the OLR anomalies over most parts of the Indian region were near normal. In August, the anomalies over north and central India were negative and that over southern parts were positive. However, the anomalies over south Bay of Bengal were strong. Throughout the equatorial Indian Ocean east of 60 o E, the OLR anomalies were negative indicating active southern hemisphere equatorial trough (SHET). In September, the OLR anomalies were close to normal values but positive over most parts with negative values over some parts of northwest India and head Bay of Bengal. The OLR anomalies averaged over the season (June to September) is shown in the Fig.4.5. The IOD pattern is clearly seen in the season average also. Over Indian region, the OLR anomalies are slightly negative over northern region north of about 20 o N and positive over region south of it. The positive anomalies over south India extends over south Bay of Bengal where the anomalies exceed 20W/ m 2 indicating below normal convection over the region. Fig. 4.5: Season (June to September) averaged OLR anomaly overlay with season averaged 850hPa wind vector anomalies for
83 4.3 Lower and Upper Tropospheric Circulation Anomalies The wind anomalies at 850 hpa for the month of June to September are shown in Figures 4.6a to 4.6d. During June, the most significant feature is the anomalous cyclonic circulation over southwest Arabian Sea and strong southeasterly anomalies east it. This indicates weaker cross equatorial flow close to Somali coast possibly due to the formation of a depression in that area. An anomalous east west ridge was seen extending from west central Arabian Sea at around 20 o N to north Andaman Sea at around 10 o N through south Peninsula and south central Bay of Bengal. In addition anomalous trough was seen over north India. This caused decreased rainfall activity over south Peninsula and increased rainfall over north India. During July, the anomalous cyclonic circulation over Arabian Sea persisted with further eastward extension and more strength. As a result the monsoon flow along the west coast was very weak. The anomalous southerlies were passing through the east coast and west Bay of Bengal up to north India. This caused deficiency in the large scale rainfall normally expected during this month. The deficiency was particularly more over central India and western part of the country and along west coast. In August also the anomalous cyclonic circulation was present over Arabian Sea but was relatively weak and shifted southwards. The southerly anomalous winds were also limited to lower latitudes. Over most parts of the country wind anomalies were very weak indicating near normal lower tropospheric winds over the region. During September, also the wind anomalies were more or less like August with the anomalous cyclonic circulation covering lesser space over Arabian Sea and allowing anomalous cross equatorial over west coast. The wind anomalies at 850hPa averaged over the season (June-September) are shown in Fig The most significant feature of the seasonal wind anomalies is the anomalous cyclonic circulation over South Arabian Sea with the ridge from the circulation extending eastwards upto south Andaman Sea. This resulted weakening of cross equatorial flow along the western Indian Ocean and reduction in the rainfall activity along the west coast. In fact the weakening of the cross equatorial flow might have reduced upwelling over the west equatorial Indian Ocean and warming of SSTs over the region resulting in the positive IOD pattern in the SSTs over equatorial Indian Ocean. The cross equatorial winds along the eastern Indian Ocean were more than normal. Thus it may be possible that the observed positive IOD was due to the influence of changes in the monsoon circulation rather than changes in the monsoon circulation were influenced by IOD. This aspect of IODmonsoon relationship needs further research. The Figures 4.8a to 4.8d show wind anomalies at 200 hpa. In June, the most significant feature was a strong anomalous anticyclone north of India with strong easterlies 76


84 over north India. This indicates westward shift of Tibetan anticyclone and stronger than normal divergence over north India. In July, a weak anomalous anticyclone was seen over Tibet and weak wind anomalies over most of the Indian region. This indicates near normal upper air circulation. During the subsequent months also the upper air wind anomalies over the Indian region were very weak except that in September the wind anomalies over north India were westerly indicating intrusion of westerlies over northern part. The season averaged weak 200 hpa wind anomalies (Fig.4.9) also indicated near normal upper tropospheric winds during the monsoon season. WIND ANOMALY JUNE 850 hpa WIND ANOMALY JULY 850 hpa 77


")
 August")
85 Fig. 4.6 : Monthly wind vector anomalies at 850 hpa during a) June b) July c) August and d) September 78


86 Fig. 4.7 : Wind vector anomalies at 850 hpa averaged over the monsoon season (June to September)

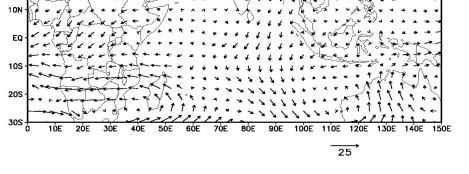

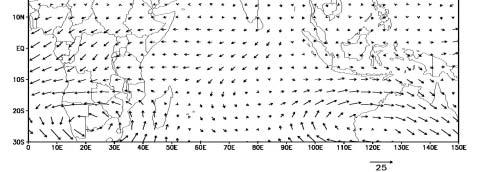
87 80

 June b) July c)")

 2008")
88 Fig. 4.8 : Monthly wind vector anomalies at 200 hpa during a) June b) July c) August and d) September Fig. 4.9 : Wind vector anomalies at 200 hpa averaged over the monsoon season (June to September)
 anomalies averaged over longitudinal zone of 70 o E-90 o E was plotted for the monsoon season (Fig.4.10).")
89 4.4 Meridional Circulation Anomalies over Indian Region To examine the changes in the meridional circulation over Indian region during the monsoon season, latitude height cross section of vertical velocity (omega) anomalies averaged over longitudinal zone of 70 o E-90 o E was plotted for the monsoon season (Fig.4.10). It can be seen that there is anomalous meridional circulation cell over Indian monsoon region with ascending branch over north India north of about 25 o N and descending branch over the latitudes 0-20 o N south of monsoon trough region. This descending region is also part of the another anomalous meridional circulation cell with ascending branch over tropical south Indian Ocean south of 10 o S. Thus, during the season, the climatological ascending motion over the south Peninsula was weaker than normal and was caused by the anomalous ascending motions on north and south of the region. This resulted in below normal rainfall over the southern parts of the country with above normal rainfall over north India. This aspect was particularly strong during the first half of the monsoon. This is shown in the Figures 4.11a and 4.11b which depict the monthly meridional circulation anomaly over Indian monsoon region during June and July. It can seen that over Indian region anomalous ascending motion was present north of about 15 o N and during July it was present only north of 28 o N with anomalous descending motion south of it. Thus during July larger part of the country came under anomalous descending motion. Fig. 4.10: Latitude-Height vertical cross-section of pressure vertical velocity anomaly overlay with meridional wind vector anomalies for the monsoon season (June-September) Pressure vertical velocity (Omega) anomalies are shaded. The anomalies are averaged over longitudes 70 o E to 90 o E 82
 anomalies are shaded. The anomalies are averaged over longitudes 70 o E to 90 o E 4.")
, large amount of rainfall is received over the monsoon trough zone (the zone between which the monsoon trough fluctuates north and south")
90 (a) (b) Fig. 4.11: Latitude-Height vertical cross-section of pressure vertical velocity anomaly overlay with meridional wind vector anomalies for the monsoon months of (a) June and (b) July, Pressure vertical velocity (Omega) anomalies are shaded. The anomalies are averaged over longitudes 70 o E to 90 o E 4.5 Intra-seasonal Variability (ISV) Break Events The rainfall over India during the monsoon season (June to September) shows large intraseasonal fluctuations. During the two peak monsoon rainfall months (July and August), large amount of rainfall is received over the monsoon trough zone (the zone between which the monsoon trough fluctuates north and south wards from its normal position). Other regions which receive copious rainfall are west coast of the peninsula and hilly regions of northeast. However, the large scale rainfall over the monsoon trough zone region gets interrupted by spells of subdued rainfall. These spells of subdued rainfall is known as breaks and the intervals between spells of subdued rainfall when the rainfall is higher than normal are known as active spells. Rajeevan et al. (2006, 2008) have shown that the break and active spells can be defined based on the rainfall over a critical area over central India which they called as monsoon zone (Fig. 4.12). In associated with these phases of contrasting rainfall conditions over monsoon zone, the pressure and circulation patterns over Indian region also show contrasting features. A discussion on the break events during 2008 has been given in the later part of this section. 83
. The active and break cycles in the rainfall manifestation of ISOs in the monsoon.")
91 Fig. 4.12: Core monsoon region defined in Rajeevan et al There are certain preferred periodicities (between 10 and 90 days) associated with monsoon intra-seasonal variability. These fluctuations with preferred periodicities are known as Intraseasonal Oscillations (ISOs). The active and break cycles in the rainfall manifestation of ISOs in the monsoon. In addition to these oscillation there is another 3-7 days oscillations associated with oscillations in the monsoon trough. Over Indian monsoon region, within broad range of day periods, there are two main (prominent) periodicities between 10 to 20 days and 30 to 60 days. The days periodicity is linked with the globally eastward-moving wave numbers 1 and 2 in the tropics, in particular in the equatorial regions. In the Indian monsoon region, days periodicity has been observed in the north ward propagating convective patterns. The intra-seasonal variation of rainfall during 2008 is depicted in the Fig.4.13, which shows the time series of daily rainfall anomaly averaged over the monsoon zone along with its band pass filtered series of days and day periodicities. It can be seen that, during the month of June, both days and days oscillations are in positive phase and hence the rainfall anomaly was in positive side. From last week of June onwards the amplitude of days oscillation was in negative side and the monsoon was in the weak phase. The revival happened during later part of July and continued up to second half of August. The rainfall activity increased after 7th September and both the oscillations were in positive phase during that period. 84
92 Rainfall Anomaly Rf anomaly day day Rain (mm) Jun 8-Jun 15-Jun 22-Jun 29-Jun 6-Jul 13-Jul 20-Jul 27-Jul 3-Aug 10-Aug 17-Aug 24-Aug 31-Aug 7-Sep 14-Sep 21-Sep 28-Sep -20 days Fig. 4.13: Time series of rainfall anomaly over the core monsoon region. The blue line shows the day filtered series and red line shows day filtered series Band-pass filters can give information about the prominent periodicities, but can not provide the variation of periodicities within the period. Wavelet analysis has advantage that it can give information on how the periodicities may have varied with time. The Wavelet transform (WT) or wavelet analysis is a powerful mathematical analysis method well suited for the study of multi-scale non-stationary processes occurring over finite spatial and temporal domains. By decomposing a time series into time frequency space, one is able to determine both the dominant modes of variability and how those modes vary in time. The wavelet analysis of rainfall over the core monsoon region is shown in Fig The power spectrum reveals that days periodicity was prominent during the third week of July with maximum variance centered on day 47 (ie. July 17). The day periodicity was prominent during the first week of August and again during the last week of August centered on day 85 (ie. August 24). Then there is clear indication of decrease in the periodicity to day band during the third week of September centered on day 107 (ie. September 15). The period of oscillation increases to around days during last week of September. In summary, the low frequency ISOs were prominent during most part of the monsoon season with high frequency ISOs becoming prominent during September. 85

93 Fig. 4.14: The wavelet power spectrum. The contour levels are chosen so that 75%, 50%, 25%, and 5% of the wavelet power is above each level respectively. The cross-hatched region is the cone of influence, where zero padding has reduced the variance. Black contour is the 10% significance level, using the global wavelet as the background spectrum Rajeevan et al. (2008) have defined active and break spells as periods in which the normalized anomaly of the rainfall over the this region exceeds 1.0 or less than -1.0 respectively, provided the criterion is satisfied for at least three consecutive days. As per this definition, periods July and August were been identified as the break events and periods July and August were identified as active events. It can be seen from the wavelet spectrum that the break events occurred during the period around when the high period ISOs were most prominent. Large scale anomalies associated with the break monsoon event of July have been discussed below. Fig.4.15 and Fig.4.16 show the surface mean sea level pressure (mslp) anomalies and 850 hpa wind vectors during the break event of July. During this event the surface mslp anomalies were negative over north India along the Himalaya and southern most parts. On the other hand the mslp anomalies were positive over monsoon trough zone region. The 850hpa vector winds show an anti-cyclonic circulation over monsoon trough zone with westerlies over north India. Thus the surface and low level circulation features indicate typical classical break type situation defined by Ramamurthy (1969). Fig.4.17 shows the OLR anomalies during the break event of July. Over most parts of the country except along the foot hills of Himalayas were highly positive. Along the Himalayas and in the Equatorial north Indian Ocean the OLR anomalies were negative. Thus the enhanced convection over equatorial north Indian Ocean and that along the foot hills of Himalayas, caused significant subsidence motion over the central India and north west India (Fig.4.18). This caused increased rainfall along the foot hills of Himalayas and rain shadow areas of 86
94 southeast Peninsula deficient rainfall over all other parts of India, particularly Indian region south of about 25 o N (Fig.4.19). Fig. 4.15: Mean sea level pressure( in mb) anomalies during the break event of 14-19July 2008 Fig. 4.16: Wind vectors at 850 hpa during the break event of 14-19July


95 Fig. 4.17: OLR anomalies during the break event of 14-19July 2008 Fig. 4.18: Latitude-Height vertical cross-section of pressure vertical velocity anomaly overlay with meridional wind vector anomalies for the break event of 14-19July Pressure vertical velocity (Omega) anomalies are shaded. The anomalies are averaged over longitudes 70 o E to 90 o E 88
96 Fig. 4.19: Rainfall Anomaly (in cm) for the break event 14-19July, 2008 References Ashok K, Guan Z and Yamagata T (2001). Impact of the Indian Ocean Dipole on the relationship between the Indian Monsoon rainfall and ENSO. Geophys Res Lett 28: Ashok K, and N. H. Saji (2007). On the impacts of ENSO and Indian Ocean dipoleevents on sub-regional Indian summer monsoon rainfall. Nat. Hazards. 42: Rajeevan M., J. Bhate, J. D., Kale and B. Lal, (2006). High resolution daily gridded rainfall data for Indian region: Analysis of break and active monsoon spells, Current Science, 91,3, Rajeevan M., S. Gadgil and J. Bhate, (2008), Active and Break spells of Indian Summer monsoon, NCC research report, 7 Ramamurthy, K., (1969), Monsoon of India: Some aspects of the break in the Indian southwest monsoon during July and August. Forecasting Manual 1-57 No. IV 18.3, India Met. Dept., Poona, India. Gadgil, S. (2003), The Indian monsoon and its variability, Ann. Rev. Earth Planet. Sci., 31: Madden, R.A. and Julian P.R. (1971), Detection of day oscillation in the zonal wind in the zonal wind in the Tropical Pacific, J. Atmos. Sci., 28 : Sikka, D.R., Gadgil, S (1980), On the maximum cloud zone and ITCZ over the Indian longitudes during the southwest monsoon, Mon. Wea. Rev., 108 : Yasunari, T. (1979), Cloudiness fluctuations associated with the Northern Hemisphere summer monsoon, J. Meteor. Sco., Japan, 57:
97 Chapter 5 PERFORMANCE OF OPERATIONAL NWP SHORT RANGE FORECASTS Y.V. Rama Rao, D. R. Pattanaik and A. K. Das This chapter discusses the performance of the short range forecasts issued using IMD s operational NWP models during the 2008 monsoon season. 5.1 Introduction India Meteorological Department operationally runs two regional models: limited area analysis and forecast system (LAFS) and MM5 model. The LAFS consists of generating grid point data analysis (at 1x1 deg. Horizontal / 14 pressure levels vertical resolution) and forecasts upto 24 hours (at 0.75x0.75 deg. horizontal resolution) for the Indian monsoon RSMC (regional specialised meteorological centre) region. The products are provided daily twice based on 05:30 and 17:30 hrs IST initial conditions for operational use in real-time. The MM5 (Mesoscale Model version-5) runs is having a horizontal resolution of 45 kms/l27. The forecasts upto 3 days of wind and temperature fields along with rainfall and minimum/maximum temperature for few cities are provided for the operational forecasters. IMD also operates a specialized Tropical Cyclone model, known as Quasi-Lagrangian Model (QLM) for track and intensity prediction of tropical cyclones upto 72 hours during the cyclone situations. The model is having a horizontal resolution of 40 km. The integration domain 90
98 consists of 4440x4440 km 2 domain that is centred on the initial position of the cyclone. The initial conditions and boundary conditions at 1x1 deg. resolution are obtained from NCEP, Global Forecast System (GFS), USA through internet in real-time for running the above models. In additions to the above products, global model products available in near real-time from NCMRWF T-254/L64, UKMO (approximate horizontal grid spacing of 40 km with 50 vertical levels) and ECMWF (T799/L99) model are also utilised. In the following sections, performance of all these model products has been discussed. 5.2 Prediction of Monsoon Depression The performance of various operational models such as MM5, NCMRWF T-254/L64, UKMO and ECMWF models was examined in respect of genesis and track prediction of monsoon depressions and associated heavy rainfall during the monsoon season. The centre of the depression is determined on the basis of mean sea level pressure (mslp) in the case of MM5 and ECMWF models and 850 hpa wind fields in the case of NCMRWF and UKMO where only the graphic products are available at 1x1 deg. resolution. Case-1: Depression over Bay of Bengal, June 2008 A low pressure area formed over North Bay of Bengal at 03 UTC of 15 June, concentrated into a depression at 03 UTC of 16 June 2008 over north Bay of Bengal near about 220 km southwest of Kolkata. It continued to move in a northwesterly direction and lay centred at 03 UTC of 17 over Gangetic west Bengal and adjoining Bangladesh near Krishna Nagar in west Bengal. It then moved slightly west-northwestwards and lay centred at 03 UTC of 18 over Jharkhand. The observed and forecast track by ECMWF, NCMRWF, UKMO and MM5 based on 00 UTC of 16 June along with day-2 forecast of ECMWF, MM5 mean sea level pressure, NCMRWF 850 hpa wind plot valid for 00 UTC of 17 June are given in Fig.5.1. In this case all the four models are able to predict the movement of the system northwestwards. However the MM5 initial position was 2-3 degrees south of the observed position and its track was shown more northerly than the observed northwest. The MM5 day- 2 forecast based on 00 UTC of 15 June valid for 17 June shown the minimum sea level pressure was 994 hpa where as observed was 990 hpa. The ECMWF was able to show the track close to the observed with initial error of 50 km southeast of the observed. The minimum sea level pressure has shown 994 hpa with two closed isobars. The NCMRWF T- 254 and UKMO are also shown the northwest movement of the system. In association of this system, widespread rainfall with scattered heavy to very heavy falls occured over Gangetic west Bengal, north Orissa and Jharkhand during June. The model predicted day-2 91
, NCMRWF")

99 Fig.5.1: Depression June 2008 observed and forecast track by ECMWF, NCMRWF T-254, UKMO and MM5 based on 16 June valid for 18 June and day-2 forecast ECMWF, MM5 mean sea level pressure (hpa), NCMRWF 850 hpa wind plots rainfall based on 15, 16 June valid for 17, 18 June are given in Figures 5.2 & 5.3. On both 17 and 18 June all the models are able to predict the heavy rainfall over Gangetic west Bengal, north Orissa, Jharkhand and east Utter Pradesh. However MM5 was not able to predict the heavy rainfall over north Orissa due to the predicted movement of the system was far off eastwards of the observed. Due to this, the heavy rainfall belt also shifted to the east of the observed. It is also noteworthy that all the models have shown scanty rainfall over peninsular India and west coast as observed. Case-2: Land Depression over Orissa, August 2008 A low pressure area formed over northwest and adjoining west central Bay of Bengal off Orissa-West Bengal coast on 8 morning. It became well marked over the same region on 9 morning. It concentrated into a depression on the same evening and lay centred at 12 UTC of 9 August over Orissa coast close to Puri. The depression moved northwestwards and lay centred over north Orissa close to Keonjhargarh at 03 UTC of 10. Moving in a northwesterly direction, it weakend into a well marked low pressure area over north Orissa and neighbourhood by evening of the same day. The observed and forecast track by 92


100 ECMWF, NCMRWF, UKMO and MM5 based on 08 August along with day-2 forecast ECMWF, MM5 mean sea level pressure, UKMO, NCMRWF 850 hpa wind plots valid for 00 UTC of 9 August are given in Fig.5.4. In this case all the four models are able to predict the movement of the system north-northwestwards. However the initial position of all the models on 8 August was 2-3 degrees east of the observed. The MM5 track was shown more northerly than the observed north-northwest. However the other three models have shown the north-northwest movement of the system. This large displacement of track to the northeast may be due to weak initial conditions on 8 August where the system was not well defined. It is noteworthy that all the models were able to predict the genesis and formation of the system 2-3 days in advance. In association of this system, widespread rainfall with scattered heavy to very heavy falls occurred over Orissa, Andhra Pradesh, east Madhya Pradesh, west coast during 9-10 August. The models predicted day-2 rainfall based on 00 UTC of 8 valid for 10 August is given in Fig.5.5. In this case all the models were able to predict the enhanced rainfall activity over west coast and Orissa. However, MM5 and UKMO models are able to predict the heavy rainfall over Andhra Pradesh in day-1 (figures not shown) and in day-2, day-3 (figures not shown) the rainfall belt was shifted to northeast wards than observed. This may be due to the predicted system was northeast of the observed system. Fig.5.2: Day-2 rainfall forecast by ECMWF, MM5, NCMRWF and observed grid point rainfall (mm) valid for 17 June


101 Fig.5.3: Day-2 rainfall forecast by ECMWF, MM5, UKMO, NCMRWF and observed grid point rainfall (mm) valid for 18 June


, UKMO, NCMRWF T-254")
102 Fig.5.4: Depression August 2008 observed and forecast track by ECMWF, NCMRWF T- 254, UKMO and MM5 based on 08 August along with day-2 forecast ECMWF, MM5 mean sea level pressure (hpa), UKMO, NCMRWF T hpa wind plots valid for 9 August


103 Fig.5.5: Day-2 rainfall forecast by ECMWF, MM5, UKMO, NCMRWF and observed grid point rainfall (mm) valid for 10 August 96
104 Case-3: Deep Depression over Bay of Bengal September 2008 This system formed over the northwest Bay of Bengal and crossed Orissa coast near Chandbali and moved across north Orissa, north Chhattisgarh, northeast Madhya Pradesh and central Uttar Pradesh. The observed and forecast track by ECMWF, NCMRWF, UKMO and MM5 based on 00 UTC of 15, 16 September along with day-3 forecast of ECMWF, MM5 mean sea level pressure, UKMO, NCMRWF 850 hpa wind plots valid for 00 UTC of 17 September are given in Fig.5.6. In this case all the four models are able to predict the movement of the system northwestwards. However, based on 15 September, the initial position and the forecast track was more northeast to the observed. Based on 16 September, the initial position errors are less compared to 15 September except in ECMWF which shown 2-3 degrees to the northeast of observed. The day-3 forecast mslp/wind fields by the models based on 14 September were able to predict the genesis and formation of the system over Orissa three days in advance. This system caused heavy to extremely heavy rainfall over Orissa and Chhattisgarh leading to severe flood over Orissa. This system also interacted with mid-latitude westerly systems and caused good rainfall over northwest India and led to flood over Haryana and Himachal Pradesh. The models predicted day-3 rainfall based on 14 valid for 17 September is given in Fig.5.7. In this case all the models were able to predict the enhanced rainfall activity over Gujarat, west coast and Orissa. However, MM5 models is able to predict the heavy rainfall over Orissa and Chhattisgarh in day-1 (figures not shown), day-2 (figures not shown) and in day-3 the rainfall belt was shifted to northeast wards. This is due to the predicted system was northeast of the observed system. 5.3 Rainfall prediction by MM5 The MM5 forecast day-1, 2 and 3 cumulative rainfall (cm) for the entire monsoon (1 June-30 September) was given in Fig.5.8. The observed rainfall distribution shows the heavy rainfall areas over west coast, north-east, West Bengal, Bihar, Orissa, Uttar Pradesh. The MM5 model was able to predict the west coast, it failed to capture the rainfall belts along the foot hills of the Himalayas. The rainfall over northeast India and eastern parts (Orissa, Chhattisgarh) was captured reasonably in day-1, however, the day-2 and day-3 there is a large underestimation over most parts of east and central India. 97


, UKMO, NCMRWF T-254 850")
105 Fig.5.6: Deep Depression September 2008: observed and forecast track by ECMWF, NCMRWF T-254, UKMO and MM5 based on 15, 16 September along with day-3 forecast ECMWF, MM5 mean sea level pressure (hpa), UKMO, NCMRWF T hpa wind plots valid for 17 September


")
106 Fig.5.7: Day-3 rainfall forecast by ECMWF, MM5, NCMRWF and observed grid point rainfall (mm) valid for 17 September


107 Fig.5.8: Spatial distribution of seasonal (1 June-30 September 2008) cumulative rainfall (cm) observed and corresponding day-1, day-2 and day-3 MM5 forecast 100
108 5.4 Track forecast errors Forecast verification has been carried out by computing the direct position error (DPE) the geographical distance between the predicted location of the storm and the verifying position at valid hour. The results are presented in Table-5.1 for the period ranges from initial analysis to 48h for each individual day of all the three cases considered. It is seen that the mean error of initial analysis is about 110 km, 24 hours forecast is about 165 km, which increases to about 245 km for 48h forecast. The MM5 has shown large errors when the initial state of the system is a weak low pressure and when the system was well defined the track errors reduced considerably. In the case of global models ECMWF, UKMO the initial errors are relatively less. However, the initial errors of km are observed even when the system was in depression stage. 5.5 Concluding remarks The models (ECMWF, NCMRWF T-254, UKMO and MM5) considered here for three monsoon depressions cases have shown, that the models are able to predict the formation of Monsoon Depressions 2 to 3 days in advance; however the location errors are of 1-2 degrees away from the observed position. The initial position errors are large in MM5, UKMO and T-254 models compared to ECMWF. The MM5 has shown more eastwards bias when the initial state of the system was weak low pressure, however, when the system is of depression stage, the predicted track and intensity has shown better skill. The intercomparison of rainfall prediction by all the four models in terms of location and amount, ECMWF model shown better skills in heavy rainfall prediction 2 to 3 days in advance compared to other models. MM5 model has shown better skill in rainfall prediction over west coast compared to central India. The spatial pattern of MM5 day-1 rainfall forecast is found to be slightly better compared to day-2 and day-3 forecast. Table 5.1: Direct Position Errors (KM) Based on 16 June 2008/00 UTC (DPE in kms) Model Anal 24hFcst 48hFcst ECMWF MM UKMO T
109 8 August 2008/00 UTC ECMWF MM UKMO T August 2008/00 UTC ECMWF MM UKMO T September 2008/00 UTC ECMWF MM UKMO T September 2008/00 UTC ECMWF MM UKMO T Figure captions: Fig.5.1: Depression June 2008 observed and forecast track by ECMWF, NCMRWF T- 254, UKMO and MM5 based on 16 June valid for 18 June and day-2 forecast ECMWF, MM5 mean sea level pressure (hpa), NCMRWF 850 hpa wind plots. Fig.5.2: Day-2 rainfall forecast by ECMWF, MM5, NCMRWF and observed grid point rainfall (mm) valid for 17 June Fig.5.3: Day-2 rainfall forecast by ECMWF, MM5, UKMO, NCMRWF and observed grid point rainfall (mm) valid for 18 June Fig.5.4: Depression August 2008 observed and forecast track by ECMWF, NCMRWF T-254, UKMO and MM5 based on 08 August along with day-2 forecast ECMWF, MM5 mean sea level pressure (hpa), UKMO, NCMRWF T hpa wind plots valid for 9 August
110 Fig.5.6: Deep Depression September 2008: observed and forecast track by ECMWF, NCMRWF T-254, UKMO and MM5 based on 15, 16 September along with day-3 forecast ECMWF, MM5 mean sea level pressure (hpa), UKMO, NCMRWF T hpa wind plots valid for 17 September Fig.5.7: Day-3 rainfall forecast by ECMWF, MM5, NCMRWF and observed grid point rainfall (mm) valid for 17 September Fig.5.8: Spatial distribution of seasonal (1 June-30 September 2008) cumulative rainfall (cm) observed and corresponding day-1, day-2 and day-3 MM5 forecast. 103
111 Chapter 6 PERFORMANCE OF MEDIUM RANGE FORECASTS BY NWP MODELS S.K. Roy Bhowmik and V.R. Durai This chapter discusses the performance of the district level medium range forecasts issued using IMD s operational NWP models during the southwest monsoon season. 1. Introduction In view of the growing operational requirements from various user agencies, there is a need for a seamless forecasting system covering now-casting to medium range. During the last two decades, Numerical Weather Prediction (NWP) have acquired greater skill and are playing increasingly important role in the operational weather forecast. Currently, IMD runs a number of regional NWP models in the operational mode, which provide numerical guidance for the forecasts up to 3 days (short range). IMD is yet to start a global NWP model in operational mode to support forecasts in the medium range time scale (5 days to 7 days). IMD makes use of NWP global model forecast products of other operational centres, like NCMRWF T-254, ECMWF, JMA, NCEP and UKMO to meet the operational requirements of day to day weather forecasts in the short to medium range time scale. Under a joint collaborative research project IMD has been receiving global model outputs of ECMWF and JMA. The outputs of NCEP GFS are available freely from the Internet. IMD has 104
112 been receiving NCMRWF T-254 and UKMO model outputs online from NCMRWF, Noida. Very recently, IMD (Roy Bhowmik and Durai, 2008) has implemented a Multi-Model Ensemble (MME) based district level five days quantitative forecasts, as required for the Integrated Agro-advisory Service of India. The member models used in the MME are ECMWF, NCEP GFS JMA. The outputs of NCEP are available at 1 o resolution, JMA at 1.2 o and ECMWF at 0.25 o. The MME is implemented at 25 km resolution and for a district value, average value of all grid points falling in a particular district is considered. In this article, performance skill of rainfall forecasts by MME, ECMWF, JMA and NCEP in the medium range time scale will be presented and discussed. In section 2, methodology and data sources are described. Section 3 deals with a description of spatial distribution of observed and forecast fields. Spatial characteristics of forecast errors are discussed in section 4, results of categorical statistics and time series are presented in section 5 and results of a case study of a monsoon depression are illustrated in section 6. Results of district level forecasts are demonstrated in section 7 and finally concluding remarks are given in section Methodology and data sources The standard procedure (Jolliffe and Stehenson, 2003) for the model verification is to compute spatial pattern of mean errors, root mean square errors (RMSE) and anomaly correlation coefficient. Spatial distribution of errors determines the extent to which model forecast characterizes the monsoon system. Computation and comparison of commonly used categorical statistics, such as threat score is also included in this study. The error statistics computed are based on the daily analysis (gridded observed field) and the corresponding forecast fields (day-1, day-2, day-5) for the data period from 1 June to 30 September Daily rainfall analysis (Roy Bhowmik and Das, 2007) generated from the use of Indian raingauge observations and satellite estimates (INSAT - Kalpana-1) is used as the observed rainfall field. 3. Observed versus forecast rainfall fields We begin with a description of observed fields of rainfall for the season (1 June to 30 September 2008). Fig.6.1 illustrates the spatial distribution of cumulative rainfall of the season based on the observations. The observed rainfall distribution shows a north south oriented belt of heavy rainfall along the west coast with a peak of ~ 250 cm. The sharp gradient of rainfall between the west coast heavy rainfall and the rain shadow region to the east, which is normally expected, is noticed in the observed field. Another heavy rainfall belt 105

113 is observed over the eastern parts of the country with a peak of order cm to the extreme northeast. The rainfall belt extended from the north west Bay of Bengal to northwest India along the domain of monsoon trough. Fig..6.1: Spatial distribution of observed cumulative rainfall for the period from 1 June to 30 September 2008 The forecast fields (day-1, day-2, day-5) of cumulative rainfall for the season based on the MME and member models (ECMWF, JMA and NCEP) are shown in Fig.6.2 to 6.5. The forecast fields by these models, in general, could reproduce the heavy rainfall belts along the west coast and over the domain of monsoon trough and foot hills of the Himalaya. However, some spatial variations in magnitude are noticed. The inter-comparison reveals that the MME forecasts are closer to the corresponding observed field. The pattern remained broadly similar for the forecasts day 1 to day
114 Fig. 6.2 : Spatial distribution of cumulative rainfall (cm) based on MME day 1 - day 5 forecasts for the period from 1 June to 30 September 2008 Fig. 6.3 : Spatial distribution of cumulative rainfall (cm) based on ECMWF day 1 to day 5 forecasts for the period from 1 June to 30 September
 based on NCEP GFS day 1 to day 5 forecasts for the period from 1 June to 30 September 2008 Fig")
115 Fig..6.4 : Spatial distribution of cumulative rainfall (cm) based on NCEP GFS day 1 to day 5 forecasts for the period from 1 June to 30 September 2008 Fig 6.5: Spatial distribution of cumulative rainfall (cm) based on JMA day 1 to day 5 forecasts for the period from 1 June to 30 September

116 4. Spatial characteristics of forecast errors In Fig.6.6 to 6.9, the spatial distribution of mean errors of rainfall for day 1 to day 5 forecasts by these models are demonstrated. Results of MME show mean errors of order -5 mm along the west coast. Otherwise, over most parts of the country mean errors has been nearly zero mm. For the ECMWF mean errors of the order of -5 to -10 mm occurred over the west coast of India. GFS shows mean errors of the order of -10 to -15 over the north Bay of Bengal. JMA shows mean errors of magnitude -5 mm along west coast and 5 mm over the north Bay of Bengal. In Fig.6.10 to 6.13, the spatial distribution of RMSE of rainfall for day 1 to day 5 forecasts by these models are presented. For the MME, RSME of the order of mm prevailed over the domain of monsoon trough, particularly along the foot hills of the Himalayas, over the north Bay of Bengal and along the west coast where occasional heavy rainfall occurs. Spatial coverage of errors are found to be considerably reduced in the MME forecasts. RMSE generally remains within 10 mm over the rest of the country. For ECMWF and GFS, RMSE has been of the order of cm over large areas. In Fig.6.14 to 6.17, the spatial distribution of anomaly Correlation Coefficients (CC) of these forecasts for day 1 to day 5 by these models are presented. For computation of anomaly CC, observed climatology (on the basis of gridded observed rainfall fields of 15 years) is used. The results show that the anomaly CCs are comparatively higher in the MME forecasts, where anomaly CC of order 0.3 to 0.7 occupy over large areas. Anomaly CC shows sharp decreasing trend from day 4 forecast onwards. Anomaly CC has been very poor by GFS model. Fig 6.6 : Spatial distribution of mean errors (forecast-observed) of rainfall (mm) based on MME day1 to day5 forecasts for the period from 1 June to 30 September

 of")


 based on NCEP GFS day 1")

117 Fig 6.7: Spatial distribution of mean errors (forecast-observed) of rainfall (mm) based on ECMWF day1 to day5 forecasts for the period from 1 June to 30 September 2008 Fig 6.8: Spatial distribution of mean errors (forecast-observed) of rainfall (mm) based on NCEP GFS day 1 to day 5 forecasts for the period from 1 June to 30 September
 of rainfall (mm) based on")
 based on MME")
118 Fig.6.9. Spatial distribution of mean errors (forecast-observed) of rainfall (mm) based on JMA day1 to day5 forecasts for the period from 1 June to 30 September 2008 Fig 6.10: Spatial distribution of root mean square errors of rainfall (mm) based on MME day1 to day5 forecasts for the period from 1 June to 30 September


 based on NCEP GFS day1 to day5 forecasts")
119 Fig 6.11: Spatial distribution of root mean square errors of rainfall (mm) based on ECMWF day1 to day5 forecasts for the period from 1 June to 30 September 2008 Fig 6.12: Spatial distribution of root mean square errors of rainfall (mm) based on NCEP GFS day1 to day5 forecasts for the period from 1 June to 30 September
 based")

120 Fig 6.13 : Spatial distribution of root mean square errors of rainfall (mm) based on JMA day1 to day5 forecasts for the period from 1 June to 30 September 2008 Fig 6.14: Spatial distribution of anomaly CC of rainfall based on MME day1 to day5 forecasts for the period from 1 June to 30 September
121 Fig 6.15: Spatial distribution of anomaly CC of rainfall based on ECMWF day1 to day5 forecasts for the period from 1 June to 30 September 2008 Fig 6.16: Spatial distribution of anomaly CC of rainfall based on NCEP GFS day1 to day5 forecasts for the period from 1 June to 30 September
. Fig. 6.")
122 Fig 6.17: Spatial distribution of anomaly CC of rainfall based on JMA day1 to day5 forecasts for the period from 1 June to 30 September Categorical statistics and time series Fig presents an inter-comparison of country mean spatial CC of rainfall forecasts by MME and member models. The results show that MME is superior to each member model at all the forecasts (day 1 to day 5). Fig shows an inter-comparison of threat score of rainfall forecasts by MME and member models at different rain thresholds. At all the rain thresholds, MME is better than each individual model. Fig (a-e) illustrate an inter-comparison of time series of country mean (mm) observed versus corresponding day 1 to day 5 forecasts of rainfall (mm) by ECMWF, NCEP (GFS), JMA and MME. An inter-comparison of domain mean CC by these models is shown in Table 6.1. The MME forecasts show higher CC at all the forecast ranges.. Table 6.1 : An inter-comparison of domain mean CC of rainfall MODELS DAY1 DAY2 DAY3 DAY4 DAY5 ECMWF NCEP GFS JMA MME
123 CC SPATIAL CC (ALL INDIA) MME ECMF GFS JMA DAY1 DAY2 DAY3 DAY4 DAY5 Fig 6.18: Inter-comparison of country mean spatial CC of day1-day5 rainfall forecasts by MME and member models for the period from 1 June to 30 September 2008 DAY1 DAY2 0.7 MME ECMF 0.7 MME ECMF Threat Score GFS JMA Threat Score GFS JMA > Threshold Range ( mm) 0.1 > Threshold Range (mm) Threat Score DAY3 MME ECMF GFS JMA Threat Score DAY4 MME ECMF GFS JMA > Threshold Range (mm) 0.1 > Threshold Range (mm) Threat Score DAY5 MME ECMF GFS JMA 0.1 > Threshold Range (mm) Fig 6.19: Inter-comparison of threat score of day1-day5 rainfall forecasts by MME and member models at different thresholds for the period from 1 June to 30 September
124 Rainfall (mm) DAY1 FCST OBS ECM F GFS JM A MME June-30September DAY2 FCST OBS ECMF GFS JMA MME Rainfall (mm) June-30September DAY3 FCST OB S ECM F GFS JM A MME Rainfall (mm) June-30Septem ber DAY4 FCST OBS ECMF GFS JMA MME Rainfall (mm) June-30Septem ber 2008 Rainfall (mm) DAY5 FCST OBS ECM F GFS JM A MME June-30September 2008 Fig 6.20: Time series of daily country mean observed versus corresponding rainfall (mm) forecasts by MME and member models for the period from 1 June to 30 September
125 6. Case Study of a monsoon depression A low-pressure area formed over the North Bay of Bengal at 0300 UTC of 15 June The system concentrated into a depression and lay centred at 0300 UTC of 16 June near lat 21.5 o N long 90 o E. The system continued to move in a northwesterly direction till 17 June morning and then moved slightly west-northwest wards. It further moved in a northwesterly direction till 18 morning before it weakened into a low pressure area. All the member models could predict the formation of this low pressure system 5-7 days in advance. However, some deficiencies are noticed in the short to medium range forecast scale to capture observed track position for this system. An inter-comparison of rainfall forecasts (day1, day-2, day-5) by these models against observed rainfall of 17 June 2008 is shown in Fig.6.21 to The observed field shows a belt of heavy rainfall along the domain of monsoon trough with a peak of order 10 cm in association with this depression. All the forecasts could capture the heavy rainfall belts along the monsoon trough, but failed to capture the correct location of the heaviest rainfall belt in association with the depression. Model forecasts could capture the distribution of light rainfall activities over the remaining parts of the country. The inter-comparison reveals that the ECMWF forecasts could capture distribution of heavy rainfall in a more realistic way. GFS as well as JMA show some mismatch in capturing the distribution of heavy rainfall. In the MME forecasts, though magnitude of heavy rainfall amounts are under-estimated, but distribution is captured in a better way. An inter-comparison of distribution of rainfall along the coastal districts of Orissa, based on the MME forecasts against the observation, for the period from in presence of this system, is illustrated in Fig.6.25 to The results show that though model (MME) under-estimated rainfall amounts, it could capture heavy rainfall events for some districts as well. 118


126 Fig.6.21: Observed rainfall and corresponding ECMWF day1 day5 rainfall forecast for 17 th June 2008 Fig 6.22 : NCEP GFS day1 day5 rainfall forecasts valid for 17 th June


127 Fig 6.23: JMA day1 day5 Rainfall forecasts valid for 17 th June 2008 Fig 6.24: MME day1 day5 rainfall forecasts valid for 17 th June
128 Heavy Rainfall on 16 June OBS DAY1 DAY2 DAY3 DAY4 DAY5 0 Districts Fig 6.25: MME day1 day5 rainfall forecasts valid for 16 June 2008 for coastal districts of Orissa in association with a monsoon depression Heavy Rainfall on 17 June 2008 Rainfall in mm OBS DA Y1 DA Y2 DA Y3 DA Y4 DA Y5 0 Districts Fig 6.26: MME day1 day5 rainfall forecasts valid for 17 June 2008 for coastal districts of Orissa in association with a monsoon depression Heavy Rainfall on 18th June 2008 Rainfall in mm OBS DAY1 DAY2 DAY3 DAY4 DAY5 0 MAYURBHANJ KEONJHAR SUNDERGARH JHARSUGUDA SAMBALPUR DEOGARH ANGUL DHENKANAL JAJPUR BALASORE Districts Fig.6 27: MME day1 day5 rainfall forecasts valid for 18 June 2008 for coastal districts of Orissa in association with a monsoon depression 121
129 7. District Level Forecasts State-wise performance of district level rainfall forecasts for day 1 to day 5 is summarised in Table 6.2 to 6.6. Performance index is defined as the % of total districts with threat score more than 0.5 for rainfall thresholds of 2.5 mm, 5 mm, 10 mm and 15 mm. Threat score is defined as number of correct forecasts divided by total forecasts. The threat score ranges between 0 and 1, with 1 as the perfect score.. The district level forecast skill is found to be reasonably good over most parts of the country. Table - 6.2: State-wise District Level Performance Skill of Rainfall Day 1 Forecast (% of districts with threat score 0.5 and above for various rain thresholds) STATE TOTAL DIST 2.5 mm 5.0 mm 10 mm 15 mm ANDAMAN & NICOBAR ARUNACHAL PRADESH ASSAM MAGHALAYA NAGALAND MANIPUR MIZORAM TRIPURA SIKKIM WEST BENGAL ORISSA JHARKHAND BIHAR UTTAR PRADESH UTTARANCHAL HARYANA CHANDIGARH DELHI PUNJAB HIMACHAL PRADESH JAMMU & KASHMIR RAJASTHAN MADHYA PRADESH GUJARAT GOA MAHARASHTRA CHHATTISGARH ANDHRA PRADESH TAMILNADU KARNATAKA KERALA LAKSHADWEEP
130 Table - 6.3: State-wise District Level Performance Skill of Rainfall Day 2 Forecast (% of districts with threat score 0.5 and above for various rain thresholds) STATE TOTAL DIST 2.5 mm 5 mm 10 mm 15 mm ANDAMAN & NICOBAR ARUNACHAL PRADESH ASSAM MAGHALAYA NAGALAND MANIPUR MIZORAM TRIPURA SIKKIM WEST BENGAL ORISSA JHARKHAND BIHAR UTTAR PRADESH UTTARANCHAL HARYANA CHANDIGARH DELHI PUNJAB HIMACHAL PRADESH JAMMU & KASHMIR RAJASTHAN MADHYA PRADESH GUJARAT GOA MAHARASHTRA CHHATTISGARH ANDHRA PRADESH TAMILNADU KARNATAKA KERALA LAKSHADWEEP
131 Table -6.4 : State-wise District Level Performance Skill of Rainfall Day 3 Forecast (% of districts with threat score 0.5 and above for various rain thresholds) STATE TOTAL DIST 2.5 mm 5 mm 10 mm 15 mm ANDAMAN & NICOBAR ARUNACHAL PRADESH ASSAM MAGHALAYA NAGALAND MANIPUR MIZORAM TRIPURA SIKKIM WEST BENGAL ORISSA JHARKHAND BIHAR UTTAR PRADESH UTTARANCHAL HARYANA CHANDIGARH DELHI PUNJAB HIMACHAL PRADESH JAMMU & KASHMIR RAJASTHAN MADHYA PRADESH GUJARAT GOA MAHARASHTRA CHHATTISGARH ANDHRA PRADESH TAMILNADU KARNATAKA KERALA LAKSHADWEEP
132 Table -6.5: State-wise District Level Performance Skill of Rainfall Day 1 Forecast (% of districts with threat score 0.5 and above for various rain thresholds) STATE TOTAL DIST 2.5 mm 5 mm 10 mm 15 mm ANDAMAN & NICOBAR ARUNACHAL PRADESH ASSAM MAGHALAYA NAGALAND MANIPUR MIZORAM TRIPURA SIKKIM WEST BENGAL ORISSA JHARKHAND BIHAR UTTAR PRADESH UTTARANCHAL HARYANA CHANDIGARH DELHI PUNJAB HIMACHAL PRADESH JAMMU & KASHMIR RAJASTHAN MADHYA PRADESH GUJARAT GOA MAHARASHTRA CHHATTISGARH ANDHRA PRADESH TAMILNADU KARNATAKA KERALA LAKSHADWEEP
133 Table 6.6: State-wise District Level Performance Skill of Rainfall Day 5 Forecast (% of districts with threat score 0.5 and above for various rain thresholds) STATE TOTAL DIST 2.5 mm 5 mm 10 mm 15 mm ANDAMAN & NICOBAR ARUNACHAL PRADESH ASSAM MAGHALAYA NAGALAND MANIPUR MIZORAM TRIPURA SIKKIM WEST BENGAL ORISSA JHARKHAND BIHAR UTTAR PRADESH UTTARANCHAL HARYANA CHANDIGARH DELHI PUNJAB HIMACHAL PRADESH JAMMU & KASHMIR RAJASTHAN MADHYA PRADESH GUJARAT GOA MAHARASHTRA CHHATTISGARH ANDHRA PRADESH TAMILNADU KARNATAKA KERALA LAKSHADWEEP
134 8. Concluding remarks and future outlook Results of this study showed that all these models, in general, have the capability to capture large scale rainfall features of summer monsoon, such as heavy rainfall belt along the west coast, over the domain of monsoon trough and along the foot hills of the Himalayas. Results of errors statistics have clearly demonstrated the superiority of the MME over the member models. Among the member models ECMWF is found to be the best followed by JMA and NCEP GFS. MME based district level forecasts issued by the NHAC of IMD is disseminated daily to concerned Meteorological Centres spread all over the country. Value additions to the dynamical forecast is made by the concerned Meteorological Centres on the basis of district level synoptic, climatological, and topographical knowledge, and from the consideration of the error structures of the previous day s forecast. The value added district level forecasts are the final forecast product provided for the Integrated Agro-advisory Service. The results reported in this study demonstrate the strength of the MME procedure to meet the operational requirements of forecasts for the Integrated Agro-advisory Service of IMD. There is further scope to improve the forecasts, particularly the forecasts of extreme rainfall events. Based on the experience of monsoon 2008, our future work plan for the monsoon 2009 would be: To compute weight for each of ECMWF, JMA, NCEP, NCMRWF and UKMO based on 2008 monsoon data and accordingly to select the best four models for the MME to be used during monsoon To develop an objective criteria for value addition to the district level forecasts. Documentation of important weather system at the district level where forecast failed and preparation of concept paper for value addition procedure. Preparation of district level climatology of extreme events. To design a MME method for probabilistic forecast in 3 days forecast scale based on very high resolution non-hydrostatic meso-scale models as the ensemble members to estimate risk for districts, making use of the new observations and infrastructure that would be available from the ongoing modernization programme of IMD. It is worth to be mentioned that under the modernization programme, IMD is in the process of commissioning a state of the art High Performance Computing (HPC) system 127
135 with a peak performance of 10 TF at IMD HQ., 1 TF at IMD Pune along with high end servers of 100 GF capacities to each in major meteorological centers viz. Delhi, Mumbai, Chennai, Nagpur, Kolkata, Guwahati, Ahmedabad, Bangalore, Bhubaneswar, Chandigarh, Hyderabad and Pune for global and regional NWP modeling, particularly for the regional database management, mesoscale data assimilation and high resolution local area model. A global model T-382 is expected to be made operational at IMD New Delhi by June Acknowledgments: We thankfully acknowledge the use of model outputs of ECMWF, JMA and NCEP in this work. References Jolliffe Ian T and Stehenson B. David, 2003, Forecast Verification a practitioner s Guide in Atmospheric Science, John Willy and Sons, 240 Roy Bhowmik S K and Das Ananda K, Rainfall Analysis for Indian monsoon region using the merged rain gauge observations and satellite estimates: Evaluation of monsoon rainfall features. Journal of Earth System Science 116(3): Roy Bhowmik S K and Durai V.R., Multimodel ensemble forecasting of rainfall over Indian monsoon region. Atmosfera, 21(3):
136 Chapter 7 LONG RANGE FORECASTS OF 2008 SOUTHWEST MONSOON RAINFALL D.S. Pai and O. P. Sreejith This chapter discusses the operational and experimental long range forecasts issued by IMD and its verification. The chapter also briefly discusses the experimental forecasts prepared by other research centers within India and abroad. 1. Introduction Since 2003, India Meteorological Department (IMD) has been issuing long range forecasts for southwest monsoon rainfall in two stages (Rajeevan et al. 2004). The first stage forecast issued in mid April consists of quantitative forecast for the seasonal (June- September) rainfall for the country as a whole. The second stage forecast issued in the end of June consists of update for the April forecast, forecast for the July monsoon rainfall for the country as a whole and forecast for the seasonal monsoon rainfall for the four geographical regions of the country. In 2008, the first stage forecast was issued on 16 th April and the second stage forecasts were issued on 30 th June. In addition to the above long range forecasts, IMD also issued an operational forecast for the monsoon onset over Kerala on 14 th May. In addition to operational forecasts based on statistical forecasting system, experimental forecasts of monthly and seasonal rainfall over Indian region based on dynamical forecasting system were also prepared. 129
137 Apart from IMD, other research institutions in India and abroad are also involved in long range forecasting research. While preparing, the operational forecasts for the 2008 southwest monsoon season, the forecasts from various other research institutions from India and abroad were also taken into account. A brief account of the present statistical forecasting system has been given here along with the discussion on the verification of the operational forecasts for southwest monsoon rainfall and the monsoon onset over Kerala issued by IMD for this year. Experimental forecasts prepared by IMD and those prepared by other institutions in India and abroad are also presented. 2. The statistical ensemble forecasting system for the seasonal rainfall over the country as a whole The new ensemble forecasting system introduced in 2007 (Rajeevan et al. 2007), used a set of 8 predictors (given in the Table-7.1) that having stable and strong physical linkage with the Indian south-west monsoon rainfall. For the April forecast, first 5 predictors listed in the Table-7.1 were used. For the update forecast issued in June, the last 6 predictors were used that include 3 predictors used for April forecast. Table-7.1: Details of the 8 predictors used for the new ensemble forecast system No Predictor North West Europe Land Surface Air Temperature Anomaly (Jan) Equatorial Pacific Warm Water Volume Anomaly (Feb + Mar) North Atlantic Sea Surface Temperature Anomaly (Dec + Jan) Equatorial South East Indian Ocean Sea Surface Temperature Anomaly (Feb + Mar) East Asia Mean Sea Level Pressure Anomaly (Feb + Mar) Central Pacific (Nino 3.4) Sea Surface Temperature Ano. Tendency (MAM- DJF) North Atlantic Mean Sea Level Pressure Anomaly (May) North Central Pacific Zonal Wind Anomaly at 1.5 Km above sea level (May) Used for forecasts in Correlation Coefficient ( ) Favorable / Un favorable for 2008 Monsoon season April 0.59 F April F April and June U April and June 0.43 F April and June 0.36 U June U June F June F 130
138 In the ensemble forecasting system, the forecast for the seasonal rainfall over the country as a whole was computed as the mean of the two ensemble forecasts prepared from two separate set of models. Multiple linear regression (MR) and projection pursuit regression (PPR) techniques were used to construct two separate sets of models. PPR is a nonlinear regression technique. In each case, models were construed using all possible combination of predictors. Using n predictors, it is possible to create (2 n -1) combination of the predictors and therefore that many number of models. Thus with 5 (6) predictors it is possible to construct 31 (63) models. Using sliding fixed training window (of optimum period of 23 years) period, independent forecasts were prepared by all possible models for the period For preparing ensemble average, a set of few best models from all possible MR models and another set of few best models from all possible PPR models were selected. The best models were selected in two steps. In the first step, all models (MR and PPR models separately) were ranked based on the objective criteria of likelihood function or generalized cross-validation (GCV) function computed for the period In the second step, ensemble average of forecasts from the models ranked based on GCV values were computed by using first one model, first 2 models, first 3 models and so on up to all the possible models in the rank list as the ensemble members. The ensemble average for each year of the independent period was computed as the weighted average of the forecasts from the individual ensemble members. The weights used for this purpose was the C.C between the actual and model estimated ISMR values during the training period (of 23 years just prior to the year to be forecasted) adjusted for the model size. Fig.7.1a shows plot between the RMSE of each of the ensemble forecasts for the period Vs number of MR models in the ensemble average for April forecast. The plot also shows the GCV of the individual model against its rank. Fig.7.1b shows same as Fig.7.1a but for PPR models. In Fig.7.1a It is seen that the RMSE of the ensemble average becomes nearly constant when the number of models used for the ensemble becomes more than 4. Therefore, first 4 MR models with lowest GCVs among all the possible models were taken as the optimum number of models required for the ensemble forecast. In the same way, first 5 PPR models with lowest GCVs were used for the other ensemble forecast. Now the mean of the two ensemble average forecasts (one from MR models and another from PPR models) was computed as the final forecast. Performance of the April forecast for the independent test period of computed using the new ensemble method is shown in Fig.7.2. The RMSE of the independent April forecasts for the period was 5.46% of LPA. 131
139 Selection of Best MR Models for Ensemble: April GCV ( (%from LPA)**2.0)) Number of Models used for Ensemble GCV RMSE RMSE of Ensemble Forecast (a) Rank of the Model Selection of Best PPR Models for Ensemble - April Number of Models used for Ensemble GCV RMSE GCV ( (%from LPA)**2.0)) RMSE of Ensemble Forecast (b) Rank of the Model Fig.7.1: Selection of Best models out of all possible models constructed using the 5 predictors for the April forecast. (a) for MR models and (b) for PPR models 132
140 PERFORMANCE OF ENSEMBLE FORECAST SYSTEM ( ): APRIL RAINFALL (% DEP. FROM LPA) ACTUAL AVE_EMR+EPPR YEAR Fig.7.2: Performance of the ensemble forecast system for the April forecast of the seasonal rainfall over the country as a whole Fig.7.3 shows the performance of the ensemble method for the June forecast obtained through the same above procedure. In this case, the June forecast was computed as the mean of the two ensemble averages one obtained from the best 4 MR models and the other from the best 4 PPR models. The RMSE of the independent June forecasts for the period was 5.56% of LPA. PERFORMANCE OF ENSEMBLE FORECAST SYSTEM ( ): JUNE RAINFALL (% DEP. FROM LPA) ACTUAL AVE_EMR+EPPR YEAR Fig.7.3: Performance of the ensemble forecast system for the June forecast of the seasonal rainfall over the country as a whole 133
141 3. Operational Forecasts and Verification 3.1. Forecasts for Southwest Monsoon Rainfall The operational forecast for the country as a whole was issued using the new ensemble statistical forecasting system. Forecast for the July rainfall over the country as a whole was based on a principle component regression (PCR) model using 6 predictors (Table-7.2) with a model error of ± 9%. The forecasts for the seasonal rainfall over the 4 broad geographical regions of the country were prepared using separate multiple regression models each based on different set of predictors and with model error of ±8%. The list of predictors used for the prediction of seasonal rainfall over the four broad geographical regions is shown in Table-7.3. Table 7.2: The details of the predictors used for forecasting July rainfall over the country as a whole No. Predictor C.C. ( ) Favorable / Unfavorable for 2008 July Rainfall 1. North Atlantic Sea Surface Temperature (Dec) U 2. Nino 3.4 Sea Surface Temperature (May + Jun) F 3. North Pacific Mean Sea Level Pressure (Mar) 0.38 F 4. East Asia Mean Sea Level Pressure (Feb + Mar) 0.30 U 5. North Central Pacific Zonal Wind Anomaly at 850 hpa (May) F 6. Equatorial Indian Ocean Mean Sea Level Pressure (Nov) F 134
142 Table 7.3: The details of the parameters used for the forecasting of seasonal rainfall over the 4 homogeneous regions India Geographical Region Northwest India Central India South Peninsula Northeast India Predictor C.C. ( ) North Atlantic Mean Sea Level Pressure Gradient (May) 0.49 South Atlantic Mean Sea Level Pressure (Jan) East Asia Mean Sea Level Pressure (Feb+Mar) 0.53 North Central Pacific Zonal wind at 850 hpa (May) Northwest Europe Mean Sea Level Pressure (Jan) North Atlantic Sea Surface Temperature (Dec+Jan) North Atlantic Mean Sea Level Pressure Gradient (May) 0.60 North Atlantic Mean Sea Level Pressure (Mar) 0.54 Equatorial Indian Ocean Sea Level Pressure (Nov) South East Equatorial Indian Ocean Sea Surface Temperature (Oct) North West Europe Land Surface Air Temperature (Jan) 0.50 North West Pacific Zonal wind at 850 hpa (Feb) South East Pacific Mean Sea Level Pressure (May) 0.50 South East Indian Ocean Mean Sea Level Pressure (May) South Atlantic Mean Sea Level Pressure (Jan) South West Pacific Sea Surface Temperature (Mar) 0.60 Central Pacific Sea Surface Temperature (May) North Atlantic Mean Sea Level Pressure (April) The first stage forecast issued in April for the seasonal rainfall for the country as a whole was 99% of LPA with a model error of ± 5%. The updated forecast issued in June, revised this forecast as 100% of LPA with a model error of ± 4%. The forecast came correct as the actual rainfall for the country as a whole was 98% of the LPA. However, the forecast of 98% of its LPA with a model error of ± 9% for the July 2008 rainfall over the country as a whole was not correct as the actual rainfall was 83% of LPA, much less than the lower limit of the forecasted value. Considering 4 broad homogenous regions of India, the forecast for seasonal rainfall was 96% of its LPA over NW India, 101% of LPA over Central India, 101% of LPA over NE India and 98% of LPA over South Peninsula with a model error of ±8%. The actual rainfall over these 4 regions was 105%, 96%, 97% and 96% of the LPA respectively. Thus the long range forecasts for the seasonal rainfall over all the homogeneous regions except NW India were accurate. Over NW India the actual seasonal rainfall was slightly more than the higher limit of the forecasted value. The Table-7.4 gives the summary of the verification of the long range forecasts issued for the 2008 Southwest monsoon. 135
143 Table-7.4: Verification of the operational long range forecast for SW monsoon rainfall Region Period Issued on Forecast Actual All India All India June to September July 16 th April, th June, th June, % of LPA ± 5% 100% of LPA ± 4% 98% of LPA 98% of LPA ± 9% 83% of LPA Northwest India 96% of LPA ± 8% 105% of LPA Northeast India June to 30 th June, 101% of LPA ± 8% 97% of LPA Central India September % of LPA ± 8% 96% of LPA South Peninsula 98% of LPA ± 8% 96% of LPA 3.2. Forecast for the Monsoon Onset over Kerala Since 2005, IMD has been issuing operational forecast for the onset of monsoon over Kerala using an indigenously developed statistical model (Pai & Rajeevan 2007). The model is based on the principal component regression (PCR) method using 6 predictors. Table-7.5 shows the list of the 6 predictors. Sliding fixed wind period of length 22 years was used for deriving the independent forecasts. According to this method, for the prediction of monsoon onset over Kerala each year, data of 22 years just prior to the reference year was first used for PC analysis of the predictor data series. PC scores were calculated for the reference year using the PC loading matrix and predictor values. Only those PCs that having eigen values more than or equal to 1 were then used as the input to the multiple linear regression equation. For training regression equation also the same 22 years used for PCA analysis was used. In this way, monsoon onset over Kerala was predicted for the period Before the analysis, the predictors were normalized by climatology. For training the model for 2008 data for the period was used. Fig.7.4 shows the performance of the forecast for the independent test period ( ). The RMSE of the model was about 4 days. 136
144 No 1 2 Table 7.5. Details of 6 predictors used for the prediction of monsoon onset over Kerala Name of Predictor Zonal Wind at 200hpa over Indonesian Region OLR Over South China Sea Temporal Domain 16 th to 30 th April 16 th to 30 th April Geographical Domain Correlation Coefficient ( ) 5S-5N, 90E-120E N-15N, 100E-120E Pre-Monsoon Rainfall Peak Date Pre-monsoon April-May South Peninsula (8N-13N, 74E-78E) Minimum Surface air Temperature over NW India 1 st to 15 th May 1. Deesa 2. Rajkot 3. Guna 4. Bikaner 5. Akola 6. Barmer Zonal Wind at 925hpa over Equatorial South Indian Ocean 1 st -15 th May 10S-0, 80E-100E OLR Over Southwest Pacific 1 st to 15 th May 30S-20S, 145E-160E Performance of the PCR Model for Monsoon Onset over Kerala Monsoon Onset Over Kerala (Difference from the Normal Date) Actual MOK Forecast Year Fig.7.4: Actual dates of monsoon onset over Kerala and their predictions from the PCR model for the period 1997 to 2007 Using this PCR model IMD predicted that monsoon onset over Kerala for 2008 would take place on 29 th May with a model error of ±4days. The actual monsoon onset over Kerala was on 31 st May, just one day earlier than its normal date and the forecast was accurate. 137
 of Experimental Climate Prediction Center (ECPC), USA.")
145 4. Experimental Forecasts 4.1. IMD s Dynamical Model Forecasts IMD s dynamical experimental forecasting system uses the seasonal forecast model (SFM) of Experimental Climate Prediction Center (ECPC), USA. The model resolution is T63 L28. The model climatology was prepared using the observed SSTs during the period The hindcasts during the period suggested satisfactory performance of the model over the Indian region. For the first stage forecast, experimental dynamical model forecast for 2008 monsoon season was prepared by persisting March sea surface temperature data as the boundary conditions. The forecast was computed as the average of the 10 ensembles generated using the initial conditions corresponding to 0000Z UTC from 22 nd March to 31 st March The Fig.7.5a shows the seasonal rainfall anomaly forecast for the 2008 monsoon season computed by persisting March SSTs. Fig.7.5a suggested positive seasonal rainfall anomalies over most parts of the country except over northwest and southeast parts of the country where rainfall anomalies are negative. Country as whole, the dynamical ensemble forecast suggested slightly above normal seasonal rainfall. Fig.7.5a: Rainfall Anomaly (mm/day) forecast prepared by IMD dynamical prediction system based on persisting March SST. The base period of model climatology was

146 For the updated experimental dynamical model forecast of seasonal rainfall, persisting May SST data was used as the boundary conditions. 10 ensembles were obtained using the initial conditions corresponding to 0000Z UTC from 21 st May to 30 th May In the Fig.7.5b, ensemble forecast based on the persisting May SSTs suggested positive rainfall anomalies over most parts of the country except some areas of Gujarat, where the anomalies are slightly negative. For the country as a whole, the ensemble dynamical forecast suggested above normal monsoon season rainfall. Fig.7.5b: Rainfall Anomaly (mm/day) forecast prepared by IMD dynamical prediction system based on persisting May SST. The base period of model climatology was Forecasts for Seasonal rainfall from other Institutes in India Experimental forecasts for the seasonal rainfall for the country as a whole was provided by four institutes from India prior to the issuing of the first stage forecast. These forecasts were based on both statistical and dynamical models. No updated forecasts were received. Experimental forecasts based on statistical methods from Indian Institute of Tropical Meteorology (IITM), Pune and Space Application Center (SAC), Ahmedabad are listed in the Table-7.6a. IITM provided four different forecasts based on statistical models. The forecast from global SST model of IITM and Genetic Algorithm based model of SAC indicated above normal rainfall (both 103% of LPA). Forecasts from other three models of IITM were in the range 93-94% of LPA. 139
147 Table -7.6a: The experimental forecasts for the seasonal rainfall over the country as whole based on the statistical models from National Institutes. All forecasts were issued in April, 2008 No Institute Model 1 2 Space Applications Centre, Ahmedabad Indian Institute of Tropical Meteorology (IITM), Pune Empirical model based on Genetic Algorithm Regression model based 1 Predictor (momentum flux) Regression model based on 4 predictors April Forecast 103% 93% 93% Global SST model 103% 2 parameter Regression 94% The seasonal rainfall anomaly forecasts based on dynamical models by NCMRWF, Noida, C-MMACS, Bangalore and IITM are given in the Fig.7.6. The inferences from the forecast maps are given in the Table-7.6b. The C-MMACS forecast was based on a variable resolution AGCM with high resolution (~50Km) over Indian region. AMIP SST monthly climatology was used as lower boundary conditions and NCEP daily reanalysis data were used as initial conditions. The 15 member ensemble forecast were produced by using 5 different grid structures with 3 different initial conditions corresponding to that of March 5, March 10 and March15. The C-MACCS forecast indicated excess rainfall over most parts of the country. Table -7.6b: The experimental forecasts for the southwest monsoon rainfall over the country as whole based on the dynamical models from National Institutes. All forecasts issued in April, 2008 No. Institute Forecast provided by the Institute 1. C-MMACS, Bangalore Excess JJA rainfall over most parts of the country Indian Institute of Tropical Meteorology (IITM), Pune National Centre of Medium Range Weather Forecasting, New Delhi All India Season (June to September) - Normal All India June - above normal All India July and August - normal All India September - above normal Seasonal rainfall over Parts of central and north India- below normal Parts of south India- normal to above normal All India - below normal to normal 140


148 Fig. 7.6: Rainfall Anomaly (mm/day) forecast for the 2008 monsoon season (June-September). Upper panel shows forecast from C-MMACS. Left lower panel shows forecast by NCMRWF and right lower panel shows forecast from IITM The IITM forecast was based on slab ocean model coupled to an atmospheric model (Portable Unified Model version 4.5) from Hadley Center for Climate Prediction and Research. The slab model comprises a mixed-layer ocean model (of fixed depth), together with a simple ice model. Thickness of mixed layer is 50m. Nine initial conditions were generated by perturbing Atmospheric initial condition corresponding to 1 April 2008 based on NCEP reanalysis with slab temperature initialized from surface temperature. The model climatology was based on 20 years of continuous model runs for the period The model indicated normal rainfall over the country as a whole. The monthly forecasts from the models (figures not presented) for the country as a whole indicated above normal rainfall during June normal rainfall during July and August and above normal during September. The NCMRWF forecast was based on its Seasonal Prediction Model (IN-GLM1) forced with predicted Sea Surface Temperature from IRI, USA. Total 18 member ensemble 141
149 runs were carried out with 6 different initial conditions (06-11, April 2008) and three different SST scenarios for each initial condition. Seasonal mean rainfall anomalies were computed with respect to Model climatology of 23 years ( ). The model forecast indicated below normal rainfall over some parts of central & north India and above normal rainfall over some parts of south India. Over country as a whole the model forecast was below normal to normal seasonal rainfall. From the above results, it can be seen that the all India rainfall forecasts by the atmospheric models (of both IITM and NCMRWF) forced with predicted SSTs (SST predictions being done differently) was close to the realized rainfall value. However, the C- MMACS forecast was very much over estimate Forecasts from Major International Climate Prediction Centers Many international climate prediction centers also prepare the global seasonal forecasts using different dynamical models. However, these centers do not prepare forecasts specifically for the Indian region. The forecast issued in May/June by these centers for the Indian region for the period July-September are shown in Fig.7.7a to Fig.7.7e. The inferences from these prediction maps are given in Table-7.7. As seen from the Table-7.7, most of the models were predicting normal to above normal rainfall over most parts of the country. However, there were differences in the spatial distribution of rainfall over the country predicted by various models. Table -7.7: Inferences from the experimental forecasts from major international climate prediction centers No Center United Kingdom Meteorological Office, UK European Centre for Medium Range Weather Forecasting, UK. International Research Institute for Climate Prediction, USA National Center for Environmental Prediction, USA Experimental Climate Prediction Center, USA Inference for 2008 monsoon (JAS)season based on forecast issued in May/June 2008 More probability for above normal or normal rainfall over most parts of the country except over northeast India where the more probability is for below normal rainfall Normal rainfall is most likely over most parts of the country. Over west central India, highest probability is for above normal rainfall, but over all other regions have climatological probability. Higher probability for above normal rainfall over central India. In most other parts, the highest probability is for near normal rainfall. Below normal rainfall over most Peninsula and NE India. Above normal rainfall over all other regions. 142


150 Fig.7.7a:Rainfall forecast from UK Met Office issued in May 2008 Fig.7.7b: Rainfall forecast from ECMWF issued in June


151 Fig.7.7c: Rainfall forecast from IRI issued in June 2008 Fig.7.7d: Rainfall forecast from NCEP CFS issued in June 2008 Fig.7.7e: Rainfall forecast from ECPC, USA issued in June 144
152 References Pai D.S. and Rajeevan M., 2007, Indian summer monsoon onset: Variability and Prediction, NCC Research Report No.4, IMD, Pune. Rajeevan M., Pai D.S., Anil Kumar R., Lal B., 2007, New statistical models for long-range forecasting of southwest monsoon rainfall over India, Climate Dynamics, 28, 813. Rajeevan M., Pai D.S., Dikshit SK, Kelkar RR, 2004, IMD s New Operational Models for Long Range Forecast of South-west Monsoon Rainfall over India and their Verification for Current Science, 86,
153 Chapter 8 USE OF SATELLITE DATA AND PRODUCTS IN WEATHER FORECASTING A.K.Sharma and Suman Goyal This chapter provides a brief description about the use of satellite imageries for operational monitoring and prediction of various aspects of the 2008 southwest monsoon such as onset, progress and withdrawal of monsoon, break monsoon conditions, tropical depressions/cyclones over Indian Seas etc. 1. Satellite - Images There are mainly three types of satellite imageries received from INSAT geostationary satellites at present. Microwave channel is also present on some polar satellites of USA and Europe. 1.1 Visible (VIS) Imagery Visible images represent the amount of sunlight being scattered back into space by the clouds, aerosols, atmospheric gases, and the Earth's surface. Thicker clouds have a higher reflectivity (or albedo) and appear brighter than thinner clouds on a visible image. However, it is difficult to distinguish among low, middle, and high level clouds in a visible satellite image, since they can all have a similar albedo and for this distinction, infrared satellite images are useful. The brightness (shade) of the visible image depends upon the 146
 albedo followed by fresh snow, other thick clouds (Cu, Ac, As, Sc, St, Cs), old snow, Shallow, broken clouds (St, Ci, Cs, Cc, Cu), sea ice, land surface")
.")
154 reflectivity or albedo of the underlying surface, intensity of the solar beam and relative position of sun & satellite with respect to the Earth. So, visible imagery is not available during night. The Cumulonimbus clouds have highest (90%) albedo followed by fresh snow, other thick clouds (Cu, Ac, As, Sc, St, Cs), old snow, Shallow, broken clouds (St, Ci, Cs, Cc, Cu), sea ice, land surface whereas water surfaces have lowest (8%) albedo. Therefore, visible imagery is very useful for distinguishing between clouds, land, and sea/ocean, i.e. contrast between these three are best in this imagery. In general, land appears brighter than sea but darker than clouds. (Fig.8.1). Cloud structure may also be identified by viewing shadow and highlights in visible imagery when sunshine falls obliquely onto clouds. A - Stratocumulus, B - Cumulonimbus, C Cumulus, D - Cirrus Fig.8.1: Visible image showing different clouds 147
155 Visible image is being used for analysis of tropical cyclone following the Dvorak Technique. The position and intensity of cyclone can be estimated better in visible imagery as low cloud features best seen in this image. However one important drawback is that this image is only available in day time only. Some problems may arise while interpreting a visible imagery which are mentioned as follows: Distinguishing clouds over a snow-covered area Distinction between snow and clouds is very difficult as in visible image both have almost same brightness (large albedo). However, animation of visible image can reveal clouds moving over the stationary snow/ice Thin clouds Thin cloud coverage having low albedo over a dark surface area may be underestimated as it does not show up very brightly in VIS imagery. On the other hand sometimes-thin clouds over a high albedo desert surface may be seen misleadingly bright because of scattering light from lower surfaces reaching to the satellite Small clouds Detection of Small clouds, such as fair weather cumulus may be difficult in visible imagery because of lower spatial resolution of satellite radiometer Variation in brightness of different land surfaces Brightness of land varies with the type of surface like, a desert appears very bright and forests & vegetated land appear darker which may mislead the interpretation Distinction between fog and stratus cloud It is difficult to distinguish Fog from higher stratus clouds. 2. Infra Red (IR) Imagery IR imagery is derived from emitted terrestrial radiation at thermal infrared wavelength (10-12 µm). It provides quantitative measurements of temperature of the underlying surface or clouds. The greatest advantage of IR images is it s round the clock (day & night) availability. In black and white IR imagery, white shades i.e. high brightness represent cold areas (higher cloud heights) whereas black shades (low brightness) indicate warm surfaces or low cloud height. Therefore height estimation of different layers of clouds is easier by analyzing IR imagery in comparison to other imagery. Since temperature in the 148
.")

156 troposphere decreases with height, high level clouds are colder than low level clouds. Therefore, low clouds appear darker on an infrared image and higher clouds appear brighter. Thin cirrus, which is often transparent in VIS imagery, can show up clearly in IR imagery, especially when it lies over a much warmer surface (Fig.8.2). The tropical cyclone position and intensity estimate is being carried out using Enhanced IR (EIR) imagery following the Dvorak Technique. As it is available round the clock monitoring of cyclones is possible using these images and also it is used for objective analysis of cyclone with the help of Cloud Top Temperature analysis following Advanced Dvorak Technique (ADT). N CIRRUS, O Cb, P - CUMULUS Fig.8.2: IR imagery showing different clouds Some problems related to interpretation of IR imagery can be summarized as follows: 149
157 2.1 Detection of fog and low clouds During night time, fog and low clouds can not be differentiated from other land surface features because of negligible temperature contrast among them. 2.2 Land sea contrast In IR imagery coast line can be seen clearly only when there is large difference between land and sea surface temperatures. For example, the most prominent temperature difference between land and sea is normally found in summer and winter and is least in spring and autumn. 3. Water Vapor (WV) Imagery Water vapour absorbs and reradiates electromagnetic radiation in the absorption band 6-7 µm and is used for detecting presence of moisture in the middle and upper levels ( hpa) of the atmosphere. However if air is dry some radiations may come from layers as low as 800hPa. Like IR, WV image is also available at all times of the day and night. In WV image, each pixel is assigned a gray shade according to the measured brightness temperature where white indicates a very cold brightness temperature (radiation from a moist layer or cloud in the upper troposphere), and black indicates a warm brightness temperature (radiation from the Earth or a dry layer in the middle troposphere). But there is no such simple relationship between moisture and brightness of WV image as some clouds (high & deep clouds and Cb anvils) also emit some radiation in WV band. One of the most important features of WV image is presence of extensive & continuous structures of atmosphere so that cloud patterns, which may appear distinct from each other in the VIS & IR, can be recognized in WV image as being a part of the same air mass. In addition this characteristic of WV image also provides information about the swirling middle tropospheric wind patterns and jet streams.(fig.8.3).the "moist" and "dry" features seen on WV imagery are resulting from various combinations of vertical motion, horizontal deformation and moisture advection within the middle and upper troposphere. WV image therefore can be used to represent three-dimensional atmospheric motions on the meso and synoptic scale. WV images show moisture boundaries in the form of plumes, or tongues or streams of moisture. These can be useful for prediction of heavy rainfall and resultant flash floods. WV imagery has been found to be useful in understanding the processes that govern the movement of tropical cyclones. The recurvature of a northwestward moving tropical cyclone occurs under the influence of an approaching upper air trough. WV imagery captures such interactions and if the moisture expansion develops northward it indicates the possibility of recurvature and the cyclone moves west wards if the moisture dissipation is shown on northern side. 150


158 The one big disadvantage of WV imagery is that moist air or clouds in the lower tropospheric level (near surface) are not well depicted. Fig.8.3: Example of water vapour image 151
159 4. Microwave (MW) Channel Imagery The microwave channel gives some important information, which are missed in the VIS, IR and WV imageries. For example SSM/I 85GHZ imagery can observe the eye in tropical cyclones even when it is covered by cirrus. In the case of weakening cyclones SSM/I can clearly bring out the cloud formations, which in other channels have no contrast with the sea surface. Absence of microwave channel imagery (in real time) round the clock is a weak area in satellite-meteorology. Similarly scatterometers (12 GHZ) are able to derive wind velocity over the oceans and are useful in locating or finding the intensity of cyclones. 5. Other satellite derived products which are easily available from Internet are as follows: Satellite derived winds : cloud motion vectors (CMV) and water vapour winds (WVW). Quickscat winds depicting wind velocity over oceans Low level convergence: Convergence within the layer mb. Upper level divergence: Divergence within the layer mb. Wind shear Shear tendency Low level vorticity: at 850 hpa level. Outgoing Longwave Radiation(OLR) Quantitative Precipitation Estimates(QPE) Sea Surface Temperature(SST) Special Sensor Microwave Instruments(SSM/I) derived wind speed GPS derived Integrated Precipitable Water Vapour (IPWV) 5.1 Cloud motion vectors (CMV) and water vapour winds (WVW) These winds over the north Indian Ocean have been found to be particularly valuable for understanding the low & upper level air flow at the time of Indian summer monsoon. They are capable to capturing vital information on the formation of eddies, cross equatorial flow, approach of the southwest monsoon towards the west coast of India, off-shore vortices and the activity of the two branches of the monsoon over Arabian Sea and Bay of Bengal which cannot be obtained from conventional data. Low level jet, tropical easterly jet, trough in westerly and sub-tropical westerly jet can easily be indentified in CMVs and WVWs. 152
160 5.2 Quickscat winds Quickscat has a Seawinds Ku-band scatterometer instrument with swath 1800km and wind speed is measured in the range of 3-20 meter/sec with an accuracy of 2 m/sec, wind direction with accuracy of 20. The low level circulations provided by the scatterometer winds are very helpful in determining the outer wind structure and locating the centre during the weak tropical cyclone stage. 5.3 Wind Shear/Shear tendency Vertical wind shear as calculated by subtracting the low-level layer-averaged flow ( mb) from the upper-level layer-averaged flow ( mb). Low wind shear i.e. less than 20 knots and negative wind shear tendency is favorable for the intensification of the weather system. 5.4 OLR Strong relationship has been found between OLR and convective activity and large scale precipitation over the globe. Low OLR usually indicates cold surface temperatures or presence of clouds while high OLR indicates warm surface temperatures or absence of convection. It is useful for tracking the onset of southwest monsoon and evolving objective criteria for onset of monsoon. 5.5 QPE: Quantative precipitation estimation (QPE) is derived from Kalpana I Satellite in every three hours. It is useful for comparison with the actual rainfall over high temporal and spatial scale. 5.6 SST SST is derived from the IR channel data of satellite. The single channel SST has some limitations and efforts are being made to derive Multichannel SST with the launch of INSAT-3D which will be quite comparable with the actual SST and can be used in meteorology effectively. SSTs above 26.5 C (80 F) are generally favorable for the formation and sustaining of tropical cyclones. Generally the higher the SST, the stronger the storm. However, there are many factors affecting the strength of storms. 5.7 SSMI derived wind speed Using the SSMI brightness temperature, ocean surface wind speeds are derived at a height of 19.5 meter. These derived winds are very helpful for monitoring the onset of monsoon over Kerala and the position and intensity estimation of low pressure systems. 153
161 5.8 GPS derived Integrated Precipitable Water Vapour (IPWV) Global Positioning System (GPS) is used in retrieving the IPWV at five places i.e. Delhi, Chennai, Mumbai, Kolkata and Gauwahati in real time basis by measuring the total Zenith Delay. This information is very useful in nowcasting and mesoscale events and other events like Fog, thunderstorms, floods and monsoon etc. Assimilating these data into NWP models will help to modify the moisture information and in-turn improve the overall forecasting accuracy. 6. Use of satellite products in observing South West Monsoon In AMR 2006 IMD adopted the following objective criteria for dealing Monsoon onset over Kerala based on the analysis of conventional weather observations and satellite products: 6.1 Rainfall If after 10 th May, 60% of the available 14 stations enlisted (Minicoy, Amini Divi, Thiruvananthapuram, Punalur, Kollam, Alappuzha, Kottayam, Kochi, Thrissur, Kozhikode, Thalassery, Kannur, Kasargode and Mangalore) report rainfall of 2.5mm or more for two consecutive days, the onset over Kerala be declared on the second day, provided the following criteria are also in occurrence. 6.2 Wind Field Depth of westerlies should be maintained up to 600 hpa, in the box equator to Lat 10 0 N and Long 55 0 E to 80 0 E. The zonal wind speed at 925 hpa over the area bounded by 5 0 N-10 0 N, 70 0 E to 80 0 E should be at least of the order of knots. 6.3 OLR INSAT derived OLR value should be below 200 Wm -2 in the box confined by Lat N and Long E. 6.4 SSM/I derived wind speeed and water vapour On the date of onset and two days prior to it, the SSM/I derived surface wind maximum in the box defined by lat N and long E should be greater than 16m/s with the water vapour maxima remaining 6g/cm 2. Out of these four criteria, last three are Satellite based. So satellite observations are very important for declaring onset of Monsoon over Kerala. 154

 : Weekly OLR distribution of different weeks of May,2008 (Starting from 12 th May,2008) 155")
162 In year 2008, following pictures indicate that these criteria are fulfilled, see picture (a), (b), and (c) in Fig.8.4 shows weekly OLR distribution for the week. a. 12 th -18 th May 2008: OLR values are between watts/meter 2 over southeast Arabian Sea. b. 19 th 25 th May 2008: OLR values are between watts/meter 2 over southeast Arabian Sea. c. 26 th 1 st June 2008: OLR values are less than 200 watts/meter 2 over southeast Arabian Sea. (c) Fig. 8.4(a c) : Weekly OLR distribution of different weeks of May,2008 (Starting from 12 th May,2008) 155

163 Fig.8.5 describes OLR distribution in the box latitude N and longitude E on 30 th & 31 st May 08. On 30 th May and on 31 st May, OLR values less than 200 w/m 2 was observed over the area, suggesting the persistence of enhanced convection off the Kerala coast. Special sensor microwave imager (SSM/I), 10m surface wind speed for the region covered by latitudes N to N and longitudes E to E for the period 29 th to 31 st May 2008 (Fig.8.6a and Fig.8.6b) exceeds the minimum criteria of 16m/sec. Similarly, SSM (I) derived water vapor for the same region satisfies the criteria of 6gm/cm 2 on the date of onset and two days prior to it as observed on 29 th, 30 th and 31 st May 08 (Fig.8.7). Fig.8.5(a &b): OLR distribution on 30 th & 31 st May 08 respectively 156
: SSMI")

164 Fig.8.6(a): SSMI wind speed for 29 th to 31 st May,
: Histogram")

165 Fig.8.6(b): Histogram for SSMI wind speeds for 29 th to 31 st May,

166 Fig.8.7: SSM/I +TMI water vapour for 29 th to 31 st May,

167 7. South West Monsoon 2008 South West monsoon onset over Andaman Sea and Nicobar Islands and some parts of SE Bay was observed on 10 th May about 5 days earlier than the normal date and the whole of Bay islands and some more parts of Bay on 12 th May about a week earlier than the normal date. A vortex with intensity T1.0 formed over Andaman Sea from 11 th to 15 th May (Fig.8.8) which subsequently moved in northwesterly direction and crossed the land near 19.5ºN/94.0ºE. This system might have resulted in increased cross equatorial flow (Fig.8.9) and the convection over Bay of Bengal resulting in early onset of Monsoon over Bay islands. Advancement of monsoon took place quite rapidly mainly due to the formation of vortex with intensity reaching up to T1.5 on th June over northeast Bay of Bengal which moved in northwest north direction and crossed Bangladesh coast on 16 th at 1500UTC and moved across West Bengal and Jharkhand than as a low pressure area reached up to east UP and adjoining east MP. This system caused heavy to extremely heavy rainfall over Gangetic West Bengal, north Orissa and Jharkhand leading to flood over the regions. Fig.8.8: Images showing the vortex formed over Andaman Sea during 11 th to 15 th May,

 was high around 20-30knots.")
 was also increasing as observed in 1200UTC of 9 th August;2008.")
168 Fig.8.9 : CMV shows cross equatorial flow 7.1 Monsoon Disturbances Vortex formed on 9 th, 10 th August 08 over NW Bay was a land depression at 0900 UTC of 9 th August. It developed as a vortex with intensity T 1.0. On 9 th August between UTC, the wind shear (Fig.8.10) was high around 20-30knots. So, because of large wind shear it was expected that it would not intensify further. Wind shear tendency (Fig.8.11) was also increasing as observed in 1200UTC of 9 th August;2008. Water vapour winds at mb (steering current) on 9 th August, suggested west-northwestward movement of the system. Fig.8.10: Wind shear on 9 th August,
 during monsoon 08.")
169 Fig.8.11: Wind shear tendency as on 9 th August, 2008 Then another vortex formed over North and adjoining central Bay from 14 th to 19 th September 08. It was the only vortex formed over Bay reached up to the intensity of deep depression (T2.0) during monsoon 08. The convective clouds organized and convection increased gradually from 14 th to 16 th and reached its maximum intensity T 2.0 at 0300 UTC of 16 th Sep 08.(Fig.8.12(a-g)) The environmental condition i.e. SST (about 29.5) vertical wind shear near system and to west of the system (10-15 kts.) were favorable. The vortex wind move in the WNWly direction was clearly indicated by WVW. Also since there was a westerly trough near 65 0 E and 35 0 N on 19 th as it was expected that the system will interact with this Wly as seen in WVW of 19 th system (Fig.8.13a&b) and move in the Nly direction. Its movement in the predicted direction was established by the imageries of 20 th Sept
: Visible image")
: Visible image")
170 Fig.8.12 (a): Visible image UTC Fig.8.12 (b): Visible image UTC 163
: Visible image")
: R image")
171 Fig.8.12(c): Visible image UTC Fig.8.12.(d): R image UTC 164
: Visible image")
: IR image")
172 Fig.8.12(e): Visible image UTC Fig.8.12(f): IR image UTC 165
: IR image")
: Water vapour")
: Water vapour")
173 Fig.8.12(g): IR image UTC Fig.8.13(a): Water vapour winds UTC Fig.8.13(b): Water vapour winds UTC 166


, SHET appeared on some days, westerly systems passed across")

174 7.2 Break Monsoon Weak monsoon conditions prevailed from 13 th to 23 rd July and during this period maximum cloud zone/convection was confined near foot hills of Himalayas and adjoining gangetic plains (Fig.8.14a to Fig.8.14h), SHET appeared on some days, westerly systems passed across North India one after the other and Sub Tropical Ridge/Tibetan High was observed over south of latitude 30.0 Degree North at many occasions during this period. Break Monsoon conditions Satellite Imageries and products (14a-h) Fig.8.14(a) Fig.8.14(b) 167
 Fig.")


175 Fig.8.14(c) Fig. 8.14(d) 168
")


176 Fig.8.14 (e) Fig.8.14(f) 169
 14")


177 Fig.8.14(g) Fig.8.14 (h) 170

 and cloud pattern during the period indicated broken moderate to intense convection in association with monsoon flow (Fig.8.16a to Fig.")
178 7.3 Kosi Catchment Area Rainfall in Bihar adj. Nepal related to Kosi Dam breakage was predicted by Satellite Imageries and products it was observed that daily mean OLR values during 15 th to 18 th August 2008 over East Bihar adj. Nepal were in the ranges up to W/m 2 (Fig 8.15a- Fig.8.15d) and cloud pattern during the period indicated broken moderate to intense convection in association with monsoon flow (Fig.8.16a to Fig.8.16c)) and also eastward moving clouds in association with westerly up severed during the period. QPE also showed maximum rainfall over that area (Fig.8.17a- Fig.8.17d). Fig.8.15(a): Daily Mean OLR dated 15/08/
:")

:")

179 Fig.8.15(b): Daily Mean OLR dated 16/08/2008 Fig.8.15(c): Daily Mean OLR dated 17/08/
:")

:")

180 Fig.8.15(d): Daily Mean OLR dated 18/08/2008 Fig.8.16(a): Cloud top Temp dated 15/08/
:")

:")

181 Fig.8.16(b): Cloud top Temp dated 16/08/2008 Fig.8.16(c): Cloud top Temp dated 17/08/
:24 hrs")


182 Fig.8.17(a):24 hrs QPE dated 15/08/2008 Fig.8.17(b):24 hrs QPE dated 16/08/
:24 hrs")


183 Fig.8.17(c):24 hrs QPE dated 17/08/2008 Fig.8.17(d):24 hrs QPE dated 18/08/


184 7.4 Withdrawal of SW monsoon Withdrawal signs were observed over west Rajasthan from 8 th to 11 th September then on 12 th a low level circulation was formed over East central adj. NE Arabian Sea which subsequently moved eastwards over Gujarat and neighborhood and delayed the withdrawal. Then after this episode the withdrawal signs were clearly indicated in the WV imageries from 22 nd September (Fig.8.18a & b ) onwards much ahead of actual withdrawal date i.e. 29 th September. Fig.8.18(a): Water Vapour imageries showing withdrawal of SW monsoon 177
: Water Vapour imageries showing")

185 Fig.8.18(b): Water Vapour imageries showing withdrawal of SW monsoon References 1. Satellite Meteorology by Dr. R.R. Kelkar 2. Various Internet sites related to satellite meteorology. 178
186 Chapter 9 UTILITY OF AUTOMATIC WEATHER STATION (AWS) DATA FOR MONITORING AND PREDICTION OF MONSOON CIRCULATIONS M. Mohapatra, A. K. Sharma and Suman Goyal 1. Introduction: India Meteorological Department (IMD) has installed 125 Automatic Weather Stations (AWS) across the country and plans to augment the AWS network under its modernisation programme. The AWS has a number of advantages over conventional manual recoding. In general, AWS is more consistent in its measurement. AWS provides data more frequently. It provides data in all weather conditions, day and night continuously round the year. It can be installed in sparsely populated difficult terrains. However, it suffers from a number of disadvantages also. There are some weather elements like cloud cover and significant weather phenomena which are difficult to automate. AWS requires large capital investment and they are less flexible than human observers. During the planning stage therefore, we have to deal with the issues like representativeness, accuracy and real time collection etc. need to be considered. One aspect of observational network which is frequently overlooked is proper ongoing documentation of the quality of network. Hence, a study has been undertaken to analyse and document the performance of AWS during monsoon season (June-September), Similar analysis was performed for the monsoon season, 2007 and scope and limitations were brought out (Bhatia et al. 2008) 179
187 The monsoon circulation over Indian region is marked by different phases like onset, active/break and withdrawal phases (Rao, 1976). The semi-permanent systems like monsoon trough, heat low, off shore trough along the west coast and the transient disturbances play a major role in the spatio -temporal variation of monsoon rainfall over India. The AWS data observed during the monsoon season, 2008 have been analysed to monitor the above features of monsoon circulation. The utility of the AWS data for the prediction purpose has also been examined. This study will help in further planning of AWS network in the country. 2. Data and methodology: The AWS data from 125 IMD stations (Fig.9.1) as obtained operationally at Northern Hemispheric Analysis Centre (NHAC), IMD, New Delhi have been analysed. Mainly the isobaric analysis have been performed based on daily observations at 0300 and 1200 UTC during the period of 1 June- 30 September, To validate the synoptic features observed in AWS analysis, the isobaric analyses of corresponding synoptic observations have been considered. To monitor the genesis movement and intensification of the transient disturbances, the depressions which affected the country during monsoon season have been analysed. There were 3 depressions which affected the rainfall over the country during monsoon season as shown in Fig.9.2. These include the depression over the Bay of Bengal (16-18 June, 2008), which crossed Bangladesh coast near E and dissipated over Jharkhand and neighbourhood, the land depression (9-10 August, 2008) which developed over coastal Orissa near Puri and dissipated over north interior Orissa and the deep depression over the Bay of Bengal (15-19 September, 2008) Which crossed Orissa coast near Chandbali on 16 th September, 2008 night and dissipated over central UP and neighbourhood. The depression over the Arabian Sea which moved northwestwards has not been considered, as it did not affect the rainfall over the country and the performance of AWS can not be validated. To monitor the onset phase, a typical case of an active off shore trough along the west coast embedded with a well marked low pressure area over Saurashtra & Kutch and neighbourhood have been analysed with AWS and synoptic observations. 180

188 The monsoon, 2008 over India was marked by a prolonged weak monsoon condition during second half of July (14-25 July, 2008). An attempt has been made to examine the AWS data during pre-break, break and post break period. All the above analyses include the analysis of mean sea level pressure (MSLP), 24 hours pressure change and surface wind direction and speed. The results are presented and analysed in sec. 3. The scope and limitations are presented in Sec.4 and the broad conclusions are presented in sec. 5. Fig.9.1: AWS network of IMD 181
189 Fig.9.2:. Tracks of the low pressure systems over Indian seas during the Southwest Monsoon Season Results and discussion: The performance of AWS during onset phase of monsoon is presented and discussed in sec The performance of AWS with respect to genesis, intensification and movement of monsoon depressions are analysed and presented in sec The performance of AWS during break monsoon conditions is analysed and discussed in sec Onset phase of monsoon The southwest monsoon set in over Kerala on 31 st May one day prior to the normal date. Further advance of monsoon took place quite rapidly due to a depression over east central Arabian Sea (5-6 June) and a well marked low pressure area over Saurashtra & Kutch and neighbourhood (9-11 June). The onset phase of monsoon could be well 182


 AWS observations at 0300 UTC of 9 th")
190 monitored with the AWS data, mainly with MSLP and surface wind observations. To illustrate the above, the isobaric analysis along with the wind Fig.9.3: Isobaric analysis of (a) synoptic observations and (b) AWS observations at 0300 UTC of 9 th June, 2008 indicating active onset phase of monsoon 183
191 over Indian region based on AWS and synoptic observations at 0300 UTC of 9 th June, 2008 are presented in Fig.9.3. Comparison of Figures 9.3(a) and 9.3(b) indicate that the well marked low pressure area, off shore trough along the west coast and steep pressure gradient along west coast could be brought out in AWS analysis like the synoptic analysis. However, due to sparse observational network, the closed isobar of 998 hpa could be drawn in AWS analysis against 996 hpa in synoptic analysis. The MSLP varied from 998 hpa to 1010 hpa in AWS analysis against 996 hpa to 1010 hpa in synoptic analysis. The coastal wind observations from AWS along west coast also agreed well with the synoptic observations supporting off shore trough. According Rao (1976) and Srinivasan et. al. (1972), the onset and advance of monsoon along the west coast is associated with any one or all of the synoptic features like (i) off shore trough (ii) increase in pressure gradient (iii) embedded off shore vortex. In addition to above, the seasonal trough running from Rajasthan to northwest Bay of Bengal across Orissa could be established in AWS analysis like synoptic analysis. The development of low pressure area with closed isobar of 1004 hpa over the northwest Bay of Bengal off Orissa coast could be established in both AWS and synoptic analyses Monsoon depression The isobaric analysis along with the surface wind based on synoptic data and AWS data in association with the depression over the Bay of Bengal (16-18 June) based on 0300 UTC observation is presented in Fig.9.4. The analysis based on 1200 UTC observation of 16 th are also presented in the same figure, to illustrate the landfall of the system, as system crossed Bangladesh coast near long E between 1100 and 1200 UTC of 16 th June. Comparing the analyses based on synoptic and AWS observations, the depression could be well detected in AWS analysis. In both the cases there were two closed isobars within 6 0 latitude/longitude box, as per the criteria adopted by IMD (2006) to declare the intensity of low pressure system. However, the lowest pressure in association with the system was higher by about 2 hpa in case of AWS It may be due to sparse data in case of AWS analysis considering the data from individual station, the MSLP were comparable to each other. The movement of the system across Bangladesh, Gangetic West Bengal and Jharkhand could be well captured. 184
 synoptic")
 0300 UTC of 16-06-2008 (ii) 1200 UTC")
 0300 UTC of 18-06-2008 in")
192 Fig.9.4: Isobaric analysis of (a) synoptic observations and (b) AWS observations at (i) 0300 UTC of (ii) 1200 UTC of (iii) 0300 UTC of and (iv) 0300 UTC of in association with depression (16-18 June, 2008) 185

193 Considering the land depression (9-10 August, 2008), which developed over coastal Orissa, being centred near Puri at 1200 UTC of 9 August 2008 (Fig.9.5), the short life of the system along with genesis and movement could be monitored with AWS observations. This system weakened into a well marked low pressure area at 1200 UTC of 10 August, 2008 over north interior Orissa. Fig.9.5: Isobaric analysis of (a) synoptic observations and (b) AWS observations at 1200 UTC of 9 th and 10 th August in association with land depression (9-10 August, 2008) 186

194 The comparative analysis of synoptic and AWS observations in association with the deep depression (15-19 September, 2008) are presented in Fig.9.6. This system developed over the Bay of Bengal at 1200 UTC of 15 September. It moved west-northwestwards, intensified into a deep depression on 16 September and crossed Orissa coast near Chandbali between 1600 and 1700 UTC of 16 September. It moved west-northwestwards thereafter and then north-westwards Fig.9.6(contd.):. Isobaric analysis of ( a) Synoptic and (b) AWS observations at (i) 0300 UTC of (ii) 0300 UTC of
195 towards central Uttar Pradesh under the influence of a mid-latitude westerly trough at midtropospheric level. It weakened into a well marked low pressure area over west Uttar Pradesh and neighbourhood on 19 September afternoon. As seen from the figure, the genesis, intensification and movement of the system could be well detected by AWS. Comparing individual stations, the lowest MSLP of 829 hpa with maximum 24 hrs pressure fall of 15.3 hpa was reported over synoptic station, Chandbali (coastal Orissa) at 1700 UTC of 16 September. The AWS Basudevpur (BAS), located close to the north of Chandbali reported lowest MSLP of hpa with maximum pressure fall 16.3 hpa at 1800 UTC 16 September. However, the surface wind of 40 knots from southerly direction was reported by Chandbali at 1700 UTC in association with the thunderstorm whereas the maximum wind reported by BAS was about 15 knots from east-southeasterly direction. Hence, the squally wind reported along Orissa coast near Chandbali could not be detected in AWS Break monsoon condition: According to Ramamurty (1969), the break monsoon condition is associated with the monsoon trough at mean sea level shifting northwards to the foothills of the Himalaya or not being seen at all over the Indian region and all the winds becoming westerly over Indian region upto 850 hpa levels. A prolonged break monsoon condition prevailed over the country during second half of July 2008 leading to deficient all India rainfall in July. The break monsoon condition in terms of shifting of the monsoon trough to the foot hills of the Himalayas or being absent over the Indian region and absence of easterlies over the Indian region at surface level could be monitored with AWS analysis. A typical analysis illustrating the break monsoon condition is presented in Fig.9.7, when the monsoon trough was absent over the Indian region. Instead a north-south oriented trough in sea level extended from Bihar to southeast peninsula. The pressure gradient along the west coast was very weak and the isobars were almost parallel to the west coast. However, considering individual stations, individual parameters like pressure and wind were wrong over some stations. 188
 synoptic")

196 Fig.9.7: Isobaric analysis of (a) synoptic observations and (b) AWS observations at 12 UTC of 17 th July, 2008 indicating weak monsoon condition over India 189
Government of India India Meteorological Department (Ministry of Earth Sciences) Subject: Current weather conditions and forecast for next two weeks
 Subject: Current weather conditions and forecast for next two weeks") Government of India India Meteorological Department (Ministry of Earth Sciences) Press Release Dated 18 June, 2010 Subject: Current weather conditions and forecast for next two weeks Advance of monsoon
Government of India India Meteorological Department (Ministry of Earth Sciences) Press Release Dated 18 June, 2010 Subject: Current weather conditions and forecast for next two weeks Advance of monsoon
CURRENT STATUS OF MONSOON Main Meteorological conditions of the last week (27August to 2 September)
") CURRENT STATUS OF MONSOON 2009 Main Meteorological conditions of the last week (27August to 2 September) Last week s low pressure area over Orissa and neighbourhood moved west-northwestwards across central
CURRENT STATUS OF MONSOON 2009 Main Meteorological conditions of the last week (27August to 2 September) Last week s low pressure area over Orissa and neighbourhood moved west-northwestwards across central
INDIA METEOROLOGICAL DEPARTMENT (MINISTRY OF EARTH SCIENCES) SOUTHWEST MONSOON-2014 END OF SEASON REPORT For the state of RAJASTHAN
 SOUTHWEST MONSOON-2014 END OF SEASON REPORT For the state of RAJASTHAN") INDIA METEOROLOGICAL DEPARTMENT (MINISTRY OF EARTH SCIENCES) SOUTHWEST MONSOON-2014 END OF SEASON REPORT For the state of RAJASTHAN HIGHLIGHTS For the country as a whole, the rainfall for the season (June-September)
INDIA METEOROLOGICAL DEPARTMENT (MINISTRY OF EARTH SCIENCES) SOUTHWEST MONSOON-2014 END OF SEASON REPORT For the state of RAJASTHAN HIGHLIGHTS For the country as a whole, the rainfall for the season (June-September)
ALL INDIA WEATHER SUMMARY AND FORECAST BULLETIN
 Sunday 22 April 2018 NIGHT Time of Issue: 2000 hours IST ALL INDIA WEATHER SUMMARY AND FORECAST BULLETIN Significant Weather Features The ongoing fairly widespread rainfall activity with isolated thunder
3. HYDROMETEROLOGY. 3.1 Introduction. 3.2 Hydro-meteorological Aspect. 3.3 Rain Gauge Stations
 3. HYDROMETEROLOGY 3.1 Introduction Hydrometeorology is a branch of meteorology and hydrology that studies the transfer of water and energy between the land surface and the lower atmosphere. Detailed hydrological
ALL INDIA WEATHER SUMMARY AND FORECAST BULLETIN
 Tuesday 08 May 2018 MID DAY Time of Issue: 1345 hours IST ALL INDIA WEATHER SUMMARY AND FORECAST BULLETIN Significant Weather Features Under the influence of the present Western Disturbance over Jammu
ALL INDIA WEATHER SUMMARY AND FORECAST BULLETIN
 Saturday 21 April 2018 MORNING Time of Issue: 0800 hours IST ALL INDIA WEATHER SUMMARY AND FORECAST BULLETIN Significant Weather Features Isolated thunder squalls and hailstorms are very likely over Sub
Prediction of western disturbances and associated weather over Western Himalayas
 Prediction of western disturbances and associated weather over Western Himalayas H. R. Hatwar*, B. P. Yadav and Y. V. Rama Rao India Meteorological Department, Lodi Road, New Delhi 110 003, India Two cases
W E E K L Y MONSOON INSIGHT
 W E E K L Y MONSOON INSIGHT 08 th July 2016 Indian Monsoon Dynamics Recent Weather Development India received 35% surplus rainfall in the week ended 6 July with all regions recording above-normal rainfall
Suppressed Surface Heating over northwestern parts of the Country and the ensuing Monsoon Rainfall
 Suppressed Surface Heating over northwestern parts of the Country and the ensuing Monsoon Rainfall During this year, the temperatures have been below normal over north and northwestern parts of India.
Monsoon. Monsoon. Edited by Ajit Tyagi and D. S. Pai OFFICE OF THE ADDITIONAL DIRECTOR GENERAL OF METEOROLOGY (RESEARCH),PUNE
,PUNE") GOVERNMENT OF INDIA MINISTRY OF EARTH SCIENCES INDIA METEOROLOGICAL DEPARTMENT IMD Met. Monograph No. : Synoptic Meteorology No. 01 /2011 Monsoon 2011 A Report Edited by Ajit Tyagi and D. S. Pai LOGICAL
GOVERNMENT OF INDIA MINISTRY OF EARTH SCIENCES INDIA METEOROLOGICAL DEPARTMENT IMD Met. Monograph No. : Synoptic Meteorology No. 01 /2011 Monsoon 2011 A Report Edited by Ajit Tyagi and D. S. Pai LOGICAL
Long Range Forecast Update for 2014 Southwest Monsoon Rainfall
 Earth System Science Organization (ESSO) Ministry of Earth Sciences (MoES) India Meteorological Department PRESS RELEASE New Delhi, 9 June 2014 Long Update for 2014 Southwest Monsoon Rainfall HIGHLIGHTS
Occurrence of heavy rainfall around the confluence line in monsoon disturbances and its importance in causing floods
 Occurrence of heavy rainfall around the confluence line in monsoon disturbances and its importance in causing floods GNAGESWARA RAO Department of Meteorology & Oceanography, Andhra University, Visakhapatnam
KUALA LUMPUR MONSOON ACTIVITY CENT
 T KUALA LUMPUR MONSOON ACTIVITY CENT 2 ALAYSIAN METEOROLOGICAL http://www.met.gov.my DEPARTMENT MINISTRY OF SCIENCE. TECHNOLOGY AND INNOVATIO Introduction Atmospheric and oceanic conditions over the tropical
Monsoon. Monsoon A Report. N. Jayanthi, M. Rajeevan, A. K. Srivastava, Sunitha Devi, S. K. Roy Bhowmik and H. R. Hatwar
 IMD Met. Monograph No. : Synoptic Meteorology No. 4/2006 DESIGNED & PRINTED AT THE METEOROLOGICAL OFFICE PRESS, OFFICE OF THE ADDITIONAL DIRECTOR GENERAL OF METEOROLOGY (RESEARCH),PUNE GOVERNMENT OF INDIA
Part 1: Weather Forecast Severe Weather Warnings (Source: IMD, Date: 1 st September, 2008)
") Sphere India Unified Response Strategy Situation report (India Floods 2008) 01 st September 2008 Part 1: Weather Forecast Severe Weather Warnings (Source: IMD, Date: 1 st September, 2008) HEAVY RAINFALL
Sphere India Unified Response Strategy Situation report (India Floods 2008) 01 st September 2008 Part 1: Weather Forecast Severe Weather Warnings (Source: IMD, Date: 1 st September, 2008) HEAVY RAINFALL
The Abnormal Indian Summer Monsoon of 2002: JRA25 Reanalysis
 The Abnormal Indian Summer Monsoon of 2002: JRA25 Reanalysis D. Rajan 1,2, T. Koike 2, J. Matsumoto 2 1 NCMRWF, Ministry of Earth Sciences, India 2 CEOP Lab, University of Tokyo, Japan Correspondence:
UPDATE OF REGIONAL WEATHER AND SMOKE HAZE (December 2017)
") UPDATE OF REGIONAL WEATHER AND SMOKE HAZE (December 2017) 1. Review of Regional Weather Conditions for November 2017 1.1 In November 2017, Southeast Asia experienced inter-monsoon conditions in the first
UPDATE OF REGIONAL WEATHER AND SMOKE HAZE (December 2017) 1. Review of Regional Weather Conditions for November 2017 1.1 In November 2017, Southeast Asia experienced inter-monsoon conditions in the first
EVALUATION OF BROAD SCALE VERTICAL CIRCULATION AND THERMAL INDICES IN RELATION TO THE ONSET OF INDIAN SUMMER MONSOON
 INTERNATIONAL JOURNAL OF CLIMATOLOGY Int. J. Climatol. 22: 649 661 (2002) Published online in Wiley InterScience (www.interscience.wiley.com). DOI: 10.1002/joc.742 EVALUATION OF BROAD SCALE VERTICAL CIRCULATION
Seasonal Climate Outlook for South Asia (June to September) Issued in May 2014
 Issued in May 2014") Ministry of Earth Sciences Earth System Science Organization India Meteorological Department WMO Regional Climate Centre (Demonstration Phase) Pune, India Seasonal Climate Outlook for South Asia (June
Ministry of Earth Sciences Earth System Science Organization India Meteorological Department WMO Regional Climate Centre (Demonstration Phase) Pune, India Seasonal Climate Outlook for South Asia (June
UPDATE OF REGIONAL WEATHER AND SMOKE HAZE (February 2018)
") UPDATE OF REGIONAL WEATHER AND SMOKE HAZE (February 2018) 1. Review of Regional Weather Conditions for January 2018 1.1 The prevailing Northeast monsoon conditions over Southeast Asia strengthened in January
UPDATE OF REGIONAL WEATHER AND SMOKE HAZE (February 2018) 1. Review of Regional Weather Conditions for January 2018 1.1 The prevailing Northeast monsoon conditions over Southeast Asia strengthened in January
UPDATE OF REGIONAL WEATHER AND SMOKE HAZE (September 2017)
") UPDATE OF REGIONAL WEATHER AND SMOKE HAZE (September 2017) 1. Review of Regional Weather Conditions in August 2017 1.1 Southwest Monsoon conditions continued to prevail in the region in August 2017. The
UPDATE OF REGIONAL WEATHER AND SMOKE HAZE (September 2017) 1. Review of Regional Weather Conditions in August 2017 1.1 Southwest Monsoon conditions continued to prevail in the region in August 2017. The
Key Finding: Long Term Trend During 2014: Rain in Indian Tradition Measuring Rain
 Chapter 34 RAINFALL Key Finding: Long Term Trend Despite of theories suggesting increase in rainfall in Asian Region due to global warming, no significant trend has been observed at all India level (confirmed
UPDATE OF REGIONAL WEATHER AND SMOKE HAZE (May 2017)
") UPDATE OF REGIONAL WEATHER AND SMOKE HAZE (May 2017) 1. Review of Regional Weather Conditions in April 2017 1.1 Inter monsoon conditions, characterised by afternoon showers and winds that are generally
UPDATE OF REGIONAL WEATHER AND SMOKE HAZE (May 2017) 1. Review of Regional Weather Conditions in April 2017 1.1 Inter monsoon conditions, characterised by afternoon showers and winds that are generally
7 December 2016 Tokyo Climate Center, Japan Meteorological Agency
 Summary of the 2016 Asian Summer Monsoon 7 December 2016 Tokyo Climate Center, Japan Meteorological Agency This report summarizes the characteristics of the surface climate and atmospheric/oceanographic
Rainfall analysis for Indian monsoon region using the merged rain gauge observations and satellite estimates: Evaluation of monsoon rainfall features
 Rainfall analysis for Indian monsoon region using the merged rain gauge observations and satellite estimates: Evaluation of monsoon rainfall features SKRoyBhowmikand Ananda K Das India Meteorological Department,
Thai Meteorological Department, Ministry of Digital Economy and Society
 Thai Meteorological Department, Ministry of Digital Economy and Society Three-month Climate Outlook For November 2017 January 2018 Issued on 31 October 2017 -----------------------------------------------------------------------------------------------------------------------------
TROPICAL CYCLONE TC 03A FOR THE PERIOD 3 RD JUNE TO 10 TH JUNE, 1998
 TROPICAL CYCLONE TC 03A FOR THE PERIOD 3 RD JUNE TO 10 TH JUNE, 1998 Hazrat Mir, Abdul Rashid, Waqarul Wheed Khan. Introduction: This report gives the review of cyclonic storm formed over the East Arabian
International Journal of Integrated Sciences & Technology 2 (2016) 55-61
 55-61") International Journal of Integrated Sciences & Technology 2 (2016) 55-61 Changes in Latent Heat Energy and Moist Static Energy Contents of the Atmosphere over Bangladesh and Neighbourhood during the Formation
International Journal of Integrated Sciences & Technology 2 (2016) 55-61 Changes in Latent Heat Energy and Moist Static Energy Contents of the Atmosphere over Bangladesh and Neighbourhood during the Formation
Verification of the Seasonal Forecast for the 2005/06 Winter
 Verification of the Seasonal Forecast for the 2005/06 Winter Shingo Yamada Tokyo Climate Center Japan Meteorological Agency 2006/11/02 7 th Joint Meeting on EAWM Contents 1. Verification of the Seasonal
Long Range Forecasts of 2015 SW and NE Monsoons and its Verification D. S. Pai Climate Division, IMD, Pune
 Long Range Forecasts of 2015 SW and NE Monsoons and its Verification D. S. Pai Climate Division, IMD, Pune Other Contributors: Soma Sen Roy, O. P. Sreejith, Kailas, Madhuri, Pallavi, Mahendra and Jasmine
Analysis of Heavy Precipitation Events Over Western Himalayan Region
 INTERNATIONAL JOURNAL OF EARTH AND ATMOSPHERIC SCIENCE Journal homepage: www.jakraya.com/journal/ijeas Analysis of Heavy Precipitation Events Over Western Himalayan Region B.P. Yadav, Naresh Kumar and
HYDROMET SERVICES FOR FLOOD FORECASTING. Dr. Surinder Kaur IMD, India, New Delhi
 HYDROMET SERVICES FOR FLOOD FORECASTING Dr. Surinder Kaur IMD, India, New Delhi Real Time Rainfall monitoring Hydromet Services Hyomet design Flood meteorological Services AWS=675 ARG=1289 Surface obs(dept)=
Government of Sultanate of Oman Public Authority of Civil Aviation Directorate General of Meteorology. National Report To
 Government of Sultanate of Oman Public Authority of Civil Aviation Directorate General of Meteorology National Report To Panel on Tropical Cyclones in the Bay of Bengal And Arabian Sea 43rd Session, India
M. Mohapatra and D. R. Pattanaik
 Understanding and forecasting of intra-seasonal extremes of southwest monsoon circulation and precipitation over India M. Mohapatra and D. R. Pattanaik IMD, New Delhi Email : m.mohapatra@imd.gov.in Annual
Chapter 4 Inter-Annual and Long-Term Variability
 Chapter 4 Inter-Annual and Long-Term Variability 4.1 General Rainfa\\ is the most imllortant weather element for India, a trollica\ country. Agriculture, hydro-electric power, industry and the economy
1. Introduction. 2. Verification of the 2010 forecasts. Research Brief 2011/ February 2011
 Research Brief 2011/01 Verification of Forecasts of Tropical Cyclone Activity over the Western North Pacific and Number of Tropical Cyclones Making Landfall in South China and the Korea and Japan region
ALL INDIA INSTALLED CAPACITY (IN MW) OF POWER STATIONS
 OF POWER STATIONS") Region Northern Region Western Region Southern Region Eastern Region North Eastern Region Islands ALL INDIA Figures at decimal may not tally due to rounding off ALL INDIA INSTALLED CAPACITY (IN MW) OF
Region Northern Region Western Region Southern Region Eastern Region North Eastern Region Islands ALL INDIA Figures at decimal may not tally due to rounding off ALL INDIA INSTALLED CAPACITY (IN MW) OF
Evidence for Weakening of Indian Summer Monsoon and SA CORDEX Results from RegCM
 Evidence for Weakening of Indian Summer Monsoon and SA CORDEX Results from RegCM S K Dash Centre for Atmospheric Sciences Indian Institute of Technology Delhi Based on a paper entitled Projected Seasonal
ALL INDIA INSTALLED CAPACITY (IN MW) OF POWER STATIONS
 OF POWER STATIONS") Region Northern Region Western Region Southern Region Eastern Region North Eastern Region Islands ALL INDIA Figures at decimal may not tally due to rounding off ALL INDIA INSTALLED CAPACITY (IN MW) OF
Region Northern Region Western Region Southern Region Eastern Region North Eastern Region Islands ALL INDIA Figures at decimal may not tally due to rounding off ALL INDIA INSTALLED CAPACITY (IN MW) OF
MAURITIUS METEOROLOGICAL SERVICES
 MAURITIUS METEOROLOGICAL SERVICES CLIMATE NOVEMBER 2018 Introduction Climatologically speaking, November is a relatively dry month for Mauritius with a long term monthly mean rainfall of 78 mm. However,
ALL INDIA INSTALLED CAPACITY (IN MW) OF POWER STATIONS
 OF POWER STATIONS") Region Northern Region Western Region Southern Region Eastern Region North Eastern Region Islands ALL INDIA Figures at decimal may not tally due to rounding off ALL INDIA INSTALLED CAPACITY (IN MW) OF
Region Northern Region Western Region Southern Region Eastern Region North Eastern Region Islands ALL INDIA Figures at decimal may not tally due to rounding off ALL INDIA INSTALLED CAPACITY (IN MW) OF
AFP Surveillance Bulletin - India Report for week 1, ending 5 January 2019
 Jan-18 Feb-18 Mar-18 Apr-18 May-18 Jun-18 Jul-18 Aug-18 Sep-18 Oct-18 Nov-18 Dec-18 Jan-19 Table 1: cases by month of paralysis onset, last 13 months State/UT's Total cases in cases as on week 1, cases
MAURITIUS METEOROLOGICAL SERVICES
 MAURITIUS METEOROLOGICAL SERVICES CLIMATE DECEMBER 2018 Introduction December 2018 was warm and wet. The mean monthly rainfall recorded islandwise was 261 mm which is 151 % of the normal. ENSO conditions
Date of. Issued by (AICRPAM), & Earth System
, & Earth System") National Agromet Advisory Service Bulletin Based on Extended Range Weather Forecast (ERFS) Validity: 29 September 12 October 2017 Date of Issue: 29 September 2017 Issued by Indian Council of Agricultural
National Agromet Advisory Service Bulletin Based on Extended Range Weather Forecast (ERFS) Validity: 29 September 12 October 2017 Date of Issue: 29 September 2017 Issued by Indian Council of Agricultural
N. K. Manglik Director
 N. K. Manglik Director Hydro-meteorological observations could be broadly defined as the scientific way for collection of flow data at a specific location along the river including selected meteorological
Warm Episode over Indian Sub-continent March 2010 By Richard Grumm National Weather Service State College Contributions by Lance Bosart SUNY Albany
 Warm Episode over Indian Sub-continent March 2010 By Richard Grumm National Weather Service State College Contributions by Lance Bosart SUNY Albany 1. INTRODUCTION A massive subtropical ridge formed over
MAURITIUS METEOROLOGICAL SERVICES
 MAURITIUS METEOROLOGICAL SERVICES CLIMATE DECEMBER 2018 Introduction December 2018 was warm and wet. The mean monthly rainfall recorded islandwise was 261 mm which is 151 % of the normal. ENSO conditions
Department of Atmospheric Sciences, National Taiwan University, Taipei, Taiwan
 10A.4 TROPICAL CYCLONE FORMATIONS IN THE SOUTH CHINA SEA CHENG-SHANG LEE 1 AND YUNG-LAN LIN* 1, 2 1 Department of Atmospheric Sciences, National Taiwan University, Taipei, Taiwan 2 Taipei Aeronautic Meteorological
Chapter 24 Tropical Cyclones
 Chapter 24 Tropical Cyclones Tropical Weather Systems Tropical disturbance a cluster of thunderstorms about 250 to 600 km in diameter, originating in the tropics or sub-tropics Tropical depression a cluster
1. INTRODUCTION: 2. DATA AND METHODOLOGY:
 27th Conference on Hurricanes and Tropical Meteorology, 24-28 April 2006, Monterey, CA 3A.4 SUPERTYPHOON DALE (1996): A REMARKABLE STORM FROM BIRTH THROUGH EXTRATROPICAL TRANSITION TO EXPLOSIVE REINTENSIFICATION
Charles Jones ICESS University of California, Santa Barbara CA Outline
 The Influence of Tropical Variations on Wintertime Precipitation in California: Pineapple express, Extreme rainfall Events and Long-range Statistical Forecasts Charles Jones ICESS University of California,
By: J Malherbe, R Kuschke
 2015-10-27 By: J Malherbe, R Kuschke Contents Summary...2 Overview of expected conditions over South Africa during the next few days...3 Significant weather events (27 October 2 November)...3 Conditions
Best track data of tropical cyclonic disturbances. over the north Indian Ocean. Regional Specialised Meteorological Centre (RSMC) -
 -") Best track data of tropical cyclonic disturbances over the north Indian Ocean Regional Specialised Meteorological Centre (RSMC) - Tropical Cyclones, New Delhi Cyclone Warning Division, India Meteorological
Best track data of tropical cyclonic disturbances over the north Indian Ocean Regional Specialised Meteorological Centre (RSMC) - Tropical Cyclones, New Delhi Cyclone Warning Division, India Meteorological
Early May Cut-off low and Mid-Atlantic rains
 Abstract: Early May Cut-off low and Mid-Atlantic rains By Richard H. Grumm National Weather Service State College, PA A deep 500 hpa cutoff developed in the southern Plains on 3 May 2013. It produced a
5 Atmospheric Disturbances 7 1.Cyclones- tropical and temperate and associated weather conditions. 2.Anticyclones and associated weather conditions.
 5 Atmospheric Disturbances 7 1.Cyclones- tropical and temperate and associated weather conditions. 2.Anticyclones and associated weather conditions. atmospheric disturbances (weather systems) that are
Weather Related Factors of the Adelaide floods ; 7 th to 8 th November 2005
 Weather Related Factors of the Adelaide floods ; th to th November 2005 Extended Abstract Andrew Watson Regional Director Bureau of Meteorology, South Australian Region 1. Antecedent Weather 1.1 Rainfall
ALL INDIA INSTALLED CAPACITY (IN MW) OF POWER STATIONS
 OF POWER STATIONS") Region Northern Region Western Region Southern Region Eastern Region North Eastern Region Islands ALL INDIA Figures at decimal may not tally due to rounding off ALL INDIA INSTALLED CAPACITY (IN MW) OF
Region Northern Region Western Region Southern Region Eastern Region North Eastern Region Islands ALL INDIA Figures at decimal may not tally due to rounding off ALL INDIA INSTALLED CAPACITY (IN MW) OF
Department of Meteorology and Oceanography Andhra University, Visakhapatnam
 Numerical Prediction of The Heavy Rainfall Events During Armex phase- I of The Summer Monsoon, 2002 D.V. Bhaskar Rao, D. Hari Prasad and Satyaban B. Ratna Department of Meteorology and Oceanography Andhra
IMPACT OF KALPANA-1 CLOUD MOTION VECTORS IN THE NUMERICAL WEATHER PREDICTION OF INDIAN SUMMER MONSOON
 IMPACT OF KALPANA-1 CLOUD MOTION VECTORS IN THE NUMERICAL WEATHER PREDICTION OF INDIAN SUMMER MONSOON S.K.Roy Bhowmik, D. Joardar, Rajeshwar Rao, Y.V. Rama Rao, S. Sen Roy, H.R. Hatwar and Sant Prasad
Water Resource & Management Strategies
 Water Resource & Management Strategies National Conference on Integrated Water Resource Management for enhancing Farmers' Income March 22, 2017, Hotel Park, New Delhi Nalin Rawal Chief Business head Agribusiness
Unseasonable weather conditions in Japan in August 2014
 Unseasonable weather conditions in Japan in August 2014 Summary of analysis by the TCC Advisory Panel on Extreme Climatic Events In an extraordinary session held at the Japan Meteorological Agency on 3
Geographical location and climatic condition of the
 Geographical location and climatic condition of the study sites North eastern region of India is comprised of eight states namely; Arunachal Pradesh, Assam, Manipur, Meghalaya, Mizoram, Nagaland, Sikkim
OUR COUNTRY INDIA LOCATIONAL SETTING
 7 India is a country of vast geographical expanse. In the north, it is bound by the lofty Himalayas. The Arabian Sea in the west, the Bay of Bengal in the east and the Indian Ocean in the south, wash the
Analysis of Fall Transition Season (Sept-Early Dec) Why has the weather been so violent?
 Why has the weather been so violent?") WEATHER TOPICS Analysis of Fall Transition Season (Sept-Early Dec) 2009 Why has the weather been so violent? As can be seen by the following forecast map, the Fall Transition and early Winter Season of
WEATHER TOPICS Analysis of Fall Transition Season (Sept-Early Dec) 2009 Why has the weather been so violent? As can be seen by the following forecast map, the Fall Transition and early Winter Season of
Chapter 24. Tropical Cyclones. Tropical Cyclone Classification 4/19/17
 Chapter 24 Tropical Cyclones Tropical Cyclones Most destructive storms on the planet Originate over tropical waters, but their paths often take them over land and into midlatitudes Names Hurricane (Atlantic
Catastrophic heavy rainfall episode over Uttarakhand during June 2013 observational aspects
 Catastrophic heavy rainfall episode over Uttarakhand during 16 18 June 2013 observational aspects S. D. Kotal*, Soma Sen Roy and S. K. Roy Bhowmik India Meteorological Department, Lodhi Road, New Delhi
(April 7, 2010, Wednesday) Tropical Storms & Hurricanes Part 2
 Tropical Storms & Hurricanes Part 2") Lecture #17 (April 7, 2010, Wednesday) Tropical Storms & Hurricanes Part 2 Hurricane Katrina August 2005 All tropical cyclone tracks (1945-2006). Hurricane Formation While moving westward, tropical disturbances
Lecture #17 (April 7, 2010, Wednesday) Tropical Storms & Hurricanes Part 2 Hurricane Katrina August 2005 All tropical cyclone tracks (1945-2006). Hurricane Formation While moving westward, tropical disturbances
MAURITIUS METEOROLOGICAL SERVICES
 MAURITIUS METEOROLOGICAL SERVICES CLIMATE FEBRUARY 2019 Introduction February 2019 was in mostly warm and dry. ENSO conditions and the Indian Ocean Dipole were neutral. However, the Inter Tropical Convergence
CASE STUDY: Tropical Cyclone Monica, April 2006
 CASE STUDY: Tropical Cyclone Monica, April 2006 By Mr Jeff Callaghan Retired Senior Severe Weather Forecaster, Bureau of Meteorology, Brisbane The track of tropical cyclone Monica (Figure 1) took it from
4/29/2011. Mid-latitude cyclones form along a
 Chapter 10: Cyclones: East of the Rocky Mountain Extratropical Cyclones Environment prior to the development of the Cyclone Initial Development of the Extratropical Cyclone Early Weather Along the Fronts
Satellites, Weather and Climate Module??: Polar Vortex
 Satellites, Weather and Climate Module??: Polar Vortex SWAC Jan 2014 AKA Circumpolar Vortex Science or Hype? Will there be one this year? Today s objectives Pre and Post exams What is the Polar Vortex
Issued by the: Climate Services Division Fiji Meteorological Service Nadi Airport. 27 October 2010 GENERAL STATEMENT
 Fiji Meteorological Service (FMS) Tropical Cyclone Guidance for Season 2010/11 for the Fiji and the Southwest Pacific RSMC Region 160E to 120W Equator to 25 South Issued by the: Climate Services Division
UPDATE OF REGIONAL WEATHER AND SMOKE HAZE November 2016
 UPDATE OF REGIONAL WEATHER AND SMOKE HAZE November 2016 1. Review of Regional Weather Conditions in November 2016 1.1 Southwest Monsoon conditions prevailed on most days in October 2016 and the winds were
UPDATE OF REGIONAL WEATHER AND SMOKE HAZE December 2016
 UPDATE OF REGIONAL WEATHER AND SMOKE HAZE December 2016 1. Review of Regional Weather Conditions in November 2016 1.1 Inter monsoon conditions prevailed in the first half of November 2016. During this
Introduction to Meteorology & Climate. Climate & Earth System Science. Atmosphere Ocean Interactions. A: Structure of the Ocean.
 Climate & Earth System Science Introduction to Meteorology & Climate MAPH 10050 Peter Lynch Peter Lynch Meteorology & Climate Centre School of Mathematical Sciences University College Dublin Meteorology
ESCI 241 Meteorology Lesson 19 Tropical Cyclones Dr. DeCaria
 ESCI 241 Meteorology Lesson 19 Tropical Cyclones Dr. DeCaria READING: Chapter 16 GENERAL A tropical cyclone is a large, low-pressure system that forms over the tropical oceans. Tropical cyclones are classified
ovember 2008 Antigua and Barbuda Meteorological Service
 ovember 2008 Antigua and Barbuda Meteorological Service The Atlantic Hurricane Season Summary 2008 Special Focus on Antigua and Barbuda The Season in Brief Sixteen (16) named storms formed in the Atlantic
W.H. Leung, W.M. Ma and H.K. Yeung Hong Kong Observatory, Hong Kong, China
 322 THE APPLICATION OF LIGHTNING DENSITY MAP IN THE ANALYSIS OF A SEVERE RAINSTORM CASE IN HONG KONG W.H. Leung, W.M. Ma and H.K. Yeung Hong Kong Observatory, Hong Kong, China 1. INTRODUCTION On 22 July
The Planetary Circulation System
 12 The Planetary Circulation System Learning Goals After studying this chapter, students should be able to: 1. describe and account for the global patterns of pressure, wind patterns and ocean currents
Introduction of climate monitoring and analysis products for one-month forecast
 Introduction of climate monitoring and analysis products for one-month forecast TCC Training Seminar on One-month Forecast on 13 November 2018 10:30 11:00 1 Typical flow of making one-month forecast Observed
Relationship between Iran Surface Pressure and India Summer Monsoon
 VayuMandal 44(1), 2018 Relationship between Iran Surface Pressure and India Summer Monsoon Ramesh Kumar Yadav Indian Institute of Tropical Meteorology, Pashan, Pune-411008 E-mail: yadav@tropmet.res.in
Features of the wind fields associated with Typhoon 0418 (Songda) compared with those of Typhoon 9119 (Mireille)
 compared with those of Typhoon 9119 (Mireille)") Features of the wind fields associated with Typhoon 0418 (Songda) compared with those of Typhoon 9119 (Mireille) by Fumiaki Fujibe 1, Naoko Kitabatake 2, Kotaro Bessho 2 and Shunsuke Hoshino 3 ABSTRACT
Features of the wind fields associated with Typhoon 0418 (Songda) compared with those of Typhoon 9119 (Mireille) by Fumiaki Fujibe 1, Naoko Kitabatake 2, Kotaro Bessho 2 and Shunsuke Hoshino 3 ABSTRACT
Percentage of normal rainfall for August 2017 Departure from average air temperature for August 2017
 New Zealand Climate Update No 219, August 2017 Current climate August 2017 Overall, mean sea level pressure was lower than normal over and to the west of New Zealand during August while higher than normal
NOTES AND CORRESPONDENCE. A Pronounced Continental-Scale Diurnal Mode of the Asian Summer Monsoon
 462 MONTHLY WEATHER REVIEW VOLUME 128 NOTES AND CORRESPONDENCE A Pronounced Continental-Scale Diurnal Mode of the Asian Summer Monsoon T. N. KRISHNAMURTI AND C. M. KISHTAWAL Department of Meteorology,
Summary and Conclusions
 241 Chapter 10 Summary and Conclusions Kerala is situated in the southern tip of India between 8 15 N and 12 50 N latitude and 74 50 E and 77 30 E longitude. It is popularly known as Gods own country.
CHAPTER 4 CIRCULATION OF PUBLICATIONS
 Circulation of Publications 49 CHAPTER 4 CIRCULATION OF PUBLICATIONS 4.1. A total number of 29,599 publications furnished their circulation figures online for 2016-17 claiming a total circulation of 48,80,89,490
CPTEC and NCEP Model Forecast Drift and South America during the Southern Hemisphere Summer
 CPTEC and NCEP Model Forecast Drift and South America during the Southern Hemisphere Summer José Antonio Aravéquia 1 Pedro L. Silva Dias 2 (1) Center for Weather Forecasting and Climate Research National
Interannual Fluctuations of the Tropical Easterly Jet and the Summer Monsoon in the Asian Region. By Minoru Tanaka
 June 1982 M. Tanaka 865 Interannual Fluctuations of the Tropical Easterly Jet and the Summer Monsoon in the Asian Region By Minoru Tanaka Institute of Geoscience, University of Tsukuba, Niihari-gun, Ibaraki
Changes in Southern Hemisphere rainfall, circulation and weather systems
 19th International Congress on Modelling and Simulation, Perth, Australia, 12 16 December 2011 http://mssanz.org.au/modsim2011 Changes in Southern Hemisphere rainfall, circulation and weather systems Frederiksen,
CHAPTER 12 TROPICAL WEATHER SYSTEMS MULTIPLE CHOICE QUESTIONS
 CHAPTER 12 TROPICAL WEATHER SYSTEMS MULTIPLE CHOICE QUESTIONS 1. A hurricane differs from an extra-tropical cyclone in that a hurricane a. has no fronts. b. develops within a uniform warm and humid air
The feature of atmospheric circulation in the extremely warm winter 2006/2007
 The feature of atmospheric circulation in the extremely warm winter 2006/2007 Hiroshi Hasegawa 1, Yayoi Harada 1, Hiroshi Nakamigawa 1, Atsushi Goto 1 1 Climate Prediction Division, Japan Meteorological
UPDATE OF REGIONAL WEATHER AND SMOKE HAZE FOR MAY 2015
 UPDATE OF REGIONAL WEATHER AND SMOKE HAZE FOR MAY 2015 1. Review of Regional Weather Conditions in April 2015 1.1 Inter-Monsoon conditions prevailed over the ASEAN region in April 2015. The gradual northward
CHAPTER 8 NUMERICAL SIMULATIONS OF THE ITCZ OVER THE INDIAN OCEAN AND INDONESIA DURING A NORMAL YEAR AND DURING AN ENSO YEAR
 CHAPTER 8 NUMERICAL SIMULATIONS OF THE ITCZ OVER THE INDIAN OCEAN AND INDONESIA DURING A NORMAL YEAR AND DURING AN ENSO YEAR In this chapter, comparisons between the model-produced and analyzed streamlines,
PART III. Heavy Rains
 PART III Heavy Rains Observational Analysis of Heavy Rainfall during Southwest Monsoon over India Pulak Guhathakurta India Meteorological Department, Pune 411005, India pguhathakurta@rediffmail.com 1.
Seasonal forecast of southwest monsoon rainfall District level
 J. Ind. Geophys. Union ( April 2010 ) Vol.14, No.2, pp.93-113 Seasonal forecast of southwest monsoon rainfall District level Onkari Prasad, O.P.Singh 1 and S.K.Subramanian 2 43 Ritu Apartments, A-4 Paschim
Advanced Hydrology. (Web course)
") Advanced Hydrology (Web course) Subhankar Karmakar Assistant Professor Centre for Environmental Science and Engineering (CESE) Indian Institute of Technology Bombay Powai, Mumbai 400 076 Email: skarmakar@iitb.ac.in
Advanced Hydrology (Web course) Subhankar Karmakar Assistant Professor Centre for Environmental Science and Engineering (CESE) Indian Institute of Technology Bombay Powai, Mumbai 400 076 Email: skarmakar@iitb.ac.in
MPACT OF EL-NINO ON SUMMER MONSOON RAINFALL OF PAKISTAN
 MPACT OF EL-NINO ON SUMMER MONSOON RAINFALL OF PAKISTAN Abdul Rashid 1 Abstract: El-Nino is the dominant mod of inter- annual climate variability on a planetary scale. Its impact is associated worldwide
Characteristics of Sudden Changes in Tropical Cyclone Tracks over North Indian Ocean. M. Mohapatra and B. K. Bandyopadhyay
 Characteristics of Sudden Changes in Tropical Cyclone Tracks over North Indian Ocean M. Mohapatra and B. K. Bandyopadhyay INDIA METEOROLOGICAL DEPARTMENT MAUSAM BHAVAN, LODI ROAD, NEW DELHI 110003 mohapatraimd@gmail.com