Monsoon. Monsoon. Edited by Ajit Tyagi and D. S. Pai OFFICE OF THE ADDITIONAL DIRECTOR GENERAL OF METEOROLOGY (RESEARCH),PUNE
|
|
|
- Meryl Hill
- 5 years ago
- Views:
Transcription


1 GOVERNMENT OF INDIA MINISTRY OF EARTH SCIENCES INDIA METEOROLOGICAL DEPARTMENT IMD Met. Monograph No. : Synoptic Meteorology No. 01 /2011 Monsoon 2011 A Report Edited by Ajit Tyagi and D. S. Pai LOGICAL RO DE EO E TI NA O EN T RT M PA DESIGNED & PRINTED AT CENTRAL PRINTING UNIT, OFFICE OF THE ADDITIONAL DIRECTOR GENERAL OF METEOROLOGY (RESEARCH),PUNE 2011 TR A Report IN DIA M ET Monsoon NA E L C L A TE C IM N NATIONAL CLIMATE CENTRE NATIONAL CLIMATE CENTRE OFFICE OF THE ADDITIONAL DIRECTOR GENERAL OF METEOROLOGY (RESEARCH),PUNE


2 IMD Met Monograph: Synoptic Meteorology No. 01/2012 Government of India India Meteorological Department 2011 Edited by Ajit Tyagi and D. S. Pai National Climate Centre India Meteorological Department PUNE INDIA
3 Copyright India Meteorological Department, 2012 The right of publication in print, electronic or any other form reserved by the India Meteorological Department. Short extracts may be reproduced, however the source should be clearly indicated. DISCLAIMER & LIMITATIONS The contents published in this report have been checked and authenticity assured within limitations of human errors. India Meteorological Department is not responsible for any errors and omissions. The geographical boundaries shown in this report do not necessarily correspond to the political boundaries.
4 2011 List of Authors Ajit Tyagi Director General of Meteorology, India Meteorological Department, New Delhi A. B. Mazumdar Additional Director General of Meteorology (Research) India Meteorological Department, Pune O. P. Singh Deputy Director General of Meteorology, Regional Meteorological Centre, India Meteorological Department, New Delhi Ananda Kumar Das, V. R. Durai, Office of the M. Mohopatra, Naresh Kumar, Director General of Meteorology, New Delhi D. R. Pattanaik, S. K. Roy Bhowmik, C. S. Tomar and B. P. Yadav D. S. Pai, O. P. Sreejith and Office of the A.K. Srivastava Additional Director General of Meteorology (Research) India Meteorological Department, Pune Medha Khole and Sunitha Devi S. Office of the Deputy Director General of Meteorology (Weather Forecasting) India Meteorological Department, Pune Manish Ranalkar Office of the. Deputy Director General of Meteorology (Surface Instruments) India Meteorological Department, Pune
5 Monsoon 2011 A Report 2011 Contents Acknowledgements Preface Executive Summary Chapter- 1 Chapter- 2 Chapter- 3 Chapter- 4 Chapter- 5 Chapter- 6 Chapter- 7 Chapter- 8 Chapter- 9 Chapter- 10 Chapter- 11 Onset, Advance and Withdrawal of Southwest Monsoon Semi Permanent Systems and Synoptic Features Rainfall Statistics Global and Regional Circulation Anomalies Performance of Operational NWP Short Range Forecasts- Southwest Monsoon 2011 Performance of Global Forecast System of IMD in the Medium Range Time Scale During Summer Monsoon 2011 Performance of Extended Range Forecast during Southwest Monsoon 2011 Verification of the operational and experimental Long Range Forecasts Features of Southwest Monsoon as observed in Satellite Products Utility of Automatic Weather Station (AWS) data for monitoring And prediction of Cyclonic Disturbances during 2011 Summary and Conclusions
6 ACKNOWLEDGEMENTS The editorial team expresses sincere thanks to all the authors and co-authors of various chapters of this report for their whole hearted support in completing this report in time and details. The report was prepared in the Office of the ADGM(R), IMD, Pune. The officers and staff of the Long Range Forecasting Section and National Climate Center provided the technical assistance. We are particularly thankful to Shri. S. M. Jamadar, Smt. Madhuri Musale, Smt. Latha Sridhar, Shri. Bhushan Patkar and Shri. C.N. Shaligram for their technical support. We are also thankful to Shri. A.K. Jaswal, Shri. Yogesh Visale and other officers & staff members of the Printing and Documentation Section for designing, type setting and printing of the report. Our sincere thanks are also due to the officers and staff of DGM (Hydromet) for providing the station rainfall data extensively used in this report.
7 PREFACE Since 2005, India Meteorological Department (IMD) has been bringing out monsoon monographs every year to document various challenging aspects of each monsoon for quick reference to both operational and research communities. The present report on 2011 southwest monsoon season, which is seventh in the series of monographs has been divided into different chapters each of which discusses specific aspects like progress and withdrawal of monsoon, synoptic systems over the Indian region, large scale regional and global thermal, circulation and convective features observed during the season, rainfall statistics, forecasts at various scales and its verification etc. The report also includes chapters on the utility of the satellite and automatic weather station data in monitoring and prediction of monsoon. As in the previous year, the 2011 southwest monsoon season was a normal monsoon year and its rainfall activity was strongly influenced by the moderate La Niña event that reemerged during the later part of the monsoon season. The rainfall activity over the country was also influenced by the weak positive Indian Ocean Dipole that formed in the later part of the season and strong activities of Madden Julian Oscillations in the equatorial Indian Ocean. The monsoon season (June-September) rainfall over the country as a whole for 2011 was 102% of its long period average (LPA). While the season rainfall over three regions (northwest India, central India and south Peninsula) was normal, it was deficient over northeast India. For the season as a whole, out of 36 meteorological subdivisions, the 7 received excess rainfall, 26 received normal rainfall and remaining 3 subdivisions received deficient rainfall. The season was also characterized by significant intra seasonal variability and witnessed many anomalous rainfall and circulation features. The monthly rainfall over the country as a whole during June, July, August and September was 112%, 85%, 109% and 108% respectively. Though the monsoon advance over Andaman Sea was delayed by about 10 days, it set in over Kerala on 29th May, three days before its normal date of 1st June and covered the entire country by 9th July, 6 days earlier than its normal date of 15th July. However, as in the previous 4 years, the withdrawal of southwest monsoon from west Rajasthan was delayed by nearly 3 weeks. I sincerely appreciate all the authors and co-authors of the various chapters of the report for their valuable contribution. I also appreciate the efforts made by officers/ staff of the National Climate Center, Pune in bringing out this met. monograph. Ajit Tyagi Director General of Meteorology India Meteorological Department
8 Executive Summary 1 Document title Monsoon 2011 Report 2 Document type Meteorological Monograph 3 Issue No. Synoptic Meteorology No.01/ Issue date Security Classification Unclassified 6 Control Status Unclassified 7 Document type Scientific Report 8 No. of Pages No. of Figures No. of reference Distribution Unrestricted 12 Language English 13 Editors Ajit Tyagi and D. S. Pai Originating Division/Group Reviewing and Approving Authority 16 End users 17 Abstract 18 Key Words National Climate Centre, Office of ADGM (R), India Meteorological Department, Pune Director General of Meteorology, India Meteorological Department, New Delhi Operational Forecasters, Modelers and Researchers, Government Officials etc. Like previous year, the 2011 southwest monsoon was a normal with season rainfall of 102% of long period average (LPA) over the county as a whole. Even though the advance of monsoon over Andaman Sea was delayed by about 10 days, monsoon set over Kerala close to its normal date and covered the entire country nearly one week before the normal date.4 depressions were formed during the season. The reemergence of moderate La Nina and weak positive Indian Ocean Dipole during later part of the monsoon season helped increased rainfall activity during the second half of the season. Monthly rainfall except in July was above its LPA. Region wise, rainfall over northeast India was below normal and that over northwest India, central India, and south Peninsula was normal. The first 4 chapters of this report discuss different observed regional and global climate features associated with the 2011 SW monsoon. Chapters 5 to 8 discuss verification of forecasts at different temporal and spatial scales issued for the monsoon season. Chapters 9 & 10 discuss the utility of the satellite & AWS data in monsoon monitoring. The summary and conclusions of the report are given in the Chapter 11. Southwest Monsoon, La Niña, Multi-model Ensemble, Forecast Verification, Rainfall, Satellite Imageries.
9 1 ONSET, ADVANCE AND WITHDRAWAL OF SOUTHWEST MONSOON Medha Khole, B.P. Yadav, Sunitha Devi. S. and A. B. Mazumdar This chapter discusses various meteorological aspects of onset, advance and withdrawal of southwest monsoon Arrival of southwest monsoon current over the Andaman Sea The arrival of southwest monsoon current over the south Bay of Bengal and south Andaman Sea occurred on 29 th May. It was delayed by about 10 days with respect to the normal date, due to non-conducive conditions for the development of convection over the region. The Monsoon Onset over Kerala occurred simultaneously with the arrival of monsoon current over Andaman and Nicobar Islands. The evolution of convection in accordance with the eastward phase propagation of the Madden-Julian Oscillation (MJO) during the month of May is depicted in Fig.1.1. It is observed from Fig. 1.1 that the convectively active phase prevailed over the Bay of Bengal during the beginning of May 2011, contributing to persistent heavy rainfall over the Andaman & Nicobar Islands. Thereafter, the convection over the Andaman and Nicobar Islands remained suppressed till the end of the month of May. 1


.")
10 Fig. 1.1: Outgoing Long Wave Radiation Anomalies during May Onset over the main land The lower level cross-equatorial flow over Arabian Sea and Andaman Sea was weaker than normal on 20 th May, the normal date of arrival of South West monsoon current over Andaman Sea (Figs. 1.2 and 1.3). It continued to be weaker than normal till 28 th May (Figures not shown). (a) 925 hpa (b) 850 hpa Fig. 1.2: Vector Wind Anomaly on 20 th May


11 (a) 925 hpa (b) 850 hpa Fig. 1.3: Zonal Wind Anomaly on 20 th May 2011 The cross equatorial flow over the Arabian Sea, as evidenced from the speed and depth of the southwesterlies showed a rapid strengthening from 28 th May, when the average wind speed at 925 hpa over the area bounded by Latitudes 5-10 N and Longitudes E became 20 knots and the winds became westerlies up to 600 hpa. The Kalpana-1 derived mean Outgoing Longwave Radiation [OLR] values over the region confined by Latitudes 5-10 N and Longitudes E remained below 200 W/m 2 on 28 th and 29 th May. In association with these developments, the rainfall activity over Kerala increased. Widespread rainfall activity occurred and 84% and 79% of the rainfall monitoring stations reported more than 2.5 mm rainfall respectively on 28 th and 29 th May. Thus, there has been a sharp rise, both in terms of spatial distribution as well as the quantum of rainfall reported by the stations spread over Kerala, Lakshadweep and south coastal Karnataka on 28 th and 29 th May. The scientific basis for declaring the onset on this particular date is based on a set of objective criteria being followed by the India Meteorological Department since Rainfall: If after 10 th May, 60% of the available 14 stations (Minicoy, Amini, Thiruvananthapuram, Punalur, Kollam, Allapuzha, Kottayam, Kochi, Trissur, Kozhikode, Talassery, Cannur, Kasargode and Mangalore) report rainfall of 2.5 mm or more for two consecutive days, the onset over Kerala be declared on the 2 nd day, provided the following criteria are also in concurrence. Wind Field: Depth of westerlies should be maintained up to 600 hpa, in the box equator to Lat N and Long.55 0 E to 80 0 E. The zonal wind speed over the area bounded by Lat N, Long E should be of the order of Kts. at 925 hpa. The source of data can be RSMC wind analysis/satellite derived winds. OLR: INSAT derived OLR value should be below 200 Wm -2 in the box confined by Lat N and Long E. 3
12 Table: 1.1 shows the rainfall reported by these stations from 22 nd May The sharp increase in the intensity as well as spatial distribution of rainfall on 28 th and 29 th May is relevant. Table - 1.1: Rainfall reported at selected stations in millimeters. Station May Minicoy Amini Divi Light 30.9 Thiruvananthapuram Punalur Kollam Allapuzha Kottayam Kochi Trissur Kozhikode Talassery Kannur Kazargode (Kudulu) Mangalore % Stations reporting rainfall Fig. 1.4 depicts the percentage of stations recording 2.5 mm or more out of the 14 stations mentioned above since 10 th May Fig. 1.4: Percentage rainfall of 14 selected stations. 4
 Zonal wind at 925 hpa on 29 th May. Fig.1.5: (b) Zonal wind at 850 hpa on 29 th May. Fig. 1.")

 depict the mean OLR values during 10 th - 29 th May and the OLR contours derived at 00 UTC of each day based on the")
13 Fig. 1.5 (a) and Fig. 1.5 (b) depict the zonal wind speed at 925 hpa and 850 hpa on 29 th May and Fig.1.6 depicts the SSMI/TMI derived surface wind speed over the oceanic area on 29 th May. Fig.1.5: (a) Zonal wind at 925 hpa on 29 th May. Fig.1.5: (b) Zonal wind at 850 hpa on 29 th May. Fig. 1.6: SSMI/TMI derived surface wind speed over the ocean on 29 th May Fig.1.7 (a) and Fig.1.7 (b) depict the mean OLR values during 10 th - 29 th May and the OLR contours derived at 00 UTC of each day based on the past 24 hrs mean value on 28 th 30 th May 2011, respectively. The KALPANA derived OLR value in the box confined by Lat o N, Long o E is 187 W/m 2 and 173 W/m 2, respectively, on 28 th May and 29 th May. 5
 Mean OLR values over the specified area during 10 th 29 th May")


14 Fig.1.7: (a) Mean OLR values over the specified area during 10 th 29 th May Fig.1.7: (b) Satellite derived mean OLR contours during 28 th 30 th May. Table - 1.2: Wind and OLR analysis of monsoon onset criteria. May, Winds Wind (925 hpa) West-Southwesterly Knots Westerly 5-10 Knots Westerly Knots West-Northwesterly Knots Depth (hpa) Satellite information OLR (Wm -2 )
15 West-Northwesterly 10 Knots Westerly 15 Knots West-Southwesterly 20 Knots West-Southwesterly 20 Knots It is observed from Table 1.2 that, the criteria pertaining to wind speed at 925 hpa over the box bounded by Latitudes N and Longitudes E as well as the OLR criteria are satisfied on 29 th May Based on the above facts, the southwest monsoon set in over most parts of South Arabian Sea, Kerala, some parts of Tamil Nadu, south Bay of Bengal and South Andaman Sea on 29 th May Though the arrival of monsoon was delayed by about 10 days over the Andaman Sea, it was early by 3 days over Kerala. The onset of monsoon over Andaman Sea and over Kerala has been simultaneous in this year. 1.3 Advance phase The details of advance of monsoon over the country are given chronologically in Table 1.3 and Fig Table - 1.3: Dates of advance of southwest Monsoon S. No. Date Southwest monsoon advanced over Northern Limit of Monsoon Passed through 1 29 th May Southwest monsoon set in over most Lat. 11 N/Long. 60 E, parts of south Arabian sea and Kerala Lat. 11 N/Long. 70 E, Amini and some parts of Tamil Nadu, south Bay of Bengal and south Andaman sea Divi, Kozhikode, Kodaikanal, Lat. 8 N/Long. 80 E, Lat. 8 N/Long. 90 E, Nancowry, and Lat. 9 N/Long. 99 E th May Some more parts of south Bay of Bengal, some parts of east central Bay of Bengal and remaining parts of Andaman sea Lat. 11 N/Long. 60 E, Lat. 11 N/Long. 70 E, Amini Divi, Kozhikode, Kodaikanal, Lat. 8 N/Long. 80 E, Lat. 11 N/Long. 86 E, Lat. 13 N/Long. 89 E and 3. 2 nd June Remaining parts of south Arabian sea, Kerala, south Bay of Bengal, some parts of central Arabian sea, south Interior Karnataka, most parts of coastal Lat. 17 N/Long. 95 E. Lat.14 N/Long 60 E, Lat.14 N/Long.70 E, Udupi, Arogyavaram, Chennai, 7
16 Karnataka and Tamil Nadu and some more parts of central Bay of Bengal rd June some more parts of central Arabian sea, remaining parts of coastal Karnataka and Tamil Nadu, most parts of south Interior Karnataka, entire Goa, some parts of south Konkan and north Interior Karnataka, some parts of Rayalaseema and south coastal Andhra Pradesh, some more parts of central Bay of Bengal and some parts of northeast Bay of Bengal th June Some more parts of central Arabian sea and Konkan, some parts of Madhya Maharashtra (including Pune) and some more parts of Interior Karnataka 6. 5 th June Remaining parts of central Arabian Sea, Konkan & Goa (including Mumbai), some more parts of Madhya Maharashtra and Interior Karnataka and some parts of Marathwada 7. 7 th June Some more parts of Interior Karnataka, west central and northeast Bay of Bengal, remaining parts of Rayalaseema and east central Bay of Bengal and some parts of Telangana, coastal Andhra Pradesh, northwest Bay of Bengal and Nagaland- Manipur-Mizoram-Tripura th June Some more parts of central and north Bay of Bengal, remaining parts of Nagaland- Manipur-Mizoram-Tripura, some parts of Assam & Meghalaya and most parts of Arunachal Pradesh th June Remaining parts of northeastern states and some parts of sub- Himalayan West Bengal & Sikkim th June Some parts of north Arabian Sea, Saurashtra and coastal Orissa, some more parts of coastal Andhra Pradesh Lat.14 N/Long.85 E, Lat.16 N/Long.90 E, and Lat.19 N/Long.94 E. Lat.16 N/Long 60 E, Lat.16 N/Long.70 E, Vengurla, Belgaum, Gadag, Anantpur, Nellore, Lat.15 N/Long.85 E, Lat.17 N/Long.90 E, and Lat.20 N/Long.94 E. Lat. 18 N/Long. 60 E, Lat. 18 N/Long. 70 E, Alibag, Pune, Bijapur, Anantpur, Nellore, Lat. 15 N/Long. 85 E, Lat. 17 N/Long. 90 E and Lat. 20 N/Long. 94 E. Lat. 20 N/Long. 60 E, Lat. 20 N/Long. 70 E, Dahanu, Nashik, Gulbarga, Anantpur, Nellore, Lat. 15 N/Long. 85 E, Lat. 17 N/Long. 90 E and Lat. 20 N/Long. 94 E. Lat. 20 N/Long. 60 E, Lat. 20 N/Long. 70 E, Dahanu, Nasik, Gulbarga, Rentachintala, Narsapur, Lat. 17 N/Long. 84 E, Lat. 20 N/Long. 90 E, Aizwal, Imphal and Lat. 26 N/Long. 95 E. Lat. 20 N/Long. 60 E, Lat. 20 N/Long. 70 E, Dahanu, Nasik, Gulbarga, Rentachintala, Narsapur, Lat. 18 N/Long. 85 E, Lat. 20 N/Long. 88 E, Lat. 22 N/Long. 90 E, Agartala, Shillong, Itanagar and Lat. 28 N/Long. 94 E. Lat. 20 N/Long. 60 E, Lat. 20 N/Long. 70 E, Dahanu, Nasik, Gulbarga, Rentachintala, Narsapur, Lat. 18 N/Long. 85 E, Lat. 20 N/Long. 88 E, Lat. 22 N/Long. 90 E, Dhubri and Gangtok. Lat. 22 N/Long. 60 E, Lat. 22 N/Long. 65 E, Porbandar, Veraval, Dahanu, 8
17 and most parts of Bay of Bengal th June Some more parts of Madhya Maharashtra, Marathwada, some parts of Vidarbha, Chattisgarh, Jharkhand and Bihar, most parts of Telangana and Orissa, remaining parts of Karnataka, Sub-Himalayan West Bengal & Sikkim, coastal Andhra Pradesh and Bay of Bengal and entire Gangetic West Bengal th June Some more parts of Vidarbha, most parts of Chattisgarh, remaining parts of Telangana, Orissa, Bihar and Jharkhand and some parts of east Uttar Pradesh th June Remaining parts of Chattisgarh; some parts of east Madhya Pradesh and some more parts of east Uttar Pradesh th June Some more parts of Vidarbha,east Madhya Pradesh and east Uttar Pradesh and some parts of west Uttar Pradesh and Uttarakhand nd June Some more parts of Madhya Maharashtra, Marathwada, Vidarbha, east Madhya Pradesh and west Uttar Pradesh; some parts of west Madhya Pradesh and remaining parts of east Uttar Pradesh nd June Some parts of Gujarat Region, some more parts of north Arabian Sea, west Madhya Pradesh and west Uttar Pradesh and remaining parts of Madhya Maharashtra, Marathwada, Vidarbha and east Madhya Pradesh rd June Some more parts of Gujarat Region and west Uttar Pradesh, remaining parts of west Madhya Pradesh and in some parts Nasik, Gulbarga, Rentachintala, Kalingapatnam, Puri, Lat. 21 N/Long. 88 E, Dhubri and Gangtok. Lat. 22 N/long. 60 E, Lat. 22 N/long. 65 E, Porbandar, Veraval, Dahanu, Nasik, Adilabad, Kanker, Jharsuguda, Ranchi, Bhagalpur, Forbesganj, and Lat. 27 N/Long. 87 E. Lat. 22 N/Long. 60 E, Lat. 22 N/Long. 65 E, Porbandar, Veraval, Dahanu, Nasik, Adilabad, Pendra, Varanasi, Gorakhpur and Lat. 28 N/Long. 83 E. Lat. 22 N/Long. 60 E, Lat. 22 N/Long. 65 E, Porbandar, Veraval, Dahanu, Nasik, Adilabad, Gondia, Umaria, Allahabad, Bahraich and Lat. 28 N/Long E. Lat. 22 N/Long. 60 E, Lat. 22 N/Long. 65 E, Porbandar, Veraval, Dahanu, Nasik, Adilabad, Nagpur, Jabalpur, Khajuraho, Kanpur, Shahjahanpur, Mukteswar and Lat. 31 N/Long. 80 E. Lat. 22º N/Long 60º E, Lat. 22º N/Long 65º E, Porbandar, Veraval, Dahanu, Nasik, Washim, Betul, Sagar, Shahjahanpur, Mukteshwar and Lat. 31º N/Long 80º E. Lat. 22 N/Long. 60 E, Lat. 22 N/Long. 65 E, Porbandar, Veraval, Navsari, Ujjain, Gwalior, Shahjahanpur, Mukteswar and Lat. 31 N/Long. 80 E. Lat. 22 N/Long. 60 E, Lat. 22 N/Long. 65 E, Porbandar, Veraval, Navsari, 9
18 of east Rajasthan th June Some more parts of northeast Arabian Sea, Saurastra & Kutch, Gujarat region, east Rajastan and Uttarakhand, most parts of Himachal Pradesh and entire Jammu & Kashmir th June Some more parts of west Uttar Pradesh and Uttarakhand, remaining parts of Himachal Pradesh and some parts of Haryana and Punjab th June Remaining parts of west Uttar Pradesh, Uttarakhand, Punjab, Haryana (including Delhi), some more parts of east Rajasthan and some parts of west Rajasthan. Udaipur, Tonk, Dholpur, Shahjahanpur, Mukteswar and Lat. 31 N/Long. 80 E Lat. 22 N/Long. 60 E, Lat. 22 N/Long. 65 E, Porbandar, Ahmedabad,Udaipur, Ajmer, Jaipur, Dholpur, Shahjahanpur, Dehradun, Shimla and Jammu. Lat. 22 N/Long. 60 E, Lat. 22 N/Long. 65 E, Porbandar, Ahmedabad,Udaipur, Ajmer, Jaipur, Dholpur, Shahjahanpur, Pantnagar, Patiala and Jammu. Lat. 22 N/Long. 60 E, Lat. 22 N/Long. 65 E, Porbandar, Ahmedabad, Udaipur, Ajmer, Pilani and Ganganagar. Hiatus in the Northern Limit of Monsoon during 27 th June 7 th July (11days) th July most parts of the Arabian Sea, Lat. 25 N/Long. 60 E, remaining parts of Saurashtra & Kutch Lat. 25 N/Long. 65 E, and Gujarat Region and some more Jawaidam, Ajmer, Pilani parts of west Rajasthan. and Ganganagar th July remaining parts of the Arabian Sea and west Rajasthan and thus covered the entire country. Due to strengthening of the cross-equatorial flow over Arabian Sea and the northward movement of a vortex in the form of an upper air cyclonic circulation along the trough off the west coast, the monsoon further advanced rapidly and covered entire Kerala, Tamil Nadu and Goa, most parts of Karnataka and some parts of Maharashtra and south Andhra Pradesh by 5 th June. However, the organization of this vortex into a low pressure area, its further intensification and stagnation over the east central Arabian Sea during the period from 6 th 10 th June, caused a short lived hiatus in the advance of the monsoon along the west coast. In the mean time, the convection over the Bay of Bengal strengthened and with the formation of a low pressure area of short life span over the northwest Bay of Bengal, the eastern branch of the monsoon advanced over some more parts of Bay of Bengal and northeastern states, with a delay of nearly 5 days, with respect to the respective normal dates. Thereafter, formation of a Depression over the Arabian Sea on 11 th June and a cyclonic circulation over the North Bay of Bengal caused the monsoon to further advance over some more parts of Arabian Sea, parts of Saurashtra and most parts of the Bay of Bengal and parts of coastal Andhra Pradesh and coastal Orissa on 13 th June. 10


19 Subsequently, there had been a rather steady advance during 15 th 26 th June in association with the formation of a Deep Depression (16 th 22 nd June) over the northwest Bay of Bengal and its gradual west-northwestward movement. This synoptic situation caused the monsoon to cover most parts of the country outside western parts of Rajasthan and north Gujarat state. The weakening of the Arabian Sea branch of monsoon caused a prolonged stagnation (14 th June 7 th July) of the western limb in the Northern Limit of Monsoon (NLM). During this period, on 2 nd and 3 rd July, the heat trough at sea level also lay close to foot hills of Himalayas. As such, there was a prolonged hiatus (27 th June -7 th July) in the Northern Limit of Monsoon (NLM). With the formation of a low pressure area over south Chhattisgarh and adjoining Telangana and the organization of the off shore trough extending from south Gujarat coast to Kerala coast during 4 th - 8 th July, the trough at mean sea level shifted southwards and became more pronounced and resulted into favourable conditions for further advance of monsoon. Thus, the southwest monsoon covered the entire country on 9 th July, 6 days earlier than its normal date of 15 th July. Fig. 1.8: Isochrones of advance of southwest monsoon
20 1.4 Withdrawal of the monsoon The dates of withdrawal of southwest monsoon are given in Table 1.4 and Fig.1.9. Table - 1.4: Dates of withdrawal of southwest Monsoon Sr. No. Date Southwest monsoon withdrew from : Withdrawal line passed through th September th September th September th September th October th October Some parts of Punjab, Haryana, Rajasthan, Gujarat and north Arabian Sea. Entire Jammu & Kashmir, Uttarakhand, Himachal Pradesh; remaining parts of Punjab, Haryana,Delhi and some parts of west Uttar Pradesh and Rajasthan. Remaining parts of Rajasthan, most parts of west Uttar Pradesh,some parts of east Uttar Pradesh and west Madhya Pradesh, some more parts of Gujarat State and north Arabian Sea. Most parts of Uttar Pradesh and some more parts of Madhya Pradesh. Remaining parts of Uttar Pradesh, Madhya Pradesh, Gujarat State and north Arabian Sea, most parts of Bihar and some parts of Jharkhand, north Chattisgarh, Vidarbha, north Madhya Maharashtra and north Konkan. Entire northeast India (Arunachal Pradesh, Assam & Meghalaya, Nagaland-Manipur- Mizoram-Tripura, Sikkim) and West Bengal, remaining parts of Bihar and Jharkhand, some parts of north Bay of Bengal and Orissa, some more parts of Chattisgarh and Vidarbha. Amritsar, Hissar, Ajmer, Deesa, Porbandar, Lat. 21 N / Long. 65 E and Lat. 21 N / 60 E Lat. 29 N / Long. 80 E, Bareilly, Agra, Sawai Madhopur, Udaipur, Deesa, Porbandar, Lat. 21 N / Long. 65 E, and Lat. 21 N / 60 E. Lat. 28 N / Long. 82 E, Bahraich, Lucknow, Jhansi, Bhopal, Indore, Baroda, Veraval, Lat. 21 N / Long. 65 E, and Lat. 21 N / 60 E. Lat. 27 N / Long. 84 E, Ballia, Umaria, Jabalpur, Indore, Veraval, Lat. 21 N / Long. 65 E and Lat. 21 N / Long. 60 E. Forbesganj, Gaya, Pendra, Nagpur, Akola, Malegaon, Dahanu, Lat. 20 N / Long. 70 E, Lat. 20 N / Long. 65 E and Lat. 20 N / Long. 60 E. Lat. 22 N / Long. 93 E, Balasore, Keonjhargarh, Raipur, Akola, Malegaon, Dahanu, Lat. 20 N / Long. 70 E, Lat. 20 N / Long. 65 E and Lat. 20 N / Long. 60 E th October remaining parts of the country, Bay of Bengal and Arabian Sea and thus withdrew from the entire country. 12
21 Fig. 1.9: Isochrones of withdrawal of southwest monsoon The withdrawal of south west monsoon from west Rajasthan started on 23 rd September, with a delay of more than three weeks with respect to the normal date of withdrawal from extreme western parts of Rajasthan [1 st September]. Subsequently, the monsoon withdrew from most parts of northwest India and some parts of west Uttar Pradesh on 26 th September and from most parts of Uttar Pradesh, some parts of Madhya Pradesh and some more parts of Gujarat state on 28 th September. On 30 th September, the monsoon further withdrew from some more parts of Uttar Pradesh and Madhya Pradesh. The subsequent withdrawal of the monsoon was delayed due to the presence of various transient synoptic scale systems including troughs and cyclonic circulations causing moisture incursion and rainfall over the region. The southward shifting of the upper tropospheric anticyclone (as evidenced from Fig. 1.10) caused a reduction in the rainfall activity over the east and northeastern parts from 10 th October. 13

22 Fig. 1.10: Upper level circulation pattern on 11 th Oct The southwest monsoon withdrew from some more parts of central and peninsular India on 11 th October and from the entire northeast and eastern parts of the country on 13 th October. On 24 th October, it withdrew from the entire country, including south peninsula, Bay of Bengal and Arabian Sea followed by a simultaneous commencement of northeast monsoon rains over Tamil Nadu, Kerala and adjoining areas of Andhra Pradesh and Karnataka. The delay in the withdrawal of southwest monsoon from west Rajasthan could be attributed to the rather extended westward tracks of the low pressure areas across the northwest India and further westwards to Pakistan during the first fortnight of September. This occurred in association with a high zonal index phase of the mid-latitude circulation pattern. Subsequently, a gradual taking over by the westerly regime occurred over the region, which led to the north and northeastward re-curvature of the low pressure systems thereafter. The tendency of delayed withdrawal of southwest monsoon from Rajasthan is being continued since The dates of initiation of the withdrawal of the SW monsoon from extreme west Rajasthan, during recent years are tabulated in Table
23 Table - 1.5: Date of Initiation of Withdrawal of SW Monsoon from extreme west Rajasthan during recent years Year Date of Initiation of Withdrawal of SW Monsoon from extreme west Rajasthan st September th September th September th September th September The main causative factors for delayed withdrawal are summarized as under: Formation of low pressure areas over west central and northwest Bay of Bengal and adjoining areas and their movement up to Central India and adjoining Northwest India during September leading to enhanced moisture incursion over the region and presence of cyclonic circulations over northwest India. North-south oscillation of the western end of the axis of the monsoon trough leading to convective rainfall. Increased frequency of western disturbances affecting western Himalayan Region and adjoining northern plains during September. Interaction between monsoon easterlies and mid-tropospheric westerly troughs causing widespread rainfall over northwest India. 1.5 Concluding remarks The observational features related to the advance and withdrawal phases of southwest monsoon 2011 are discussed above. The following points are significant: The monsoon onset over Kerala took place on 29 th May, 3 days prior to the normal date, despite the delayed arrival over the south Andaman Sea by 9 days with respect to the normal date. Subsequently, there was a rather steady advance along the eastern and central parts of the country in association with the formation and movement of a Deep Depression and a low pressure area. 15
24 Though the advance in the western limb of the Northern Limit of Monsoon over the Arabian Sea had been sluggish during the later part of June, the southwest monsoon covered the entire country on 9 th July (6 days earlier than normal). A high zonal index phase in the mid-latitude circulation helped in the penetration of monsoon transient lows to farther western longitudes during the first half of September, thereby delaying the withdrawal from the western parts of the country. 16
25 2 SEMI PERMANENT SYSTEMS AND SYNOPTIC FEATURES A. B. Mazumdar, Medha Khole and Sunitha Devi, S. The overall performance of monsoon each year is strongly reflected through changes in the mean location and strength of various semi permanent systems associated with the monsoon circulation. In addition to this, the synoptic systems formed during the season have also some influence on the mean monsoon and its intra-seasonal variation. This chapter provides details of the semi permanent systems and synoptic features that prevailed during the southwest monsoon season Semi Permanent systems Monsoon Trough An east-west oriented heat trough in the lower levels appeared over the Gangetic Plains and persisted there during 28 th May 8 th June. From 9 th June onwards, it could be delineated on the mean sea level charts as well, extending up to north / east central Bay of Bengal often, until 1 st July. Shifting northwards, it remained close to the foothills of the Himalayas on 2 nd & 3 rd July. However, subsequent to the southward shift, especially of the eastern part, it became more pronounced and also extended up to mid tropospheric levels during 5 th 8 th July. With the southwest monsoon covering the entire country, it established as the monsoon trough on 9 th July. Remaining in its near normal position, it extended up to mid tropospheric levels, tilting southwards with height during 13 th 19 th July. During the subsequent period of July, its vertical extension was confined to lower tropospheric levels in general and another branch of the eastern end extended eastwards to the northeastern states towards the end of July. The eastern end started dipping more southwards in to the Bay of Bengal during the first week of August. It also strengthened and extended up to mid 17
26 tropospheric levels during 8 th 10 th August. The eastern end showed wide north-south oscillations during 11 th -17 th August. It lay close to the foothills of the Himalayas on 16 th and once again extended southeastwards to the east central Bay of Bengal on 17 th. The western end also shifted to the north of its normal position around 17 th August, in association with the northeastward drifting of a low pressure area over the region, which occurred under the influence of a western disturbance. It extended up to mid tropospheric levels, with slight southward tilt with height during 11 th 14 th August and was confined to the lower tropospheric levels subsequently. Though it regained its near normal position subsequent to the dissipation of the low pressure area during 19 th 21 st August, the trough rapidly shifted towards north and lay close to the foothills of the Himalayas on 22 nd & 23 rd August. Subsequent to the formation of low pressure areas over the Arabian Sea and the Bay of Bengal, the monsoon trough remained to the south of its normal position during the period 25 th August 14 th September. Thereafter, it shifted northwards and lay close to the foothills of the Himalayas on 17 th & 18 th September. Further, the western end of the monsoon trough continued to remain close to the foothills of the Himalayas until the trough at sea level started getting disorganized from 23 rd September, indicating the beginning of withdrawal of southwest monsoon Heat Low The heat low got established in its near normal position over Pakistan and neighborhood around 1 st June. It remained in the near normal position during June and to the northwest of its normal position on many days during July, August and September. The low started filling up from 10 th September and became less marked from 16 th September. The lowest and the second lowest pressure values of the heat low were: June: 985 hpa (on 9 th ) and 988 hpa (on 21 st ) July: hpa (on 22 nd ) and 989 hpa (on 17 th & 18 th ) Aug: 986 hpa (on 13 th ) and 988 hpa (on 7 th ) Sept: 990 hpa (on 7 th ) and 992 hpa (on 12 th ) 18


27 Fig. 2.1: Monthly pattern of surface pressure and anomalous surface pressure and air temperature fields, around the heat low region. Fig. 2.1 depicts the surface air temperature and pressure contours (from the CPC- NOAA re-analysis) during each month, around the Heat low region, normally located centered near Lat. 28 o N / Long. 68 o E, close to Jacobabad in Pakistan. It is observed that, the monthly mean position of the Heat Low was located to the east of its normal position during June and July and in the near normal position in August and September. Over the Heat Low region, the Sea Level Pressure anomalies indicate stronger than normal Heat Low in June, weaker than normal in July, normal in August and stronger than normal in September. However, the surface temperature anomalies are not consistent with the centres of the Heat Low. Warm anomaly had been to the north of Heat Low region in June, to the northeast in July, to the northwest in August and to the west in September Tibetan Anticyclone The Tibetan Anticyclone (TA) got established in its near normal position at 300 & 200 hpa on 25 th June. It was noticed all through the remaining period of the season. An analysis of the monthly mean characteristics of this anticyclone using the CDC / NOAA data (Fig.2.2) shows that the anticyclone remained to the south / southeast of normal position during June, near normal in July and September and slightly to the west of normal position in August. However, the intensity showed wide variations as seen from the anomalous fields (Figure not shown). 19
 TEJ got established over the southern tip of")


 STWJ started shifting northwards from the first")

28 Fig. 2.2: Month wise mean geo-potential heights at 500, 300 and 200 hpa Tropical Easterly Jet (TEJ) TEJ got established over the southern tip of Peninsular India by 9 th June. The southern stations viz., Thiruvananthapuram, Chennai and Minicoy reported easterlies of 85 and 65 Kts respectively around 200 hpa levels on 9 th June. The wide latitudinal spread of the easterly jet speed winds was noticed during the whole of the season. A core wind speed of 135 kts. was noted over Thiruvananthapuram on 12 th July, 20 th July and 9 th August. Jet speed winds of the order of Kts. were noticed over Mumbai occasionally during August & September. Apart from these, Jet speed winds were also reported over Visakhapatnam, Bhubaneswar, Hyderabad, Nagpur, Bhopal, Ranchi and Kolkata on several days during the season Sub-Tropical Westerly Jet (STWJ) STWJ started shifting northwards from the first week of June. Delhi reported 80 knots wind at 925 hpa at 1200 UTC of 14 th June. Subsequently the STWJ shifted to the north of the Himalayas. However, it made occasional re-appearances along Srinagar, Guwahati, Delhi, Gorakhpur and Ranchi latitudes during the first half of July. Towards the end of the season, it once again shifted southwards as evidenced by the 70 knots westerly wind reported over Srinagar at 192 hpa on 20 th Sept. (00UTC). 20
29 2.1.6 Intensity of Mascarene HIGH (normally centered at 30 o S/ 60 o E) during June to September The intensity of Mascarene HIGH with its mean position at 32 o S / 58 o E was almost close to the normal during the monsoon period June to September It was below normal by 2.5 hpa in the month of July It was above normal by 2.0 and 0.5 hpa in the month of June & September 2011 respectively. It was equal to normal in the month of August A summary of the semi-permanent features described under to for the past five years is given in Table Other semi-permanent features: Off-shore trough Off-shore trough along different parts of the west coast persisted from 2 June 21 September except during June. It was quite feeble on a few days including 27 June 4 July, July, August, 9-11 September and September Cross Equatorial Flow during June September 2011 The Cross Equatorial Flow along the equatorial belt (equator to 5 0 N/ 5 0 S) over Arabian Sea was stronger than normal by about 5 kts during the second week of June and third week of September. It was also stronger than normal by about 5-10 kts in first week of September and by more than 10 kts in third week of July. It was weaker than normal by about 5 kts in fourth week of August and by about 5-10 kts in third week of August. Except these, the cross equatorial flow along the equatorial belt was close to normal during the entire monsoon period June-September The surface winds over Arabian Sea to the north of 5 0 N were stronger than normal by about 5 kts during fourth week of June and in third and fourth week of September. They were also stronger than normal by about 5-10 kts in first week of September and by about 10 kts in second week of September. They were weaker than normal by about 5 kts in second and fourth week of July and first, second and fourth week of August. They were also weaker than normal by about 5-10 kts in third week of August. They were almost normal for the remaining period of the season. The Cross Equatorial flow along the equatorial belt (equator to 5 0 N/ 5 0 S) over Bay of Bengal was stronger than normal by about 5 kts in first week of June, fourth week of August and in first and second week of September. Except these, the cross equatorial flow along the equatorial belt was close to normal during entire monsoon period June-September The surface winds over the Bay of Bengal to the north of 5 0 N were stronger than normal by about 5 kts in fourth week of June, second, third and fourth week of July and second and third week of September. They were also stronger than normal by about
30 kts in first week of August and first and fourth week of September. They were almost normal for the remaining period of the season Intensity of Australian HIGH (normally centered at 30 o S/ 140 o E) during June to September 2011: The intensity of Australian HIGH centered at 34 o S / 135 o E was above normal by an average of about 7.1 hpa during the entire monsoon period June to September It was above normal by 6.0 hpa, 7.0 hpa, 6.5 hpa & 9.0 hpa in the month of June, July, August & September 2011 respectively. 2.3 Synoptic disturbances over the Indian Monsoon region: No cyclonic Storm formed during the season Depressions: Based on the recorded history of Cyclonic Storms and Depressions, about 7 monsoon depressions develop over the Indian region during the monsoon season with a standard deviation of about 2.5. It includes two each in August and September and 1.5 each in June and July. During this season, four low pressure systems intensified into a depression Depression over the Arabian Sea (11 12 June 2011) A low pressure area formed over the east central Arabian Sea off north Maharashtra coast on 6. It persisted there on 7 and lay as a well marked low pressure area over the east central Arabian Sea and neighborhood from 8 to 10 and over the east central Arabian Sea off north Maharashtra south Gujarat coasts on 11 morning. Subsequently, it concentrated into a Depression and lay centered over the northeast Arabian Sea off Maharashtra-Gujarat coasts at 1200 UTC of 11 near Lat.20.0 N/Long.71.5 E, about 180 km northwest of Mumbai. It moved north northwestwards and crossed south Gujarat coast, about 25 km to the east of Diu around 2200 UTC of 11 and lay centered at 0300 UTC of 12 over Saurashtra and neighborhood, about 70 km south southwest of Amreli, near Lat.21.0 N/Long.70.5 E. Gradually moving northwestwards, it weakened into a well marked low pressure area over Saurashtra and adjoining northeast Arabian Sea by 1200 UTC of 12. It further weakened into a low pressure area over the same region on 13 and became less marked on
31 Deep Depression over the Bay of Bengal (16 23 June 2011) A low pressure area formed over the northwest Bay of Bengal and neighborhood on 14. It lay as a well marked low pressure area over the same region on 15. It concentrated into a Depression and lay centered at 0300 UTC of 16 over the northwest Bay of Bengal, near Lat N / Long E, about 150 kms southeast of Kolkata and further intensified into a Deep Depression at 0600 UTC of 16 over the same region. It further moved north northwestwards and crossed West Bengal-Bangla Desh coasts, near Lat N/Long E, about 100 km to the east of Sagar Islands, between 1100 & 1200 UTC of 16 and lay over Gangetic West Bengal and adjoining Bangladesh, near Lat N/Long E, about 100 kms southeast of Kolkata at 1200 UTC of 16. Moving slightly northwards, it lay centered near Lat N / Long E, about 80 km east of Kolkata at 0300 UTC of 17. Subsequently moving westwards, it lay over Gangetic West Bengal, near Lat N / Long E, close to Burdwan at 1200 UTC of 17. Further moving westwards, it lay over Gangetic West Bengal and adjoining areas of Jharkhand, centered near Lat N / Long E, about 25 km south of Bankura at 0300 UTC of 18. It remained practically stationary over the same region at 1200 UTC of 18. Thereafter, it further moved northwards and lay over Jharkhand and adjoining Gangetic West Bengal, centered near Lat N / Long E, about 50 km. southeast of Ranchi at 0300 UTC of 19. Moving slightly westwards, it lay centered near Lat N / Long E, about 25 km. north-northwest of Ranchi at 1200 UTC of 19. It further moved west northwestwards and lay over Chattisgarh and adjoining areas of Jharkhand, about 50 km northeast of Ambikapur at 0300 UTC of 20 and further weakened into a Depression over the same area at 0600 UTC of 20. Moving slightly northwestwards, it lay centered at 1200 UTC of 20 over southeast Uttar Pradesh and neighborhood, about 150 km south of Varanasi. Subsequently moving west northwestwards, it lay centered at 0300 UTC of 21, over east Madhya Pradesh and adjoining south Uttar Pradesh, about 100 km. east of Rewa. Then it moved westwards and lay centered at 1200 UTC of 21, over the same area close to Satna. Continuing the westward movement, it lay centered at 0300 UTC of 22, over east Madhya Pradesh, close to and to the west of Panna and over the central parts of Madhya Pradesh and adjoining south Uttar Pradesh, about 50 km northeast of Sagar at 1200 UTC of 22. It moved further northwestwards and weakened into well marked low pressure area over west Madhya Pradesh and neighborhood in the early morning of Land Depression over Jharkhand (22 23 July 2011) Under the influence of the low pressure area formed over Gangetic West Bengal and neighborhood, a Depression formed over northwest Jharkhand and neighborhood, about 50 km southeast of Daltonganj at 0300 UTC of 22. Moving in a west northwesterly direction, it lay over southeast Uttar Pradesh and neighborhood, about 100 km east of Sidhi at 1200 of 23
32 22. Thereafter, it moved westwards and lay centered over east Madhya Pradesh, about 100 km northeast of Sagar at 0000 UTC of 23. Continuing the westward movement, it weakened into a well marked low pressure area and lay over north Madhya Pradesh and neighborhood on 23 morning and became less marked on Depression over the Bay of Bengal (22 24 September 2011) A low pressure area formed over the northwest Bay of Bengal and adjoining coastal areas of West Bengal on 20. It became well marked low pressure area over the northwest Bay of Bengal and adjoining West Bengal Orissa coasts on 21. Subsequently, it concentrated into a Depression over the northwest Bay of Bengal off north Orissa-West Bengal coasts and lay centered at 0300 UTC 22 near Lat N/Long E, about 50 km east southeast of Balasore. It moved slightly westwards and lay centered near Lat N/Long. 87 E at 1200 UTC and then moving west northwestwards, crossed north Orissa coast, close to Balasore between 1700 & 1800 UTC of 22. Subsequently moving northwestwards, it lay over Jharkhand and neighborhood, centered close to Jamshedpur at 0300 UTC of 23. It remained practically stationary over the region and weakened into a well marked low pressure area by 0900 UTC. The tracks of these systems are given in Fig Low pressure areas / Well marked low pressure areas. In all, 10 low pressure areas / well marked low pressure areas formed during the season. Most of them originated as upper air cyclonic circulations. Five of them formed over the land, four over the Bay of Bengal and one over the Arabian Sea. Out of these ten low pressures areas, two formed each in June, July and September and four in August. The total number of low pressure areas during the past 5 years viz., 2006 to 2010 is 7, 6, 7, 5 and 14 respectively Upper air cyclonic circulations There were 17 upper air cyclonic circulations (in lower and middle tropospheric levels) which formed during the season. The month wise distribution of these is: 3 in June, 5 each in July and August and 4 in September Eastward moving cyclonic circulations/western Disturbances There were 29 eastward moving systems as upper air cyclonic circulations. The month wise distribution is 9 in June, 7 each in July and September and 6 in August. A brief month wise summary of these synoptic systems is available in Tables 2.2 to
33 2.4 Low Pressure systems over other oceanic areas during June to September Low Pressure Systems in West Pacific Ocean/ South China Sea during June to September There were, in all, 18 low pressure systems (reaching the intensity of Tropical depression and above) in the northwest Pacific Ocean / South China Sea during June September The month wise break-up is given below: Low Pressure Systems June July August September TOTAL Tropical Depression (T.D.) Tropical Storm (T.S.) Typhoon/Super Typhoon TOTAL Low pressure systems in South Indian Ocean during June to September No low pressure system (TD, TS or Typhoon) was reported in Southern Hemisphere during June- September Troughs in Westerlies south of 30 0 N affecting the Indian region and to the north of 30 0 S during June to September ( i ) Mid and Upper tropospheric Westerly troughs : The number of troughs in westerlies affecting Indian region which penetrated south of 30 o N is as follows: Atmospheric Level June July August September Total 300 hpa hpa (ii) Upper Air Troughs in westerlies over South Indian Ocean, which penetrated to the north of latitude 30 0 S. (Source: INSAT) There were 18 troughs in upper air westerlies which moved across the Indian Ocean from west to east, to the north of Lat S, in the Southern Hemisphere, during June to September 2011.The month wise break-up is as follows: 25
34 June July August September Total The meteorological aspects of severe floods during southwest monsoon Floods and droughts During the southwest Monsoon season 2011, many states viz., Arunachal Pradesh, Assam & Meghalaya, West Bengal, Orissa, Bihar, Uttar Pradesh, Gujarat State, Madhya Pradesh and Kerala experienced flood situations during various periods of the season. Incessant heavy rainfall associated with the low pressure systems as well as dis-organized convective activity in the form of scattered thunder showers were the major causes of flood The meteorological aspects of severe floods during southwest monsoon 2011 The data provided in this section are consolidated from the various flood reports, media reports and the damage reports prepared by the field offices on a monthly basis Kerala (1-13 June) Damage: Heavy rains in many parts of Kerala claimed 23 lives since the onset of southwest monsoon, besides causing large-scale loss to crop and property. Most casualties, mainly due to drowning in swelling rivers and flash floods were reported from Alappuzha and Kottayam districts. Increased flow of water from the high range areas inundated western part of Kottayam district though the district experienced a relatively dry spell, barring isolated rain during the day. Vehicular traffic was affected and 55 houses damaged. Crop loss in the state, mainly in Kuttanad, was estimated to be Rs.5.53 crore. Crops in 544 hectares were under water. Cause: Floods triggered by incessant heavy rain for days. Synoptic Situation: Onset of southwest monsoon over Kerala, its steady advance over peninsular India. Off-shore trough seen along the west coast from 2 to 18 June Orissa (18-21 June) The rivers Jalakaa, Subarnarekha ad Baitarani were flooded. Damage: Five people were killed in rain and flood related accidents, and at least six panchayats affected, after flash floods in Orissa's Balasore district. The collapse of a bridge in the Jalakaa River led to inundation of large tracts of paddy fields and submergence of several important link roads. 26
35 Cause: Continuous widespread/fairly widespread rain with extremely heavy/very heavy rain in the region from 16 to 19 Synoptic situation: Deep Depression over northwest Bay of Bengal West Bengal (22-29 June) Damage: 22 people died. Over 2.75 lakh people affected due to inundation in Paschim & Medinipur districts of West Bengal. Ten districts were affected by heavy floods. About 25,750 mud houses were damaged or washed. The districts affected were Malda, Murshidabad, Purba 4 Medinipur, Howrah, North 24 Parganas, South 24 Parganas, Bankura, Purulia and Darjeeling. Cause: Flash flood due to heavy to very heavy rain. Synoptic situation: Deep Depression over northwest Bay of Bengal Bihar (1 22 July) The river Kosi was flooded. Bagmati at Muzaffarpur and Kosi at Supaul also flooded. Damage: 39 lives lost. 2 houses fully damaged. 69 villages and three districts affected. Over half a million people affected by floods in Bihar, with thousands forced to flee their homes. The flooding enveloped parts of West Champaran, Gopalganj, Saharsa, Muzaffarpur and Araria districts following heavy rains in the state and in the areas closer to Nepal. Rail traffic was suspended after floodwaters submerged railway tracks Cause: Heavy rain in Nepal and Bihar Synoptic situation: Northward shift in the monsoon trough during the first and towards the end of the 3 rd week of July Assam and Arunachal Pradesh (1 22 July) Brahmaputra, Borgang, Subansiri, Jiadhol, Drupang, Ranganadi and Burigang rivers flooded. Damage: Four people died in Assam. Two lakh people affected. 200 villages affected. Standing crops at Dalabari, Besseria, Parbatia, Panchmile, Koroiyani and Rajbharal damaged. Up to 800 villages across four districts - Lakhimpur, Dhemaji, Sonitpur and Jorhat and nearly 150,000 people were affected. Altogether 513 villages in six districts have been hit by floods. Cause: Incessant rain in Assam and the upper reaches of neighboring Arunachal Pradesh. Synoptic situation: Cyclonic Circulation over Assam & Meghalaya during 2-3 July, July. Eastern end of Monsoon trough along Assam & Meghalaya on 9 and
36 Madhya Pradesh (1 22 July) Damage: 15 people died.50 houses destroyed. Cause: Heavy to very heavy rainfall. Synoptic situation: Successive passage of low pressure areas and a depression through Madhya Pradesh and adjoining areas in July (except the last week) Uttar Pradesh (23 July - 9 August) Ravi, Ganga, Ballia, Sharda, Ghaghra, Rapti, Ghaghra, Palliakalan (Kheri), Ghagra, Saryu were flooded. Damage: Death toll was 98 in the state. Over three lakh people in 14 districts were affected by floods and thousands rendered homeless, with 302 villages in 26 tehsils cut off from the adjoining areas. Bahraich, Balrampur, Bahraich, Barabanki, Faizabad, Gonda, Lakhimpur Kheri, Pilibhit, Sitapur and Ballia districts have borne the brunt of the onslaught by the swollen rivers. Over 1,500 houses were destroyed and 728 others partially in the catchment areas. About 37,000 hectare agricultural area was damaged by the flood waters. Release of water from Nepal worsened the flood situation in Uttar Pradesh. Cause: Widespread to fairly widespread with heavy to very heavy rain at isolated places. Nepal released water from Banbasa dam on Indo-Nepal border.. Synoptic situation: Land Depression over northwest Jharkhand and neighbourhood on 22 & its subsequent westward movement and a cyclonic circulation over southeast Uttar Pradesh and neighbourhood during 4 7 August West Bengal (10-18 August) Damodar, Kangsabati and Mayurakshi rivers flooded. Damage: One person died. Approximately 1.9 million people affected by heavy torrential monsoon rains which flooded 195 blocks in 14 districts of the State of West Bengal. About houses have been fully or partly damaged and livelihoods of people severely affected. More than 115,000 houses damaged. More than 30,000 hectares of crops are estimated to be damaged. Causes: Incessant heavy rains throughout the period. Synoptic situation: Well marked low pressure area over Gangetic West Bengal on 11 August and its northwest movement. 28
37 Assam & Meghalaya (13 25 Aug.) Rivers Brahmaputra river and its tributaries flooded. Gai-Nadi, Jiadhal, Jinjiram, Ganol, Simsang were flooded. All major rivers in West Garo Hills district also flooded. Damage: The floods claimed seven deaths as reported from three flood-hit districts of Dhemaji, Lakhimpur and Sonitpur lives. More than 3 lakh people of 335 villages affected. Around hectares of crops affected. The flash floods triggered by swirling waters of Gai-Nadi and Jiadhal rivers devastated Dhemaji district of eastern Assam affecting over 65 villages. The flood also created havoc in parts of neighboring Lakhimpur and Sonitpur districts driving people out of their inundated homes in scores and damaging standing crop on hundreds of hectares of land. Over 1,500 people were rendered homeless in western parts of Meghalaya as some villages were submerged with floodwater entering many lowlying areas and affecting thousands of people. The incessant rains also wreaked havoc in the South Garo Hills district, bordering Bangladesh. Road communication in the district continues to remain disrupted following landslides at several places. Cause: Flash flood due to heavy to very heavy rain. Synoptic Situation: Monsoon trough north of its normal position on 14 and 15 and then close to foot hills of Himalayas during August, Cyclonic Circulation over Assam & Meghalaya on 17 Aug Gujarat (25 Aug. 13 Sept.) River Tapi was flooded. Damage: Heavy rains lashed Saurashtra and Kutch region Incessant rains have caused floods in parts of Navsari, crippling normal life. The floods cut off roads, bridges and inundated vast areas. Hundreds of people and vehicles remain stranded due to roads either being cut-off by the floodwaters or closed as a precautionary measure. Cause: Incessant heavy to very heavy rain with isolated extremely heavy rainfall. Synoptic situation: A cyclonic circulation extending up to mid tropospheric levels from Under the influence of it, a low pressure area over northeast Arabian Sea off north Gujarat coast during 30 Aug. 4 Sept. and well marked low pressure area over Gujarat and neighborhood on 6 and 7 Sept. 29
38 Orissa (5 Sept. - 2 Oct.) Damage: Four people washed away by sea waves off Orissa coast. Floods claimed forty-nine lives and destroyed more than 21,816 houses. About 1,362 villages remained marooned for over a week. Up to 80 per cent of paddy crop and a large number of mud-built houses damaged due to flood. Release of excess water from Hirakud dam affected 3,505 villages in 19 of the 30 districts. At least 21,816 houses had been damaged. Worst-hit districts were Jajpur, Bhadrak and Kendrapara. Cause: Continuous heavy rain from 1 to 24 Sept. Synoptic situation: Three low pressure areas and a depression traversed Orissa during the period and the eastern end of monsoon trough on many days passed through northern parts of Orissa. 2.6 Concluding remarks The monthly mean circulation features do not show characteristically strong monsoon westerlies and other synoptic scale developments during the season as a whole. Yet the monsoon season of 2011 registered above normal all India rainfall masking the effects of a deficient July. The following features are significant: i) The northeast region comprising of three meteorological sub divisions viz., Assam & Meghalaya, Arunachal Pradesh and Nagaland-Manipur-Mizoram-Tripura consistently received deficient rainfall during major part of the season. ii) The second half of the season, especially the month of August, registered above normal rainfall, while the month of July experienced deficient rainfall. iii) There was no typical break situation all through the season, other than the premature occurrence of break like situations during 2-3 July, when the monsoon was yet to cover the entire country. iv) The monsoon depressions, in general, avoided their climatologically preferred area of formation viz. the North Bay of Bengal and formed elsewhere. v) Most of the low pressure areas could be diagnosed over the mainland, via analyzing the more dense AWS data with the help of SYNERGIE workstations. 30
39 3 RAINFALL STATISTICS A.K. Srivastava The all India monsoon season rainfall over the country as a whole during 2011 was 102% of LPA like previous year. Further during both these two years, the rainfall during the second half of the monsoon season was strongly influenced by La Niña conditions over equatorial Pacific. This chapter discusses various spatial and temporal features of rainfall over the country during the 2011 southwest monsoon General Features The 2011 southwest monsoon season rainfall over the country as a whole was good. Spatially, almost all regions of the country except the extreme northeastern region, received good amount of rainfall. On monthly scale, rainfall activity was good during June, August and September. However it was subdued during July. On daily scale, rainfall realized for the country as whole was generally above or near normal on most of the days of the season, except for some days during the first week of July, last week of July to first few days of August and last week of September. Onset of the southwest monsoon took place over Kerala on 29 May, three days ahead of its normal date (1 June). Monsoon regularly advanced northwards and westwards, covering most parts of south peninsula, entire northeastern region and some parts of eastern region by 15 June. Advancement of monsoon during the next two weeks was rather rapid and smooth as it covered most parts of central India and some parts of northwest India during week ending 22 June and remaining parts of the country outside regions of west Rajasthan and north Gujarat by 26 June. Thereafter, monsoon was subdued and it did not advance further for about next two weeks. Monsoon advanced into most parts of the Arabian Sea, remaining parts of Saurashtra & Kutch and 31
 was 102% of its Long Period Average (LPA) value.")
40 Gujarat region and parts of west Rajasthan on 8 th July. It covered the remaining parts of the country and thus, the entire country on 9 th July, 6 days ahead of its normal date (15 July). For the country as a whole, seasonal rainfall at the end of the southwest monsoon season (June to September) was 102% of its Long Period Average (LPA) value. The LPA value of southwest monsoon rainfall over the country as a whole, based on data of is 89 cm. During the season, out of 36 meteorological subdivisions, 7 received excess rainfall, 26 received normal rainfall and remaining 3 subdivisions received deficient rainfall (Fig 3.1). Out of 603 meteorological districts for which data are available, 453 districts (76%) received excess/normal rainfall and the remaining 150 districts (24%) received deficient / scanty rainfall during the season. Fig. 3.1: Sub-division wise monsoon rainfall (% departure). Percent of districts with excess/normal and deficient/scanty rainfall for the years is given in the table below. 32

41 Year Excess/Normal Deficient/Scanty Spatial pattern of seasonal (June to September) rainfall anomaly, calculated using station wise rainfall data is shown in Fig The anomaly is based on the data for the period Seasonal rainfall was above normal over most parts of the country except parts of northeastern region, parts of southeast peninsula and parts of Jammu & Kashmir. Over central and adjoining western, eastern and northern parts of the country and parts of west coast, positive rainfall anomaly generally exceeded 20 to 40 cm. Magnitudes of negative rainfall anomalies over parts of extreme northeastern region was more than 40 cm. Fig. 3.2: Seasonal (June-Sept) rainfall anomaly (cm) Calculated using station wise data. 33
42 Figure 3.3 shows the number of sub-divisions receiving deficient rainfall during the monsoon season for last ten years NO. OF DEFICIENT SUB-DIVISIONS DURING NO. OF SUBDIVISIONS Y E A R Fig. 3.3: Number of sub-divisions receiving deficient rainfall during the last 10 years Monthly rainfall distribution During June, rainfall activity over the country as a whole was good. Central, northern & eastern India and the west coast received good amount of rainfall. For June 2011, rainfall over the country as a whole was 112% of its Long Period Average (LPA) value. During the month, out of 36 meteorological subdivisions, 16 received excess rainfall, 10 received normal rainfall, 8 received deficient rainfall and remaining 2 subdivisions (Gujarat region and Saurashtra & Kutch) received scanty rainfall (Fig.3.4a). During July, rainfall activity over the country as a whole was subdued. Eastern/northeastern and extreme northern regions of the country received less amount of rainfall, while remaining parts of the country generally received average rainfall. For July 2011, rainfall for the country as a whole was 85 % of its LPA value. During the month, out of 36 meteorological subdivisions, 4 received excess rainfall, 19 received normal rainfall and 13 subdivisions received deficient rainfall (Fig.3.4b). 34
43 During August, rainfall activity over the country as a whole was generally good. Most parts of the Peninsula and the western region received good amount of rainfall. For August 2011, rainfall for the country as a whole was 109 % of its LPA value. During the month, out of 36 meteorological subdivisions, 16 received excess rainfall, 15 received normal rainfall and remaining 5 subdivisions received deficient rainfall (Fig.3.4c). During September, rainfall activity over the country as a whole was good. However, there was marked spatial variability in rainfall pattern. The central region and northwestern parts of the country received good amount of rainfall, while South Peninsula and Eastern & Northeastern regions received less amount of rainfall. For September 2011, rainfall over the country as a whole was 108% of its LPA value. During the month, out of 36 meteorological subdivisions, 13 received excess rainfall, 11 received normal rainfall and 11 subdivisions received deficient rainfall. One subdivision (Rayalaseema) received scanty rainfall (Fig.3.4d). 35

44 36

45 Fig.3.4 (a-d): Monthly sub-division wise rainfall percentage departure for June, July, August and September Monthly and seasonal sub-division wise rainfall statistics for the 2011 monsoon season are given in Table
46 Table - 3.1: Rainfall (mm) for each month and season as a whole (June-September) The following table gives the respective number of subdivisions receiving excess, normal, deficient and scanty rainfall during the four months of monsoon season
47 MONTH EXCESS NORMAL DEFICIENT SCANTY JUNE JULY AUGUST SEPTEMBER Daily rainfall distribution Area weighted daily rainfall (in mm) and its long term ( ) normal for the country as a whole and for the four homogeneous regions during 1 June to 30 September is shown in Fig 3.5. For the country as a whole, rainfall was generally above or near normal on most of the days during the season, except for some days during the first week of July, last week of July to first few days of August and last week of September. Over northwest region, daily rainfall was below normal on most of the days during first two weeks of June. It was above normal on most of the days for rest of June. It was generally below normal during entire month of July and first few days of August. Thereafter, it was generally near or above normal on most of the days of the remaining season except for last 10 days of September month. Over central India, daily rainfall was near to above normal on most of the days during the season except for some days during first and last week of July and last few days of September. It was above normal at a stretch from 13 July to 23 July and 23 August to 11 September. Over south peninsula, daily rainfall was generally above/near normal on most of the days during the season except for few days during last two weeks of June, second and fourth week of July, second week of August and last two weeks of September. Over northeast region, daily rainfall was below normal on many days during the season except for some days during second fortnight of June, first fortnight of August and second fortnight of September. Rainfall was continuously below normal from 19 August to 15 September. On many occasions, it was even less than half of its normal value during this period. 39
48 RAINFALL(mm) JUN ACTUAL NORMAL JUL AUG ALL INDIA SEP RAINFALL(mm) JUN JUL AUG NORTHWEST INDIA SEP RAINFALL(mm) JUN JUL AUG CENTRAL INDIA SEP RAINFALL(mm) JUN JUL AUG SOUTH PENINSULA SEP RAINFALL(mm) EAST & NORTHEAST INDIA JUN JUL AUG SEP Fig. 3.5: Daily area weighted rainfall (mm) (vertical bars) and its long term ( ) average (continuous line) over the country as whole and the four homogeneous regions during the season. 40
49 3.4. Weekly rainfall distribution Area weighted cumulative weekly rainfall percentage departure for the country as a whole and the four homogeneous regions (NW India, NE India, Central India and South Peninsula) for the period 1 June to 30 September is shown in Fig For the country as a whole, cumulative rainfall was above normal till the last week of June. Thereafter, due to below normal rainfall activity during July, it remained on the negative side till the end of August. The negative departure gradually decreased as monsoon revived by mid of August and it again became positive and remained so till the end of season. Cumulative rainfall over the country as a whole for the weak ending on 30 September was 1.6 % above its LPA. Cumulative weekly rainfall departure for the northwest India was continuously positive during the season except for first two weeks of August. For the northeast India, cumulative weekly rainfall departure was negative throughout the season. For the central India and south peninsula, the cumulative weekly rainfall departure was substantially positive for the first few weeks and was near normal during remaining weeks of the season. Cumulative rainfall over the country as a whole for the weak ending on 30 September was 107% and 110% of LPA for northwest and central India respectively, while it was 100% of LPA for south peninsula and 87% of LPA for northeast India. Week by week and cumulative weekly rainfall percentage departure for each of the 36 meteorological subdivisions from 1 June to 30 Sept. are shown in Fig. 3.7 and 3.8 respectively. Rainfall was normal or excess for most of the weeks (more than 50% of the weeks) for many subdivisions, except for some subdivisions of east/northeast region and peninsula viz. Arunachal Pradesh, Assam & Meghalaya, Nagaland, Manipur, Meghalaya & Tripura, Jharkhand, East Uttar Pradesh, Gujarat region, Madhya Maharashtra, Marathwada, Rayalaseema and Tamil Nadu. Cumulative weekly rainfall was also normal or excess for most of the weeks (more than 50% of the weeks) for most of the subdivisions of the country except for Arunachal Pradesh, Assam & Meghalaya, Nagaland, Manipur, Mizoram & Tripura and Gujarat Region. For Assam & Meghalaya the cumulative weekly rainfall departure was deficient or scanty for whole of the season except for second week. 41
50 % DEPARTURE WHOLE INDIA Jun 15-Jun 22-Jun 29-Jun 6-Jul 13-Jul 20-Jul 27-Jul 3-Aug 10-Aug 17-Aug % DEPARTURE 24-Aug 31-Aug 7-Sep 14-Sep 21-Sep 28-Sep 30-Sep NORTH WEST INDIA Jun 15-Jun 22-Jun 29-Jun 6-Jul 13-Jul 20-Jul 27-Jul 3-Aug 10-Aug 17-Aug 24-Aug 31-Aug 7-Sep 14-Sep 21-Sep 28-Sep 30-Sep 10 EAST & NORTH EAST INDIA % DEPARTURE % DEPARTURE 8-Jun 15-Jun 22-Jun 29-Jun 6-Jul 13-Jul 20-Jul 27-Jul 3-Aug 10-Aug 17-Aug 24-Aug 31-Aug 7-Sep 14-Sep 21-Sep 28-Sep 30-Sep CENTRAL INDIA Jun 15-Jun 22-Jun 29-Jun 6-Jul 13-Jul 20-Jul 27-Jul 3-Aug 10-Aug 17-Aug 24-Aug 31-Aug 7-Sep % DEPARTURE 14-Sep 21-Sep 28-Sep 30-Sep SOUTH PENINSULA Jun 15-Jun 22-Jun 29-Jun 6-Jul 13-Jul 20-Jul 27-Jul 3-Aug 10-Aug 17-Aug 24-Aug 31-Aug 7-Sep 14-Sep 21-Sep 28-Sep 30-Sep Fig. 3.6: Area weighted cumulative weekly rainfall percentage departure for the country as a whole and the four homogeneous regions 42

51 Fig. 3.7: Sub-division wise weekly rainfall 43
 / extremely heavy rainfall ( 25 cm in 24 hours) events were reported at many stations. At some stations, record rainfall (in 24 hrs) for the month was also reported.")
52 Fig. 3.8: Sub-division wise cumulative weekly rainfall 3.5. Heavy Rainfall Events During the 2011 southwest monsoon season, very heavy rainfall ( 12.5 cm in 24 hours) / extremely heavy rainfall ( 25 cm in 24 hours) events were reported at many stations. At some stations, record rainfall (in 24 hrs) for the month was also reported. The month wise and station wise distribution of extremely heavy rainfall events is given in Table 3.2. Record rainfall (in 24 hrs.) for the month reported during the season is given in Table
53 DATE (JUNE) Table : List of stations, which reported extremely heavy rainfall ( 25 cm in 24 hours) during the monsoon season. STATION NAME OF SUBDIVISION RAINFALL (cm) 2 NILAMBUR KERALA MANDANGAD KONKAN & GOA MURUD KONKAN & GOA TELKOI ORISSA MOHANPUR GANGETIC WEST BENGAL DAMOH EAST MADHYA PRADESH GUNA WEST MADHYA PRADESH BARAN EAST RAJASTHAN GAGANBAWADA MADHYA MAHARASHTRA CHIPABAROD EAST RAJASTHAN CHERRAPUNJI ASSAM & MEGHALAYA 42 DATE (JULY) STATION NAME OF SUBDIVISION RAINFALL (cm) 1 MURTI SUB-HIMALAYAN W. B. & SIKKIM GARUBATHAN SUB-HIMALAYAN W. B. & SIKKIM QUEPEM KONKAN & GOA AHWA GUJARAT REGION GOKARNA COASTAL KARNATAKA AGUMBE S. I. KARNATAKA SIDDAPURA COASTAL KARNATAKA MAHABALESHWAR MADHYA MAHARASHTRA OLPAD GUJARAT REGION ALIPURDUAR SUB-HIMALAYAN W. B. & SIKKIM NASIRABAD EAST RAJASTHAN PANVEL KONKAN & GOA TALASARI KONKAN & GOA 50 DATE (AUG) STATION NAME OF SUBDIVISION RAINFALL (cm) 8 RAJGARH WEST MADHYA PRADESH 28 8 AMTA GANGETIC WEST BENGAL 25 9 NEEMUCH WEST MADHYA PRADESH BANSWARA EAST RAJASTHAN UNA HIMACHAL PRADESH CHERRAPUNJEE ASSAM & MEGHALAYA NAINITAL UTTARAKHAND MOHAMDI EAST UTTAR PRADESH KUMARGRAM SUB-HIMALAYAN W. B. & SIKKIM RENI WEST RAJASTHAN MADHBUN GUJARAT REGION BANSDA GUJARAT REGION VIKRAMGAD KONKAN & GOA MAHABALESHWAR MADHYA MAHARASHTRA 26 45
54 DATE (SEPT) STATION NAME OF SUBDIVISION RAINFALL (cm) 2 SIDDAPURA COASTAL KARNATAKA 28 4 MAHABALESHWAR MADHYA MAHARASHTRA 31 4 KARJAT KONKAN & GOA 29 6 DWARKA SAURASHTRA & KUTCH 30 7 NAKHATRANA SAURASHTRA & KUTCH JALPAIGURI SUB-HIMALAYAN W. B. & SIKKIM RAJGHAT EAST UTTAR PRADESH MAHEDI BIHAR 28 S. No. Table - 3.3: Record rainfall (in 24 hrs.) during the monsoon season STATION RAINFALL DURING PAST 24 Hrs. (mm) DATE (June 11) PREVIOUS RECORD (mm) Date of record Year of record 1 KOTA AP GUNA DAMOH SAGAR VIJAYWADA AP (July 11) 1 PHOOLBAGH BULDHANA (Aug 11) 1 GUWAHATI AP MUKTESWAR TEHRI PHOOLBAGH NIMACH CHENNAI CITY GADAG (Sept 11) 1 KENJORGARH JAISALMER DWARKA BHUJ AP OKHA RAJNANDGAON
55 4 GLOBAL AND REGIONAL CIRCULATION ANOMALIES O. P. Sreejith and D. S. Pai In this Chapter, regional and global anomalies of sea surface temperature, outgoing long wave radiation and circulation during the 2011 southwest monsoon season are examined and important factors responsible for the observed rainfall patterns over India during the season are identified. 4.1 Sea Surface Temperature (SST) Anomalies Equatorial Pacific The moderate to strong La Niña conditions that prevailed in the equatorial Pacific during mid-august 2010 to early February 2011 weakened during subsequent months and dissipated to neutral conditions around mid-may Evolution of SST anomalies in the four NIÑO regions since January, 2011 is shown in the Fig The moderate to strong La Niña event of 2010 peaked in January, 2011 and started weakened subsequently to reach ENSO-neutral condition in the month of May The average NIÑO3.4 SST anomaly index in January, 2011 was o C and that in May was o C. Warming of SST over NIÑO3.4 region continued at the SST anomalies became positive for a brief period during the end of June. Subsequently the SSTs over NIÑO3.4 region started to cool and the anomalies become negative during July. Weak La Niña conditions reemerged during end of August and became moderate by November. As of now moderate La Niña conditions are prevailing over east Pacific. The evolution of SST anomaly in the NIÑO3 regions was nearly similar to NIÑO3.4 region. In the Niño 1+2 region, SST anomalies became positive in the month of February and returned to negative side after August month. 47
 anomalies ( C) in the Niño regions [Niño-1+2 (0-10 S, 90 W-80 W), Niño 3 (5 N-5")
56 Fig. 4.1: Time series of area-averaged sea surface temperature (SST) anomalies ( C) in the Niño regions [Niño-1+2 (0-10 S, 90 W-80 W), Niño 3 (5 N-5 S, 150 W-90 W), Niño-3.4 (5 N-5 S, 170 W-120 W), Niño-4 (150º W-160º E and 5º N-5º S)]. (Source: Climate Prediction centre, NOAA, USA). 48

57 Fig. 4.2: Monthly SST anomalies in the Indo-Pacific region for May to September Monthly anomalies of sea surface temperature (SST) for the period May to September are shown in Fig.4.2. As seen in Fig.4.1, during May weak positive SST anomalies were observed in the eastern and western equatorial Pacific indicating ENSO neutral condition. There was a slight increase in above average SSTs over eastern equatorial Pacific during the month of June and July months. In August, the negative SST anomaly appeared over eastern equatorial pacific and in September it strengthened to weak La Niña conditions. 49
58 Fig. 4.3: The time series of Dipole Mode Index (DMI) representing Indian Ocean Dipole Condition (Source: IOC) from October 2009 onwards. Indian Ocean It is seen in the Fig.4.2 that the basin wide warming of Indian Ocean through out the monsoon season with weak positive SST anomaly over the western equatorial Indian Ocean. The Fig.4.3 shows the time series of Dipole Mode Index (DMI) from October The DMI represents the intensity of the IOD defined as the anomalous SST gradient between the western equatorial Indian Ocean (50 o E-70 o E and 10 o S-10 o N) and the south eastern equatorial Indian Ocean (90 o E-110 o E and 10 o S-0 o N). The IOD index was in the positive side during entire monsoon season. It is seen from the Fig.4.3 that IOD index strengthened through out the season and crossed threshold value of 0.5 in the later part of the season. 4.2 OLR anomalies Monthly spatial distribution of Outgoing Long wave radiation (OLR) anomalies during June to September months is shown in Fig The negative (positive) OLR anomalies indicate above (below) normal convection. In the month of June, negative OLR anomalies were observed over north Arabian Sea and North. The magnitude of maximum negative anomaly more than 30 W/m 2 observed over Western North pacific. The positive OLR anomalies were seen over south Arabian Sea and Indian peninsular region. Negative anomalies exceeding 10 W/m 2 were observed over equatorial Indian Ocean indicate ITCZ was more south of its normal position. A weak dipolar convective pattern generally observed in associated with negative IOD, with the negative OLR anomaly region over equatorial east Indian Ocean and positive OLR anomaly over west. The positive OLR anomalies over equatorial west Pacific indicated that below normal convection associated with weak La Niña. The strength of convective pattern associated with the weak La Niña increased with progress of monsoon season. 50


59 Fig. 4.4: Monthly OLR anomalies during June to September Fig. 4.5: OLR anomaly overlay with 850hPa wind during June to September 2011 During the month of July the negative OLR anomalies were observed over Eastern Arabian Sea and South Bay of Bengal and The positive OLR anomaly observed over head bay of Bengal, Gangetic West Bengal and North Eastern part of the Country. The negative OLR anomalies observed over entire Western North Pacific with more than 35 W/m 2. The positive OLR anomalies over southeast Indian ocean were increased. As a whole, the July OLR anomaly pattern over Indian region showed improved convective activity. The similar 51
60 OLR anomaly pattern was observed during August and increased convective activity over Indian region. In August, OLR anomalies over entire country become negative. In August a weak positive IOD pattern with above normal convective activity in the west Indian Ocean and below normal in the eastern side. This positive IOD pattern strengthens in the month of September and the OLR anomalies were above normal values most part of the country except peninsular region. The OLR anomalies averaged over the season (June to September) is shown in the Fig.4.5. The positive OLR anomaly associated with La Nina condition is seen in the season average. Over Indian region, the OLR anomalies were negative except central Indian region. A weak positive IOD pattern is seen in the equatorial Indian Ocean with positive anomalies exceed 30 W/ m Lower and Upper Tropospheric Circulation Anomalies The wind anomalies at 850 hpa for the month of June to September are shown in Fig During June, the most significant feature is the strong anomalous cross equatorial flow over Arabian Sea and westerly winds over Indian peninsula. This caused enhance rainfall activity over Indian region. During July an anti cyclonic circulation centered at 78 o E and 25 o N, as a result the week anomalous easterlies over north India. As a result decrease rainfall activity over Indian region. Another weak anomalous cyclonic circulation over western Arabian Sea near Somali cost. In August anomalous cyclonic circulation over western Arabian Sea persists and weak anomalous cyclonic circulation over north eastern Arabian Sea. During September, strong cross equatorial flow over Arabian Sea and westerly winds over Indian peninsula. The Fig. 4.7 show wind anomalies at 200 hpa. In June, anomalous cyclonic circulation over Pakistan as a result anomalous northerly wind north of Indian region. This indicates more western disturbance over north India. Another anomalous anti cyclonic circulation observed over Tibet. In July, a weak anomalous anticyclone was seen over Tibet and strong anomalous westerly wind over south peninsula. During the subsequent month anomalous westerly wind over south peninsular India persists. An upper air cyclonic circulation observed over China. In September weak anomalous westerly wind prevailed over peninsular India, which indicates weak sub tropical easterly Jet stream. In the season averaged (June-September) 850 hpa wind anomaly (Fig.4.8) strong cross equatorial flow over Arabian Sea and the season averaged weak 200 hpa westerly wind anomalies over equatorial Indian Ocean and south peninsula indicate weak subtropical easterly jet stream. 52

 September, 2011.")
 September, 2011")
61 Fig. 4.6: Wind Anomalies at 850 hpa during a) June b) July c) August and d) September, Fig. 4.7: Wind Anomalies at 200 hpa during a) June b) July c) August and d) September,

62 Fig. 4.8: Wind anomalies at 850 and 200 hpa during monsoon season (June to September) Meridional Circulation Anomalies over Indian Region To examine the changes in the meridional circulation over Indian region during the monsoon season, latitude height cross section of vertical velocity (omega) anomalies averaged over longitudinal zone of 70 o E-90 o E was plotted for the monsoon season (Fig.4.9). It can be seen that there are two anomalous meridional circulation cells over Indian monsoon region, one circulation having ascending branch south of about 25 o N and descending branch over the latitude 10 o S south of Indian ocean. Another meridional cell with its ascending branch near 40 o N and descending branch over 30 o N were also observed. Figure 4.10 which depicts the monthly meridional circulation anomaly over Indian monsoon region during June to September. Fig. 4.9: Vertical cross-section of Pressure vertical velocity overlay with Meridional vertical circulation for the monsoon season (June-September 2011). Pressure vertical velocity (Omega) are shaded. The anomalies are averaged over longitudes 70 o E to 90 o E. 54

63 Fig. 4.10: Latitude Height Circulation Cross-section and Omega during a) June and b) July c) August and September Pressure vertical velocity (Omega) are shaded. The anomalies are averaged over longitudes 70 o E to 90 o E. It can be seen that during June and August month strong descending motion around 30 o N. Where as ascending motion around 40 o N was prominent during July and September months Important global and regional features that influenced the rainfall pattern over Indian region Seasonal rainfall map for 2011 monsoon season is shown in Fig It can be seen that only 3 subdivisions in the northeastern part of the country has deficit seasonal rainfall. The rainfall was excess in 6 subdivisions in the northwest and west cost and remaining 26 subdivisions received normal rainfall. Even though most parts of the country received normal or excess rainfall, there were large intra-seasonal fluctuations during the season. Rajeevan et al. (2008) have shown that the break and active spells can be defined based on the rainfall over a critical area over central India which they called as monsoon zone. The Fig.4.12 shows the time series of standardized rainfall anomaly over core monsoon region. There were very less rainfall activity during the month of July and very good rainfall activity in the second half of the season (August and September). Based on spatial and temporal rainfall anomaly figures, seasonal rainfall pattern can be summarizes as i) the season rainfall was normal/excess over most part of the country except three subdivisions in the north eastern part, ii) country received more rainfall during 55

64 the second half of the season and iii) country received deficient rainfall during the month of July. The probable global and regional factors that caused good monsoon rainfall activity over India are reemergence of La Niña in the second part of the season, weak positive IOD over Indian Ocean, favorable MJO activity and formation of more number of synoptic scale low pressure systems over the Indian region. Even though there was warming trend in SSTs over east pacific in the beginning of the monsoon season, sudden cooling and reemergence of La Niña condition was observed in the second half of the season. Influence of La Niña events on monsoon is well known and discussed in details in Chapter 4 of last year monsoon report. The subdivision wise rainfall anomaly composite map for monsoon season corresponding to 12 La Niña years (for period ) shown in Figure In this figure, the negative (positive) anomalies are shaded in red (green) colour. The composite pattern shows that most of the subdivisions were positive anomaly. Fig. 4.11: Subdivisional rainfall map of 2011 monsoon season. 56
65 STANDARDISED RAINFALL FOR MONSOON ZONE (2011) 1-Jun 6-Jun 11-Jun 16-Jun STD. RF Jun 26-Jun 1-Jul 6-Jul 11-Jul 16-Jul 21-Jul 26-Jul 31-Jul 5-Aug 10-Aug 15-Aug 20-Aug 25-Aug 30-Aug 4-Sep 9-Sep 14-Sep 19-Sep 24-Sep 29-Sep D A T E Fig. 4.12: Time series of standardised rainfall anomaly for core monsoon zone for the monsoon Fig. 4.13: The composite subdivision wise rainfall anomaly map for La Niña years for the period The rainfall anomalies are expressed as the percentage departure from the long period average. 57
66 Fig. 4.14: Composite sub-division wise rainfall anomalies for years when the IOD was in positive phase during the period The rainfall anomalies are expressed as the percentage departure from the long period average. Fig. 4.15: The Phase-space diagram depicting MJO index during monsoon season The encircle number inside 8 sectors of the diagram represent 8 Phases of MJO in the diagram. Line in different colours for different months, June (red), July(purple), August(green), September(blue). 58

 and green(phase 5 & 6). Light colour indicates amplitude is weak and dark shade indicates MJO active.")
67 Fig. 4.16: The track of synoptic scale systems formed in Bay of Bengal during the period 1951 to Fig. 4.17: The dates of synoptic scale systems ( lows in blue colour and Depressions in red) formed over North Indian Ocean during 2011 monsoon season and various MJO phase are shown in different shades of purple (phase 1 & 2) and green(phase 5 & 6). Light colour indicates amplitude is weak and dark shade indicates MJO active. As seen in the Fig. 4.3, a weak positive IOD was persisting through out the monsoon season and even crossed the threshold value in the end of monsoon season. Ashok and Saji (2007) have observed that IOD events influence monsoon rainfall over India. A composite of subdivision wise rainfall anomaly map of monsoon years when IOD was positive was prepared and shown in Fig In this figure the negative (positive) anomalies are shaded red (green). It is seen that entire north eastern part of the country was negative rainfall anomaly. These two composite figures indicate that the observed negative rainfall anomalies over subdivisions in the north eastern part of the country may be due to combined influence of La Niña and positive IOD observed during the season. 59
68 Another important tropical variability namely MJO also modulate the summer monsoon over India. Pai et al (2011) studied the impact of MJO on the intra-seasonal variation of summer monsoon rainfall. The two dimensional (RMM1, RMM2) phase diagram (Wheeler and Hendon (2004)) during 2011 monsoon season is shown in Fig It is seen that except in September month, the MJO was strong and located over Africa (phase 1), Indian Ocean and Western equatorial Indian Ocean. Pai et al (2011) observed that MJO phase 1 and 2 are unfavorable for monsoon rainfall activity. It can be seen in figure in the beginning of July month and middle of august month MJO phase was in phase 1 and 2 which is not favorable for monsoon rainfall over central India as seen in Fig One of the most important features observed during 2011 monsoon season was formation of more number of synoptic scale Low pressure systems (LPS). These low pressure systems help to improve monsoon circulation and give good rainfall over the country. Fig shows the tracks of low pressure systems formed over Bay of Bengal during the period 1951 to As seen in the Fig. 4.16, the low pressure systems in general move along the northwest tracks through the monsoon trough zone. This monsoon season (June September), four depressions were formed as against the normal of 4-6 monsoon depressions per season. In all 10 low pressure areas formed during the season. Figure 4.17 shows dates of synoptic scale systems ( lows in blue colour and Depressions in red) formed over North Indian Ocean during 2011 monsoon season and various MJO phase are shown in different shades of purple (phase 1 & 2) and green(phase 5 & 6). Light colour indicates amplitude is weak and dark shade indicates MJO active. It is seen that all the depression formation are happened during the MJO phase 5 and 6 as mentioned in Pai et al (2011). Another observed feature is that during the month of July most of the days MJO phase was in 1 and 2 which is unfavorable for rainfall over central India as seen in Fig All the low pressure areas which formed in the second half of the monsoon season had prolonged life spans can also notice from the figure. References Ashok K, and N. H. Saji (2007). On the impacts of ENSO and Indian Ocean dipole events on sub-regional Indian summer monsoon rainfall. Nat. Hazards. 42: Pai, D. S, J. Bhate, O. P. Sreejith and H. R. Hatwar, (2011) Impact of MJO on the intra seasonal variation of the summer monsoon rainfall over India, Climate Dynamics, Volume 36, N-12, pp 41-55, DOI /s Rajeevan M., S. Gadgil and J. Bhate, (2008), Active and Break spells of Indian Summer monsoon, NCC research report, 7. Wheeler MC, Hendon HH (2004). An all-season real time multivariate MJO Index: Development of an index for monitoring and prediction. Mon Weather Rev. 132,
69 5 Performance of Operational NWP Short Range Forecasts Southwest Monsoon 2011 D. R. PATTANAIK 1 AND ANANDA K. DAS India Meteorological Department, New Delhi 1 - pattanaik_dr@yahoo.co.in The chapter discusses the verification of the short range weather forecast (up to 3 days) based on the IMD's operational run of Advanced Research Weather Research Forecast (WRF-ARW) model. The daily rainfall forecast from the model at various time scales such as 24 hrs, 48 hrs and 72 hrs were examined for the purpose. 5.1 Introduction For the purpose of short to medium range weather forecasting IMD run operationally, the global model known as Global Forecast System (GFS; here after known as IMD GFS) and the regional model known as the Advanced Research Weather Research Forecasting (WRF-ARW). Since 2010 the GFS is run for 7 days and the regional model WRF-ARW for 3 days forecast. The IMD GFS is run at T382L64 resolution implemented at IMD HQ on IBM based High Power Computing Systems (HPCS). In horizontal, it resolves 382 waves ( 35 Km) in spectral triangular truncation representation (T382), for which the Gaussian grid of 1152 x 576 dimensions are used. A relatively higher resolution version GFS (T574) is also run during 2011 monsoon on experimental basis. The model has 64 vertical levels (hybrid; sigma and pressure). After pre-processing of the data (Global Telecommunication System and also other sources) the PREPBUFR file is created and subsequently the Global Data 61
70 Assimilation System (GDAS) cycle runs 4 times a day (00, 06, 12 and 18 UTC). The assimilation system is a global 3-dimensional variational technique, based on NCEP s Grid Point Statistical Interpolation (GSI) scheme and the forecast is generated for 7 days. In addition to the above global model the regional meso-scale analysis system the WRF-ARW is also running operationally in IMD, Delhi particularly for short range weather forecasting with its all components i.e. pre-processing programs (WPS and REAL), observation assimilation program (WRF-Var), boundary condition updation (update_bc) and forecasting model (WRF). In the current WRF-Var assimilation system, all conventional observations over a domain (20S to 45N; 40E to 115E), which merely cover RSMC, Delhi region are considered to improve the first guess of GFS analysis. Assimilation is done with 27 km horizontal resolution and 38 vertical eta levels. The boundary conditions from GFS forecasts run at IMD are updated to get a consistency with improved meso-scale analysis. WRF model is then integrated for 75 hours with a nested configuration (27 km mother and 9 km child domain) and with full physics (including cloud microphysics, cumulus, planetary boundary layer and surface layer parameterization). The WRF model is being used widely for analysing the high impact weather events such as the heavy rainfall associated with the monsoon depression and also the track of tropical cyclone (Pattanaik & Rama Rao 2009; Pattanaik et al., 2011; Pattanaik and Das 2010, Anil et al., 2010). During 2009 IMD was also running the other Meso-scale model (MM5) and the analysis of the short range forecast for monsoon 2009 was discussed in Pattanaik et al., (2010). Das et al. (2010) discussed about the WRF data assimilation and WRF-ARW modelling system in IMD and the forecast errors of different meteorological variables while discussing the performance of monsoon in Objective of the present study The southwest monsoon rainfall during June to September, 2011 was one of the good monsoon year during recent time with all India rainfall received was about 102% of its long period average (LPA) of 89 cm. One of the important features of 2011 monsoon season was that the entire monsoon was not having any long dry spells of monsoon like that is seen during the recent drought year of The monsoon of 2011 is associated with strong cross equatorial flow during most parts of June, first half of September and the cross equatorial flow also maintained its strength all through the month of August. However, during July it was weak during the first fortnight. Though there had been certain periods of subdued rainfall activity during the season in different spatial and temporal scales, there was no all India break monsoon condition during this year. Four depressions and ten low pressure systems formed during the season. Out of the 4 depressions, two Depressions (that formed on 11th June over Arabian Sea & the other during 22nd -23rd, July over land) had a short life span. The Depression formed during 16th -23rd, June and its subsequent west 62
71 northwestward movement was responsible for the advance of the monsoon over the most parts of the country. August received good rainfall associated with four low pressure areas formed during the month, which had prolonged life spans. The fourth Depression formed towards the end of the season (22nd 23rd, Sept.) weakened before moving towards northeast. The depression of September and two low pressure areas (6th -13th and 13th- 19th) during September contributed good rainfall in the month of September. In order to see the performance of short range forecasting during the monsoon season of 2011, the Day-1, Day-2 and Day-3 forecasts valid for all 122 days of the season from 1 st June to 30 September, 2011 for the variables like low level wind, mean forecast rainfall, mean error and RMSE of different variables are analysed to understand the strengths and limitations of WRF-ARW in short range forecasting of monsoon during In addition, the monsoon season also witnessed many days with heavy rainfall events associated with formation and movement of synoptic scale systems. In order to analyse the strength of the model in simulating these heavy rainfall episodes, some selected cases are identified to verify 24 hr forecast, 48 hr forecast and 72 hr forecasts from the operational forecast of WRF- ARW model. 5.3 Verification of Mean Monsoon Flow and Mean Rainfall Patterns In order to see the performance of the model particularly for 850 hpa wind and rainfall with respect to Day-1, Day-2 and Day-3 forecast on monthly scale from June to September the mean 850 hpa wind for Day-1, Day-2 and Day-3 forecast along with that of analysis 850 hpa mean wind is shown in Fig. 5.1 to Fig. 5.4 respectively. The analysis patterns of 850 hpa wind during June, 2011 (Fig. 5.1a) shows very clearly the low level monsoon circulation over the Arabian Sea and the Bay of Bengal along with monsoon trough and the easterly in the north of the monsoon trough. The corresponding WRF-ARW forecast wind at 850 hpa level valid for Day-1, Day-2 and Day-3 forecast in entire June from WRF- ARW model as shown in Figs. 5.1b-d also clearly captured the low level south-westerly flow over the Arabian Sea and the monsoon easterly in the north of monsoon trough location just like the analysis patterns shown in Fig. 5.1a. It is, however, seen from Fig. 5.1b-d that the low level jet is overestimated in the model forecasts both in the Arabian Sea as well as over the Bay of Bengal in its forecasts for 24hr, 48hr and 72hr. 63
 Mean 850 hpa wind analysis during 1-30 June 2011 along with WRF-ARW forecast mean wind during June, 2011 valid for (b) Day-1 (24 hr) forecast, (c) Day-2 (48 hr) forecast and (d) Day-3 (72 hr)")
. The corresponding forecast mean wind for July 2011 also witnessed relatively stronger monsoon westerly over the Arabian Sea as well as over the Bay of Bengal in its forecasts valid for Day-1,")

72 (a) (b (c (d Fig. 5.1 : (a) Mean 850 hpa wind analysis during 1-30 June 2011 along with WRF-ARW forecast mean wind during June, 2011 valid for (b) Day-1 (24 hr) forecast, (c) Day-2 (48 hr) forecast and (d) Day-3 (72 hr) forecast. The month of July 2011 was associated with weaker monsoon flow as reflected in the analysis 850 hpa wind with western end of the monsoon trough to the north of the normal position (Fig. 5.2a). The corresponding forecast mean wind for July 2011 also witnessed relatively stronger monsoon westerly over the Arabian Sea as well as over the Bay of Bengal in its forecasts valid for Day-1, Day-2 and Day-3 (Fig. 5.2b-d), although the monsoon trough was well captured in the forecasts valid for all the three days of forecast. The month of August 2011 witnessed stronger monsoon conditions as seen by relatively southward position of the monsoon trough (Fig. 5.3a), which was clearly demonstrated in the WRF- ARW model forecast valid for Day-1, Day-2 and Day3 (Fig. 5.3b-d). The low level westerly jet is again stronger than observation over the Arabian Sea and the Bay of Bengal in its forecast winds valid for Day-1, Day-2 and Day-3 forecasts (Fig. 5.3b-d), when compared with that of the analysis (Fig. 5.3a). 64


73 During the month of September, 2011 the withdrawal from northwest India was delayed and good rainfall activities prevailed over many parts of the country associated with stronger monsoon circulation and is reflected by cyclonic circulations over the eastern part of India and over the Gujarat region (Fig. 5.4a). In the forecast fields from WRF-ARW model it also captured very well the stronger monsoon circulation patterns associated with cyclonic circulations in the east and western region (Fig. 5.4b-d) like that is seen in the analysis (Fig.5.4a). However, like other months, September also witnessed relatively stronger monsoon westerly over the Arabian Sea and the Bay of Bengal (Fig. 5.4b-d) in the WRF- ARW forecast fields. Thus, the strengthening of monsoon westerly in the forecast is the systematic error in the WRF-SRW model and the errors are increasing with increasing forecast hour from Day-1 forecast to Day-3 forecast. (a (b (c (d Fig. 5.2 : (a) Mean 850 hpa wind analysis during 1-30 July 2011 along with WRF-ARW forecast mean wind during July, 2011 valid for (b) Day-1 (24 hr) forecast, (c) Day-2 (48 hr) forecast and (d) Day-3 (72 hr) forecast. 65
 Mean 850 hpa wind analysis")

 Day-2 (48 hr) forecast")
74 (a (b (c (d Fig. 5.3 : (a) Mean 850 hpa wind analysis during 1-30 August 2011 along with WRF- ARW forecast mean wind during August, 2011 valid for (b) Day-1 (24 hr) forecast, (c) Day-2 (48 hr) forecast and (d) Day-3 (72 hr) forecast. 66
 Mean 850 hpa wind analysis during 1-30 September 2011 along with WRF- ARW forecast mean wind during September, 2011 valid for (b) Day-1 (24 hr) forecast, (c) Day-2 (48 hr) forecast and (d)")


. Thus, the June forecasts with WRF-ARW performed well when compared to observations.")
75 (a (b (c (d Fig. 5.4 : (a) Mean 850 hpa wind analysis during 1-30 September 2011 along with WRF- ARW forecast mean wind during September, 2011 valid for (b) Day-1 (24 hr) forecast, (c) Day-2 (48 hr) forecast and (d) Day-3 (72 hr) forecast. The corresponding observed mean rainfall on monthly scale from June to September during the monsoon season of 2011 along with the WRF-ARW model forecasts for Day-1, Day-2 and Day-3 is shown in Fig. 5.5, Fig. 5.6, Fig. 5.7 and Fig. 5.8 respectively. As seen from Fig. 5.5a the onset phase of June mainly received rainfall over eastern parts of India, west coast and parts of north India. The corresponding forecasts cumulative rainfall for June valid for Day-1, Day-2 and Day-3 forecasts (Fig. 5.5b-d) also captured the mean patterns very well with almost it matches with the observed patterns except slight overestimation of the west coast rainfall in the WRF-ARW forecasts when compared with observations (Fig. 5.5a). Thus, the June forecasts with WRF-ARW performed well when compared to observations. July 2011 received less than normal rainfall as seen also in the observed rainfall pattern (Fig. 5.6a) with only northern parts of west coast and parts of central India received good rainfall. The corresponding forecast rainfall in the WRF-ARW model indicated over estimation of rainfall forecast even in Day-1 forecast (Fig. 5.6b), where entire west coast and the central and eastern parts of India received higher mean rainfall compared to the observation. The overestimation of rainfall is gradually increasing in Day-2 and Day-3 forecast (Fig. 5.6c-d), compared to Day-1 forecast. Thus, the error in rainfall amount is 67
 when compared with observations (Fig. 5.7a). Similar systematic error even persists in the month of September 2011 with positive bias over west coast, central India and eastern India (Fig. 5.8b-d) when compared with that of observed pattern (Fig.")
76 increasing with the increase in forecast hours. Like July 2011 the month of August 2011 also has the same problem with overestimation of rainfall in its forecast for Day-1, Day-2 and Day-3 (Fig. 5.7b-d) when compared with observations (Fig. 5.7a). Similar systematic error even persists in the month of September 2011 with positive bias over west coast, central India and eastern India (Fig. 5.8b-d) when compared with that of observed pattern (Fig. 5.8a). It is observed that the errors are seems to be higher during July and August months, whereas, comparatively less in June and September. The errors in the mean forecast rainfall from WRF-ARW model (overestimation of rainfall) are found to be consistent with the systematic errors in the low level monsoon flow shown in Fig. 5.1 to Fig Mukhopadhyay et al., (2010) made a detailed study on Indian Summer Monsoon Precipitation Climatology using WRF model to investigate the impacts of convective Parameterization on Systematic Biases in the model. (a (b (c (d Fig. 5.5 : (a) Observed cumulative rainfall (cm) valid for June, (b) WRF-ARW cumulative rainfall of June for day 1 forecast, (c) WRF-ARW cumulative rainfall of June for day 2 forecast, and (d) WRF-ARW cumulative rainfall of June for day 3 forecast. 68
 WRF-ARW cumulative rainfall of July for day 1 forecast, (c) WRF-ARW cumulative rainfall of July for day 2 forecast, and (d)")
77 (a (b (c (d Fig. 5.6 : (a) Observed cumulative rainfall (cm) valid for July, (b) WRF-ARW cumulative rainfall of July for day 1 forecast, (c) WRF-ARW cumulative rainfall of July for day 2 forecast, and (d) WRF-ARW cumulative rainfall of July for day 3 forecast. 69
 WRF-ARW cumulative rainfall of August for day 1 forecast, (c) WRF-ARW cumulative rainfall of August for day 2 forecast, and (d)")
78 (a (b (c (d Fig. 5.7 : (a) Observed cumulative rainfall (cm) valid for August, (b) WRF-ARW cumulative rainfall of August for day 1 forecast, (c) WRF-ARW cumulative rainfall of August for day 2 forecast, and (d) WRF-ARW cumulative rainfall of August for day 3 forecast. 70
 WRF- ARW cumulative rainfall of September for day 1 forecast, (c) WRF-ARW cumulative rainfall of September for day 2 forecast, and (d) WRF-ARW cumulative rainfall of September for day 3 forecast.")
79 (a (b (c (d Fig. 5.8: (a) Observed cumulative rainfall (cm) valid for September, (b) WRF- ARW cumulative rainfall of September for day 1 forecast, (c) WRF-ARW cumulative rainfall of September for day 2 forecast, and (d) WRF-ARW cumulative rainfall of September for day 3 forecast. 5.4 Verification of day to day variation of monsoon rainfall With respect to the day-to-day variation of observed and forecast rainfall during the period of monsoon season 2011, the daily observed rainfall averaged over entire Indian region in 2011 is compared with the long term daily climatology of rainfall over entire India and the daily forecast rainfall from WRF-ARW in 2011 monsoon season. The observed rainfall, climatology normal of all Indian rainfall and the WRF-ARW forecast rainfall over the country as a whole during the season in shown in Fig. 5.9a, Fig. 5.9b and Fig. 5.9c valid for 71
80 Day-1, Day-2 and Day-3 forecast respectively. During the Day-1 forecast although the pattern of rainfall from weaker to stronger and vice versa (fluctuation in rainfall within season) is well captured in the model, however, it over-estimates the rainfall over the country as a whole with the day to-day forecast rainfall is much higher than both the corresponding observed rainfall during 2011 and the normal rainfall (Fig. 5.9a) and the overestimation is found to be very large during the active months of August and September The month of June and July in 2011 are relatively better captured in the Day-1 forecast rainfall when compared to the observed in case of day-to-day variation of rainfall In case of Day-2 forecast rainfall it also captures the patterns of high and low rainfall during different periods of the season and the overestimation of forecast rainfall is also noticed during most parts of the season with dominants patterns during August and September (Fig. 5.9b). In case of Day-3 forecast the patterns of high and low rainfall periods are not very well captured in the forecast (Fig. 5.9c) when compared with the observed patterns of daily rainfall. Another difference that is noticed in case of Day-3 forecast rainfall (Fig. 5.9d) is that on many days the forecast rainfall is much higher than the observed rainfall and even on some occasions it is less than the observed rainfall, which indicates the errors are more systematic in nature in case of Day-1 and Day-2 forecasts, whereas, in case of Day-3 forecast is most likely dominated by large random errors. Again comparing the Day-1 and Day-2 forecast from Fig. 5.9a and Fig. 5.9b it is seen that the rainfall overestimation is much higher in Day-1 forecast particularly during August and September compared to that of Day-2 forecast. Thus, as a whole on all India basis the forecast for Day-2 is seems to be better than both Day-1 and Day-3 forecast in case of day-to-day variation of daily rainfall. However, it requires further analysis to substantiate this. 72

 Day-1 forecast, (b)")
81 (a) Day-1 forecast (b) Day-2 f t (c) Day-3 f t Fig. 5.9 : All India daily area averaged observed rainfall from 1 st June to 30 September 2011 along with climatology daily normal rainfall over India and WRF-ARW forecast rainfall averaged over India based on (a) Day-1 forecast, (b) Day-2 forecast and (c) Day-3 forecast. 73
82 5.5 Mean errors and RMSE of low level monsoon wind As seen above the forecast wind and forecast rainfall from WRF-ARW has witnessed systematic errors and there by produces stronger low-level monsoon current and also positive bias in the rainfall patterns. These patterns are consistently seen in all the four months from June to September, In order to quantify the errors in the WRF-ARW forecast with respect to the zonal wind at 850 hpa level the mean error (Forecast analysis) in zonal wind at 850 hpa level for Day-1, Day-2 and Day-3 forecast valid for the entire season along with the Root Mean Square Error (RMSE) of the same is shown in Fig As seen from Fig. 5.10a the mean error in the westerly is of the order of 6 m/sec over the Arabian Sea and about 2 m/sec in the main land of India south of about 22N, indicating a stronger monsoon westerly in the WRF-ARW model. Over the northern India the mean error is negative of the order of 1 m/sec indicates stronger easterly over the region. Thus, the stronger monsoon circulation is observed in the WRF-ARW model forecast even at Day-1 forecast. In the Day-2 and Day-3 (Fig. 5.10c and Fig. 5.10e) forecast although the magnitude of the error (6 m/sec) in westerly is of the same order as in Day-1 forecast but the spatial coverage increases in the Ocean parts with more regions indicating this error. Over the land region also the magnitude of positive error increases to about 6 m/sec along with its northward extension upto around 28N. That means model forecasts stronger westerly almost over entire India south of 28N along with the stronger easterly in the northern India particularly in Day-2 and Day-3 forecast. Thus, there is a systematic westerly bias in the model in most parts of India (mainly south of the monsoon trough) and also easterly bias in the northern parts of the country there by contributing to stronger monsoon circulation and the errors are found to be less in case of Day-1 forecast but higher during Day-2 and Day-3 forecast. The corresponding RMSE of zonal wind at 850 hpa (Fig. 5.10b, Fig. 5.10d and Fig. 5.10c) also indicate RMSE of the order of about 1 m/sec in most parts of India in case of Day-1 forecast (Fig. 5.10b), whereas, it is of the order of 5 to 7 m/sec in most parts of India in case of Day-2 and Day-3 forecast (Fig. 5.10d & Fig. 5.10f). 74
 (c) Mean error in")
 (e) Mean error in U850 (Day-3")
 and RMSE (m/sec)")

 Mean error (Day-2), (d) RMSE (Day-2),")
83 (a) Mean error in U850 (Day-1 forecast) (b) U850 RMSE (Day-1 forecast) (c) Mean error in U850 (Day-2 forecast) (d) U850 RMSE (Day-2 forecast) (e) Mean error in U850 (Day-3 forecast) (f) U850 RMSE (Day-3 forecast) Fig : Mean error (m/sec) and RMSE (m/sec) in 850 hpa level zonal wind forecast from WRF model. (a) Mean error (Day-1), (b) RMSE (Day-1), (c) Mean error (Day-2), (d) RMSE (Day-2), (e) Mean error (Day-3) and (f) RMSE (Day-3), 75
84 5.6 Heavy rainfall events associated with synoptic systems Associated with the synoptic systems, (low pressure areas, monsoon depressions, active monsoon trough etc.) heavy rainfall received on many days of the monsoon season In order to see the performance of capturing these heavy rainfall events associated with synoptic scale systems the following three cases are analysed in the WRF-ARW forecast against the observed rainfall patterns. Case-1 : Deep depression during June 2011 Associated with the formation of a Deep Depression during June over the northwest Bay of Bengal and its gradual west-northwestward movement the monsoon covered most parts of the country outside western parts of Rajasthan and north Gujarat state. This system also contributed heavy rainfall over parts of India. The cumulative rainfall (cm) associated with this system during the period June, 2011 shows most of the rainfall along the track of the system and is over Madhya Pradesh, Jharkhand, Uttar Pradesh, north Orissa, GWB, Bihar (Fig. 5.11a). The corresponding forecast cumulative rainfall valid for same period from June at 24hr forecast, 48hr forecast and 72hr forecast is shown in Fig. 5.11b to Fig. 5.11d respectively. The model is seems to have captured well both the location of the rainfall maxima and its aerial coverage, although, the magnitude is slightly underestimated in the model forecast (Fig. 5.11b-d) compared to the observation particularly in 24hr forecast. In order to compare the single day rainfall associated with this system the observed one day rainfall (mm) valid for 21 st June (Fig. 5.12a) clearly shows heavy rainfall located over north Madhya Pradesh and southern parts of east UP. The Day-1, Day-2 and Day-3 forecast rainfall from WRF-ARW valid for 21 st June 2011 is shown in Fig. 5.12b - Fig.5.12d, which shows although the forecast rainfall maximum is in proper location, its amount is underestimated compared to observation particularly for Day-1 and Day-2 forecast (Fig. 5.12b & Fig. 5.12c). In case of Day-3 forecast the magnitude of rainfall is closer to that of observed rainfall amount, however, the location is to the east of actual maximum (Fig. 5.12d). Thus, although in the mean rainfall patterns the forecast rainfall is overestimated the heavy rainfall associated with monsoon system is underestimated in the model forecast. As it is seen from the previous discussion in case of entire monsoon season the mean rainfall overestimation increases gradually with the forecast hour, however, in case of heavy rainfall events it underestimates in Day-1, Day-2 and Day-3 forecasts with some time Day-3 forecast is more closer to the observed amount of rainfall. 76
 Observed cumulative rainfall (cm) based on period 16-22 June, 2011 along with (b) 24hr, (c) 48hr and (d) 72hr forecast cumulative rainfall from WRF-ARW model forecast.")
85 (a) Cumulative obs rainfall Jun (cm) (b) Cumulative rainfall (cm) Day-1 forecast (c ) Cumulative rainfall (cm) Day-2 forecast (d)cumulative rainfall (cm) Day-3 forecast Fig. 5.11: (a) Observed cumulative rainfall (cm) based on period June, 2011 along with (b) 24hr, (c) 48hr and (d) 72hr forecast cumulative rainfall from WRF-ARW model forecast. 77
 valid for (a) 21 June 2011 and corresponding WRF- ARW forecast rainfall valid for 21 June, 2011 (b) 24hr forecast (c) 48hr")


 in three days from 21-23 July, 2011 valid for Day-1 and Day-2 forecast mainly underestimated the")
86 (a) observed one day rainfall (21 st June) (b) 24 hr forecast from WRF-ARW (c ) 48 hr forecast from WRF-ARW (d) 72 hr forecast from WRF-ARW Fig :Observed rainfall (mm) valid for (a) 21 June 2011 and corresponding WRF- ARW forecast rainfall valid for 21 June, 2011 (b) 24hr forecast (c) 48hr forecast and (d) 72hr forecast. Case-2 : Land Depression during July, 2011 The month of July 2011 received less than normal rainfall and the cross equatorial flow was subdued in the first fortnight of July. A land depression formed over the Jharkhand region gave good rainfall of the order of 20 to 30 cm during the period from July over north Madhya Pradesh and adjoining Uttar Pradesh (Fig. 5.13a). The corresponding cumulative forecast rainfall (cm) in three days from July, 2011 valid for Day-1 and Day-2 forecast mainly underestimated the rainfall amount as seen in Fig. 5.13b and Fig. 5.13c respectively. In case of Day-3 forecast rainfall from WRF-ARW model valid for the period from July, 2011 a small pocket with cumulative rainfall of the order to 20 to 30 cm (Fig. 5.13d) is forecasted like the observed rainfall, whereas, on bigger areas the rainfall amount is underestimated. 78
.")
, however, it is underestimated in the model when compared with observation (Fig. 5.14a).")
87 In order to compare the one day rainfall of 23 July, 2011 associated with this system the observed rainfall of 23 rd July and the forecast rainfall valid for the same day with Day-1, Day-2 and Day-3 forecast is shown in Fig. 5.14a-d. The observed rainfall of 23 rd July of the order of 7-13 cm is seen over north Madhya Pradesh and neighbourhood (Fig. 5.14a). The location of the peak rainfall amount in terms of Day-1, Day-2 and Day-3 forecast is well captured in the WRF-ARW forecast (Figs. 5.14b-d), however, it is underestimated in the model when compared with observation (Fig. 5.14a). (a) Cumulative obs rainfall Jul (cm) (b) Cumulative rainfall (cm) Day-1 forecast (c ) Cumulative rainfall (cm) Day-2 forecast (d) Cumulative rainfall (cm) Day-3 forecast Fig. 5.13: (a) Observed cumulative rainfall (cm) based on period July, 2011 along with (b) 24hr, (c) 48hr and (d) 72hr forecast cumulative rainfall from WRF-ARW model forecast. 79

 48hr forecast and (d) 72hr forecast.")


88 (a) Observed one day rainfall (23 July) (b) 24 hr forecast from WRF-ARW (c ) 48 hr forecast from WRF-ARW (d) 72 hr forecast from WRF-ARW. Fig :Observed rainfall (mm) valid for (a) 23 July 2011 and corresponding WRF- ARW forecast rainfall valid for 23 July, 2011 (b) 24hr forecast (c) 48hr forecast and (d) 72hr forecast. Case-3 : A Depression during September, 2011 The month of September received good rainfall and the withdrawal of monsoon was also delayed in A Depression formed towards the end of September during September, which caused a second spell of flood situation over Orissa and Bihar. The system dissipated before moving towards northeast region. The cumulative observed rainfall (cm) associated with this system valid for three days from September, 2011 (Fig. 5.15a) shows main rainfall belt over north Orissa and adjoining south Bihar and Gangetic west Bengal region. The corresponding WRF-ARW forecast rainfall valid for the same period closely matches with the observed pattern particularly for Day-1 and Day-2 forecast 80

 of actual location 15a).")
89 (Fig. 5.15b & Fig. 5.15c), whereas, in case of Day-3 forecast case the main rainfall belt although is captured well in terms of the amount it is placed to the northwest (Fig. 5.15d) of actual location (Fig. 5.15a). (a) Cumulative obs rainfall Sep(cm) (b) Cumulative rainfall (cm) Day-1 forecast (c ) Cumulative rainfall (cm) Day-2 forecast (d) Cumulative rainfall (cm) Day-3 forecast Fig. 5.15: (a) Observed cumulative rainfall (cm) based on period September, 2011 along with (b) 24hr, (c) 48hr and (d) 72hr forecast cumulative rainfall from WRF-ARW model forecast. 81
 valid for (a) 23 September 2011 and corresponding WRF-ARW forecast rainfall valid for 23 September, 2011 (b) 24hr forecast (c) 48hr")

.")
90 (a) Observed one day rainfall (23 Sept) (b) 24 hr forecast from WRF-ARW (c ) 48 hr forecast from WRF-ARW (d) 72 hr forecast from WRF-ARW Fig : Observed rainfall (mm) valid for (a) 23 September 2011 and corresponding WRF-ARW forecast rainfall valid for 23 September, 2011 (b) 24hr forecast (c) 48hr forecast and (d) 72hr forecast. The one day rainfall associated with this depression on 23 rd September, 2011 clearly shows heavy rainfall over north Orissa and adjoining Bihar region valid for the same day (Fig. 5.16a). The corresponding WRF-ARW forecast rainfall valid for same day witnessed the maximum rainfall belt in its forecast for Day-1 and Day-2 (Fig. 5.16b & Fig. 5.16c). But in case of Day-3 forecast, although the maximum rainfall belt is well captured the northwestward extension of the same in the forecast pattern is not matching with the observed rainfall (Fig. 5.16d). This could be due to the deviation of the track of the system in its forecast at Day-3. 82
91 Hence it is observed that on day to day basis the heavy rainfall forecast from the WRF model depends on the path of the forecast tracks of the system, and in general underestimated the heavy rainfall amount particularly for Day-1 (24 hr) and Day-2 (48 hr) forecast and slightly closer to the actual amount in case of Day-3 (72hr) forecast. This is in spite of the mean forecast rainfall being overestimated compared to observation when the entire monsoon season is considered on seasonal or monthly scale. 5.7 Concluding remarks The performance of the WRF-ARW model is evaluated over the Indian region during monsoon season There is a systematic low-level westerly bias in the model in most parts of India (mainly south of the monsoon trough) and also easterly bias in the northern parts of the country there by contributing to stronger monsoon circulation in the model forecast and the errors are found to be less in case of 24hr forecast but larger during Day-2 and Day-3 forecast. The RMSE of zonal wind at 850 hpa also indicates RMSE of the order of about 1 m/sec in most parts of India in case of Day-1 forecast, whereas it is of the order of 5 m/sec to 7 m/sec in most parts of India in case of Day-2 and Day-3 forecast. The patterns in the error in the low level zonal wind is also reflected in individual month forecast during June to September of monsoon season The patterns of systematic errors in the WRF-ARW model is also reflected in the mean rainfall, where the mean forecast rainfall from WRF-ARW model is overestimated compared to observed mean rainfall particularly over the west coast of India, eastern parts of India and also over the central India during monsoon season 2011 on monthly scale from June to September. It is observed that the errors in rainfall forecast is seems to be higher during July and August months, whereas, comparatively less in June and September. It is observed that in case of specific heavy rainfall events of 2011 the forecast from the WRF model depends on the path of the forecast tracks of the system, and in general underestimated the heavy rainfall amount particularly for Day-1 (24 hr) and Day-2 (48 hr) forecast and slightly closer to the actual amount in case of Day-3 (72hr) forecast. This is in spite of the mean forecast rainfall being overestimated compared to observation when the entire monsoon season is considered on seasonal or monthly scale. Since the location of heavy rainfall events mainly depends on the forecast track of the system, further investigation is needed to see the forecast skill of the tracks of the system in the WRF-ARW model. Further analysis is required with more number of years to know about the other systematic errors in the model. 83
92 Acknowledgement The first author is thankful to the Director General of Meteorology for giving this opportunity to write this article. Thanks are also due to the Deputy Director General of Meteorology (NWP) for providing the facility in the section. Authors acknowledged M. Rathee of NWP division for technical helps. Thanks are also due to NCAR, USA developer of WRF modelling system, which runs operationally at IMD. References Anil Kumar, R., Dudhia, J. and Roy Bhowmik, S. K., 2010 : Evaluation of physics options of the Weather Research and Forecasting (WRF) Model to simulate high impact heavy rainfall events over Indian Monsoon region. Geofizika, 27, Das, A. K, M. Rathee, Mansi Bhowmick and Hasmi Fatima, 2011 : WRFDA and WRF-ARW Modelling system at IMD HQ. Annual NWP performance report Ed. Ajit Tyagi, S. K. Roy Bhowmin and S. D. Kotal. Meteorological Monograph No. NWP/Annual Report/01/2011. Mukhopadhyay P., Taraphdar S., Goswami B.N., Krishna Kumar K., 2010 : Indian Summer Monsoon Precipitation Climatology in a High-Resolution Regional Climate Model: Impacts of Convective Parameterization on Systematic Biases. doi: /2009WAF Pattanaik, D. R., A.K. Das And Y. V. Ramarao, 2010 : Performance of operational NWP Short Range Forecasts. Monsoon 2009 Report, Ed. by Ajit Tyagi, H.R.Hatwar and D.S.Pai. IMD Met. Monograph. Synoptic Meteorology No. 11/2010, pp Pattanaik, D. R., and Rama Rao Y. V., 2009 : Track Prediction of Very Severe Cyclone 'Nargis' Using High Resolution Weather Research Forecasting (WRF) Model. Journal of Earth System Science. Vol. 118, Pattanaik, D. R., Anupam Kumar, Y. V. Rama Rao and B Mukhopadhyay, 2011 : Simulation of Monsoon Depression over India Using High Resolution WRF Model Sensitivity to Convective Parameterization Schemes. Mausam, Vol. 62, pp Pattanaik D. R. and Ananda K. Das, 2011 : Performance of Operational NWP Short Range Forecasts Southwest Monsoon Monsoon 2010 Report, Ed. by Ajit Tyagi, A. B. Mazumdar and D.S.Pai. IMD Met. Monograph. Synoptic Meteorology No. 10/2011, pp
93 6 PERFORMANCE OF GLOBAL FORECAST SYSTEM OF IMD IN THE MEDIUM RANGE TIME SCALE DURING SUMMER MONSOON 2011 V. R. Durai and S. K. Roy Bhowmik This chapter discusses the verification of the operational medium range forecast of the rainfall and other characteristics features of 2011 summer monsoon prepared using the Global Forecast System (GFS T-382 & T574) models. 6.1 Introduction The Global Forecast System (GFS), adopted from National Centre for Environmental Prediction (NCEP), at T382L64 (~ 35 km in horizontal) resolution was implemented at India Meteorological Department (IMD), New Delhi on IBM based High Power Computing Systems (HPCS) in May The upgraded version of the GFS (GSI and GSM 9.1.0) model at T574L64 (~ 25 km) resolution has been also operated in the experimental mode since 1 June 2011 and real-time outputs are made available to the national web site of IMD ( The objective of this report is to document the performance skill of this model in spatial and temporal scale during summer monsoon Rainfall is one of the most difficult parameter to predict due to its large spatial and temporal variation. A detailed rainfall prediction skill of the model is described in this report. For the comparison purpose, performance statistics of multi-model ensemble (MME) forecasts and global model forecasts of other centers are also included. Daily rainfall analysis generated at the resolution of 0.5 degree resolution from the use of daily rain gauge observations (IMD) and satellite (TRMM) derived quantitative precipitation estimates is used as the observed dataset for the validation purpose. 85
94 The results showing the ability of the model to predict genesis of low pressure system and other characteristic flow features of south west monsoon are also discussed. GFS T574 performance statistics of maximum and minimum temperature forecasts over different Homogeneous regions of India are also described. The chapter comprises of five sections. Section 2 gives a brief description of IMD Global Forecast System. The verification procedures used in this chapter are descried in section 3. Results of verifications are presented in section 4. Rainfall prediction skill and comparison with the performance of other global models are discussed in sub-section 4.1. Sub-section 4.2 deals with the inter-comparison of performance with other Global models and sub-section 4.3 deals with the results on the performance of the model to predict monsoon flow features and cyclonic genesis and sub-section 4.4 gives description of GFS T574 (2m ) maximum /minimum temperature forecast skill. Finally concluding remarks are given in section The Global Forecast System (GFS) The Global Forecasting System (GFS) is a primitive equation spectral global model with state of art dynamics and physics (Kanamitsu 1989, Kalnay et al. 1990, Kanamitsu et al. 1991). More details about the global forecast model (GFS) are available at The GFS, adopted from National Centre for Environmental Prediction (NCEP), at T382L64 (~ 35 km in horizontal) resolution was implemented at India Meteorological Department (IMD), New Delhi on IBM based High Power Computing Systems (HPCS) in May The upgraded version of the GFS (GSI and GSM 9.1.0) model at T574L64 (~ 25 km) resolution has been also operated in the experimental mode since 1 June 2011 and real-time outputs are made available to the national web site of IMD ( The main objective of this study is to investigate the precipitation forecast skill of the GFS T382 and T574 in the medium range time scale over Indian region during South West Monsoon Daily rainfall analysis generated at the resolution of 0.5 degreeresolution from the use of daily rain gauge observations (IMD) and satellite (TRMM) derived quantitative precipitation estimates is used as the observed dataset for the validation purpose. The list of type of data being used in Global Data Assimilation System at IMD is available at IMD web site. The Global Data Assimilation (GDAS) cycle runs 4 times a day (00, 06, 12 and 18 UTC). The assimilation system is a global 3-dimensional variational technique, based on NCEP Grid Point Statistical Interpolation (GSI 3.0.0) scheme, which is the next generation of Spectral Statistical Interpolation (SSI). Forecast Integration for 7 days. The analysis and forecast for 7 days is performed using the HPCS installed in IMD Delhi. One GDAS cycle and seven day forecast (168 hour) at T382L64 (~ 35 km in horizontal) resolution takes about 30 minutes on IBM Power 6 (P6) machine using 20 nodes with 7 86
95 tasks (7 processors) per node while the same for at GFS T574 resolution is approximately 1 hour 40 minutes. 6.3 Verification Procedures Rainfall In this study rainfall verifications were carried out for both the GFS T382 and T574 model run at 00 UTC against daily rainfall analysis at the resolution of 50 km based on the merged rainfall data combining gridded rain gauge observations prepared by IMD Pune for the land areas and TRMM 3B42RT data for the Sea areas (Durai et al. 2010). The temporal and spatial distribution of observed and model predicted rainfall has been studied. Direct comparison is made of accumulated values of seasonal rainfall, seasonal mean errors and root mean square errors. In order to examine the performance of the model in different homogeneous part of the country, we selected six representative region (square/rectangular domain) for (a) All India (land areas: (Lon: 68 E 98E, Lat: 9N 37N), (b) Central India (CE: Lon: 75E 80E, Lat: 19 24N), covering Vidarbha and neighborhoods, (c) East India (EI: Lon: 75E 80E, Lat: 19 24N), covering Orissa and neighborhoods, (d) North-east India (NE: Lon: 90E 95E, Lat: 24N -29N), (e) North-west India (NW: Lon: 75E 80E, Lat: 25N -30N), covering Rajasthan and Haryana, (f) South Peninsular India (SP: Lon: 76E - 81E, Lat: 12N- 17N), covering Kerala and neighborhood and (g) West coast of India (WC: Lon: 70E - 75E, Lat: 13N - 18N), covering Konkan-Goa. Performance for each region is evaluated by computing grid point by point comparisons (Durai et al. 2010). In addition to these simple measures, a number of categorical statistics are applied. The term categorical refers to the yes/no nature of the forecast verification at each grid point. Some threshold (i.e., 0.1, 1, 2, 5, 10, 15, mm day 1 ) is considered to define the transition between a rain versus no-rain event. Then at each grid point, each verification time is scored as falling under one of the four categories of correct no-rain forecasts (Z), false alarms (F), misses (M), or hits (H). A number of categorical statistics skill measures are used, computed from the elements of this rain/no-rain contingency table. They include bias score (bias): BS = + F + H (1) M H The bias score is equal to the number of rain forecasts divided by the total number of observations of rain. Thus the bias score is a measure of the relative frequency of rain forecasts compared with observations. Threat score (critical success index): 87
96 TS = H + M H + F The threat score (TS) measures the fraction of observed and/or forecast events that were correctly predicted. In additional to above three score, probability of detection (POD and false alarm ratio (FAR) could be generated easily by defining; Probability of detection (POD) or hit rate POD The probability of detection (POD) is equal to the number of hits divided by the total number of rain observations; thus it gives a simple measure of the proportion of rain events successfully forecast by the model. It is also called hit rate. False alarm ratio (FAR): FAR = = H H + M F H + F The false alarm ratio (FAR) is equal to the number of false alarms divided by the total number of times rain was forecast; thus it gives a simple proportional measure of the model s tendency to forecast rain where none was observed. Threshold values of rainfall for computing these categorical statistics, following rainfall categories defined by IMD are used: (3) (4) (2) No rain Very light Light Moderate Rather heavy Heavy Very heavy 0 mm 0.1 to 2.4 mm 2.5 to 7.5 mm 7.6 to 35.5 mm 35.6 to 64.4 mm 64.5 to mm to mm Monsoon circulation Features In order to assess the ability of the model to capture characteristics features of summer monsoon like genesis of low pressure as well as case studies are illustrated Maximum/Minimum temperature forecast skill Performance of GFS T574 maximum and minimum temperature forecast over different region is evaluated by computing domain mean comparisons with observation. 88
 and GFS T574 (bottom panel) for the period from 1 June to 30 September 2011 We begin with a description of observed fields of rainfall for the season (1 June to")

97 6.4. Verification Results Rainfall Prediction Skill Observed and forecast fields Fig.6.1: Spatial distribution of seasonal mean observed (top panel) rainfall (mm/day) and Day-1 to Day-5 forecast from GFS T382 (middle panel) and GFS T574 (bottom panel) for the period from 1 June to 30 September 2011 We begin with a description of observed fields of rainfall for the season (1 June to 30 September 2011). Fig.6.1 (top panel) illustrates the spatial distribution of mean rainfall of the season based on the observations. The observed rainfall distribution shows a north south oriented belt of heavy rainfall along the west coast with a peak of ~ mm/day. The sharp gradient of rainfall between the west coast heavy rainfall and the rain shadow region to the east, which is normally expected, is noticed in the observed field. Another heavy rainfall belt (~ 20 mm/day) is observed over the northeast Bay of Bengal and adjoining Myanmar areas. A rainfall belt of order mm is noticed over the eastern central parts of the country over the domain of monsoon low. In, general, the forecast fields (day-1 to day-5) of seasonal mean rainfall from IMD GFS T382 (Fig.6.1 middle panel) and GFS T574 (Fig.6.1 bottom panel), could reproduce the heavy rainfall belts along the west coast, over the northeast Bay of Bengal & adjoining Myanmar areas and over the domain of monsoon low. However, some spatial variations in magnitude are noticed. At the day-4 to day-5 forecasts, 89


 based on Day-1 to Day-5 forecast")
 for the period from 1 June")


98 some mismatches are noticed for the rainfall belts over the foot hills and over the east central India Spatial characteristics of forecast skills Fig.6.2: Spatial distribution of seasonal mean error (forecast-observed) rainfall (mm/day) based on Day-1 to Day-5 forecast of GFS T382 (top panel) and GFS T574 (bottom panel) for the period from 1 June to 30 September 2011 Fig.6. 3: Spatial distribution of seasonal root mean square error (rmse) rainfall (mm/day) based on Day-1 to Day-5 forecast of GFS T382 (top panel) and GFS T574 (bottom panel) for the period from 1 June to 30 September 90
 between the observed and the model predicted rainfall for day-1 to day-5 of GFS T382 (top panel) and T574 (bottom panel) for the period")
 rainfall (mm/day) based on day-1 to day-5 forecast of GFS T382 (top panel) and GFS T574 (bottom panel) for the period from 1 June")
99 Fig. 6.4: spatial distribution of anomaly correlation coefficient (ac) between the observed and the model predicted rainfall for day-1 to day-5 of GFS T382 (top panel) and T574 (bottom panel) for the period from 1 June to 30 September 2011 In Fig.6.2 the spatial distribution of seasonal mean error (forecast-observed) rainfall (mm/day) based on day-1 to day-5 forecast of GFS T382 (top panel) and GFS T574 (bottom panel) for the period from 1 June to 30 September 2011 is demonstrated. Results of both GFS T382 and T574 show that the magnitude of mean errors is 5 mm/day for all the day-1 to day-5 forecast (~ of the order -5 to +5 mm/day) over most parts of the country except over Myanmar coast, where it is in the order of +10 to +15 mm/day. The spatial pattern of the areas of positive (excess) and negative (deficient) errors are more or less uniform in both the GFS T382 and T574 forecast. The spatial distribution of seasonal root mean square error (rmse) rainfall (mm/day) based on day-1 to day-5 forecast of GFS T382 (top panel) and GFS T574 (bottom panel) for the period from 1 June to 30 September 2011 is shown in Fig.6.3. The rmse of day-1 to day-5 forecasts of the model has a magnitude between 10 and 25 mm, except over the Myanmar coast where the magnitude of rmse exceeds 30 mm. The spatial pattern of rmse of the model day-1 to day-5 forecast shows that the errors are of a more systematic in forecasts lead time. The Anomaly correlation coefficient (ac) between the observed and the model forecasts precipitation for day-1 to day-5 of GFS T382 (top panel) and T574 (bottom panel) is shown in Fig 4. Over most of the country, the magnitude of day-1 and day-2 anomaly CC lies between 0.3 and 0.5, while over the monsoon trough regions, the magnitude of anomaly CC exceeds 0.5. A small area over south west Rajasthan has a magnitude of anomaly CC exceeding 0.6 in GFS 574. The anomaly CC exceeding 0.3 is considered to be good for precipitation forecast. The spatial distribution of the values of anomaly CC decreases with longer forecast length. This indicates that the trend in precipitation in the day-1 to day2 91
100 forecasts of the model is in good phase relationship with the observed trend over a large part of the country. The magnitude of anomaly CC decreases with the forecast lead time, and by day 5 anomaly CC values over most of India are between 0.2 and 0.4, except in pockets near the east coast and south peninsular India where the anomaly CC values are below 0.1.The GFS T574 has relatively higher CC than T382 in all day-1 to day-5 forecast Time series of weekly and daily rainfall ALL INDIA: Weekly Cumulative Rainfall OBS T382(CC=0.79) T574(CC=0.83) Rainfall in mm JUNE JULY AUG SEP Fig. 6.5: Domain Mean Weekly (7days) cumulative observed and day-1 to day-5 forecasts of IMD GFS T382 and T574 Rainfall over All India during SW Monsoon NORTH WEST- INDIA:7 day cum. rain OBS T382(CC=0.68) T574(CC=0.80) Rainfall in mm JUNE JULY AUG SEP
101 Central- INDIA:Cum ulative Rainfall OBS T382(CC=0.77) T574(CC=0.76) Rainfall in mm JUNE JULY AUG SEP EAST- INDIA:7 DAY CUM RAINFALL OBS T382 (CC=0.47) T574 (CC=0.75) Rainfall in mm JUNE JULY AUG SEP NORTH EAST- INDIA:7 day cum. rain OBS T382 (CC=0.64) T574(CC=0.69) Rainfall in mm JUNE JULY AUG SEP
102 WEST COAST OF INDIA:7 day Cum Rain OBS T382(CC=0.69) Rainfall in mm T574(CC=0.74) 0 1 JUNE JULY AUG SEP SP- INDIA: 7day Cum Rain OBS T382(CC=0.56) T574(CC=0.71) Rainfall in mm JUNE JULY AUG SEP Fig. 6.6: Domain Mean Weekly (7days) cumulative Observed and Day-1 to Day-5 forecasts of IMD GFS T382 and T574 Rainfall over different Homogeneous regions of India during SW Monsoon 2011 T CC: 7 DAY CUM RAIN T382 &T574 T C ENTRAL INDIA NW INDIA NE INDIA EA ST INDIA SP INDIA W EST COAST INDIA ALLINDIA Fig. 6.7: Domain Mean Correlation coefficient (CC) of weekly (7days) cumulative observed Rainfall and Day-1 to Day-5 forecasts of IMD GFS T382 and T574 over different Homogeneous regions of India during SW Monsoon
103 1 0.9 ALL INDIA IMDT38 2 IMDT57 4 CC DAY-1 DAY-2 DAY-3 DAY-4 DAY-5 Fig. 6.8: Correlation coefficient (CC) of All India Daily Mean Observed Rainfall and Day-1 to Day-5 forecast of IMD GFS T382 and T574 during SW Monsoon 2011 CC NW INDIA IMDT382 IMDT574 CC CENTRAL INDIA IMDT382 IMDT574 CC East india IMDT382 IMDT DAY-1 DAY-2 DAY-3 DAY-4 DAY-5 0 DAY-1 DAY-2 DAY-3 DAY-4 DAY-5 0 DAY-1 DAY-2 DAY-3 DAY-4 DAY-5 CC NE-INDIA IMDT382 IMDT574 CC WESTCOASTOFINDIA IMDT382 IMDT574 CC SP INDIA IMDT382 IMDT574 0 DAY-1 DAY-2 DAY-3 DAY-4 DAY DAY-1 DAY-2 DAY-3 DAY-4 DAY-5 0 DAY-1 DAY-2 DAY-3 DAY-4 DAY-5 Fig. 6.9: Correlation coefficient (CC) of Daily Mean Observed Rainfall and Day-1 to Day-5 forecast of IMD GFS T382 and T574 over different Homogeneous regions of India during SW Monsoon 2011 From figure (5) figure (9) presents an inter-comparison of rainfall forecast skills by GFS T382 and T574 over all India as well as different Homogeneous regions of India during summer monsoon 2011 Fig.6.5 & Fig.6.6 show the 68-h accumulated forecast over different domains is in phase with observed rainfall, indicating the predictability of rainfall in weekly 95
104 time scale. The domain mean correlation coefficient (CC) of weekly (7days) cumulative observed rainfall and day-1 to day-5 forecasts of IMD GFS T382 and T574 over different Homogeneous regions of India (Fig. 6.7) shows that the GFS T574 has better skill as compare to GFS T384 in all the regions of India.. The results show that the GFS T574 has relatively higher skill than T382 in all forecast hours Inter-comparison of performance with other Global models CC 0.4 NWIndia MME ENSM NCEPGFS JMA ECMF NCMRT254 UKMO CC Central India MME ENSM NCEPGFS JMA ECMF NCMRT254 UKMO DAY-1 DAY-2 DAY-3 DAY-4 DAY DAY-1 DAY-2 DAY-3 DAY-4 DAY-5 CC East India MME ENSM NCEPGFS JMA ECMF NCMRT254 UKMO CC 0.4 N-East India MME ENSM NCEPGFS JMA ECMF NCMRT254 UKMO DAY-1 DAY-2 DAY-3 DAY-4 DAY-5 0 DAY-1 DAY-2 DAY-3 DAY-4 DAY-5 CC West Coast of India MME ENSM NCEPGFS JMA ECMF NCMRT254 UKMO CC Southern Peninsular India MME ENSM NCEPGFS JMA ECMF NCMRT254 UKMO DAY-1 DAY-2 DAY-3 DAY-4 DAY-5 0 DAY-1 DAY-2 DAY-3 DAY-4 DAY-5 Fig. 6.10: An inter-comparison of country mean correlation coefficient (CC) at different thresholds (mm) for the Monsoon 2011 by different models for the day- 1 and day- 5 forecasts 96
105 Bias Score Day-1 MME ENSM NCEPGFS JMA ECMF NCMR UKMO Bias Score Day-2 MME ENSM NCEPGFS JMA ECMF NCMR UKMO mm mm Threshold Range Threshold Range Bias Score Day mm Threshold Range MME ENSM NCEPGFS JMA ECMF NCMR UKMO Bias Score Day mm Threshold Range MME ENSM NCEPGFS JMA ECMF NCMR UKMO Bias Score Day mm Threshold Range MME ENSM NCEPGFS JMA ECMF NCMR UKMO Fig. 6.11: An inter-comparison of country mean bias score at different thresholds (mm) for the Monsoon 2011 by different models for the day- 1 and day- 5 forecasts 97


106 In this sub-section, performance skill of day-1-day-5 rainfall forecasts by IMD Multi- Model Ensemble (MME) during monsoon 2011 (Roy Bhowmik et al. 2008) is presented (Fig.6.10 & Fig.6.11). Member models used in the IMD MME forecast are: NCMRWF T-254, ECMWF, JMA, NCEP and UKMO are used as the ensemble member. For the comparison purpose results of simple mean ensemble (ENSM) is also presented here Monsoon Flow Features and cyclonic genesis Fig.6.12: GFS (T574) MSLP Analysis and Forecasts (Day-7 to Day-3) showing the cyclonic genesis over NW Bay of Bengal on 16 th June
 Wind Analysis and corresponding Forecasts (Day-7 to Day-3) showing the cyclonic genies over NW Bay of Bengal on 22 nd")
 had a short life")


 for the low pressure area over NW Bay of Bengal on 16 th June 2011 is shown in 12.")
107 Fig. 6.13: GFS (T574) Wind Analysis and corresponding Forecasts (Day-7 to Day-3) showing the cyclonic genies over NW Bay of Bengal on 22 nd September 2011 During summer monsoon 2011, there are four depressions formed as against the normal of 4-6 monsoon depressions per season. Out of these, two Depressions (that formed on 11th June over Arabian Sea & the other during 22nd -23rd, July over Land) had a short life span. The Depression formed during 16th-23rd, June and its subsequent west northwestward movement was responsible for the advance of the monsoon over the most parts of the country. The fourth Depression formed towards the end of the season (22nd 23rd, Sept.) weakened before moving towards northeast. Ten low pressure areas formed during the season. The model is able to capture genesis of these systems at the forecast lead time of 72 hours to 168 hours in advance. In order to illustrate the capability of the model to capture genesis, analysis and corresponding forecast mean sea level charts of GFS (T574) for the low pressure area over NW Bay of Bengal on 16 th June 2011 is shown in Fig Mean Sea level forecast field showing that genesis of low pressure system of 16 th June 2011 is predicted 168 hours in advance. Similarly, the cyclonic genesis over NW Bay of Bengal on 22 nd September 2011 is well predicted 7 days in advance by the GFS (T574) (Fig. 6.13) 99
108 6.4.4 GFS T574 maximum /minimum 2m temperature forecast skill Error in Tm a x : N-W ES T INDIA DAY-1 DAY-2 DAY-3 DAY-4 DAY-5 Error in deg C 0 1-2JUNE JULY AUG SEP N-WEST INDIA DAY-1 DAY-2 6 DAY-3 DAY-4 Error in deg C JUNE JULY AUG SEP 2011 DAY Error in Tm ax : CENTRAL INDIA DAY-1 DAY-2 DAY-3 DAY-4 DAY-5 Error in deg C JUNE JULY AUG SEP Error in Tmin : CENTRAL INDIA DAY-1 DAY-2 DAY-3 DAY-4 DAY-5 Error in deg C JUNE JULY AUG SEP
109 6 Error in Tm ax : EAST INDIA DAY-1 DAY-2 DAY-3 4 DAY-4 DAY-5 Error in deg C JUNE JULY AUG SEP EAST INDIA DAY-1 DAY-2 DAY-3 3 DAY-4 Error in deg C JUNE JULY AUG SEP DAY Error in Tmax : N-EAST INDIA DAY-1 DAY DAY-3 DAY-4 DAY-5 2 Error in deg C 0 1-2JUNE JULY AUG SEP N-EAST INDIA DAY-1 DAY-2 Error in deg C JUNE JULY AUG SEP DAY-3 DAY-4 DAY
110 6 4 Error in Tm a x : W ES T COAS T OF INDIA DAY-1 DAY-2 DAY-3 DAY-4 DAY-5 Error in deg C JUNE JULY AUG SEP Erro r in Tm in: W EST C OA ST OF INDIA DAY-1 DAY-2 DAY-3 DAY-4 DAY-5 Error in deg C JUNE JULY AUG SEP Error in Tm ax : SOUTH PENINSULA INDIA DA Y-1 DA Y-2 DA Y-3 DA Y-4 DA Y-5 Error in deg C JUNE JULY AUG SEP SOUTH PENINSULA INDIA DAY-1 4 DAY-2 3 DAY-3 DAY-4 2 DAY-5 Error in deg C JUNE JULY AUG SEP Fig. 6.14: GFS T574: Daily Error in 2m Maximum (top) and Minimum (bottom) Temperature over different Homogeneous regions of India during SW Monsoon 2011 GFS T574: Daily Error in 2m Maximum (top) and Minimum (bottom) Temperature over different Homogeneous regions of India during SW Monsoon 2011 is shown in Fig The seasonal Mean Absolute Error (MAE) and Root Mean Square Error (RMSE) in maximum 102
111 and minimum temperature over different Homogeneous regions of India is shown in Fig.6.15 and Fig.6.16 respectively. Figure.6.14 to Figure.6.16 show that the T574 over predicts both the (2m) maximum and minimum temperature in June and July while it under predicts in August and September over North-West and Central India. Both the maximum and minimum temperature over North-East India has mostly negative bias in all 4 months (June- September) and the bias is in the order of 4 degree C. Over south peninsula India, T574 mostly under predicts the maximum temperature except a few days and over estimate the minimum temperature in June and July and under estimates in Aug and Sep The maximum temperature over west coast of India mostly have negative bias except a few days while the minimum temperature mostly have positive bias except a few days in August during the summer monsoon. Temperature in deg C MAE for Tmax (1 June -30 September 2011) DAY-1 DAY-2 DAY-3 DAY-4 DAY-5 0 CENTRAL INDIA EAST INDIA NE INDIA NW INDIA SP INDIA WEST COAST OF INDIA 5 4 M AE :for Tm in (1 June-30 S eptem ber 2011) D AY-1 D AY-2 D AY-3 D AY-4 D AY-5 Temp in deg C CENTRAL INDIA EAST INDIA NE INDIA NW INDIA SP INDIA WEST COAST OF INDIA Fig.6.15: GFS T574: Seasonal (1 June - 30 September 2011) Mean Absolute Error (MAE) in 2m Maximum (top) and Minimum (bottom) Temperature over different Homogeneous regions of India 103
112 RMSE for Tmax (1June -30 September 2011) DAY-1 DAY-2 Temperature in deg C DAY-3 DAY-4 DAY-5 0 CENTRAL INDIA EAST INDIA NE INDIA NW INDIA SP INDIA WEST COAST OF INDIA 5 4 RM S E :for Tm in (1June-30S eptem ber 2011) D AY-1 D AY-2 D AY-3 D AY-4 D AY-5 Temp in deg C CENTRAL IN D IA EAST INDIA NE INDIA NW INDIA SP INDIA WEST COAST OF IN D IA Fig. 6.16: GFS T574: Seasonal (1 June - 30 September 2011) Root Mean Square Error (RMSE) in 2m Maximum (top) and Minimum (bottom) Temperature over different Homogeneous regions of India 6.5. Conclusions From the result presented above, the following Conclusions may be drawn 1. The observed variability of daily mean precipitation over different sub regions of India is reproduced remarkably well by the day-1 to day-5 forecasts of both the GFS T382 and GFS T574. Both the model forecasts have reasonably good capability to capture large scale rainfall features of summer monsoon, such as heavy rainfall belt along the west coast, over the domain of monsoon trough and along the foot hills of the Himalayas. 2. In general, both the model showed considerable skill in predicting the daily and weekly accumulated rainfall amounts when averaged over the country. The skill scores are comparable with the global models of other leading centres. 3. Genesis of monsoon low pressure systems are well predicted with a lead time of 5 to 7 days. Movements of the systems and associated rainfall during the passage of these systems are reasonably well predicted. 4. The GFS T574 has relatively higher skill than T382 in all forecast hours and it has negative bias in both maximum and minimum temperature over North-East India in all 4 months (June- September).The seasonal Mean Absolute Error (MAE) in maximum 104
113 temperature is 1-2 o C and in minimum temperature is 0-1 o C for all the regions of India except for North East India where it is in the order of 4 o C for both the maximum and minimum temperature. References Durai V R, Roy Bhowmik S K and Mukhopadhaya B., 2010 Performance Evaluation of precipitation prediction skill of NCEP Global Forecasting System (GFS) over Indian region during Summer Monsoon 2008 Mausam 2010, 61(2), Durai V R, Roy Bhowmik S K and Mukhopadhaya B., 2010 Evaluation of Indian summer monsoon rainfall features using TRMM and KALPANA-1 satellite derived precipitation and rain gauge observation Mausam 2010, 61(3), Kalnay, M. Kanamitsu, and W.E. Baker, 1990: Global numerical weather prediction at the National Meteorological Center. Bull. Amer. Meteor. Soc., 71, Kanamitsu, M., 1989: Description of the NMC global data assimilation and forecast system. Weather and Forecasting, 4, Kanamitsu, M., J.C. Alpert, K.A. Campana, P.M. Caplan, D.G. Deaven, M. Iredell, B. Katz, H.-L. Pan, J. Sela, and G.H. White, 1991: Recent changes implemented into the global forecast system at NMC. Weather and Forecasting, 6, Roy Bhowmik,S.K., V.R. Durai, Ananda K Das and B. Mukhopadhaya, Performance of IMD Multi-model Ensemble based District Level Forecast System during Summer Monsoon 2008, Met Mon No. synoptic meteorology 8/2009, 43 pp, India Meteorological Department. 105
114 7 PERFORMANCE OF EXTENDED RANGE FORECAST DURING SOUTHWEST MONSOON 2011 D. R. Pattanaik This Chapter discusses the performance of extended range forecasts from three coupled models (ECMWF, NCEP-CFS and JMA) for the 2011 southwest monsoon. Multi-model Ensemble (MME) Forecast based on forecasts from ECMWF and NCEP-CFS has also been discussed. 7.1 Introduction The forecasting of southwest monsoon rainfall on extended range time scale (beyond 7 days and up to one month) is vital for the vast agro-economic country like India. In last few decades, many statistical and dynamical models have been developed for predicting the summer monsoon rainfall both in the extended range and the seasonal scale. Atmospheric General Circulation Models (AGCM) and Coupled GCMs (CGCMs) are the main tools for dynamical seasonal scale prediction. Though, there have been significant improvement in dynamical modeling system through the improvement of the model physics and dynamics in last few years, but present day AGCM could not simulate mean and inter-annual variability of Indian summer monsoon very successfully (Kang et al., 2002, Wang et. al., 2004). It is also found that the skill of the AGCM is poorer in simulating Indian monsoon, which can be due to lack of proper representation of realistic Sea Surface Temperature (SST). Some of the recent studies have highlighted that the coupled models with one-tier approach can enhance the predictability of the summer monsoon precipitation (Wang et. al., 2008; Pattanaik & Kumar 2010; Krishnan et al., 2010). As shown by Krishnan et al., (2010), a fully coupled model will be able to better capture the observed monsoon in the extended range. 106
115 Many droughts are manifestations of sub-seasonal fluctuations of the northward propagating inter-tropical convergence zone (ITCZ; Sikka and Gadgil 1980; Krishnamurti and Subrahmanyam 1982; Pattanaik 2003; Goswami 2005). The duration and frequency of the active/break spells within a particular monsoon season contribute to the seasonal mean and thus, modulates the inter-annual variability. One of the dominants factors, which, influences the Intra-seasonal oscillation of monsoon is the Madden Julian Oscillation (MJO). The MJO is the leading mode of tropical intra-seasonal climate variability and is characterized by organization on a global spatial scale with a period typically ranging from days (Madden and Julian, 1971; 1972; 1994, Zhang, 2005). Of late, there have been some efforts by various research groups to predict the monsoon on extended range time scale using empirical models (Sahai and Chattopadhyay 2006 and many more). The extended range forecasting (forecasts between 7 and 30 days) fills the gap between medium-range weather forecasting and seasonal forecasting. It is often considered a difficult time range for weather forecasting, since the time scale is sufficiently long so that much of the memory of the atmospheric initial conditions is lost, and it is probably too short so that the variability of the ocean is not large enough, which makes it difficult to beat persistence. Since the MJO is the most important mode of tropical intraseasonal variability with potentially important influences on extra-tropical medium-toextended range weather forecasting and the monsoon activity in the Asian regions, the capability of statistical or numerical models in capturing MJO signal is very crucial in capturing the active/break cycle of monsoon. Now the growing demand for the country like India is to have a better forecast of monsoon on extended range time scale. In the present article the monitoring and forecasting aspect of monsoon activity on intra-seasonal time scale during 2011 monsoon season is presented. 7.2 Dynamical models used for real time extended range forecast For the real-time monitoring of intra-seasonal monsoon rainfall IMD utilizes the products from two well known coupled models viz., the ECMWF coupled model (the monthly forecast system of ECMWF) and the NCEP s Climate Forecast System (CFS) coupled model. The details of these models forecasts and the methodology of multi-model ensembles are given here ECMWF monthly forecast system There are some NWP centres throughout the globe generating the extended range forecast in the real time. The ECMWF monthly forecasting system is one of them. The ECMWF monthly forecasting system used here is based on 32-day coupled ocean 107
116 atmosphere integrations set up at ECMWF. This system has run routinely since March The GCM used in this study has a much finer resolution (T159 L40). The ECMWF monthly forecasting system is based on fully coupled ocean atmosphere integrations rather than on atmospheric-only integrations forced by persisted SSTs. The ocean atmosphere coupling may help to capture some aspects of the MJO variability. The ECMWF monthly forecasting system has also a much larger ensemble size (51 members) than in any previous studies. The details about the ECMWF monthly forecast system along with its skill over the different geographical regions have been discussed in Frederic (2004) NCEP s Climate Forecast System MJO monitoring and prediction is also carried out at Climate Prediction Centre, National Centre for Environmental Prediction by using the dynamical model outputs from Climate Forecast System (CFS) as discussed in Jon et al., (2008). The details about the operational CFS are discussed in Saha et al., (2006). The operational CFS (T62L64/MOM3) is initialized 4 times daily from 00Z, 06Z, 12Z and 18Z with one day delay (because of the ocean analysis). The atmospheric component of the CFS is the NCEP atmospheric GFS model. The oceanic component is the GFDL Modular Ocean Model V.3 (MOM3), which is a finite difference version of the ocean primitive equations under the assumptions of Boussinesq and hydrostatic approximations. The ocean-atmosphere coupling is nearly global (64 N-74 S), instead of only in the tropical Pacific Ocean, and flux correction is no longer applied. Thus, the CFS is a fully tier-1 forecast system. For more details about the skill of CFS for the prediction of Indian monsoon on the seasonal and monthly scale see the articles by Pattanaik and Kumar (2010) and Pattanaik et al., (2010) Multi-model ensemble (MME) forecast As discussed in sub-section above the ECMWF and the NCEP are routinely generating the forecast from the coupled model. The ECMWF has a specific monthly forecast system, which has 51 ensemble members. The products of the ECMWF monthly forecasting system are based on weekly forecasts for 4 weeks based on every Thursday and valid for days 5-11 (week1; Monday to Sunday), days (week2), days (week3) and days (week4). The operational coupled model of NCEP, known as the CFS generates the forecast on every day with 4 ensemble members. The outputs from these two models are used for generating the multi-model ensemble forecast through the following steps. The ensemble means (51 members) from ECMWF forecast is calculated for four weeks with forecast period for day 5-11 days, days, days and days, which is valid from Monday-Sunday and subsequent Monday to Sunday. Similarly, the ensemble mean forecast from NCEP CFS with initial condition of every Thursday valid for the same period as that of ECMWF are used. The corresponding hindcast mean is 108
117 calculated both from ECMWF (18 years climatology) and the NCEP CFS (25 years climatology). The hindcast and the forecast from NCEP CFS are interpolated into ECMWF grid (i.e. at 0.5 degree). The corresponding hindcast climatology is subtracted and the weekly anomaly for four weeks is calculated both from ECMWF and the NCEP CFS. The anomaly for week 1 to week 4 is calculated by giving equal weight to ECMWF and NCEP CFS model. The forecast is generated on every Friday with forecast anomaly for week 1 (Monday to Sunday) to week 4 (subsequent Monday to Sunday). In addition to the coupled models from the NCEP and the ECMWF the forecasts from Japan Meteorological Agency / Tokyo Climate Centre (JMA/TCC) is also used for the extended range forecast of monsoon as guidance purpose, although it is not used in the preparation of Multi-model ensemble forecasts. 7.3 Intra-seasonal activity of southwest monsoon 2011 With respect to the intra-seasonal monsoon of 2011, it is one of the good monsoon Years with no prolonged dry spell of monsoon reported during the year. Monsoon activity was good in June associated with strong cross equatorial flow prevailed during most parts of June. Whereas, it was weak during many days of July associated with subdued rainfall activity (Fig. 7.1a). The strong cross equatorial flow associated with synoptic scale systems maintained its strength all through the month of August and most parts of September as indicated from the daily rainfall activity shown in Fig. 7.1a. Though there had been certain periods of subdued rainfall activity during the season in different spatial and temporal scales, there was no all India break monsoon condition during this year. The all India weekly rainfall departure (Fig. 7.1b) also indicated some dry spell in the month of July. In order to see the qualitative performance of intra-seasonal monsoon forecast, following episodes are considered. But 2011 is unlike 2009 where there were three long dry spells of monsoon noticed one each in June, August and September (Tyagi and Pattanaik 2010). i) Onset of monsoon with good monsoon rainfall during 1 st week of June ii) Weak monsoon activity during first fortnight of July (4-17 July) & during last week of July (25-31 July) iii) Weak to active transition of monsoon during August iv) Active three weeks of September and delayed withdrawal of monsoon 109
 The weekly mean departure of all India monsoon rainfall during the monsoon season 2011. 7.3.")
118 (a) (b) Fig. 7.1 (a): All India daily actual and normal rainfall during the monsoon 2011 from June to September. (b) The weekly mean departure of all India monsoon rainfall during the monsoon season Onset of monsoon with good monsoon rainfall during 1 st week of June The southwest monsoon onset during 2011 over Kerala coast occurred on 29 th May and subsequently progressed northward along the west coast. As seen from Fig. 7.2, the observed weekly mean rainfall from TRMM during the period from 30 May to 05 June indicated onset of monsoon over Kerala coast and further progressed northward along the west coast. 110

119 Fig. 7.2: Weekly mean rainfall (mm/day) from TRMM during the period from 30 May to 05 June, The MME extended range forecast rainfall anomalies valid for the period from 30 May to 5 th June based on the initial condition of 26 th May, and 19 th May is shown in Fig. 7.3a and Fig. 7.3b respectively. As seen from Fig. 7.3a the 5-11 days forecast based on the initial condition of 26 May and valid for the period from 30 May to 5 June indicated the onset of monsoon rainfall over Kerala coast and further progress northward during the period 30 May-5 June, whereas, during days forecast (Fig. 7.3b) based on the initial condition of 19 May, although captured the onset over Kerala coast reasonably well the northward progress along the west coast is not very clear compared to days 5-11 forecast shown in Fig.7.3a. 111
 MME forecast rainfall anomalies (mm/day) for days 5-11 based on 26 th May, 2011 and valid for 30 May -05 Jun, 2011 (b) MME forecast for days 12-18 (based on 19 th May) and valid for 30 May-05")
 & during last week of July (25-31 July) After the onset on 30th May the southwest monsoon 2011 covered the entire country on 9th")
120 (a) (b) Fig. 7.3: (a) MME forecast rainfall anomalies (mm/day) for days 5-11 based on 26 th May, 2011 and valid for 30 May -05 Jun, 2011 (b) MME forecast for days (based on 19 th May) and valid for 30 May-05 June, Weak monsoon activity during first fortnight of July (4-17 July) & during last week of July (25-31 July) After the onset on 30th May the southwest monsoon 2011 covered the entire country on 9th July, 6 days earlier than its normal date of 15th July. The cross equatorial flow was weak during the first fortnight of July. Though there had been certain periods of subdued rainfall activity during the season in different spatial and temporal scales, there was no all India break monsoon condition during this year. During the month of July one land depression and two low pressure systems formed. The systems in July aided the monsoon to cover the entire country and were also responsible for active monsoon conditions in the third week of July as shown in Fig. 7.1a, which gave rise to widespread rainfall activity over most parts of the country outside southeast Peninsula. However, overall monsoon condition during 4-10 July, July and July, 2011 was subdued (Fig. 7.1b & Fig. 7.4a-c). 112

.")
121 (a) (b) (c) Fig. 7.4: (a) Observed rainfall anomalies (mm/day) during Jul, 2011, (b) Same as a but for the period Jul, 2011 and (c) same as a but for the period Jul, The large negative departure of monsoon rainfall is noticed during the week July (Fig. 7.4c), whereas, during the period from July and July the monsoon rainfall is weak mainly over the eastern parts of India and the southern Peninsula as shown in Fig. 7.4a & Fig. 7.4b, as a result on all India scale the negative departure is not high during these two weeks (Fig. 7.1b). The coupled model forecast from NCEP CFS based on the initial condition of 30 June and valid for days 5-11 (04-10 July) and days (11-17July) the forecast circulation anomalies at 850 hpa indicated weaker monsoon circulation in terms of anticyclonic anomalies over the central India (Fig. 7.5a & Fig. 7.5b), which is also seen in the MME forecast (Fig. not shown here). Associated with the weaker monsoon 113

 & (b) Model forecast 850 hpa wind anomalies valid for the period from 04-10 July and 11-17 July, 2011 based on the initial condition of 30 June.")
.")
122 circulation in the forecast the MME forecast rainfall also indicated negative rainfall anomalies over many parts of India as shown in Fig. 7.5c & Fig. 7.5d valid for the period July and July respectively. (a) CFS forecast wind at 850 hpa valid for days 5-11 (4-10 July), IC=30 Jun (b) CFS forecast wind at 850 hpa valid for days (11-17 July), IC=30 Jun (c) (d) Fig. 7.5: (a) & (b) Model forecast 850 hpa wind anomalies valid for the period from July and July, 2011 based on the initial condition of 30 June. (c) & (d) The corresponding MME forecast rainfall anomalies (mm/day) during the period from Jul, 2011 and July, The last week of July also witnessed large negative departure of rainfall over many parts of India (as shown in Fig. 7.4c). The forecast anomalies from the two coupled models (ECMWF) and CFS based on the initial condition of 21 st July and valid for days 5-11 (25-31 July) indicated mostly the negative anomalies over India (Fig. 7.6a-b). However, the negative anomaly is more prominent with ECMWF model (Fig. 7.6a) compared to that of NCEP CFS model (Fig.7.6b). 114
 Same as a but for NCEP CFS forecast. 7.3.")
123 (a) (b) Fig. 7.6: (a) ECMWF model days 5-11 forecast rainfall anomalies valid for the period from July, 2011 based on the initial condition of 21 July (b) Same as a but for NCEP CFS forecast Weak to active transition of monsoon during August After relatively weak July, the August month got good rainfall particularly associated with four low pressure areas formed during the month; two over land and one each over the Bay of Bengal and the Arabian Sea. All these low pressure areas had prolonged life spans. The low pressure area (8 th 11 th August.) formed over the western end of the monsoon trough over northwest Madhya Pradesh and neighborhood and caused extremely heavy rainfall over Madhya Pradesh and Rajasthan. The well marked low pressure area during 11th 17th August formed over Gangetic West Bengal and neighborhood and interacted with the cyclonic circulation in the westerly field and caused extremely heavy rainfall over northwestern parts of India. The observed rainfall anomalies as seen in Fig. 7.7a & Fig. 7.7b during the period from August and August, 2011 respectively shows many parts of India with positive anomalies of rainfall. The relatively good monsoon rainfall activity during the period 8-21 August is just in the form of transition of monsoon rainfall from weak monsoon during 25 to 31 st July and gradual improvement during the week 1-7 August (although still negative anomaly on all India scale) as shown in Fig. 7.1b and finally to good spells of monsoon during August,
124 (a) (b) Fig. 7.7: (a) Observed rainfall anomalies (mm/day) during August, 2011, (b) Same as a but for the period August, The corresponding MME forecast rainfall anomalies valid for days 5-11 based on the initial conditions of 4 th August and 11 August clearly indicated the active monsoon conditions with large parts of the country having positive anomalies during the period 8-14 August (Fig. 7.8a) and August (Fig. 7.8b). The MME based week 2 forecast (days 12-18) valid for the same period also indicated active phases of monsoon during the period 8-14 August (Fig. 7.8c) and August (Fig. 7.8d), although the days forecast for the period August slightly indicated negative anomalies over parts of central India. 116
 and (d) MME weekly forecast rainfall anomalies valid for days 12-18, (c) 08-14 August, 2011 and (d) 15-21 August, 2011. 7.3.")


125 (a) (b) (c) (d) Fig. 7.8: (a) & (b) MME weekly forecast rainfall anomalies valid for days 5-11, (a) August, 2011 and (b) August, (c) and (d) MME weekly forecast rainfall anomalies valid for days 12-18, (c) August, 2011 and (d) August, Active September and delayed withdrawal of monsoon Like in 2010 when the withdrawal was delayed (Pattanaik and Khole 2011) the withdrawal of southwest monsoon during 2011 was also delayed, as seen from the observed weekly mean rainfall along with the rainfall anomaly during the three weeks of September starting from 5 th September to 25 th September (Fig. 7.9). It is seen from mean and anomaly plot that the rainfall continued over most parts of India including the northwest India during the period till 18 September (Fig. 7.9a-d), and decreases over the northwest India during the week September (Fig. 7.9e-f), although the rainfall continued over eastern parts of India during the week. It may be mentioned that the withdrawal started from northwest India from 23 rd September. The active September and also the delayed withdrawal was very much indicated in the forecast wind and rainfall. The mean 850 forecast wind based on 1 st 117
126 September initial condition from ECMWF, NCEP CFS and the MME indicated clear presence of east-west shear line associated with active monsoon during days 5-11 forecast valid for the period 5-11 September (Fig. 7.10a, Fig. 7.10c and Fig. 7.10e respectively). Similarly, the days forecast from ECMWF, NCEP and MME valid for September also indicated presence of cyclonic circulation over northwest India in the mean chart, thereby not conducive for the withdrawal of monsoon from northwest India (Fig. 7.10b, Fig. 7.10d and Fig. 7.10f). The forecast wind anomaly at 850 hpa valid for days 5-11 Sep, and valid for September from the MME also indicated presence of east-west shear line during 5-11 Sep (Fig. 7.10g) and anomalous cyclonic circulation over the northwest India during Sep (Fig. 7.10h), not conducive for the withdrawal of monsoon from northwest India. The corresponding MME forecast of weekly mean rainfall for days 5-11 and days based on the initial conditions of 1 Sep, 8 Sep and 15 Sep, 2011 are shown in Fig It is seen from Fig that active monsoon condition over northwest India were indicated in the MME forecast valid for days 5-11 and days till 18 th September (Fig. 7.11a, Fig. 7.11b and Fig. 7.11c). The withdrawal of monsoon from northwest India was indicated in days forecast based on the initial condition of 8 th Sep and valid for the period September (Fig. 7.11d)., which is associated with large negative rainfall anomalies over northwest and adjoining areas. Based on the initial condition of 15 September, the withdrawal of monsoon from northwest India is very much clear during the period September as seen in the 5-11 days forecast rainfall anomalies (Fig. 7.11e). The days forecast valid for the period from 26 September-02 October indicated withdrawal from most parts of India (Fig. 7.11f). The delayed withdrawal of monsoon was also observed in the JMA model forecast based on the initial condition of 15 th September and valid for days 5-11 (19-25 Sep; Fig. 7.12a) and days (26 Sep-02 Oct; Fig. 7.12b), which indicated large negative anomalies over northwest India and large positive anomalies over the eastern parts of India during the period from Sep (Fig. 7.12a) like the observed anomalies as shown in Fig. 7.9f. Like the MME forecast the JMA forecast for days also indicated withdrawal from many parts of India during the period from 26 Sep-02 Oct. (Fig. 7.12b). 118
 during (a) 5-11 Sep, (b) 12-18 Sep and (c ) 19-25 Sep., 2011.")
127 (d) a) (b) (e) (c) (f) Fig. 7.9: Observed weekly mean rainfall (mm/day) during (a) 5-11 Sep, (b) Sep and (c ) Sep., (d), (e) and (f) Same as a, b and c but for the rainfall anomalies. 119
 (b) ECM 850 wind")

 (e) MME")
 (f) MME 850 wind for")

 Fig. 7.")

 and days 12-18")
128 (a) ECM 850 wind for 5-11 Sep, (IC 1 Sep) (b) ECM 850 wind for Sep, (IC 1 Sep) (c ) CFS 850 wind for 5-11 Sep, (IC 1 Sep) (d) CFS 850 wind for Sep, (IC 1 Sep) (e) MME 850 wind for 5-11 Sep, (IC 1 Sep) (f) MME 850 wind for Sep, (IC 1 Sep) (g) MME 850 wind ano for 5-11 Sep,(IC 1Sep) (h)mme 850 wind ano for Sep,(IC Sep) Fig. 7.10: 850 hpa forecast mean wind and anomaly wind based on 1 Sep, 2011 and valid for days 5-11 (5-11 Sep) and days (12-18 Sep),
 Fig. 7.")

")
 19-25 Sep.")


129 (a) ( b) (c) ( d ) (e) ( f ) Fig. 7.11: MME forecast rainfall anomalies (mm/day) during days 5-25 and valid form (a) 5-11 Sep, (b) Sep and (c ) Sep., 2011, (d) Sep. Same as a and b but based on the initial condition of 15 Sep and valid for (e) Sep and (f) 26 Sep-02 Oct. 121
130 (a) (b) Fig. 7.12: JMA forecast rainfall anomalies (mm/day) during (a) days 5-11 Sep, valid for Sep, 2011 and (b) days valid for Sep, Quantitative verification of extended range forecast of monsoon 2011 In order to see the quantitative verification of extended range forecast the observed weekly rainfall departure for 18 weeks period during 2011 as shown in Fig. 7.1b is compared against the forecast from the individual coupled models and also the MME. The forecast of rainfall based on ECMWF, NCEP CFS and the MME valid for days 5-11, days and days along with the observed rainfall anomalies is shown in Fig. 7.13, Fig and Fig respectively. As seen from Fig and Fig during many weeks the forecast rainfall anomalies are matching very well with that of observed rainfall anomalies. This is basically seen from the CC plotted in Fig between observed AISMR and corresponding forecasts AISMR from different models. As seen from Fig. 7.16, the MME forecast shows significant results till 18 days, whereas, the CC reduces drastically during days It is also observed that the MME forecast performed better than individual models till days
131 Rainfall in % departure (a) Obs (AISMR) ECM (days 5 11) 60 30May 05Jun Jun Jun Jun 27Jun 03Jul Jul Jul Jul Jul Aug Aug Aug Week during 2011 monsoon Aug 29Aug 04Sep Sep Sep Sep 26Sep 02Oct 60 (b) Rainfall in % departure Obs (AISMR) CFS (days 5 11) 60 Rainfall in % departure May 05Jun (c) Jun Jun Jun 27Jun 03Jul Jul Jul Jul Jul Aug Aug Aug Week during 2011 monsoon Obs (AISMR) MME (days 5 11) Aug 29Aug 04Sep Sep Sep Sep 26Sep 02Oct 60 30May 05Jun Jun Jun Jun 27Jun 03Jul Jul Jul Jul Jul Week during 2011 monsoon Fig. 7.13: Weekly observed rainfall departure on all India level along with coupled models forecast all India monsoon rainfall valid for days (a) ECMWF, (b) CFS and (c) MME Aug Aug Aug Aug 29Aug 04Sep Sep Sep Sep 26Sep 02Oct 123
132 Rainfall in % departure (a) Obs (AISMR) ECM (days 12 18) (b) 30May 05Jun Jun Jun Jun 27Jun 03Jul Jul Jul Jul Jul Aug Aug Aug Aug Week during 2011 monsoon 29Aug 04Sep Sep Sep Sep 26Sep 02Oct Rainfall in % departure Obs (AISMR) CFS (days 12 18) 60 30May 05Jun Jun Jun Jun 27Jun 03Jul Jul Jul Jul Jul Aug Aug Aug Week during 2011 monsoon Aug 29Aug 04Sep Sep Sep Sep 26Sep 02Oct Rainfall in % departure (c) Obs (AISMR) MME (days 12 18) 60 30May 05Jun Jun Jun Jun 27Jun 03Jul Jul Jul Jul Jul Aug Aug Aug Week during 2011 monsoon Aug 29Aug 04Sep Sep Sep Sep 26Sep 02Oct Fig. 7.14: Weekly observed rainfall departure on all India level along with coupled models forecast all India monsoon rainfall valid for days (a) ECMWF, (b) CFS and (c) MME. 124
133 60 (a) Rainfall in % departure Obs (AISMR) ECM (days 19 25) 60 30May 05Jun (b) Jun Jun Jun 27Jun 03Jul Jul Jul Jul Jul Aug Aug Aug Aug Week during 2011 monsoon 29Aug 04Sep Sep Sep Sep 26Sep 02Oct Rainfall in % departure Obs (AISMR) CFS (days 19 25) 60 30May 05Jun Jun Jun Jun 27Jun 03Jul Jul Jul Jul Jul Aug Aug Aug Week during 2011 monsoon Aug 29Aug 04Sep Sep Sep Sep 26Sep 02Oct 60 (c) Rainfall in % departure Obs (AISMR) MME (days 19 25) 60 30May 05Jun Jun Jun Jun 27Jun 03Jul Jul Jul Jul Jul Aug Aug Week during 2011 monsoon Aug Aug 29Aug 04Sep Sep Sep Sep 26Sep 02Oct Fig. 7.15: Weekly observed rainfall departure on all India level along with coupled models forecast all India monsoon rainfall valid for days (a) ECMWF, (b) CFS and (c) MME. 125
134 Correlation Coefficient AISMR ECM CFS MME Days 5-11 Days Days Forecast days Fig. 7.16: Correlation coefficient between observed AISMR and forecast AISMR from coupled models for three weeks during monsoon Summaries and Conclusions In the present article the monitoring and forecasting of monsoon activity on extended range time scale in terms of deterministic weekly forecasts upto three weeks is evaluated for 2011 monsoon season from June to September. The outputs from the coupled models like that of ECMWF monthly forecast, NCEP CFS coupled model, Japan Meteorological Agency (JMA) are used for this purpose. The Multimodel ensemble based on ECMWF and NCEP CFS is also prepared in the real time. The dynamical models like ECMWF and NCEP CFS captured the onset of monsoon over Kerala, subdued spell of July, the transition of monsoon from weak phase to active phase during August), the delay withdrawal of monsoon and also more importantly not indication of long dry spells (like observations) reasonably well. The Multi-model ensemble (MME) forecast based on these two models also performed well and can be considered as one of the better tools for providing the real time forecast in the extended range time scales at least for two weeks with a lead time of 5 days. With respect to the superiority of one model, ECMWF monthly forecast system is found to be slightly better than the NCEP CFS model, although the sample size of 18 weeks are not sufficient to draw final conclusion since the intra-seasonal rainfall activity is different from one year to other year as a result the performance of the model is also expected to be different from one year to other. Further work is needed to improve the skill of extended range forecast using other coupled models in the MME forecast, using our own coupled models, using suitable ensemble and downscaling techniques and finally through effective collaborations with other institutes working on this difficult areas of monsoon forecasting. 126
135 Acknowledgement The author is thankful to the Director General of Meteorology for giving this opportunity to write this article. The author is also thankful to Deputy Director General of Meteorology (NWP) for providing valuable supports. The author is also thankful to DDGM (Hydrology) for providing daily observed rainfall data on met subdivision level used in the present study. Thanks are also due to the office of ADGM (R), Pune for providing daily gridded rainfall data used in the present study. Thanks are also due to the other NWP centres in India and abroad like ECMWF, NCEP and JMA for providing the forecast products used in the present analysis. 7.6 References Frederic Vitart, 2004 : Monthly Forecasting at ECMWF. Monthly Weather Review, Vol. 132, Goswami B. N., 2005 : South Asian Monsoon. In: Lau WKM, Waliser DE (eds) Intraseasonal variability in the atmosphere ocean climate system, Chap. 2, pp Jon Gottschalck, Qin Zhang, Wanqui Wang, Michelle L Heureux, Peitao Peng, 2008 : MJO Monitoring and Assessment at the Climate Prediction Center and Initial Impressions of the CFS as an MJO Forecast Tool. NOAA CTB COLA Joint Seminar, 23 April (Available from Kang I. S., K. Jin K, B. Wang, K. M. Lau, J. Shukla, V. Krishnamurthy, S. D. Schubert, D. E. Waliser, W. F. Stern, A. Kitoh, G. A. Meehl, M. Kanamitsu, V. Y. Galin, V. Satyan, C. K. Park and Y. Liu, 2002 :Intercomparison of the climatological variations of Asian summer monsoon precipitation simulated by 10 GCMs. Climate Dynamics, 19(5-6), Krishnamurti T N, Subrahmanyam D, 1982 : The day mode at 850 mb during MONEX. J Atmos Sci 39: R. Krishnan, Suchitra Sundaram, P. Swapna, Vinay Kumar, D.C. Ayantika and M. Mujumdar (2010): The crucial role of ocean-atmosphere coupling on the Indian monsoon anomalous response during dipole events. Climate Dynamics, DOI: /s Madden R. and P. Julian, 1971: Detection of a day oscillation in the zonal wind in the tropical Pacific, J. Atmos. Sci., 28, Madden R. and P. Julian, 1972: Description of global-scale circulation cells in the tropics with a day period. J. Atmos. Sci., 29, Madden R. and P. Julian, 1994: Observations of the day tropical oscillation: A review. Mon. Wea. Rev., 112, Pattanaik, D. R., 2003 : The northward moving low frequency mode : A case study of 2001 monsoon season. MAUSAM, Vol. 54, Pattanaik, D.R. and Arun Kumar, 2010 : Prediction of summer monsoon rainfall over India using the NCEP climate forecast system. Climate Dynamics, Vol. 34, Pattanaik, D.R., Arun Kumar and Ajit Tyagi, 2010 : Development of empiricaldynamical hybrid forecasts for the Indian monsoon rainfall using the NCEP Climate Forecast System. IMD Met. Monograph. Synoptic Meteorology No. 11/2010. Pattanaik, D. R. and Medha Khole, 2011 : Performance of Extended Range Forecast During Southwest Monsoon In Ed. Tyagi, Ajit, A. B. Mazumdar and D. S. Pai, 2011 : Monsoon 2010 A Report. IMD Met. Monograph. Synoptic Meteorology No. 10/2011,
136 Saha S, S. Nadiga, C. Thiaw, J. Wang, W. Wang, Q. Zhang, H. M. Van den Dool, H. L. Pan, S. Moorthi, D. Behringer, D. Stokes, M. Pena, S. Lord, G. White, W. Ebisuzki, P. Peng, P. Xie, 2006 : The NCEP climate forecast system. J Climate, 19, Sahai A.K. and R. Chattopadhyay, 2006 : An Objective Study of Indian summer Monsoon Variability Using the Self Organizing Map Algorithms. IITM Research Report, No Sikka D. R. and S. Gadgil, 1980 : On the maximum cloud zone and the ITCZ over Indian longitudes during the southwest monsoon. Mon Wea Rev, 108, Tyagi, Ajit and D.R.Pattanaik, 2010 : Real Time Monitoring and Forecasting of Intra- Seasonal Monsoon Rainfall Activity over India During IMD Met. Monograph. Synoptic Meteorology No. 10/2010. Zhang C., 2005 : Madden-Julian Oscillation. Reviews of Geophysics, 43,
137 8 VERIFICATION OF THE OPERATIONAL AND EXPERIMENTAL LONG RANGE FORECASTS D. S. Pai and O. P. Sreejith This chapter discusses the verification of the operational and experimental long range forecasts issued for 2011 southwest monsoon rainfall over India and monsoon onset over Kerala. As per the present long range forecasting system, the time periods for which operational forecasts for the rainfall averaged over the country as a whole issued are; full season (June- September), second half of the season (August- September) and three separate monsoon months (July, August and September). In addition, forecasts for season rainfall over four geographical regions (NW India, NE India, Central India and South Peninsula) are also issued. The chapter also discusses the experimental forecasts from various climate research centers within the country and abroad Introduction India Meteorological Department (IMD) issues various monthly and seasonal operational forecasts for the south-west monsoon season using models based on latest statistical techniques with useful skill. Operational models are reviewed regularly and improved through in house research activities. Details of the present operational forecasting system used for long range forecasting can be from Pai et al. (2011). Operational forecast for southwest monsoon season rainfall over the country as a whole is issued in two stages; the first forecast in April and update for the April forecast in June. In June, along with the update forecast for the season rainfall, forecasts for the monthly rainfall (for the months of 129
138 July and August) over the country as a whole and that for season rainfall over the four geographical regions of the country are also issued. In addition, forecast outlook for the rainfall during second half (August-September) of the monsoon season (issued in July) and that for the September rainfall (issued in August) over the country as a whole are also issued. While preparing, the operational forecasts, the experimental and operational forecasts from various research institutions from India and abroad were also taken into account. Along with the operational forecasts, experimental forecasts of monthly and seasonal rainfall over Indian region based on Seasonal Forecasting Model (SFM) were also prepared. In addition to the above long range forecasts, an operational forecast for the monsoon onset over Kerala was issued in May. Various statistical models used for generating the long range forecasts are described and verification of the various operational long range forecasts issued for the 2011 southwest monsoon rainfall and the monsoon onset over Kerala is discussed here. Experimental forecasts prepared by IMD and by other climate research institutions in India and abroad are also discussed Empirical Models used for Issuing the Operational Long Range Forecasts Ensemble Forecasting System for the Forecasting of Season Rainfall over the Country As a Whole This year (2011), the first and second stage (update) operational forecast for southwest monsoon season rainfall over the country as a whole was issued on 19 th April and on 21 st June. For the forecasting of season (June to September) rainfall over the country as a whole, the new ensemble forecasting system using a set of 8 predictors that having stable and strong physical linkage with the Indian south-west monsoon rainfall. Details of the 8 predictors used in the ensemble forecasting system is given in the Table-8.1 along with their signs of impact (Favorable/ Unfavorable for normal/excess monsoon) on 2011 SW Monsoon. For the April forecast, first 5 predictors listed in the Table-8.1 were used. For the update forecast issued in June, the last 6 predictors were used that include 3 predictors used for April forecast. As seen in this Table, 4 out of the 5 predictors used for April forecast were neutral as their actual values for 2011 were close to their normal values and the remaining predictor (The North Atlantic SST (Dec+Jan)) was favorable for normal or above normal monsoon rainfall. The North Atlantic SST (Dec+Jan) was cooler than its normal value. Out of the 6 predictors used for June forecast, 2 predictors (North Atlantic Mean Sea Level Pressure (May) & Nino 3.4 SST tendency (MAM-DJF) were unfavorable and one predictor (The North Atlantic SST (Dec+Jan)) was favorable for normal or stronger than normal monsoon rainfall. 130
139 The Nino3.4 SST tendency was noticeably positive associated with the temporary weakening of prevailing moderate to strong La Nina conditions during the period to neutral ENSO conditions. This clearly shows that after March predictive signals particularly related to the ENSO phenomena had became unfavorable for normal or above normal season rainfall. Table- 8.1: Details of the 8 predictors used for the ensemble forecast system for the forecasting of 2011 southwest monsoon rainfall over the country as a whole. No Predictor North West Europe Land Surface Air Temperature Anomaly (Jan) Equatorial Pacific Warm Water Volume Anomaly (Feb + Mar) North Atlantic Sea Surface Temperature Anomaly (Dec + Jan) Equatorial South East Indian Ocean Sea Surface Temperature Anomaly (Feb + Mar) East Asia Mean Sea Level Pressure Anomaly (Feb + Mar) Central Pacific (Nino 3.4) Sea Surface Temperature Ano. Tendency (MAM- DJF) North Atlantic Mean Sea Level Pressure Anomaly (May) North Central Pacific Zonal Wind Anomaly at 1.5 Km above sea level (May) Used for forecasts in Correlation Coefficient ( ) Favorable (F)/ Un Favorable (U)/ Neutral (N) for Normal or Above Normal Rainfall April 0.58 N April N April and June April and June April and June F 0.45 N 0.36 N June U June U June N The methodology used to compute the ensemble forecast is given in Pai & Sreejith (2010). The model errors of 5-parameter April ensemble forecasting system is ± 5% of LPA and that of the 6-Parameter June ensemble forecasting system is ± 4% of LPA. Performance of the April & June forecast for the independent test period of computed using the ensemble forecasting system used for 2011 is shown in Figures 8.1a & b. The RMSE of the independent April forecasts for the period was 5.9% of LPA & that of the June forecasts for the same period was 5.2% of LPA. 131
140 25 20 PERFORMANCE OF ENSEMBLE FORECAST SYSTEM ( ): April ACTUAL AVE_EMR+EPPR RAINFALL (% DEP. FROM LPA) YEAR Fig. 8.1a: Performance of the ensemble forecast system for the April forecast of the 2011seasonal monsoon rainfall over the country as a whole PERFORMANCE OF ENSEMBLE FORECAST SYSTEM ( ): JUNE ACTUAL AVE_EMR+EPPR RAINFALL (% DEP. FROM LPA) YEAR Fig. 8.1b: Performance of the ensemble forecast system for the June forecast of the 2011 seasonal monsoon rainfall over the country as a whole. 132
141 8.2.2 Model for the Forecast of Rainfall during the Second Half of the Monsoon Season (August-September) over the country as a whole The forecast of rainfall during second half of the monsoons season (August September) over the country as a whole was issued on 1 st August, Table-8.2. shows the details of the 5 predictors used for the development of the new PCR model. Data for the period were used to develop the model. The model uses moving training period method for the prediction with a constant window period of 33 years. In this method, for the prediction of rainfall for a reference year, data of 33 years just prior to the reference year was first used for PC analysis of the 5 predictor data set. First few PCs that explain 80% of the total variability of the predictors set during these 33years (training period) were then related against the predictor series for the same period using the multiple linear regression method. Scores of the selected PCs for the reference year were then calculated using the PC loading matrix and predictor values for the reference year. These score values along with the coefficients of the trained regression equation were used for calculating the predictor value for the reference year. In this way, rainfall during the second half of the monsoon season over the country as a whole was predicted for the period Table 8.2: The details of the predictors used for forecasting 2011 second half of the monsoon season (August-September) rainfall over the country as a whole No Predictor North Pacific (Region-1) Mean Sea Level Pressure (July) Central Pacific (Nino 3.4) Sea Surface Temperature Ano. Tendency (AMJ-JFM) Bay of Bengal Sea Surface Temperature (June) North Atlantic Mean Sea Level Pressure (May) North Pacific (Region-2) Mean Sea Level Pressure (July) Correlation Coefficient ( ) Favorable (F) / Unfavorable (U) for Normal (N) or Above Normal Rainfall 0.57 N U 0.33 N U U 133
142 Table 8.3: The details of the predictors used for forecasting 2011 July rainfall over the country as a whole No. Predictor C.C. ( ) 1. North Atlantic Sea Surface Temperature (Dec) North Central Pacific Zonal Wind U850 (May) North America Mean Sea Level Pressure (Jan) East Asia Mean Sea Level Pressure (Feb) North Atlantic Pressure Gradient (Mar) Table 8.4: The details of the predictors used for forecasting 2011 August rainfall over the country as a whole SR. NO. PARAMETERS CC ( ) 1 South Atlantic Mean Sea Level Pressure (Apr) South East Pacific Sea Surface Temperature (May) Central Pacific (Nino 3.4) Sea Surface Temperature Ano. Tendency (MAM-DJF) South Pacific Zonal Wind at 850hPa (April) Tropical North Atlantic Outgoing Long wave Radiation (Mar) Table 8.5: The details of the predictors used for forecasting 2010 September rainfall over the country as a whole No. Predictor C.C. ( ) 1. North Pacific Mean Sea Level Pressure (July) Central Pacific (Nino 3.4) Sea Surface Temperature Ano. Tendency (JJA-MAM) Bay of Bengal Sea Surface Temperature (June) Northwest Pacific MSLP(JJA) North Atlantic SST(JJA)
143 The performance of the model during the last 10 years of independent test period ( ) is given in the Fig.8.2. The model RMSE for the independent forecast period ( ) is 8.27% of LPA. As seen in the Table-8.2, for 2011, 3 out of 5 predictors were unfavorable for stronger than normal monsoon. The remaining 2 predictors were neutral. For training the model for 2011, data for the period were used. The root mean square error (RMSE) of the model for the training period ( ) is 8.16% of LPA Models for the Forecast of Monthly Rainfall over the Country as a Whole Monthly rainfall forecasts are issued for the months of July, August and September. The forecasts for July and August rainfall were issued in June along with the update forecast and that for September rainfall was issued on 1 st September. For the monthly rainfall forecasts over the country as a whole, principal component regression (PCR) technique was used. For the forecast of July rainfall over the country as a whole, a principal component regression (PCR) model with 5 predictors was used. The details of the parameters are given in Table-8.3. The model training period was and the model error was ± 9%. For the forecast of August rainfall over the country as a whole, a PCR model using another set of 5 predictors was used. The details of the parameters are given in Table The model training period is and the model error was ± 9%. For the forecast of September rainfall over the country as a whole, a PCR model based on 5 predictors was used. The details of the parameters are given in Table Data for the period were used to develop the model. The model uses moving training period method for the prediction with a constant window period of 33 years. In this way, rainfall during the second half of the monsoon season over the country as a whole was predicted for the period The model RMSE for the independent forecast period is 15% of LPA. For the 2011 September rainfall, the model was developed using data for the period The performances of the PCR models for monthly rainfall over the country as a whole for the months of July, August and September are given in the Figures 8.3a, 8.3b & 8.3c respectively. 135
144 120 PERFORMANCE FOR PCR MODEL FOR (AUGUST+SEPTEMBER) RAINFALL : ACTUAL FORECAST 100 RAINFALL (% OF LPA) YEAR Fig. 8.2: Performance of the MR model for the forecast of the rainfall during the second half of the monsoons season (August + September) over the country as a whole. PERFORMANCE FOR PCR MODEL FOR JULY RAINFALL : ACTUAL FORECAST 100 RAINFALL (% OF LPA) YEAR Fig. 8.3a: Performance of the PCR model for the forecast of the July rainfall over the country as a whole. 136
145 PERFORMANCE FOR PCR MODEL FOR AUGUST RAINFALL : ACTUAL FORECAST 100 RAINFALL (% OF LPA) YEAR Fig. 8.3b: Performance of the PCR model for the forecast of the August rainfall over the country as a whole PERFORMANCE FOR PCR MODEL FOR SEPTEMBER RAINFALL : ACTUAL FORECAST 120 RAINFALL (% OF LPA) YEAR Fig.8.3c: Performance of the PCR model for the forecast of the September rainfall over the country as a whole. 137

146 Fig. 8.4: Performance of the MR models for the forecast of the Season rainfall over the 4 geographical regions of the country for the independent period
147 Models for the Forecast of the Seasonal Rainfall over the Four Geographical Regions Separate MR models were used for the forecasting of season rainfall over 4 geographical regions of the country. The details of the parameters used in these models are given in Table All the three MR models were trained using data for the period The average model error for all the three models was taken as ±8% of LPA. The performance of the MR models for the four geographical regions for the period is given in the Fig.8.4. Table 8.6: The details of the parameters used for the forecasting of seasonal rainfall over the 4 homogeneous regions India Geographical Region Northwest India Central India South Peninsula Northeast India Predictor C.C. ( ) North Atlantic Mean Sea Level Pressure Gradient (May) 0.49 South Atlantic Mean Sea Level Pressure (Jan) East Asia Mean Sea Level Pressure (Feb+Mar) 0.53 North Central Pacific Zonal wind at 850 hpa (May) North Atlantic Sea Surface Temperature (Dec+Jan) North Atlantic Mean Sea Level Pressure Gradient (May) 0.60 North Atlantic Mean Sea Level Pressure (Mar) 0.54 Equatorial Indian Ocean Sea Level Pressure (Nov (-1)) South East Equatorial Indian Ocean Sea Surface Temperature (Oct (-1)) North West Europe Land Surface Air Temperature (Jan) 0.62 North West Pacific Zonal wind at 850 hpa (Feb) South East Pacific Mean Sea Level Pressure (May) 0.47 SE Indian Ocean Mean Sea Level Pressure (May) South Atlantic Mean Sea Level Pressure (Jan) Warm Water Volume (Feb+Mar) North Atlantic Mean Sea Level Pressure (Mar) 0.49 Central Pacific Sea Surface Temperature (May) North Atlantic Mean Sea Level Pressure (April) Verification of Operational Forecasts Forecast for the Monsoon Onset over Kerala An indigenously developed statistical model (Pai and Rajeevan, 2009) was used for preparing the operational forecast of the onset of monsoon over Kerala. The model based on 6 predictors used the principal component regression (PCR) method for its construction. Table-8.7 shows the list of the 6 predictors. Independent forecasts were derived using the sliding fixed window period of length 22 years. The model for 2011 was trained using data for the period Fig. 8.5 shows the performance of the forecast for the independent test period ( ). The RMSE of the model is about 4 days. 139
148 Table 8.7: Details of 6 predictors used for the prediction of monsoon onset over Kerala. No Name of Predictor Zonal Wind at 200hpa over Indonesian Region OLR Over South China Sea Pre-Monsoon Rainfall Peak Date Minimum Surface air Temperature over NW India Zonal Wind at 925hpa over Equatorial South Indian Ocean OLR Over Southwest Pacific Temporal Domain 16 th to 30 th April 16 th to 30 th April Pre-monsoon April-May 1 st to 15 th May Geographical Domain Correlation Coefficient ( ) 5S-5N, 90E-120E N-15N, 100E-120E 0.39 South Peninsula (8N-13N, 74E-78E) 1. Deesa 2. Rajkot 3. Guna 4. Bikaner 5. Akola 6. Barmer st -15 th May 10S-0, 80E-100E st to 15 th May 30S-20S, 145E-160E Performance of the PCR Model for Monsoon Onset over Kerala Monsoon Onset Over Kerala (Difference from the Normal Date) Actual MOK Forecast Year Fig. 8.5: Actual dates of monsoon onset over Kerala and their predictions from the PCR model for the period 1997 to For this year, the based on the PCR model, it was forecasted that monsoon will set in over Kerala on 31 st May with a model error of ±4days. The forecast came correct as the actual monsoon onset over Kerala took place on 29 th May, 2 days before the forecasted date. Thus this is the seventh consecutive correct operational 140
149 forecast for the monsoon onset over Kerala since issuing of operational forecast for the event was started in Forecasts for the Southwest Monsoon Rainfall As per the first stage long range forecast issued on 19th April, the season (June- September) rainfall for the country as a whole was expected to be 98% ± 5% of LPA. In the updated forecast issued on 21st June, the forecast for the country as a whole was revised to a lower value of 95% ± 4% of LPA. Though the actual season rainfall for the country as a whole (102% of LPA) was within the forecast limits of the first stage forecast, it was slightly (by 3%) higher than the upper limit of the second stage forecast. The forecast for the second half of the monsoon season (August September) for the country as a whole issued in August was 90% with a model error of 8% of LPA. This forecast was underestimated as the actual rainfall over the country as a whole during the second half of the season was 109% of LPA. The forecasts for monthly rainfall over the country as a whole for the months of July, August issued in June were 93% & 94% respectively with a model error of ± 9% and that for September issued in 1st September was 90% of LPA with a model error of ± 15%. The actual July month forecast, though overestimated the actual rainfall (85% of LPA), was within the lower forecast limit (93% - 9% of LPA). Whereas the forecast for August and September month turned out to be underestimates as the actual rainfall during August and September were 109% and 108% of LPA respectively. Considering the four broad geographical regions of India, the season rainfall was expected to be 97% of its LPA over northwest India, 95% of LPA over Central India, 95% of LPA over northeast India and 94% of LPA over South Peninsula all with a model error of ± 8%. The actual rainfalls over northwest India, central India, northeast India and south Peninsula were 107%, 110%, 87% and 100% of the LPA respectively. Thus the actual season rainfalls over south peninsula & northeast India were within the forecast limits. The forecast for northwest were 2% of LPA above the upper forecast limit and that for the Central India was 7% above the upper forecast limit. The Table-8.8 gives the summary of the verification of the long range forecasts issued for the 2011 Southwest monsoon. As seen in this table, 6 of the 10 operational long range forecasts. 141
150 Table-8.8: Verification of the operational long range forecast for SW monsoon rainfall Region Period Date of Issue Forecast (% of LPA) Actual Rainfall (% of LPA) All India June to September 19 th April 98 ± 5 All India June to September 95 ± 4 Northwest India June to September 97 ± Central India June to September 21 st June 95 ± Northeast India June to September 95 ± 8 87 South Peninsula June to September 94 ± All India July 93 ± 9 85 All India August 94 ± All India August to September 1 st August 90 ±8 109 All India September 1 st September 90 ± Experimental Forecasts IMD s Dynamical Model Forecasts For preparing experimental dynamical model forecast for the 2011 monsoon season rainfall, the seasonal forecast model (SFM) which was originally developed by Experimental Climate Prediction Center (ECPC), USA was used. The model resolution is T63 L28. The model climatology and hindcasts were prepared using the observed SSTs for the period The performance of the model during the hindcast period of 1985 to 2004 is not shown here as the same is presented in Pai and Sreejith (2010). Fig.8.6 shows the performance of the model during the forecast period of based on the persistence method. Forecasts based on forecasted SSTs have not been shown as the same was started only from Fig.8.6. Performance of the SFM forecast method during the period based on persistent SST method. 142

 forecasted SSTs were used as the boundary")
151 Fig.8.7a. Rainfall anomaly forecast over Indian region for the 2011 monsoon season computed from the SFM model based on March persistent SST method. Fig.8.7b. Rainfall anomaly forecast over Indian region for the 2011 monsoon season computed from the SFM model based on forecasted SST method. For this year, experimental forecasts for the southwest monsoon season (June to September) were generated by two methods; in the first method, SST anomaly of the month just prior to the beginning of the forecast period was persisted as the boundary conditions during the forecast period and in the second method, the NCEP coupled forecasting system (CFS) forecasted SSTs were used as the boundary conditions. For the first stage forecast, in the first method, March SST data were used for persisting boundary conditions and in the second method, April forecasted NCEP coupled forecasting system (CFS) SSTs were used as boundary conditions. For each case, ten ensemble member forecasts were obtained using the initial conditions corresponding to 00Z from 22 nd to 31 st March Figures 8.7a & 8.7b show the spatial distribution of rainfall anomaly forecast for the 2011 monsoon season persistent SST and forecasted SST methods prepared in April. The ensemble dynamical forecasts based on both the persistent SST anomaly as well as the forecasted SST methods suggest negative rainfall anomaly over most parts of the country. 143


152 For the updated forecast, in the first method, May sea surface temperature data were used for persisting boundary conditions. In the second method, the June forecasted NCEP CFS SSTs were used as the boundary conditions. For each case, ten ensemble member forecasts were obtained using the initial conditions corresponding to 00Z from 21 st to 30 th May, Figures 8.8a & 8.8b show the spatial distribution of rainfall anomaly forecast for the 2011 monsoon season based on persistent SST and forecasted SST methods. The forecast based on persistent SST indicates that rainfall anomalies are positive over most parts of the country except some areas of north and northwest India. The forecast based on forecasted SST indicates that rainfall anomalies are positive over most parts of the country except some areas of north Peninsula and northwest India. Fig. 8.8a. Rainfall anomaly forecast over Indian region for the 2011 monsoon season computed from the SFM model based on May persistent SST method. Fig. 8.8b. Rainfall anomaly forecast over Indian region for the 2011 monsoon season computed from the SFM model based on CFS forecasted SST method. In another effort, using predictors derived from forecast climate variables from NCEP CFS coupled model, a linear regression model was developed to predict the seasonal rainfall for the country as a whole (Pattanaik and Arun Kumar 2009). Based on the hindcasts for the seasonal rainfall over the country as whole during the period , it was observed that the skill of this empirical-dynamical hybrid approach was better than the 144
153 rainfall forecast derived from the NCEP CFS model rainfall simulation. For the year 2011, the forecast for the season rainfall over the country as a whole derived from this approach was 95% of LPA for April forecast and 92% of LPA for June forecast Forecasts for Seasonal rainfall from other Institutes in India Apart from IMD, many other research institutions in India are also involved in the long range forecasting research. Each year, these institutes provide experimental forecasts to IMD prior to issuing of operational forecast. For this year, experimental forecasts were provided by 6 institutes. The forecasts received from different institutes are given in the Table-8.9. Table - 8.9: Rainfall forecasts for the monsoon season of 2010 received from various research centers within the country other than IMD. S.N Institute Model April Forecast 1. (IITM) Pune 2. 3 (SAC), Ahmedabad CMMACS, Bangalore. Global SST 101 ± 7% of LPA K.E of mid lat. waves 100 ± 5% of LPA 2 Parameter Model 99 ± 4% of LPA Dynamical Model CFS1: 102% of LPA CFS2: 106% of LPA May/June Forecast No Update CFS1: 106% CFS2: 117% Genetic Algorithm 93 ± 4% % of LPA No Update The Variable- Resolution GCM 106% of LPA NA 4 NCMRWF Dynamical Model 95% of LPA 95% 5 6 C-DAC, Pune IMD, New Delhi NCEP T170L42 model for 2011 Hybrid Model 97% of LPA 95 % of LPA May: 86% Jun:97% May: 85% Jun: 92% As seen in the Table-8.9, the experimental forecasts issued by various national institutes showed large divergence. The experimental forecasts based on statistical models varied from 93 to 101% of LPA and that based on dynamical models varied from 85% to 117% of LPA. 145
154 Table 8.10: The inferences derived from multi model forecasts for the 2011 Southwest Monsoon season rainfall prepared by 4 International Climate Centres. S. No Centre issuing the MME forecast 1 European Centre for Medium Range Weather Forecast, UK. Model used for preparing the MME forecast 3 Models: ECMWF UKMO Meteo-France Inference for 2011 (issued in March /April2011) JAS & JJA (April 2011): Normal to above normal rainfall is most likely over most parts of the country. Inference for 2011 (issued in May/June 2011) JAS & JJA (May 2011): Normal to above normal rainfall is most likely over most parts of the country 2 International research Institute for Climate and Society, USA 3. WMO LC-LRF MME, South Korea 4 APEC Climate Centre, South Korea 7 Models: ECHAMp5 CCM3v6 NCEP NSIPP-1 COLA ECPC GFDL 4 Coupled Models: ECHAM-GML ECHAM- MOM3 ECHAM- MOM3-DIR2 NCEP-CFS AGCM and CGCM Forecasts from 12 GPCs 15 Models from the APEC region JJA & JAS (March 2011): Climatological probabilities for the entire Country JJA & JAS (March 2011): Normal to above normal rainfall is most likely over most parts of the country JJA (March 2011): Positive rainfall anomalies over most parts of the country except some parts of NE India. JJA (March 2011): Normal rainfall is most likely over central India and above normal rainfall is most likely over southern part of Peninsula and northern most part of the country. JJA & JAS (May 2011): Climatological probabilities for the most parts of the country except for some parts of north India where the highest probabilities are for normal to above normal rainfall. JJA & JAS (May 2011): Highest probability for above normal rainfall over Peninsula. Climatological probability for most parts of north India. JJA (May 2011): Positive rainfall anomalies over west coast and normal rainfall over most of the remaining areas JJA (May 2011): Above normal rainfall is most likely in the central areas and northeast part of the country. Climatological probabilities for remaining areas. 5 NCEP, USA Coupled Forecast system (Version 1) Coupled Forecast system (Version 2) JJA & JAS (April 2011): Below Normal Rainfall over Northeast India and above normal Rainfall over south Peninsula. JJA & JAS (April 2011): Below Normal Rainfall over Eastern parts of the country and along plains of Himalayas. Above normal Rainfall over Remaining areas. JJA & JAS (Jun 2011): Above Normal over most parts except over northeast and southeast Peninsula where the forecasted rainfall is below normal. JJA & JAS (Jun 2011): Above Normal Rainfall over central parts of the country. Below normal Rainfall over Remaining areas. 146


155 Fig.8.9a: JAS rainfall probability forecast from ECMWF issued in June Fig.8.9b: JAS rainfall probability forecast from IRI issued in June Fig.8.9c: JAS rainfall probability forecast from WMO lead center for LRF MME issued in June Fig.8.9d: JJA rainfall probability forecast from APCC issued in June Fig.8.9e: JAS rainfall anomaly forecast from CFS v1 issued in June Fig.8.9f: JAS rainfall anomaly forecast from CFS v2 issued in June
156 Forecasts from Major International Climate Prediction Centers Several international climate prediction centers regularly generate and provide global seasonal forecasts based on dynamical models (Atmospheric/ coupled GCMs) through web. Some of these centers also prepare Multi-Model Ensemble (MME) forecasts using combinations of forecasts prepared by different centers. It may be mentioned that none of these centers prepare forecasts specifically for the Indian region. The skill of the multi model ensemble forecasts has been found to be better than that of the individual models. Inferences derived from four international centers are given summarized in the Table Inferences from rainfall anomaly forecasts based on NCEP CFS-1 and CFS-2 are also given in the table. The MME forecast for the Indian region issued in the month of May/June by the four centers for the period July to September (JAS) are shown in Figures 8.9a to 8.9d. Forecast maps from the CFS-1 & CFS-2 are given in the Figures 8.9e & 8.9f. It is seen from the Table-8.10 that, the multi-model ensemble forecast issued in March/ April as well as that issued in May/June, in general, suggested normal to above normal rainfall over most parts of the country. However, there were differences in the spatial distribution of rainfall over the country predicted by various models 8.5. Conclusions The forecast for monsoon onset over Kerala for 2011 southwest monsoon season was correct, which is the seventh consecutive correct forecast for this event since issuing of forecast for the event was started in Only four out of 10 operational long range forecasts issued for the 2011 southwest monsoon rainfall were within the forecast limits and hence correct. Other six forecasts particularly those issued for the second half of the monsoon season were underestimating the actual rainfall situation and not correct. The April forecast (98% ± 5% of LPA) for the season rainfall over the country as a whole was accurate as the actual rainfall was 101.6% of LPA. However, the update forecast ((95% ± 4% of LPA) was underestimating the actual rainfall. The actual rainfall was 2.6% more than the upper forecast limit. The other forecasts which are within the forecasts limits and hence correct were forecast for July rainfall over the country as a whole and forecast for season rainfall over NE India and South Peninsula. The forecasts which are out of the forecast limits are season rainfall forecasts over NW India and Central India rainfall, and forecast for the country as a whole for the second half of the season and monthly rainfall forecasts for August & September. All these forecasts were underestimating the actual rainfall situation. The experimental forecasts issued by various national institutes other than IMD showed large divergence. The experimental forecasts based on statistical models varied from 93 to 101% of LPA and that based on dynamical models varied from 85% to 117% of 148
157 LPA. Thus the forecasts from the statistical models were more converging and closer to the actual rainfall than the forecasts from the dynamical models. The multi-model ensemble forecast from international climate centers, in general, suggested normal to above normal rainfall over most parts of the country. References Pai, D. S. and Rajeevan, M., 2009, Summer monsoon onset over Kerala: New Definition and Prediction, J. Earth Syst. Sci. 118, No. 2, pp Pai, D. S. and Sreejith, O. P., 2010, Verification of the Operational and Experimental Long Range Forecasts in Monsoon 2009: A Report (Editors: Ajit Tyagi, H. R. Hatwar and D. S. Pai), IMD Met. Monograph No. Synoptic Meteorology No. 9/2010, IMD, pp Pai, D. S., O.P.Sreejith, S. G. Nargund, Madhuri Musale, and Ajit Tyagi, 2011, Present Operational Long Range Forecasting System for Southwest Monsoon Rainfall over India and its Performance During 2010, Mausam, 62, N2, pp Pattanaik, D. R. and Arun Kumar, 2010, Prediction of summer monsoon rainfall over India using the NCEP climate forecast system, Climate Dynamics, 34:4, pp
158 9 FEATURES OF SOUTHWEST MONSOON-2011 AS OBSERVED IN SATELLITE PRODUCTS O. P. Singh and C. S. Tomar This Chapter discusses use of satellite products in monitoring various features like onset, advance and withdrawal of 2011 southwest monsoon. Satellite derived aerosol loading over Indo-Gangetic plains is also discussed Simultaneous onset of southwest monsoon 2011 over Kerala and Andaman Sea One of the interesting features of Monsoon-2011 was that no onset vortex formed over the Arabian Sea and then simultaneous monsoon onset took place over Kerala, some parts of Tamil Nadu, south Bay of Bengal and South Andaman Sea on 29 th May 2011 that is 3 days before its normal date of onset over Kerala. The following satellite based criteria is being used for onset of monsoon over Kerala. 3 SL. No Parameter Depth of Westerly Region N, of E Criteria Should be maintained up to 600 observation hpa 14 Outgoing SSM/I Surface Longwave Winds Radiations (OLR) 25 Low SSM/I level Water Zonal winds Vapour (925hPa) N, E Below Maxima 200wm > 16m/s -2 On the day of onset & two days prior N, N, E 0 E Maxima knots 6gm/cm 2 On the day of onset & two days prior. 150

.")


.")

.")


159 Ocean surface winds show that cross-equatorial flow was weak till 3 rd week to May and wind strengthened to 10 m/s over south Arabian Sea and adjoining Indian Ocean during 4 th week of May 2011 (Fig. 9.1). Infrared imageries show that convective clouds started increasing from the 3 rd week of May over southwest Arabian Sea and adjoining Indian Ocean and toward the end of May convection spread over south Arabian Sea, southeast Bay of Bengal and South Andaman Sea (Fig. 9.2; IR, OLR images). Similarly, daily mean OLR between latitude N and longitude E started decreasing from the third week of May and it remained below 200 Watts/m 2 on 27 th, 28 th and 29 th May 2011 (Fig. 9.3). So, OLR based criteria was well satisfied. Fig. 9.1: SSM/I and TMI derived ocean surface winds speed for the week ending of 14 th, 21 st and 28 th May 2011 shows gradual strengthening of cross-equatorial winds over both sides of equator. Fig.9.2: Kalpana-1 infrared imageries with cloud top temperature for 0600UTC of 27 th, 28 th and 29 th May
. Figs. 9.5-9.")
160 Fig.9.3: Kalpana-1 derived daily mean OLR for the region between latitude N and longitude E from 10 th May to the date of onset of monsoon over Kerala (watts/m 2 ). Southwesterly winds of about 25 knots were observed in cloud motion vectors between hpa over south Arabian Sea and adjoining Indian Ocean (Fig. 9. 4). Figs depict some more satellite products at the time of monsoon onset in Fig. 9.4: Meteosat-7 derived low level winds for 0600 UTC of 29 th May Red colour rectangle indicates the region between latitude N longitude E. 152
 derived from the combination of SSM/I +TMI+AMSR-E payloads for 27 th, 28 th and 29 th May")


161 Fig. 9.5: Ocean surface wind speed (m/s) derived from the combination of SSM/I +TMI+AMSR-E payloads for 27 th, 28 th and 29 th May Fig. 9.6: Columnar water vapour (gm/cm2) derived from the combination of SSM/I +TMI+AMSR-E payloads for 27 th, 28 th and 29 th May Advance of Monsoon During first week of June there was further strengthening in cross-equatorial flow and hence monsoon advanced rapidly over parts of southern peninsula up to Goa and south Andhra Pradesh (Fig. 9.7: SSMI winds, IR, OLR). Before the formation of a vortex over northeast and adjoining east-central Arabian Sea on 10 th June there was short hiatus along the west coast (Fig. 9.8). This vortex reached to maximum intensity of T1.5 and then crossed the Saurashtra coast, near Diu on 11 th night and weakened into a well marked low pressure area over Saurashtra and adjoining areas on 12 th June. Although wind shear was of the order of 20knots from 10 th to 12 th June but the ocean heat content was less than 60 KJ/cm 2 on 11 th and 12 th June which was not favourable for intensification. It caused isolated heavy to very heavy falls and isolated extremely heavy falls over Saurashtra & Diu and Konkan & Goa and helped in northward advance of monsoon along the west coast of India. 153
 SSMI winds for")
 Kaplapan-1")

162 (a) (b) (c) Fig. 9.7: (a) SSMI winds for week ending on 4 th June2011; (b) Kaplapan-1 visible imagery for 0600UTC of 3 rd, and 6 th June


163 Fig. 9.8: Kaplapa-1 visible imagery and Meteosat-7 derived wind shear for 0600 UTC of 10 th, 11 th and 12 th June Another vortex formed over the north Bay of Bengal on 15 th June. Under the influence of favourable conditions like: low to moderate vertical wind shear(10-20 knots), upper level divergence and higher sea surface temperature ( C); the system intensified further into a deep depression (T2.0) just before crossing the west Bengal- Bangladesh coast on 16 th evening (Fig. 9.9). After crossing the coast, it moved westnorthwestwards across Gangetic West Bengal, Jharkhand, north Chhattisgarh and west Madhya Pradesh during 17 th -23 rd June and weakened gradually (Fig. 9.9). Under the influence of the system, widespread rainfall with isolated heavy to very heavy falls occurred over Orissa, Gangetic West Bengal Jharkhand, Chattisgarh, Madhya Pradesh, east Rajasthan, Bihar and Uttar Pradesh. Though this system caused the monsoon to cover most parts of the country but there was a hiatus in the further advance of monsoon over western parts of Rajasthan and north Gujarat state from 2 nd week of June to 1 st week of July (Fig.9. 10: weekly OLR). 155
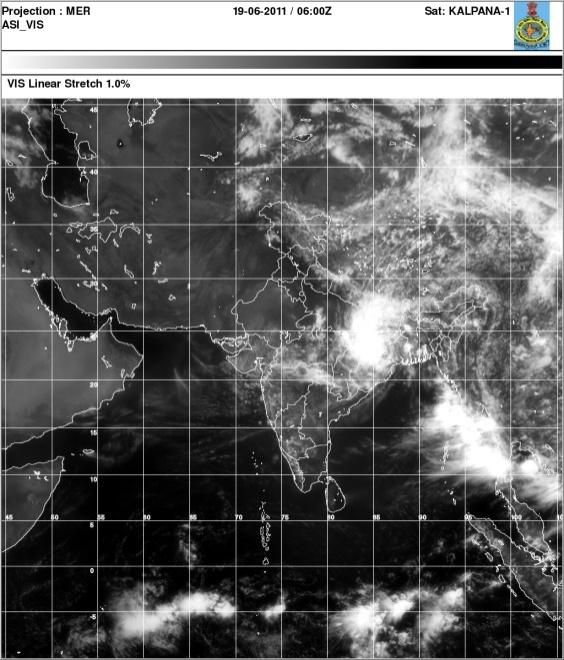


164 156


165 Fig. 9.9: Kalpana-1 visible imagery of 0600 UTC from 16th to 23rd June, MODIS aerosol loading over the Indo-Gangetic plains Fig.9.10 shows the MODIS aerosol loadings during June-Sept, Anomalously higher values were observed during July showing weak monsoon conditions. Fig. 9.10: MODIS aerosol loading during June-Sept,

166 9.4. Northward propagation of convective clouds as observed in satellite imageries & products Fig shows Northward propagation of convective clouds as observed in satellite imageries & products. Fig shows northward propagation of convective clouds between latitude 50 0 E to E and 15 0 S to 35 0 N for the period 1 st June to 30 th September It clearly shows three modes of south- north propagation, first at the time of the onset of monsoon; second during 2 nd week of July and third & final started during the last week of July The first and second modes were of the shorter duration o but the third mode was of longer duration starting from end of July to the mid-september. Fig. 9.11: Kalpana-1 derived daily mean OLR (Watts/m 2 ) 9.5. Withdrawal of Monsoon Withdrawal process of monsoon from Northwest India was delayed as the two overlapping low pressure areas in the first fortnight of September maintained easterly low level (850 hpa) flow over the Gangetic Plains up to Punjab. However, with the weakening of the low over southern Pakistan on 14 th September and Bihar on th September the stage was set for the beginning of the withdrawal process. However, another low pressure area formed over the northwest Bay of Bengal on 19 th September which intensified into a depression on 22 nd September. The depression weakened on 24 th September but its remnant as low continued up to 27 th September which disappeared over Sub-Himalayan West Bengal on 27 th September. In this disturbance rains were only confined to the zone of the disturbance and rain had stopped over most parts of the NW India from 21 st September. The weakening of this last low pressure area of the season led to the withdrawal of the monsoon from NW India continued over the Central Gangetic Plains and the adjoining Western & Central India till the end of September. Figs depict some satellite derived products at the time of withdrawal. 158


167 Fig. 9.12: Kalpana-1 derived daily UTH 23 rd, 26 th, 27 th Sep 2011 (0300 UTC). Fig. 9.13: Kalpana-1 OLR for week ending on 7 th, 14 th, 21 st, 29 th Sep


168 Fig. 9.14: Visible and water vapour imageries during withdrawal. 160
169 10 UTILITY OF AUTOMATIC WEATHER STATION (AWS) DATA FOR MONITORING AND PREDICTION OF CYCLONIC DISTURBANCES DURING 2011 M. Mohapatra, Naresh Kumar and Manish Ranalkar India Meteorological Department (IMD) has augmented its Automatic Weather Station (AWS) network under its modernisation programme with the network of 550 AWSs considering its utility in monitoring and prediction of weather events. Considering the large number of AWSs and their utility in forecasting and numerical weather prediction (NWP) modeling, it is essential to deal with the issues like representativeness, accuracy and real time collection etc along with proper documentation of the quality of network of AWSs. In this Chapter, analysis of the performance of AWS for monitoring and prediction of three land falling monsoon disturbances (2 depression and 1 deep depression) during 2011 monsoon season has been presented Introduction: IMD has augmented its AWS network under its modernisation programme considering its utility in monitoring and prediction of weather events including monsoon circulations (Mohapatra et al, 2009, 2010, 2011, Bhatia et al, 2008). The number of AWS in the county is about 550 and that of ARG stations exceeds 450 by the end of The advantages and limitations of AWS over conventional manual recording have been discussed by Mohapatra et al (2010, 2011). Considering the large network and IMD s further plan for extension of this network in its modernisation phase II, it is therefore essential to deal with the issues like representativeness, accuracy and real time collection etc. along with 161
170 proper documentation of the quality of network. Hence, a study has been undertaken to analyze and document the performance of AWS for monitoring and prediction of land-falling cyclonic disturbances (depression and above) during The north Indian Ocean witnessed the formation of nine cyclonic disturbances including one cyclone (Keila) during Out of nine disturbances four cyclonic disturbances formed over the Bay of Bengal, four over the Arabian Sea and one depression over the land surface. Out of the four cyclonic disturbances over the Bay of Bengal, two intensified up to the stage of deep depression. Out of four cyclonic disturbances formed over the Arabian Sea, one intensified up to the stage of cyclonic storm (KEILA) and two up to the stage of deep depression. There were three cyclonic disturbances formed over the north Indian Ocean during monsoon season. Out of four cyclonic disturbances over the Bay of Bengal, two made landfall over India coast. A deep depression crossed Odisha-West Bengal coast on 16 June 2011 and a depression crossed Odisha coast near Balasore on 22 September Another deep depression (19-20 October 2011) crossed Bangladesh coast. Out of the four disturbances over the Arabian Sea, only one (depression, June 2011) crossed Indian coast (crossed Gujarat coast near Diu). Hence, only three depressions/deep depressions crossed India coast during 2011 and all of them occurred during monsoon season. Tracks of these cyclonic disturbances are shown in Fig The AWS data observed during these cyclonic disturbance periods of monsoon, 2011 have been analyzed to monitor location, intensity, movement and landfall and associated rainfall. The utility of the AWS data for the prediction purpose has also been examined. This study will help in better application of AWS network in monitoring and prediction of such high impact weather events Data and methodology: The AWS data from IMD stations as obtained from IMD, Pune have been analysed for landfalling disturbances which crossed India coast and the results for the following cases are presented and discussed. (i) Depression (11-12 June, 2011) (ii) Deep depression over the Bay of Bengal (16-23 June, 2010) (iii) Depression (22-23 September, 2011) The hourly AWS data have been used for this purpose. To validate the synoptic features observed in AWS analysis, the analyses of corresponding synoptic observations from nearest stations have been considered. The network of AWS seems to be optimum for the cases of cyclonic disturbances presented and discussed here. The results are presented and analysed in Sec The broad conclusions are presented in Sec
171 10.3. Results and discussion: The performance of AWS during depression (11-12 June, 2011) over the Arabian sea is presented and discussed in Sec The performance of AWS with respect to deep depression over the Bay of Bengal (16-23 June 2011) is analyzed and presented in Sec The performance of AWS with respect to depression (22-23 September, 2011) is analyzed and discussed in Sec Fig.10.1: Tracks of depressions/deep depressions during June and September


172 (a) (b) Fig. 10.2: Network of (a) old and (b) new AWSs in India 164
Government of India India Meteorological Department (Ministry of Earth Sciences) Subject: Current weather conditions and forecast for next two weeks
 Subject: Current weather conditions and forecast for next two weeks") Government of India India Meteorological Department (Ministry of Earth Sciences) Press Release Dated 18 June, 2010 Subject: Current weather conditions and forecast for next two weeks Advance of monsoon
Government of India India Meteorological Department (Ministry of Earth Sciences) Press Release Dated 18 June, 2010 Subject: Current weather conditions and forecast for next two weeks Advance of monsoon
ALL INDIA WEATHER SUMMARY AND FORECAST BULLETIN
 Saturday 21 April 2018 MORNING Time of Issue: 0800 hours IST ALL INDIA WEATHER SUMMARY AND FORECAST BULLETIN Significant Weather Features Isolated thunder squalls and hailstorms are very likely over Sub
INDIA METEOROLOGICAL DEPARTMENT (MINISTRY OF EARTH SCIENCES) SOUTHWEST MONSOON-2014 END OF SEASON REPORT For the state of RAJASTHAN
 SOUTHWEST MONSOON-2014 END OF SEASON REPORT For the state of RAJASTHAN") INDIA METEOROLOGICAL DEPARTMENT (MINISTRY OF EARTH SCIENCES) SOUTHWEST MONSOON-2014 END OF SEASON REPORT For the state of RAJASTHAN HIGHLIGHTS For the country as a whole, the rainfall for the season (June-September)
INDIA METEOROLOGICAL DEPARTMENT (MINISTRY OF EARTH SCIENCES) SOUTHWEST MONSOON-2014 END OF SEASON REPORT For the state of RAJASTHAN HIGHLIGHTS For the country as a whole, the rainfall for the season (June-September)
Long Range Forecast Update for 2014 Southwest Monsoon Rainfall
 Earth System Science Organization (ESSO) Ministry of Earth Sciences (MoES) India Meteorological Department PRESS RELEASE New Delhi, 9 June 2014 Long Update for 2014 Southwest Monsoon Rainfall HIGHLIGHTS
ALL INDIA WEATHER SUMMARY AND FORECAST BULLETIN
 Sunday 22 April 2018 NIGHT Time of Issue: 2000 hours IST ALL INDIA WEATHER SUMMARY AND FORECAST BULLETIN Significant Weather Features The ongoing fairly widespread rainfall activity with isolated thunder
ALL INDIA WEATHER SUMMARY AND FORECAST BULLETIN
 Tuesday 08 May 2018 MID DAY Time of Issue: 1345 hours IST ALL INDIA WEATHER SUMMARY AND FORECAST BULLETIN Significant Weather Features Under the influence of the present Western Disturbance over Jammu
W E E K L Y MONSOON INSIGHT
 W E E K L Y MONSOON INSIGHT 08 th July 2016 Indian Monsoon Dynamics Recent Weather Development India received 35% surplus rainfall in the week ended 6 July with all regions recording above-normal rainfall
National Climate Centre India Meteorological Department PUNE INDIA
 IMD Met Monograph No: Synoptic Meteorology No: 7/2009 Government of India India Meteorological Department Edited by Ajit Tyagi, H. R. Hatwar and D. S. Pai National Climate Centre India Meteorological Department
CURRENT STATUS OF MONSOON Main Meteorological conditions of the last week (27August to 2 September)
") CURRENT STATUS OF MONSOON 2009 Main Meteorological conditions of the last week (27August to 2 September) Last week s low pressure area over Orissa and neighbourhood moved west-northwestwards across central
CURRENT STATUS OF MONSOON 2009 Main Meteorological conditions of the last week (27August to 2 September) Last week s low pressure area over Orissa and neighbourhood moved west-northwestwards across central
Prediction of western disturbances and associated weather over Western Himalayas
 Prediction of western disturbances and associated weather over Western Himalayas H. R. Hatwar*, B. P. Yadav and Y. V. Rama Rao India Meteorological Department, Lodi Road, New Delhi 110 003, India Two cases
KUALA LUMPUR MONSOON ACTIVITY CENT
 T KUALA LUMPUR MONSOON ACTIVITY CENT 2 ALAYSIAN METEOROLOGICAL http://www.met.gov.my DEPARTMENT MINISTRY OF SCIENCE. TECHNOLOGY AND INNOVATIO Introduction Atmospheric and oceanic conditions over the tropical
Suppressed Surface Heating over northwestern parts of the Country and the ensuing Monsoon Rainfall
 Suppressed Surface Heating over northwestern parts of the Country and the ensuing Monsoon Rainfall During this year, the temperatures have been below normal over north and northwestern parts of India.
Monsoon. Monsoon A Report. N. Jayanthi, M. Rajeevan, A. K. Srivastava, Sunitha Devi, S. K. Roy Bhowmik and H. R. Hatwar
 IMD Met. Monograph No. : Synoptic Meteorology No. 4/2006 DESIGNED & PRINTED AT THE METEOROLOGICAL OFFICE PRESS, OFFICE OF THE ADDITIONAL DIRECTOR GENERAL OF METEOROLOGY (RESEARCH),PUNE GOVERNMENT OF INDIA
Key Finding: Long Term Trend During 2014: Rain in Indian Tradition Measuring Rain
 Chapter 34 RAINFALL Key Finding: Long Term Trend Despite of theories suggesting increase in rainfall in Asian Region due to global warming, no significant trend has been observed at all India level (confirmed
3. HYDROMETEROLOGY. 3.1 Introduction. 3.2 Hydro-meteorological Aspect. 3.3 Rain Gauge Stations
 3. HYDROMETEROLOGY 3.1 Introduction Hydrometeorology is a branch of meteorology and hydrology that studies the transfer of water and energy between the land surface and the lower atmosphere. Detailed hydrological
Seasonal Climate Outlook for South Asia (June to September) Issued in May 2014
 Issued in May 2014") Ministry of Earth Sciences Earth System Science Organization India Meteorological Department WMO Regional Climate Centre (Demonstration Phase) Pune, India Seasonal Climate Outlook for South Asia (June
Ministry of Earth Sciences Earth System Science Organization India Meteorological Department WMO Regional Climate Centre (Demonstration Phase) Pune, India Seasonal Climate Outlook for South Asia (June
ALL INDIA INSTALLED CAPACITY (IN MW) OF POWER STATIONS
 OF POWER STATIONS") Region Northern Region Western Region Southern Region Eastern Region North Eastern Region Islands ALL INDIA Figures at decimal may not tally due to rounding off ALL INDIA INSTALLED CAPACITY (IN MW) OF
Region Northern Region Western Region Southern Region Eastern Region North Eastern Region Islands ALL INDIA Figures at decimal may not tally due to rounding off ALL INDIA INSTALLED CAPACITY (IN MW) OF
The Abnormal Indian Summer Monsoon of 2002: JRA25 Reanalysis
 The Abnormal Indian Summer Monsoon of 2002: JRA25 Reanalysis D. Rajan 1,2, T. Koike 2, J. Matsumoto 2 1 NCMRWF, Ministry of Earth Sciences, India 2 CEOP Lab, University of Tokyo, Japan Correspondence:
Date of. Issued by (AICRPAM), & Earth System
, & Earth System") National Agromet Advisory Service Bulletin Based on Extended Range Weather Forecast (ERFS) Validity: 29 September 12 October 2017 Date of Issue: 29 September 2017 Issued by Indian Council of Agricultural
National Agromet Advisory Service Bulletin Based on Extended Range Weather Forecast (ERFS) Validity: 29 September 12 October 2017 Date of Issue: 29 September 2017 Issued by Indian Council of Agricultural
UPDATE OF REGIONAL WEATHER AND SMOKE HAZE (December 2017)
") UPDATE OF REGIONAL WEATHER AND SMOKE HAZE (December 2017) 1. Review of Regional Weather Conditions for November 2017 1.1 In November 2017, Southeast Asia experienced inter-monsoon conditions in the first
UPDATE OF REGIONAL WEATHER AND SMOKE HAZE (December 2017) 1. Review of Regional Weather Conditions for November 2017 1.1 In November 2017, Southeast Asia experienced inter-monsoon conditions in the first
ALL INDIA INSTALLED CAPACITY (IN MW) OF POWER STATIONS
 OF POWER STATIONS") Region Northern Region Western Region Southern Region Eastern Region North Eastern Region Islands ALL INDIA Figures at decimal may not tally due to rounding off ALL INDIA INSTALLED CAPACITY (IN MW) OF
Region Northern Region Western Region Southern Region Eastern Region North Eastern Region Islands ALL INDIA Figures at decimal may not tally due to rounding off ALL INDIA INSTALLED CAPACITY (IN MW) OF
AFP Surveillance Bulletin - India Report for week 1, ending 5 January 2019
 Jan-18 Feb-18 Mar-18 Apr-18 May-18 Jun-18 Jul-18 Aug-18 Sep-18 Oct-18 Nov-18 Dec-18 Jan-19 Table 1: cases by month of paralysis onset, last 13 months State/UT's Total cases in cases as on week 1, cases
Part 1: Weather Forecast Severe Weather Warnings (Source: IMD, Date: 1 st September, 2008)
") Sphere India Unified Response Strategy Situation report (India Floods 2008) 01 st September 2008 Part 1: Weather Forecast Severe Weather Warnings (Source: IMD, Date: 1 st September, 2008) HEAVY RAINFALL
Sphere India Unified Response Strategy Situation report (India Floods 2008) 01 st September 2008 Part 1: Weather Forecast Severe Weather Warnings (Source: IMD, Date: 1 st September, 2008) HEAVY RAINFALL
ALL INDIA INSTALLED CAPACITY (IN MW) OF POWER STATIONS
 OF POWER STATIONS") Region Northern Region Western Region Southern Region Eastern Region North Eastern Region Islands ALL INDIA Figures at decimal may not tally due to rounding off ALL INDIA INSTALLED CAPACITY (IN MW) OF
Region Northern Region Western Region Southern Region Eastern Region North Eastern Region Islands ALL INDIA Figures at decimal may not tally due to rounding off ALL INDIA INSTALLED CAPACITY (IN MW) OF
UPDATE OF REGIONAL WEATHER AND SMOKE HAZE (February 2018)
") UPDATE OF REGIONAL WEATHER AND SMOKE HAZE (February 2018) 1. Review of Regional Weather Conditions for January 2018 1.1 The prevailing Northeast monsoon conditions over Southeast Asia strengthened in January
UPDATE OF REGIONAL WEATHER AND SMOKE HAZE (February 2018) 1. Review of Regional Weather Conditions for January 2018 1.1 The prevailing Northeast monsoon conditions over Southeast Asia strengthened in January
HYDROMET SERVICES FOR FLOOD FORECASTING. Dr. Surinder Kaur IMD, India, New Delhi
 HYDROMET SERVICES FOR FLOOD FORECASTING Dr. Surinder Kaur IMD, India, New Delhi Real Time Rainfall monitoring Hydromet Services Hyomet design Flood meteorological Services AWS=675 ARG=1289 Surface obs(dept)=
EVALUATION OF BROAD SCALE VERTICAL CIRCULATION AND THERMAL INDICES IN RELATION TO THE ONSET OF INDIAN SUMMER MONSOON
 INTERNATIONAL JOURNAL OF CLIMATOLOGY Int. J. Climatol. 22: 649 661 (2002) Published online in Wiley InterScience (www.interscience.wiley.com). DOI: 10.1002/joc.742 EVALUATION OF BROAD SCALE VERTICAL CIRCULATION
Thai Meteorological Department, Ministry of Digital Economy and Society
 Thai Meteorological Department, Ministry of Digital Economy and Society Three-month Climate Outlook For November 2017 January 2018 Issued on 31 October 2017 -----------------------------------------------------------------------------------------------------------------------------
UPDATE OF REGIONAL WEATHER AND SMOKE HAZE (May 2017)
") UPDATE OF REGIONAL WEATHER AND SMOKE HAZE (May 2017) 1. Review of Regional Weather Conditions in April 2017 1.1 Inter monsoon conditions, characterised by afternoon showers and winds that are generally
UPDATE OF REGIONAL WEATHER AND SMOKE HAZE (May 2017) 1. Review of Regional Weather Conditions in April 2017 1.1 Inter monsoon conditions, characterised by afternoon showers and winds that are generally
Long Range Forecasts of 2015 SW and NE Monsoons and its Verification D. S. Pai Climate Division, IMD, Pune
 Long Range Forecasts of 2015 SW and NE Monsoons and its Verification D. S. Pai Climate Division, IMD, Pune Other Contributors: Soma Sen Roy, O. P. Sreejith, Kailas, Madhuri, Pallavi, Mahendra and Jasmine
UPDATE OF REGIONAL WEATHER AND SMOKE HAZE (September 2017)
") UPDATE OF REGIONAL WEATHER AND SMOKE HAZE (September 2017) 1. Review of Regional Weather Conditions in August 2017 1.1 Southwest Monsoon conditions continued to prevail in the region in August 2017. The
UPDATE OF REGIONAL WEATHER AND SMOKE HAZE (September 2017) 1. Review of Regional Weather Conditions in August 2017 1.1 Southwest Monsoon conditions continued to prevail in the region in August 2017. The
Rainfall analysis for Indian monsoon region using the merged rain gauge observations and satellite estimates: Evaluation of monsoon rainfall features
 Rainfall analysis for Indian monsoon region using the merged rain gauge observations and satellite estimates: Evaluation of monsoon rainfall features SKRoyBhowmikand Ananda K Das India Meteorological Department,
7 December 2016 Tokyo Climate Center, Japan Meteorological Agency
 Summary of the 2016 Asian Summer Monsoon 7 December 2016 Tokyo Climate Center, Japan Meteorological Agency This report summarizes the characteristics of the surface climate and atmospheric/oceanographic
CHAPTER 4 CIRCULATION OF PUBLICATIONS
 Circulation of Publications 49 CHAPTER 4 CIRCULATION OF PUBLICATIONS 4.1. A total number of 29,599 publications furnished their circulation figures online for 2016-17 claiming a total circulation of 48,80,89,490
Department of Meteorology and Oceanography Andhra University, Visakhapatnam
 Numerical Prediction of The Heavy Rainfall Events During Armex phase- I of The Summer Monsoon, 2002 D.V. Bhaskar Rao, D. Hari Prasad and Satyaban B. Ratna Department of Meteorology and Oceanography Andhra
Introduction of climate monitoring and analysis products for one-month forecast
 Introduction of climate monitoring and analysis products for one-month forecast TCC Training Seminar on One-month Forecast on 13 November 2018 10:30 11:00 1 Typical flow of making one-month forecast Observed
PART III. Heavy Rains
 PART III Heavy Rains Observational Analysis of Heavy Rainfall during Southwest Monsoon over India Pulak Guhathakurta India Meteorological Department, Pune 411005, India pguhathakurta@rediffmail.com 1.
National Project on Organic Farming
 National Project on Organic Farming Department of Agriculture and Cooperation, Ministry of Agriculture Government of India Biofertilizers and Organic Fertilizers Statistics Year 2005-06 to 2009-10 Compiled
Analysis of Heavy Precipitation Events Over Western Himalayan Region
 INTERNATIONAL JOURNAL OF EARTH AND ATMOSPHERIC SCIENCE Journal homepage: www.jakraya.com/journal/ijeas Analysis of Heavy Precipitation Events Over Western Himalayan Region B.P. Yadav, Naresh Kumar and
ENSO Cycle: Recent Evolution, Current Status and Predictions. Update prepared by Climate Prediction Center / NCEP 23 April 2012
 ENSO Cycle: Recent Evolution, Current Status and Predictions Update prepared by Climate Prediction Center / NCEP 23 April 2012 Outline Overview Recent Evolution and Current Conditions Oceanic Niño Index
Verification of the Seasonal Forecast for the 2005/06 Winter
 Verification of the Seasonal Forecast for the 2005/06 Winter Shingo Yamada Tokyo Climate Center Japan Meteorological Agency 2006/11/02 7 th Joint Meeting on EAWM Contents 1. Verification of the Seasonal
TROPICAL CYCLONE TC 03A FOR THE PERIOD 3 RD JUNE TO 10 TH JUNE, 1998
 TROPICAL CYCLONE TC 03A FOR THE PERIOD 3 RD JUNE TO 10 TH JUNE, 1998 Hazrat Mir, Abdul Rashid, Waqarul Wheed Khan. Introduction: This report gives the review of cyclonic storm formed over the East Arabian
Occurrence of heavy rainfall around the confluence line in monsoon disturbances and its importance in causing floods
 Occurrence of heavy rainfall around the confluence line in monsoon disturbances and its importance in causing floods GNAGESWARA RAO Department of Meteorology & Oceanography, Andhra University, Visakhapatnam
Performance of all-india southwest monsoon seasonal rainfall when monthly rainfall reported as deficit/excess
 METEOROLOGICAL APPLICATIONS Meteorol. Appl. 21: 619 634 (14) Published online 12 March 13 in Wiley Online Library (wileyonlinelibrary.com) DOI:.2/met.138 Performance of all-india southwest monsoon seasonal
Government of Sultanate of Oman Public Authority of Civil Aviation Directorate General of Meteorology. National Report To
 Government of Sultanate of Oman Public Authority of Civil Aviation Directorate General of Meteorology National Report To Panel on Tropical Cyclones in the Bay of Bengal And Arabian Sea 43rd Session, India
Districtwise Drought Climatology Of The Southwest Monsoon Season over India Based on Standardized Precipitation Index (SPI) D. S.
 D. S.") E N MARCH 2010 RR No. 2/2010 NCC RESEARCH REPORT Districtwise Drought Climatology Of The Southwest Monsoon Season over India Based on Standardized Precipitation Index (SPI) D. S. Pai Latha Sridhar Pulak
E N MARCH 2010 RR No. 2/2010 NCC RESEARCH REPORT Districtwise Drought Climatology Of The Southwest Monsoon Season over India Based on Standardized Precipitation Index (SPI) D. S. Pai Latha Sridhar Pulak
Introduction of products for Climate System Monitoring
 Introduction of products for Climate System Monitoring 1 Typical flow of making one month forecast Textbook P.66 Observed data Atmospheric and Oceanic conditions Analysis Numerical model Ensemble forecast
Advanced Hydrology. (Web course)
") Advanced Hydrology (Web course) Subhankar Karmakar Assistant Professor Centre for Environmental Science and Engineering (CESE) Indian Institute of Technology Bombay Powai, Mumbai 400 076 Email: skarmakar@iitb.ac.in
Advanced Hydrology (Web course) Subhankar Karmakar Assistant Professor Centre for Environmental Science and Engineering (CESE) Indian Institute of Technology Bombay Powai, Mumbai 400 076 Email: skarmakar@iitb.ac.in
Issued by the: Climate Services Division Fiji Meteorological Service Nadi Airport. 27 October 2010 GENERAL STATEMENT
 Fiji Meteorological Service (FMS) Tropical Cyclone Guidance for Season 2010/11 for the Fiji and the Southwest Pacific RSMC Region 160E to 120W Equator to 25 South Issued by the: Climate Services Division
MAURITIUS METEOROLOGICAL SERVICES
 MAURITIUS METEOROLOGICAL SERVICES CLIMATE DECEMBER 2018 Introduction December 2018 was warm and wet. The mean monthly rainfall recorded islandwise was 261 mm which is 151 % of the normal. ENSO conditions
Evidence for Weakening of Indian Summer Monsoon and SA CORDEX Results from RegCM
 Evidence for Weakening of Indian Summer Monsoon and SA CORDEX Results from RegCM S K Dash Centre for Atmospheric Sciences Indian Institute of Technology Delhi Based on a paper entitled Projected Seasonal
International Journal of Integrated Sciences & Technology 2 (2016) 55-61
 55-61") International Journal of Integrated Sciences & Technology 2 (2016) 55-61 Changes in Latent Heat Energy and Moist Static Energy Contents of the Atmosphere over Bangladesh and Neighbourhood during the Formation
International Journal of Integrated Sciences & Technology 2 (2016) 55-61 Changes in Latent Heat Energy and Moist Static Energy Contents of the Atmosphere over Bangladesh and Neighbourhood during the Formation
ENSO Cycle: Recent Evolution, Current Status and Predictions. Update prepared by Climate Prediction Center / NCEP 11 November 2013
 ENSO Cycle: Recent Evolution, Current Status and Predictions Update prepared by Climate Prediction Center / NCEP 11 November 2013 Outline Overview Recent Evolution and Current Conditions Oceanic Niño Index
MAURITIUS METEOROLOGICAL SERVICES
 MAURITIUS METEOROLOGICAL SERVICES CLIMATE DECEMBER 2018 Introduction December 2018 was warm and wet. The mean monthly rainfall recorded islandwise was 261 mm which is 151 % of the normal. ENSO conditions
Charles Jones ICESS University of California, Santa Barbara CA Outline
 The Influence of Tropical Variations on Wintertime Precipitation in California: Pineapple express, Extreme rainfall Events and Long-range Statistical Forecasts Charles Jones ICESS University of California,
ENSO: Recent Evolution, Current Status and Predictions. Update prepared by: Climate Prediction Center / NCEP 9 November 2015
 ENSO: Recent Evolution, Current Status and Predictions Update prepared by: Climate Prediction Center / NCEP 9 November 2015 Outline Summary Recent Evolution and Current Conditions Oceanic Niño Index (ONI)
Climate Change. Ashok Kumar 1, Ch. Sridevi 2, Durai VR 3, Singh KK 4, Prasad VS 5, Mukhopadhyay P 6, Krishna RPM 7, Deshpande M 8, Chattopadhyay N 9
 RESEARCH 4(14), April - June, 2018 ISSN 2394 8558 EISSN 2394 8566 Climate Change Block level weather forecast using T-1534 model output and biasfree temperature forecast by decaying weighted mean procedure
N. K. Manglik Director
 N. K. Manglik Director Hydro-meteorological observations could be broadly defined as the scientific way for collection of flow data at a specific location along the river including selected meteorological
INDIA SIZE AND LOCATION
 QUESTION BANK IN SOCIAL SCIENCE CLASS-IX (TERM-I) 1 INDIA SIZE AND LOCATION Location CONCEPTS India lies entirely in the Northern Hemisphere. India s mainland extends between 8 4'N and 37 8'N latitudes,
Analysis of Fall Transition Season (Sept-Early Dec) Why has the weather been so violent?
 Why has the weather been so violent?") WEATHER TOPICS Analysis of Fall Transition Season (Sept-Early Dec) 2009 Why has the weather been so violent? As can be seen by the following forecast map, the Fall Transition and early Winter Season of
WEATHER TOPICS Analysis of Fall Transition Season (Sept-Early Dec) 2009 Why has the weather been so violent? As can be seen by the following forecast map, the Fall Transition and early Winter Season of
ENSO Cycle: Recent Evolution, Current Status and Predictions. Update prepared by Climate Prediction Center / NCEP 15 July 2013
 ENSO Cycle: Recent Evolution, Current Status and Predictions Update prepared by Climate Prediction Center / NCEP 15 July 2013 Outline Overview Recent Evolution and Current Conditions Oceanic Niño Index
Key Finding: During 2013: Rain in Indian Tradition: Measuring Rain
 CHAPTER 34 RAINFALL Key Finding: Despite of theories suggesting increase in rainfall in Asian Region due to global warming, no significant trend has been observed at all India level (confirmed by both
Water Resource & Management Strategies
 Water Resource & Management Strategies National Conference on Integrated Water Resource Management for enhancing Farmers' Income March 22, 2017, Hotel Park, New Delhi Nalin Rawal Chief Business head Agribusiness
Characterization of Weekly Cumulative Rainfall Forecasts over Meteorological Subdivisions of India Using a GCM
 WEATHER AND FORECASTING VOLUME Characterization of Weekly Cumulative Rainfall Forecasts over Meteorological Subdivisions of India Using a GCM S. A. SASEENDRAN,* S. V. SINGH, L.S.RATHORE, AND SOMESHWAR
ENSO Cycle: Recent Evolution, Current Status and Predictions. Update prepared by Climate Prediction Center / NCEP 5 August 2013
 ENSO Cycle: Recent Evolution, Current Status and Predictions Update prepared by Climate Prediction Center / NCEP 5 August 2013 Outline Overview Recent Evolution and Current Conditions Oceanic Niño Index
ENSO Cycle: Recent Evolution, Current Status and Predictions. Update prepared by Climate Prediction Center / NCEP 25 February 2013
 ENSO Cycle: Recent Evolution, Current Status and Predictions Update prepared by Climate Prediction Center / NCEP 25 February 2013 Outline Overview Recent Evolution and Current Conditions Oceanic Niño Index
1. Introduction. 2. Verification of the 2010 forecasts. Research Brief 2011/ February 2011
 Research Brief 2011/01 Verification of Forecasts of Tropical Cyclone Activity over the Western North Pacific and Number of Tropical Cyclones Making Landfall in South China and the Korea and Japan region
Weather Related Factors of the Adelaide floods ; 7 th to 8 th November 2005
 Weather Related Factors of the Adelaide floods ; th to th November 2005 Extended Abstract Andrew Watson Regional Director Bureau of Meteorology, South Australian Region 1. Antecedent Weather 1.1 Rainfall
What is the Madden-Julian Oscillation (MJO)?
?") What is the Madden-Julian Oscillation (MJO)? Planetary scale, 30 90 day oscillation in zonal wind, precipitation, surface pressure, humidity, etc., that propagates slowly eastward Wavelength = 12,000 20,000
What is the Madden-Julian Oscillation (MJO)? Planetary scale, 30 90 day oscillation in zonal wind, precipitation, surface pressure, humidity, etc., that propagates slowly eastward Wavelength = 12,000 20,000
MAURITIUS METEOROLOGICAL SERVICES
 MAURITIUS METEOROLOGICAL SERVICES CLIMATE NOVEMBER 2018 Introduction Climatologically speaking, November is a relatively dry month for Mauritius with a long term monthly mean rainfall of 78 mm. However,
O.I.H. GOVERNMENT OF INDIA MINISTRY OF AGRICULTURE AND FARMERS WELFARE DEPARTMENT OF AGRICULTURE, COOPERATION AND FARMERS WELFARE
 O.I.H. GOVERNMENT OF INDIA MINISTRY OF AGRICULTURE AND FARMERS WELFARE DEPARTMENT OF AGRICULTURE, COOPERATION AND FARMERS WELFARE 185. SHRI DEVJI M. PATEL: LOK SABHA UNSTARRED QUESTION NO.185 TO BE ANSWERED
Changes in extreme rainfall events and flood risk in. India during the last century
 National Climate Centre Research Report No: 3/2010 Changes in extreme rainfall events and flood risk in India during the last century P. Guhathakurta, Preetha Menon, A. B. Mazumdar and O. P. Sreejith National
The feature of atmospheric circulation in the extremely warm winter 2006/2007
 The feature of atmospheric circulation in the extremely warm winter 2006/2007 Hiroshi Hasegawa 1, Yayoi Harada 1, Hiroshi Nakamigawa 1, Atsushi Goto 1 1 Climate Prediction Division, Japan Meteorological
ENSO Cycle: Recent Evolution, Current Status and Predictions. Update prepared by Climate Prediction Center / NCEP 24 September 2012
 ENSO Cycle: Recent Evolution, Current Status and Predictions Update prepared by Climate Prediction Center / NCEP 24 September 2012 Outline Overview Recent Evolution and Current Conditions Oceanic Niño
ENSO: Recent Evolution, Current Status and Predictions. Update prepared by: Climate Prediction Center / NCEP 30 October 2017
 ENSO: Recent Evolution, Current Status and Predictions Update prepared by: Climate Prediction Center / NCEP 30 October 2017 Outline Summary Recent Evolution and Current Conditions Oceanic Niño Index (ONI)
Unseasonable weather conditions in Japan in August 2014
 Unseasonable weather conditions in Japan in August 2014 Summary of analysis by the TCC Advisory Panel on Extreme Climatic Events In an extraordinary session held at the Japan Meteorological Agency on 3
Impact of climate change on extreme rainfall events and flood risk in India
 Impact of climate change on extreme rainfall events and flood risk in India P Guhathakurta, O P Sreejith and PAMenon India Meteorological Department, Shivajinagar, Pune 411 005, India. e-mail: pguhathakurta@rediffmail.com
Catastrophic heavy rainfall episode over Uttarakhand during June 2013 observational aspects
 Catastrophic heavy rainfall episode over Uttarakhand during 16 18 June 2013 observational aspects S. D. Kotal*, Soma Sen Roy and S. K. Roy Bhowmik India Meteorological Department, Lodhi Road, New Delhi
5 Atmospheric Disturbances 7 1.Cyclones- tropical and temperate and associated weather conditions. 2.Anticyclones and associated weather conditions.
 5 Atmospheric Disturbances 7 1.Cyclones- tropical and temperate and associated weather conditions. 2.Anticyclones and associated weather conditions. atmospheric disturbances (weather systems) that are
MAURITIUS METEOROLOGICAL SERVICES
 MAURITIUS METEOROLOGICAL SERVICES CLIMATE SEPTEMBER 2018 Introduction Synoptic weather pattern over the region portrayed September as a transition month. The month started with wintry characteristics.
IMPACT OF KALPANA-1 CLOUD MOTION VECTORS IN THE NUMERICAL WEATHER PREDICTION OF INDIAN SUMMER MONSOON
 IMPACT OF KALPANA-1 CLOUD MOTION VECTORS IN THE NUMERICAL WEATHER PREDICTION OF INDIAN SUMMER MONSOON S.K.Roy Bhowmik, D. Joardar, Rajeshwar Rao, Y.V. Rama Rao, S. Sen Roy, H.R. Hatwar and Sant Prasad
Department of Atmospheric Sciences, National Taiwan University, Taipei, Taiwan
 10A.4 TROPICAL CYCLONE FORMATIONS IN THE SOUTH CHINA SEA CHENG-SHANG LEE 1 AND YUNG-LAN LIN* 1, 2 1 Department of Atmospheric Sciences, National Taiwan University, Taipei, Taiwan 2 Taipei Aeronautic Meteorological
UPDATE OF REGIONAL WEATHER AND SMOKE HAZE December 2016
 UPDATE OF REGIONAL WEATHER AND SMOKE HAZE December 2016 1. Review of Regional Weather Conditions in November 2016 1.1 Inter monsoon conditions prevailed in the first half of November 2016. During this
Satellites, Weather and Climate Module??: Polar Vortex
 Satellites, Weather and Climate Module??: Polar Vortex SWAC Jan 2014 AKA Circumpolar Vortex Science or Hype? Will there be one this year? Today s objectives Pre and Post exams What is the Polar Vortex
An upper to mid level circulation (Low) in the NW Caribbean is
 in the NW Caribbean is") WEEKLY WEATHER OUTLOOK BELIZE, CENTRAL AMERICA PERIOD: Monday-Monday, Oct. 1 October 8, 2012 DATE ISSUED: Monday, Oct 1, 2012 6:00 am RFrutos EcoSolutions & Services SYNOPSIS: An upper to mid level circulation
WEEKLY WEATHER OUTLOOK BELIZE, CENTRAL AMERICA PERIOD: Monday-Monday, Oct. 1 October 8, 2012 DATE ISSUED: Monday, Oct 1, 2012 6:00 am RFrutos EcoSolutions & Services SYNOPSIS: An upper to mid level circulation
ORIGINAL IN HINDI GOVERNMENT OF INDIA MINISTRY OF CONSUMER AFFAIRS, FOOD & PUBLIC DISTRIBUTION DEPARTMENT OF FOOD AND PUBLIC DISTRIBUTION
 ORIGINAL IN HINDI GOVERNMENT OF INDIA MINISTRY OF CONSUMER AFFAIRS, FOOD & PUBLIC DISTRIBUTION DEPARTMENT OF FOOD AND PUBLIC DISTRIBUTION LOK SABHA UNSTARRED QUESTION NO. 4122 TO BE ANSWERED ON 20 TH MARCH,
MAURITIUS METEOROLOGICAL SERVICES
 MAURITIUS METEOROLOGICAL SERVICES CLIMATE FEBRUARY 2019 Introduction February 2019 was in mostly warm and dry. ENSO conditions and the Indian Ocean Dipole were neutral. However, the Inter Tropical Convergence
CPTEC and NCEP Model Forecast Drift and South America during the Southern Hemisphere Summer
 CPTEC and NCEP Model Forecast Drift and South America during the Southern Hemisphere Summer José Antonio Aravéquia 1 Pedro L. Silva Dias 2 (1) Center for Weather Forecasting and Climate Research National
Geographical location and climatic condition of the
 Geographical location and climatic condition of the study sites North eastern region of India is comprised of eight states namely; Arunachal Pradesh, Assam, Manipur, Meghalaya, Mizoram, Nagaland, Sikkim
UPDATE OF REGIONAL WEATHER AND SMOKE HAZE November 2016
 UPDATE OF REGIONAL WEATHER AND SMOKE HAZE November 2016 1. Review of Regional Weather Conditions in November 2016 1.1 Southwest Monsoon conditions prevailed on most days in October 2016 and the winds were
Lecture 8. Monsoons and the seasonal variation of tropical circulation and rainfall
 Lecture 8 Monsoons and the seasonal variation of tropical circulation and rainfall According to the second hypothesis, the monsoon is a manifestation of the seasonal variation of the tropical circulation
By: J Malherbe, R Kuschke
 2015-10-27 By: J Malherbe, R Kuschke Contents Summary...2 Overview of expected conditions over South Africa during the next few days...3 Significant weather events (27 October 2 November)...3 Conditions
GOVERNMENT OF INDIA MINISTRY OF HEALTH AND FAMILY WELFARE DEPARTMENT OF HEALTH AND FAMILY WELFARE
 GOVERNMENT OF INDIA MINISTRY OF HEALTH AND FAMILY WELFARE DEPARTMENT OF HEALTH AND FAMILY WELFARE LOK SABHA STARRED QUESTION NO. 183 TO BE ANSWERED ON THE 29 TH JULY, 2016 VECTOR BORNE DISEASES *183. SHRI
M. Mohapatra and D. R. Pattanaik
 Understanding and forecasting of intra-seasonal extremes of southwest monsoon circulation and precipitation over India M. Mohapatra and D. R. Pattanaik IMD, New Delhi Email : m.mohapatra@imd.gov.in Annual
SMART NOTES ON INDIAN GEOGRAPHY - 1
 ON INDIAN GEOGRAPHY - 1 Point. Precise. Powerful. www.thesmartnotes.org ON INDIAN GEOGRAPHY - 1 To our Hardworking and persistence aspirants. Success is going from failure to failure without losing enthusiasm.
MPACT OF EL-NINO ON SUMMER MONSOON RAINFALL OF PAKISTAN
 MPACT OF EL-NINO ON SUMMER MONSOON RAINFALL OF PAKISTAN Abdul Rashid 1 Abstract: El-Nino is the dominant mod of inter- annual climate variability on a planetary scale. Its impact is associated worldwide
Summative Assessment I
 Class: IV Time: 3 Hrs. Summative Assessment I Social Science Marks: 88 Handwriting: 2 Total: 90 1. All questions are compulsory. 2. Use crayons for colouring. General Instruction I. Multiple choice questions:
Regional and seasonal variations in aerosol optical characteristics and their frequency distributions over India during
 JOURNAL OF GEOPHYSICAL RESEARCH, VOL. 113,, doi:10.1029/2007jd008560, 2008 Regional and seasonal variations in aerosol optical characteristics and their frequency distributions over India during 2001 2005