P2.57 Cyclone Yasi Storm Surge in Australia Implications for Catastrophe Modeling
|
|
|
- Winifred Jennings
- 6 years ago
- Views:
Transcription
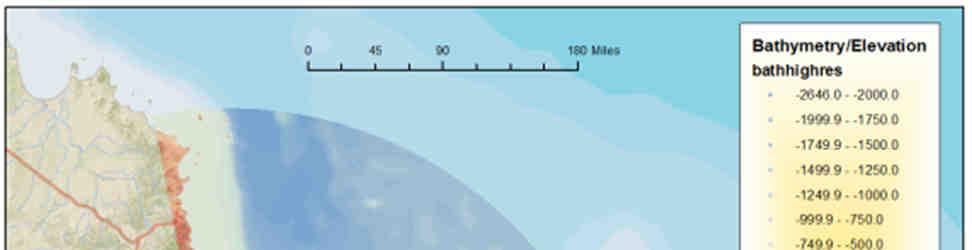
1 P2.57 Cyclone Yasi Storm Surge in Australia Implications for Catastrophe Modeling Kevin A. Hill*, Peter Sousounis, and Jason Butke AIR Worldwide Corporation, Boston, Massachusetts 1. INTRODUCTION Storm surge can be a significant contribution to tropical cyclone insured losses, especially for particular insurance client portfolios with significant exposure along coastlines. Australia s Queensland coast is frequently impacted by strong cyclones (Fig. 1), and features several large cities near the coast with significant exposure; as such, this is a region that has potential to incur financial loss from storm surge. AIR s updated Australia cyclone model (ACM) estimates financial loss from wind, freshwater flooding and storm surge. To simulate financial loss from storm surge, ACM utilizes a dynamical approach the Princeton Ocean Model (POM). Due to the large number of simulations required (AIR s ACM features a 10,000 year catalog) compromises must be made between simulation resolution and computational demand. In this study, the storm surge of Cyclone Yasi is simulated with POM on a high-resolution curvilinear domain, and the sensitivity of the results to wind field parameters and model resolution is explored. Model simulated results are compared to observations, where available, although the main comparison is between modeled results. Finally, some implications for catastrophe modeling and avenues of future research are discussed. 2. CYCLONE YASI Yasi was first identified on January 26, 2011 as a tropical disturbance by the Fiji Meteorological Service; FMS). The cyclone gradually organized * Corresponding author address: Kevin A. Hill, AIR Worldwide Corporation, Boston, MA, 02116; kevinhill@air-worldwide.com as it moved generally to the west and south, being classified as a tropical depression on January 27. Yasi attained severe tropical cyclone intensity with sustained winds of at least 120 km/h (75 mph) on January 31. Also on the 31 st, Yasi crossed 160 E, prompting the final advisory from the FMS and the first advisory from the Australian Bureau of Meteorology (BoM) as it crossed into the Australian cyclone basin. Yasi was upgraded to category 4 intensity on the BoM intensity scale on February 1 st, and continued on a west-southwestward track towards Queensland. Yasi attained low category 5 strength on February 2 nd, and maintained this intensity through landfall near Mission Beach (Fig. 4) between midnight and 1 am local time on Thursday, February 3. Yasi maintained a strong core with damaging winds and heavy rain well inland, being downgraded to a tropical low near Mount Isa late on February 3 rd. The Insurance council of Australia (ICA) estimates the total financial loss from Yasi at ~1 Billion AUD. As is typical of many cyclone landfalls in Australia, there are no verified observations of maximum wind near the cyclone center. Lucinda Point (south of the landfall location) recorded a maximum 3-s gust of 185 km/h (115 mi/h). A barograph at Tully Sugar mill recorded a minimum pressure of 929 hpa, leading the BoM to suggest that maximum wind gusts there may have reached 285 km/hr (~178 mi/hr). Post-event surveys (Ref. 6) of damage to buildings and other structures were able to provide estimates of maximum winds; surveys of windicators (i.e., failed road signs) indicate maximum wind gusts of up to 245 km/h (152 mi/h). Significant wind damage was recorded between Innisfail and Townsville where the core of the storm passed.
2 The maximum recorded storm surge in TC Yasi was on the order of 5.4 m at Cardwell (Fig. 5a), ~2.2 m above the highest astronomical tide (HAT). This occurred at approximately quarter tide; if the maximum storm surge had occurred at the high tide the maximum water level would have been ~4.7 m above HAT. A storm surge of 2.35 m at Townsville (Fig. 5b) was recorded, ~0.5 m lower than that recorded in Cyclone Althea (1971), which hit much closer to the city. Surveys indicate that observed surge damage from Yasi was localized in nature and highly dependent on local elevation, which is steep in this area (Fig. 7; Ref. 5). 3. SIMULATION OVERVIEW The POM is a free-surface, three-dimensional finite-difference numerical model based on the primitive equations with Boussinesq and hydrostatic approximations. POM utilizes a bottom-following sigma coordinate system, and the horizontal grid uses an Arakawa C differencing scheme. POM is freely available to both the research and private industry communities for research purposes. More information is available in Mellor (2003). The addition of a wetting and drying (WAD) scheme (Oey 2005, 2006) allows water to inundate previously dry areas, enhancing the utility of the POM for inland loss calculations from surge. In this study, several experiments utilizing a highresolution (up to ~215-m; Fig. 7) curvilinear grid are performed in order to assess the sensitivity of the maximum surge footprint to wind profile specifications. An additional simulation with higher resolution (~85 m) is also conducted in order to test the sensitivity to model resolution. All simulations are run for 18 hours, allowing sufficient time for the storm surge to build prior to landfall. The maximum simulated footprint was found to not be sensitive to earlier model initialization. Tidal forcing is not included in these POM simulations, and therefore simulated maximum water heights will be compared to residual surge values at gauge locations. The bathymetry and elevation grid (Fig. 8) was created using a blend of one arc minute data from the National Geophysical Data Center (NGDC) and 90 m elevation data from the Shuttle Radar Topography Mission (SRTM). Both datasets were interpolated onto the model grid and the 90 m data was utilized, where available. 4. WIND SPEED CALCULATION AND VALIDATION POM requires a temporally varying wind field and sea-level pressure field to generate surge. AIR s parametric wind field calculation requires central pressure, radius of maximum wind (RMW), and forward speed and direction; these parameters were taken from the BoM cyclone reports. BoM estimates indicate that Yasi had a RMW of ~22 miles for the majority of its time over water. There is uncertainty associated with estimating RMW, and therefore four simulations were performed with RMW values of 16, 20, 24 or 28 miles. Maximum wind speeds are calculated from gradient wind balance using central pressure and RMW. The AIR model s radial wind speed profile was developed based on the radial variation of wind speed described in Willoughby et al. (2006; Ref. 6). In this formulation, the radial profile is defined by three equations: one for the area inside the eyewall, one for the eyewall region, and one for the area outside of the eyewall. The radial wind profile is based on historical observations using reconnaissance data from 493 hurricanes in the Atlantic and eastern Pacific basins from 1977 to To compute winds at the surface, the AIR wind model adjusts for the storm slant and bulk reduction of the winds from flight level to 10 m. Simulated maximum wind speeds (Fig. 9) are ~157 mi/h over water and ~147 mi/h over land. The BoM estimates maximum wind gusts of ~177 mi/h at landfall; utilizing a 0.8 conversion between 1-minute sustained and gust winds, the maximum sustained winds over land are estimated as ~142 mi/h, comparable to those simulated. Maximum 1- minute wind speed estimates based upon satellite estimates (Fig. 9; Refs. 2, 8) are ~159 mi/h (~138 knots) while Yasi was over water, comparable to the simulated maximum values over water. Additional simulations are conducted in order to test the sensitivity to uniformly increased wind
3 speeds; in these simulations, wind speeds are increased by 10, 20, or 30%. 5. SIMULATION RESULTS The POM realistically simulates the qualitative distribution of storm surge, including the maximum water rise near Cardwell (Fig. 11). Simulations with up to ~215 m resolution were able to resolve the larger channels between the Australia mainland and Hitchenbrook Island, although smaller waterways are not resolved in model elevations. Although matching qualitatively, maximum storm surge values are lower than observed; the maximum simulated surge height (Table 1) is 3.7 (4.6) m in simulations with 16 (28) mile RMW, ~15% lower than the maximum observed (estimated at ~5.4 m). Time series of surge height at Cardwell (Fig. 12a) and Townsville (Fig. 12b) are lower than those observed. POM realistically simulated the more rapid water rise and decline in Cardwell relative to Townsville. RMW specification has a large impact on simulated surge height in Townsville due to its relatively large distance from cyclone center, while in Cardwell RMW specification does not impact the maximum surge height significantly. Given the many inherent uncertainties in calculating parametric wind speed, it is important to understand the sensitivity of modeled surge heights to simulated wind speed. Increasing wind speeds by a uniform amount leads to significant increases in surge height (Table 1, Figure 13), although it does not change the spatial distribution. A wind speed increase of 10% leads to maximum surge height increasing 12-15%, depending upon RMW. Increasing the resolution does not lead to an increase in simulated surge height (Figure 14), and in most areas the simulation results change little. The high resolution does provide increased detail of simulated surge in areas with locally complex terrain and small channels and rivers. 6. DISCUSSION AND CONCLUSIONS Simulation results indicate that the Princeton Ocean Model is able to realistically simulate the distribution of storm surge heights in Cyclone Yasi, although the maximum amplitudes are generally lower than those observed. Given the steep coastal bathymetry, one hypothesis is that the contribution from wave setup to the storm surge, which is not accounted for by POM, is at least partly responsible for the low bias in the model results. Another hypothesis is that simulated surge height is highly sensitive to simulated wind speed and RMW, which can be quite uncertain over water in the absence of observations and aircraft reconnaissance. High resolution simulations still feature the low bias relative to the observations, but do allow for better detail in the simulated surge footprint in areas of complex terrain and small water features, such as near where the cyclone made landfall in the vicinity of Hitchenbrook Island. This detail could be important for exposures located in the vicinity of small-scale features. High resolution simulations would likely benefit from a higher resolution bathymetry dataset, as local bathymetric features could impact surge heights in all simulations conducted here, the bathymetry data was on a one arc minute (~1.85 km) grid. For stochastic simulations, the benefits of high resolution must be weighed against high computational demands. Simulating 10,000 years of cyclone landfalls in Australia requires a very large number of simulations. Stochastic simulations required ~15 minutes per simulation, while the high resolution simulation described herein required ~6.5 hours, or ~25 times longer. Further refinements to the curvilinear grid generation or a nested grid approach which produce domains that are better optimized to resolve complex coastal features may allow for higher resolution stochastic simulations. 7. FUTURE WORK In order to more realistically simulate surge values, it may be necessary to couple POM with a near-shore wave model in order to better resolve
4 the effects of wave breaking and the wave setup contribution. Detailed comparison of simulated wave characteristics to observations would be required in order to assess the accuracy of any wave model. Additional experiments utilizing idealized bathymetry could be conducted in order to better understand the impact of wave breaking on simulated surge heights. Although a curvilinear grid is beneficial for maximizing model resolution while limiting computational demand, there are instances where a nested grid approach may be more versatile. Currently, efforts are underway to add nesting capability to POM. As discussed above, additional grid generation strategies to more efficiently distribute high-resolution cells over areas of interest would also serve to maximize the benefit of increased resolution while minimizing computational demand. 8. REFERENCES BoM Cyclone Yasi Report. Available at: Demuth, J. L., M. DeMaria, J. A. Knaff and T. H. Vonder Haar, 2006: Evaluation of Advanced Microwave Sounding Unit Tropical-Cyclone Intensity and Size Estimation Algorithms. J. Appl Meteor., 43, Mellor, G. L., Users guide for a three-dimensional, primitive equation, numerical ocean model (June 2003 version), 53 pp., Prog. in Atmos. and Ocean. Sci, Princeton University, Oey, L.-Y., A wetting and drying scheme for POM, Ocean Modelling, 9, , Oey, L.-Y., An OGCM with movable land-sea boundaries, Ocean Modelling, 13, , Tropical Cyclone Yasi Structural damage to buildings. Cyclone Testing Station CTS Technical Report No 57, April Willoughby, H. E., R. W. R. Darling and M. E. Rahn, 2006: Parametric representation of the primary Hurricane vortex. Part II: A new family of sectionally continuous profiles. Mon. Wea. Rev., 134, Yasi wind intensity estimate. Available at: e/products/storms/2011sh11/amsutspl/2011s H11_AMSUTSPL_ GIF
5 Table 1. Maximum simulated surge height (m) in simulations with different RMW values and uniform increases in wind speed. The percentage increase in surge due to increased wind speed for each RMW specification is included (red).


6 Fig. 1. Annual frequency of cyclones based on historical data ( ). Fig. 2. Track and wind intensity for Yasi. Courtesy of the Bureau of Meteorology. Fig. 3. Visible satellite images of hurricane Yasi as it approached Queensland. Courtesy of the BoM.
7 Fig. 4. Yasi track and population density near landfall location. Landfall occurred between the cities of Cairns (population ~150,000) and Townsville (population ~185,000), in a sparsely population section of coastline, reducing the amount of damage and ultimately the financial loss. Fig. 5. Tide gauge values for Cardwell (left) and Townsville (right).


 and the potential")


8 Fig. 6. Simplified storm surge profile along the coast of Queensland interpolated between tide gauges (red). Also shown is actual maximum sea level relative to HAT (green) and the potential maximum relative to HAT if the storm surge had coincided with the maximum adjacent high tide. Image from Ref.7. Fig. 7. Model grid spacing (m). Highest resolution is ~ 215 m.

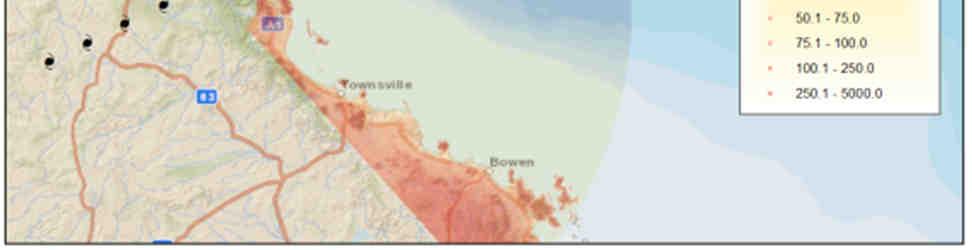
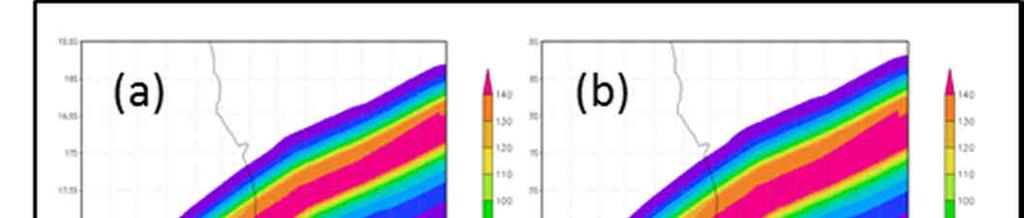

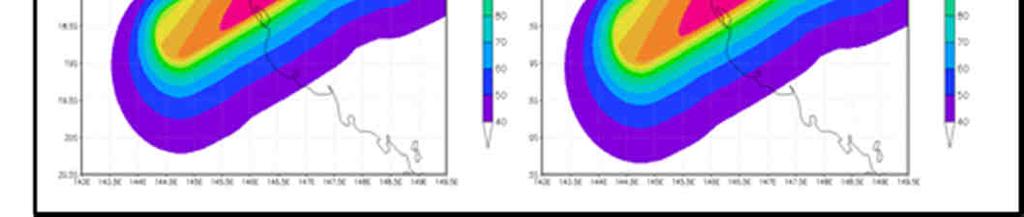
9 Fig. 8. Interpolated model bathymetry and elevation. Fig. 9. Simulated maximum wind speed footprints (mph) using RMW values of 16 (a), 20 (b), 24 (c), and 28 (d).
10 Fig.10. Advanced Microwave Sounding Unit (AMSU) based intensity estimate. Fig.11. Simulated maximum surge footprints (m) using RMW values of 16 (a), 20 (b), 24 (c), and 28 (d) miles.
11 Fig.12. POM simulated surge time-series at model grid cells closest to Cardwell (a) and Townsville (b) gauges. Fig.13. Simulated maximum surge footprints (m) in control simulation (a) and with uniform increases in wind speed of 10% (a), 20% (c), and 30% (d). All simulations feature 24 mile RMW.
12 Fig. 14. Simulated maximum surge footprints (m) using RMW of 28 miles and control wind speed values in POM simulation with grid spacing as fine as ~215 m (a, c) and ~85 m (b, d).
TOWNSVILLE STORM SURGE HYPOTHETICAL: TECHNICAL SPECIFICATIONS
 TOWNSVILLE STORM SURGE HYPOTHETICAL: TECHNICAL SPECIFICATIONS Stuart Mead, Mahesh Prakash and Fletcher Woolard CSIRO Mathematics, Informatics and Statistics, Private Bag 33, Clayton South, VIC 3168, Australia
Real-time numerical simulation of storm surge inundation using high-performance computing for disaster management, Queensland.
 Real-time numerical simulation of storm surge inundation using high-performance computing for disaster management, Queensland. Joanna Burston, Takehiko Nose and Rodger Tomlinson Griffith Centre for Coastal
Tropical Cyclone Oswald Coastal Monitoring
 Tropical Cyclone Oswald Coastal Monitoring Kieran Harper and John Maher Coastal Impacts Unit, Queensland Department of Science, Information Technology, Innovation and the Arts (DSITIA). 27 Quinlan St Deagon,
Queensland Storm Surge Forecasting Model Design Using Sensitivity Analysis
 21st International Congress on Modelling and Simulation, Gold Coast, Australia, 29 Nov to 4 Dec 215 www.mssanz.org.au/modsim215 Queensland Storm Surge Forecasting Model Design Using Sensitivity Analysis
Real-time storm tide forecasting for emergency management in Queensland, Australia
 Real-time storm tide forecasting for emergency management in Queensland, Australia Dr Joanna M. Burston 1, Dr Andrew M. Symonds 1,2, and Prof Rodger Tomlinson 1 1 Griffith Centre for Coastal Management,
Modelling the effect of sea level rise on tropical cyclone storm surge impact
 21st International Congress on Modelling and Simulation, Gold Coast, Australia, 29 Nov to 4 Dec 2015 www.mssanz.org.au/modsim2015 Modelling the effect of sea level rise on tropical cyclone storm surge
HURRICANE CHARLEY CHARACTERISTICS and STORM TIDE EVALUATION
 HURRICANE CHARLEY CHARACTERISTICS and STORM TIDE EVALUATION By Robert Wang, Michael Manausa And Jenny Cheng Sponsored by Florida Department of Environmental Protection, Bureau of Beaches and Coastal Systems
SLOSH New Orleans Basin 2012 Update
 SLOSH New Orleans Basin 2012 Update Michael Koziara Science and Operations Officer National Weather Service Slidell, LA The Basics What is storm surge? What is SLOSH? Details Assumptions Inundation = Storm
MODELLING CATASTROPHIC COASTAL FLOOD RISKS AROUND THE WORLD
 MODELLING CATASTROPHIC COASTAL FLOOD RISKS AROUND THE WORLD Nicola Howe Christopher Thomas Copyright 2016 Risk Management Solutions, Inc. All Rights Reserved. June 27, 2016 1 OUTLINE MOTIVATION What we
Cause, Assessment & Management of Flood Hazards associated with Landfalling Tropical Cyclones & Heavy Rain
 Cause, Assessment & Management of Flood Hazards associated with Landfalling Tropical Cyclones & Heavy Rain by CHEN Charng Ning, Professor Emeritus Nanyang Technological University (NTU), Singapore Consultant,
Ahead of the Wave: The Change Coming to the Saffir-Simpson
 Ahead of the Wave: The Change Coming to the Saffir-Simpson Classification System Editor s note: In 2009, the National Hurricane Center announced that it was updating the Saffir-Simpson Hurricane Scale
Major Hurricane Matthew Briefing Situation Overview
 Major Hurricane Matthew Briefing Situation Overview At 5 p.m. Tuesday, Category 4 Hurricane Matthew was about 860 miles South-Southeast of Mayport, Florida, moving north around 10 mph. Maximum sustained
HURRICANE FRANCES CHARACTERISTICS and STORM TIDE EVALUATION
 HURRICANE FRANCES CHARACTERISTICS and STORM TIDE EVALUATION ((DRAFT)) By Robert Wang and Michael Manausa Sponsored by Florida Department of Environmental Protection, Bureau of Beaches and Coastal Systems
The AIR Tropical Cyclone Model for Mexico
 The AIR Tropical Cyclone Model for Mexico In September 214, Hurricane Odile made landfall near Cabo San Lucas, Mexico, as a Category 3 hurricane, then moved up the center of Baja California, bringing strong
Assessing Storm Tide Hazard for the North-West Coast of Australia using an Integrated High-Resolution Model System
 Assessing Storm Tide Hazard for the North-West Coast of Australia using an Integrated High-Resolution Model System J. Churchill, D. Taylor, J. Burston, J. Dent September 14, 2017, Presenter Jim Churchill
Frank Revitte National Weather Service. Weather Forecast Office New Orleans/Baton Rouge
 Frank Revitte National Weather Service Weather Forecast Office New Orleans/Baton Rouge Above normal activity 17 Total Named Storms 7 Tropical Storms 4 Hurricanes 6 Major Hurricanes Not the most active,
THE NEW STORM SURGE MODULE IN AIR S U.S. HURRICANE MODEL
 THE NEW STORM SURGE MODULE IN AIR S U.S. HURRICANE MODEL Hurricane Ike storm surge devastation of Bolivar Peninsula near Galveston, Texas. (Source: Chuck Davis, flickr) When a hurricane comes onshore,
Major Hurricane Earl
 Major Hurricane Earl Advisory 33 North Carolina Threat Assessment Prepared at: 11 AM Thursday September 2, 2010 Hurricane and Tropical Storm Warnings in effect for the North Carolina Coast and Sounds NWS
29th Conference on Hurricanes and Tropical Meteorology, May 2010, Tucson, Arizona
 P2.96 A SIMPLE COASTLINE STORM SURGE MODEL BASED ON PRE-RUN SLOSH OUTPUTS 1. INTRODUCTION Liming Xu* FM Global Research, 1151 Boston Providence Turnpike, Norwood, MA 02062 Storm surge is an abnormal rise
HURRICANE JEANNE CHARACTERISTICS and STORM TIDE EVALUATION
 HURRICANE JEANNE CHARACTERISTICS and STORM TIDE EVALUATION ((DRAFT)) By Robert Wang and Michael Manausa Sponsored by Florida Department of Environmental Protection, Bureau of Beaches and Coastal Systems
11/19/14. Chapter 11: Hurricanes. The Atmosphere: An Introduction to Meteorology, 12 th. Lutgens Tarbuck
 Chapter 11: Hurricanes The Atmosphere: An Introduction to Meteorology, 12 th Lutgens Tarbuck Lectures by: Heather Gallacher, Cleveland State University! Hurricanes: " Hurricanes are intense centers of
Hurricane Wilma Post Storm Data Acquisition Estimated Peak Wind Analysis and Storm Tide Data. December 27, 2005
 Hurricane Wilma Post Storm Data Acquisition Estimated Peak Wind Analysis and Storm Tide Data December 27, 2005 Hurricane Wilma was the sixth major hurricane of the record-breaking 2005 Atlantic hurricane
Coastal Storms of the New Jersey Shore
 Coastal Storms of the New Jersey Shore Dr. Steven G. Decker Dept. of Environmental Sciences School of Environmental and Biological Sciences Rutgers University May 25, 2011 Overview Threats Historical Examples
European Geosciences Union General Assembly Vienna, Austria 27 April - 02 May 2014
 European Geosciences Union General Assembly Vienna, Austria 27 April - 02 May 2014 Projecting the Current & Future Impact of Storm Surges on Coastal Flood Extent at Pigeon Point, South-West Tobago, through
Ch. 11: Hurricanes. Be able to. Define what hurricane is. Identify the life and death of a hurricane. Identify the ways we track hurricanes.
 Ch. 11: Hurricanes Be able to Define what hurricane is. Identify the life and death of a hurricane. Identify the ways we track hurricanes. What are Hurricanes? Smaller than mid-latitude cyclones. Don t
USING MIKE TO MODEL COASTAL CATASTROPHE RISK
 USING MIKE TO MODEL COASTAL CATASTROPHE RISK Nicola Howe, Christopher Thomas, Joss Matthewman, John Maskell* 1 SUMMARY About RMS Who are we and what do we do? How do we use MIKE in our workflow? Case study:
At the Midpoint of the 2008
 At the Midpoint of the 2008 Atlantic Hurricane Season Editor s note: It has been an anxious couple of weeks for those with financial interests in either on- or offshore assets in the Gulf of Mexico and
Major Hurricane Matthew Briefing Situation Overview
 Major Hurricane Matthew Briefing Situation Overview THIS IS NOW A WORST CASE STORM SURGE SCENARIO Catastrophic Damage is Anticipated for Coastal Areas. Major Hurricane Matthew is still expected to move
On the Frequency of the Great Floods of South East Queensland
 On the Frequency of the Great Floods of South East Queensland D.D.Hinde PhD, B.Eng., RPEQ dhinde@bigpond.com Key words: asset management, infrastructure, Brisbane floods, Gympie floods, Rockhampton floods,
Tropical Storm Harvey: SE Texas Impacts
 Tropical Storm Harvey: SE Texas Impacts 10 AM CDT UPDATE Thursday, August 24, 2017 Prepared by: Dan Reilly, Brian Kyle PLEASE MUTE YOUR LINES AND DON T PUT ON HOLD! Situation Overview Tropical Storm Harvey
The AIR Tropical Cyclone Model for India
 The AIR Tropical Cyclone Model for India Tropical cyclones have caused millions, and even billions, of dollars in damage in India. The growing number of properties on the coast, together with growing insurance
General background on storm surge. Pat Fitzpatrick and Yee Lau Mississippi State University
 General background on storm surge Pat Fitzpatrick and Yee Lau Mississippi State University Storm surge is an abnormal rise of water associated with a cyclone, not including tidal influences Low pressure
WEDNESDAY 30 TH AUGUST, :57 p.m. Tropical Storm Irma forms in the Atlantic. Don t let your guard down, always #Be Ready.
 Chapter 1 - The Set Up In the days leading up to Irma a series of composed and sobering text messages, presented in truncated form below, from Department of Disaster Management warned us of the pending
Specification of Tropical Cyclone Parameters From Aircraft Reconnaissance. Andrew Cox and Vincent Cardone Oceanweather Inc.
 Specification of Tropical Cyclone Parameters From Aircraft Reconnaissance Andrew Cox and Vincent Cardone Oceanweather Inc. Cos Cob, CT, USA Motivation This paper is part of on-going work to improve the
CURRENT AND FUTURE TROPICAL CYCLONE RISK IN THE SOUTH PACIFIC
 CURRENT AND FUTURE TROPICAL CYCLONE RISK IN THE SOUTH PACIFIC COUNTRY RISK PROFILE: SAMOA JUNE 2013 Samoa has been affected by devastating cyclones on multiple occasions, e.g. tropical cyclones Ofa and
Precipitation Structure and Processes of Typhoon Nari (2001): A Modeling Propsective
: A Modeling Propsective") Precipitation Structure and Processes of Typhoon Nari (2001): A Modeling Propsective Ming-Jen Yang Institute of Hydrological Sciences, National Central University 1. Introduction Typhoon Nari (2001) struck
Precipitation Structure and Processes of Typhoon Nari (2001): A Modeling Propsective Ming-Jen Yang Institute of Hydrological Sciences, National Central University 1. Introduction Typhoon Nari (2001) struck
GC Briefing. Weather Sentinel Hurricane Florence. Status at 5 PM EDT (21 UTC) Today (NHC) Discussion. September 13, 2018
 Today (NHC) Discussion. September 13, 2018") GC Briefing September 13, 2018 Weather Sentinel Hurricane Florence Tropical storm conditions have been reported for areas of North Carolina and will continue to spread inland to the west and south. Hurricane
GC Briefing September 13, 2018 Weather Sentinel Hurricane Florence Tropical storm conditions have been reported for areas of North Carolina and will continue to spread inland to the west and south. Hurricane
Tropical Update. 5 AM EDT Tuesday, September 12, 2017 Post-Tropical Cyclone Irma, Hurricane Jose, & Tropical Wave (10%)
") Tropical Update 5 AM EDT Tuesday, September 12, 2017 Post-Tropical Cyclone Irma, Hurricane Jose, & Tropical Wave (10%) This update is intended for government and emergency response officials, and is provided
Tropical Update 5 AM EDT Tuesday, September 12, 2017 Post-Tropical Cyclone Irma, Hurricane Jose, & Tropical Wave (10%) This update is intended for government and emergency response officials, and is provided
Exposure Disaggregation: Introduction. By Alissa Le Mon
 Exposure Disaggregation: Building Better Loss Estimates 10.2010 Editor s note: In this article, Alissa Le Mon, an analyst in AIR s exposures group, discusses how AIR s innovative disaggregation techniques
(April 7, 2010, Wednesday) Tropical Storms & Hurricanes Part 2
 Tropical Storms & Hurricanes Part 2") Lecture #17 (April 7, 2010, Wednesday) Tropical Storms & Hurricanes Part 2 Hurricane Katrina August 2005 All tropical cyclone tracks (1945-2006). Hurricane Formation While moving westward, tropical disturbances
Lecture #17 (April 7, 2010, Wednesday) Tropical Storms & Hurricanes Part 2 Hurricane Katrina August 2005 All tropical cyclone tracks (1945-2006). Hurricane Formation While moving westward, tropical disturbances
Tropical Update. 11 AM EDT Wednesday, October 10, 2018 Hurricane Michael, Hurricane Leslie & Tropical Storm Nadine, Caribbean Low (40%)
") Tropical Update 11 AM EDT Wednesday, October 10, 2018 Hurricane Michael, Hurricane Leslie & Tropical Storm Nadine, Caribbean Low (40%) This update is intended for government and emergency response officials,
Tropical Update 11 AM EDT Wednesday, October 10, 2018 Hurricane Michael, Hurricane Leslie & Tropical Storm Nadine, Caribbean Low (40%) This update is intended for government and emergency response officials,
Integrating Hydrologic and Storm Surge Models for Improved Flood Warning
 Integ Hydrologic and Storm Surge Models for Improved Flood Warning Leahy, C.P, Entel, M, Sooriyakumaran, S, and Warren, G Flood Warning Program Office, Bureau of Meteorology, Docklands, Victoria National
Lecture #18 (April 12, 2010, Monday) Tropical Storms & Hurricanes Part 3. Hurricane Floyd September 15, 1999
 Tropical Storms & Hurricanes Part 3. Hurricane Floyd September 15, 1999") Lecture #18 (April 12, 2010, Monday) Tropical Storms & Hurricanes Part 3 Hurricane Floyd September 15, 1999 Tropical Cyclone Names Names are given to distinguish storms and for ease of communication. Names
Lecture #18 (April 12, 2010, Monday) Tropical Storms & Hurricanes Part 3 Hurricane Floyd September 15, 1999 Tropical Cyclone Names Names are given to distinguish storms and for ease of communication. Names
GC Briefing. Weather Sentinel Tropical Storm Michael. Status at 8 AM EDT (12 UTC) Today (NHC) Discussion. October 11, 2018
 Today (NHC) Discussion. October 11, 2018") GC Briefing Weather Sentinel Tropical Storm Michael October 11, 2018 After making landfall as a high-end category-4 hurricane on the Florida Panhandle, Michael weakened to tropical storm status early this
GC Briefing Weather Sentinel Tropical Storm Michael October 11, 2018 After making landfall as a high-end category-4 hurricane on the Florida Panhandle, Michael weakened to tropical storm status early this
Current Details from the National Hurricane Center (NHC)
") Current Watches and Warnings A Hurricane Warning is in effect from Port Mansfield to Sargent, Texas A Warning is in effect from north of Sargent to High Island, Texas A Surge Warning is in effect from
Current Watches and Warnings A Hurricane Warning is in effect from Port Mansfield to Sargent, Texas A Warning is in effect from north of Sargent to High Island, Texas A Surge Warning is in effect from
CASE STUDY: Tropical Cyclone Monica, April 2006
 CASE STUDY: Tropical Cyclone Monica, April 2006 By Mr Jeff Callaghan Retired Senior Severe Weather Forecaster, Bureau of Meteorology, Brisbane The track of tropical cyclone Monica (Figure 1) took it from
Using Flight Level Data to Improve Historical Tropical Cyclone Databases
 Using Flight Level Data to Improve Historical Tropical Cyclone Databases Dr. Jonathan L. Vigh Shanghai Typhoon Institute 12 July 2018 NCAR is sponsored by the National Science Foundation On the Need for
P4.1 CONSENSUS ESTIMATES OF TROPICAL CYCLONE INTENSITY USING MULTISPECTRAL (IR AND MW) SATELLITE OBSERVATIONS
 SATELLITE OBSERVATIONS") P4.1 CONSENSUS ESTIMATES OF TROPICAL CYCLONE INTENSITY USING MULTISPECTRAL (IR AND MW) SATELLITE OBSERVATIONS Christopher Velden* Derrick C. Herndon and James Kossin University of Wisconsin Cooperative
P4.1 CONSENSUS ESTIMATES OF TROPICAL CYCLONE INTENSITY USING MULTISPECTRAL (IR AND MW) SATELLITE OBSERVATIONS Christopher Velden* Derrick C. Herndon and James Kossin University of Wisconsin Cooperative
Meeting the New Queensland Coastal Plan Storm Surge Requirements for Redland City Council. Queensland Coastal Conference 2011
 Meeting the New Queensland Coastal Plan Storm Surge Requirements for Redland City Council Ancient Knowledge Contemporary Innovation The Pullman Reef Hotel, Cairns Daniel Niven 1 and David Taylor 2 1 Cardno
Major Hurricane Earl
 Major Hurricane Earl Advisory 32 North Carolina Threat Assessment Prepared at: 8 AM Thursday September 2, 2010 Hurricane and Tropical Storm Warnings in effect for the North Carolina Coast and Sounds. NWS
The AIR Bushfire Model for Australia
 The AIR Bushfire Model for Australia In February 2009, amid tripledigit temperatures and drought conditions, fires broke out just north of Melbourne, Australia. Propelled by high winds, as many as 400
Development of Tropical Storm Falcon (Meari) over the Philippines
 over the Philippines") Development of Tropical Storm Falcon (Meari) over the Philippines June 20-27, 2011 At the end of June, 2011, the Philippines were struck again by Tropical storm Falcon (Meari). After gaining strength over
Development of Tropical Storm Falcon (Meari) over the Philippines June 20-27, 2011 At the end of June, 2011, the Philippines were struck again by Tropical storm Falcon (Meari). After gaining strength over
HURRICANE IVAN CHARACTERISTICS and STORM TIDE EVALUATION
 HURRICANE IVAN CHARACTERISTICS and STORM TIDE EVALUATION By Robert Wang and Michael Manausa Sponsored by Florida Department of Environmental Protection, Bureau of Beaches and Coastal Systems Submitted
The Pressure s On: Increased. Introduction. By Jason Butke Edited by Meagan Phelan
 The Pressure s On: Increased Realism in Tropical Cyclone Wind Speeds through Attention to Environmental Pressure 01.2012 By Jason Butke Introduction Because the Earth has a tilted axis and rotates, the
1. Sea Surface Temperatures (SSTs) > 27 and extending to some depth.
 > 27 and extending to some depth.") Formation Factors for Hurricanes 1. Sea Surface Temperatures (SSTs) > 27 and extending to some depth. 2. Location >5 away from the equator (usually 10 ). Coriolis force is necessary for rotation. 3. High
Formation Factors for Hurricanes 1. Sea Surface Temperatures (SSTs) > 27 and extending to some depth. 2. Location >5 away from the equator (usually 10 ). Coriolis force is necessary for rotation. 3. High
Footprinting Global Tropical Cyclones
 Footprinting Global Tropical Cyclones James Done, Greg Holland and Ming Ge: NCAR, Willis Research Network Ioana Dima-West, Geoffrey Saville and Sam Phibbs: Willis Towers Watson Yuqing Wang: U. Hawaii WRN
Hurricane Harvey: SE Texas Impacts. 10 PM CDT UPDATE Friday, August 25, 2017 Prepared by: Lance Wood
 Hurricane Harvey: SE Texas Impacts 10 PM CDT UPDATE Friday, August 25, 2017 Prepared by: Lance Wood Latest Observations Hurricane Harvey making landfall this evening near Rockport as a category 4 hurricane.
HWRF Ocean: MPIPOM-TC
 HWRF v3.7a Tutorial Nanjing, China, December 2, 2015 HWRF Ocean: MPIPOM-TC Ligia Bernardet NOAA SRL Global Systems Division, Boulder CO University of Colorado CIRS, Boulder CO Acknowledgement Richard Yablonsky
Tropical Update. 11 AM EDT Tuesday, October 9, 2018 Hurricane Michael, Tropical Storm Leslie, Tropical Storm Nadine
 Tropical Update 11 AM EDT Tuesday, October 9, 2018 Hurricane Michael, Tropical Storm Leslie, Tropical Storm Nadine This update is intended for government and emergency response officials, and is provided
Development of Operational Storm Surge Guidance to Support Total Water Predictions
 Development of Operational Storm Surge Guidance to Support Total Water Predictions J. Feyen 1, S. Vinogradov 1,2, T. Asher 3, J. Halgren 4, Y. Funakoshi 1,5 1. NOAA/NOS//Development Laboratory 2. ERT,
Current Details from the National Hurricane Center (NHC)
") Current Watches and Warnings A Hurricane Warning is in effect from South Santee River, South Carolina (SC) to Bogue Inlet, North Carolina (NC); Pamlico Sound A Hurricane Watch is in effect from Edisto
Current Watches and Warnings A Hurricane Warning is in effect from South Santee River, South Carolina (SC) to Bogue Inlet, North Carolina (NC); Pamlico Sound A Hurricane Watch is in effect from Edisto
Hurricane Recipe. Hurricanes
 Hurricanes A hurricane is a powerful, rotating storm that forms over warm oceans near the Equator. Hurricanes have strong, rotating winds (at least 74 miles per hour), a huge amount of rain, low air pressure,
Chapter 24. Tropical Cyclones. Tropical Cyclone Classification 4/19/17
 Chapter 24 Tropical Cyclones Tropical Cyclones Most destructive storms on the planet Originate over tropical waters, but their paths often take them over land and into midlatitudes Names Hurricane (Atlantic
THE AIR SEVERE THUNDERSTORM MODEL FOR AUSTRALIA
 THE AIR SEVERE THUNDERSTORM MODEL FOR AUSTRALIA In Australia, severe thunderstorms occur more frequently and cost more annually than any other atmospheric peril. The industry s first comprehensive severe
Tropical Update. 5 PM EDT Thursday, September 7, 2017 Hurricane Irma, Hurricane Jose, and Hurricane Katia
 Tropical Update 5 PM EDT Thursday, September 7, 2017 Hurricane Irma, Hurricane Jose, and Hurricane Katia This update is intended for government and emergency response officials, and is provided for informational
A Tropical Cyclone with a Very Large Eye
 JANUARY 1999 PICTURES OF THE MONTH 137 A Tropical Cyclone with a Very Large Eye MARK A. LANDER University of Guam, Mangilao, Guam 9 September 1997 and 2 March 1998 1. Introduction The well-defined eye
142 HAIL CLIMATOLOGY OF AUSTRALIA BASED ON LIGHTNING AND REANALYSIS
 142 HAIL CLIMATOLOGY OF AUSTRALIA BASED ON LIGHTNING AND REANALYSIS Christopher N. Bednarczyk* Peter J. Sousounis AIR Worldwide Corporation, Boston, MA 1. INTRODUCTION * The highly uneven distribution
P1.14 THE SPATIAL PATTERNS OF RAINFALL PRODUCED BY HURRICANE IRENE (2011) AND OTHER TROPICAL CYCLONES WITH SIMILAR TRACKS
 AND OTHER TROPICAL CYCLONES WITH SIMILAR TRACKS") P1.14 THE SPATIAL PATTERNS OF RAINFALL PRODUCED BY HURRICANE IRENE (2011) AND OTHER TROPICAL CYCLONES WITH SIMILAR TRACKS Corene J. Matyas * University of Florida, Gainesville, Florida 1. INTRODUCTION
P1.14 THE SPATIAL PATTERNS OF RAINFALL PRODUCED BY HURRICANE IRENE (2011) AND OTHER TROPICAL CYCLONES WITH SIMILAR TRACKS Corene J. Matyas * University of Florida, Gainesville, Florida 1. INTRODUCTION
Tropical Update. 5 PM EDT Sunday, October 7, 2018 Tropical Storm Michael, Tropical Storm Leslie, & Invest 92L (30%)
") Tropical Update 5 PM EDT Sunday, October 7, 2018 Tropical Storm Michael, Tropical Storm Leslie, & Invest 92L (30%) This update is intended for government and emergency response officials, and is provided
Tropical Update 5 PM EDT Sunday, October 7, 2018 Tropical Storm Michael, Tropical Storm Leslie, & Invest 92L (30%) This update is intended for government and emergency response officials, and is provided
Chapter 16, Part Hurricane Paths. 2. Hurricane Paths. Hurricane Paths and Damage
 Chapter 16, Part 2 Hurricane Paths and Damage 1. Hurricane Paths Start over tropical water except South Atlantic and eastern South Atlantic, where water is too cold. Initially steered by easterly winds
1.2 DEVELOPMENT OF THE NWS PROBABILISTIC EXTRA-TROPICAL STORM SURGE MODEL AND POST PROCESSING METHODOLOGY
 1.2 DEVELOPMENT OF THE NWS PROBABILISTIC EXTRA-TROPICAL STORM SURGE MODEL AND POST PROCESSING METHODOLOGY Huiqing Liu 1 and Arthur Taylor 2* 1. Ace Info Solutions, Reston, VA 2. NOAA / NWS / Science and
LECTURE #17: Severe Weather: Introduction to Hurricanes
 GEOL 0820 Ramsey Natural Disasters Spring, 2018 LECTURE #17: Severe Weather: Introduction to Hurricanes Date: 15 March 2018 I. Hurricane Overview hurricanes o what they are? o how they form? storm stages:
Chapter 24 Tropical Cyclones
 Chapter 24 Tropical Cyclones Tropical Weather Systems Tropical disturbance a cluster of thunderstorms about 250 to 600 km in diameter, originating in the tropics or sub-tropics Tropical depression a cluster
Modelling coastal flood risk in the data poor Bay of Bengal region
 Modelling coastal flood risk in the data poor Bay of Bengal region Matt Lewis*, Kevin Horsburgh (NOC), Paul Bates (Bristol) *m.j.lewis@bangor.ac.uk Funded by the EPSRC Flood Risk Management Research Consortium
Hurricane Matthew Threats and Impacts Briefing for Eastern NC
 Hurricane Matthew Threats and Impacts Briefing for Eastern NC October 6 th, 2016 Date/Time Created: 10/6/2016, Noon EDT National Weather Service Newport/Morehead City, NC Hurricane Matthew Key Points Changes
Tropical Update. 5 AM EDT Monday, October 8, 2018 Tropical Storm Michael, Tropical Storm Leslie, Invest 92L (10%) & African Tropical Wave (50%)
 & African Tropical Wave (50%)") Tropical Update 5 AM EDT Monday, October 8, 2018 Tropical Storm Michael, Tropical Storm Leslie, Invest 92L (10%) & African Tropical Wave (50%) This update is intended for government and emergency response
Tropical Update 5 AM EDT Monday, October 8, 2018 Tropical Storm Michael, Tropical Storm Leslie, Invest 92L (10%) & African Tropical Wave (50%) This update is intended for government and emergency response
TROPICAL STORM NATE BRIEFING
 TROPICAL STORM NATE BRIEFING 5:00 AM CDT Friday, October 6, 2017 Prepared by: NWS NWSNewOrleans www.weather.gov/neworleans Situation Overview No significant changes to the track forecast this morning.
Hurricanes. Cause: a low pressure storm system over warm ocean water. Effect: potential massive widespread destruction and flooding.
 Hurricanes Hurricanes Cause: a low pressure storm system over warm ocean water. Effect: potential massive widespread destruction and flooding. Hurricanes also known as: cyclone (Indian Ocean) or typhoon
Current Details from the National Hurricane Center (NHC)
") Current Watches and Warnings A Warning is in effect from San Blas to Punta San Telmo, Mexico A Warning is in effect from east of Punta San Telmo to Lazaro Cardenas, Mexico; north of San Blas to El Roblito,
Current Watches and Warnings A Warning is in effect from San Blas to Punta San Telmo, Mexico A Warning is in effect from east of Punta San Telmo to Lazaro Cardenas, Mexico; north of San Blas to El Roblito,
New Storm Surge Catastrophe Model for Great Britain and Beyond
 New Storm Surge Catastrophe Model for Great Britain and Beyond Richard Yablonsky, Mohammad Keshtpoor, and Austen Blair 33 rd Conference on Hurricanes and Tropical Meteorology American Meteorological Society
NOAA s National Weather Service Philadelphia/Mt. Holly NJ
 Next Briefing Package: Friday, October 2, 2015 no later than 300 PM Hazards and Impacts: Overview: A dangerous weather pattern still threatens our region. Threats include very heavy rainfall, inland river
Name Earth Science Pd. Hurricanes. Directions: Read the information, view diagrams and answer the questions in the worksheet.
 Hurricanes Directions: Read the information, view diagrams and answer the questions in the worksheet. Hurricane Basics The ingredients for a hurricane include a pre-existing weather disturbance, warm tropical
Kimberly J. Mueller Risk Management Solutions, Newark, CA. Dr. Auguste Boissonade Risk Management Solutions, Newark, CA
 1.3 The Utility of Surface Roughness Datasets in the Modeling of United States Hurricane Property Losses Kimberly J. Mueller Risk Management Solutions, Newark, CA Dr. Auguste Boissonade Risk Management
Weather Briefing. Coastal Storm Monday-Wednesday Dec 8-10, National Weather Service. Prepared 12/8/14 6:30 AM
 Weather Briefing Coastal Storm Monday-Wednesday Dec 8-10, 2014 National Weather Service http://www.weather.gov/nyc Prepared 12/8/14 6:30 AM Overview of Potential Hazards A strong low pressure system will
Horizontal resolution effects on tropical cyclone storm surges
 1 2 3 Source: AFP PHOTO/CHARISM SAYAT/AFP/Getty Images Source: kakela/ Flickr Name Author Horizontal resolution effects on tropical cyclone storm surges Nadia Bloemendaal¹, S. Muis¹, R. Haarsma², M. Verlaan³,
Current Details from the Joint Typhoon Warning Center
 Current Details from the Joint Warning Center COORDINATES: 19.6 north, 125.5 east (previous location: 17.9 north, 130.3 east) LOCATION: 737 kilometers (458 miles) southeast of Taipei, Taiwan MOVEMENT:
NHC Ensemble/Probabilistic Guidance Products
 NHC Ensemble/Probabilistic Guidance Products Michael Brennan NOAA/NWS/NCEP/NHC Mark DeMaria NESDIS/STAR HFIP Ensemble Product Development Workshop 21 April 2010 Boulder, CO 1 Current Ensemble/Probability
Environmental Geology Lab 6 Coastal Hazards. Tropical cyclones are classified based on substained wind speed as indicated below.
 Environmental Geology Lab 6 Coastal Hazards page - 1 In the continental United States there are two fundamental types of shorelines. Tectonically passive margins that have low relief and consist of smooth
Tropical Cyclones Modelling For Natural Disaster Risk Management
 Tropical Cyclones Modelling For Natural Disaster Risk Management Juan Savioli a, M. Britton b, S. Szylkarski a and Claus Pederson a a DHI Water and Environment, 2 Elliott Street, Suite 1a, QLD 4217 Surfers
Current Details from the National Hurricane Center (NHC)
") Current Watches/Warnings A Hurricane Warning is in effect from Surf City, North Carolina to the North Carolina/Virginia border; Pamlico Sound; Eastern Albemarle Sound A Hurricane Watch is in effect from
Current Watches/Warnings A Hurricane Warning is in effect from Surf City, North Carolina to the North Carolina/Virginia border; Pamlico Sound; Eastern Albemarle Sound A Hurricane Watch is in effect from
Storm Summary for Hurricane Jose
 Storm Summary for Hurricane Jose Tuesday, September 19, 2017 at 11 AM EDT (Output from Hurrevac, based on National Hurricane Center Forecast Advisory #57) Jose is currently a Category 1 hurricane on the
Tropical Storm Ana. Created 6:00 AM Sun May 10, 2015 John Cole Warning Coordination Meteorologist
 Tropical Storm Ana Threat Assessment for Eastern North Carolina Created 6:00 AM Sun May 10, 2015 John Cole Warning Coordination Meteorologist John.cole@noaa.gov National Weather Service Newport/Morehead
Hurricane Structure: Theory and Diagnosis
 Hurricane Structure: Theory and Diagnosis 7 March, 2016 World Meteorological Organization Workshop Chris Landsea Chris.Landsea@noaa.gov National Hurricane Center, Miami Outline Structure of Hurricanes
CAT-i Bulletin Catastrophe Information
 CAT-i Bulletin Catastrophe Information Report Date: December 28, 2018 Sydney Hailstorms, December 20, 2018 Hail Swath for the Sydney Hail Event. Source: Dr Joshua Soderholm, Monash University, using radar
Comparative Analysis of Hurricane Vulnerability in New Orleans and Baton Rouge. Dr. Marc Levitan LSU Hurricane Center. April 2003
 Comparative Analysis of Hurricane Vulnerability in New Orleans and Baton Rouge Dr. Marc Levitan LSU Hurricane Center April 2003 In order to compare hurricane vulnerability of facilities located in different
Forecasting Hurricane Intensity: Lessons from Application of the Coupled Hurricane Intensity Prediction System (CHIPS)
") Forecasting Hurricane Intensity: Lessons from Application of the Coupled Hurricane Intensity Prediction System (CHIPS) Coupled Model Design Atmospheric Component: (from Emanuel, 1995) Gradient and hydrostatic
Forecasting Hurricane Intensity: Lessons from Application of the Coupled Hurricane Intensity Prediction System (CHIPS) Coupled Model Design Atmospheric Component: (from Emanuel, 1995) Gradient and hydrostatic
Tropical Cyclone Hazards. Presentation
 Tropical Cyclone Hazards Presentation Kerry N Mallory AE5JY September 7, 2011 Tropical Cyclone Hazards The Four Primary Weapons of a Tropical Cyclone are: 1. Wind 2. Storm Surge 3. Rain/Freshwater Flooding
Students will work in small groups to collect detailed data about a variety of living things in the study area.
 TEACHER BOOKLET Sampling along a transect Name BIOLOGY Students will work in small groups to collect detailed data about a variety of living things in the study area. Students will need: 10 metre long
Estimating the impacts of beach erosion and cyclones on coastal property values: A Queensland case study Qing Han Walter Hein, Boon Lee and Clevo
 Estimating the impacts of beach erosion and cyclones on coastal property values: A Queensland case study Qing Han Walter Hein, Boon Lee and Clevo Wilson Background to the study Beach erosion is common
Hurricane Matthew. Life Threatening Flash Flooding Likely. National Weather Service Wilmington NC. Josh Weiss, Meteorologist
 Hurricane Matthew Life Threatening Flash Flooding Likely Threat Assessment for northeast South Carolina & southeast North Carolina National Weather Service Wilmington NC 630 PM EDT Friday October 7, 2016