Outline. CEEM-ISCR Workshop on Electricity Industry Restructuring April Forecasting Wind Energy: Challenges and Solutions 1
|
|
|
- Francine Osborne
- 5 years ago
- Views:
Transcription


1 Joint Australia New Zealand Workshop on Electricity Industry Restructuring, 19 th -20 th April, Sydney CEEM 2007 Outline 2 1


2 Introduction As wind power emerges as a significant component of energy markets around the world, Australia s major wind resources mean that it is well placed to harness greater wind energy within the electricity industry. The ability to accurately predict weather events that rapidly change wind energy production from one or more wind farms would reduce the costs of integrating wind energy into power systems and increase the commercial viability of wind energy in competitive electricity markets. In response to this we are working on numerous strategies to analyse and initiate a methodology to improve forecasting of events that lead to large changes in wind energy production (ie., too little or too much wind and rapid changes in wind speed and direction). 3 Wind Farms in Australia Region WA SA NSW Vic QLD Tas Installed Under Construction 199 MW 388 MW 289 MW 17 MW 134 MW 192 MW 12 MW 67 MW 75 MW Total Installed: 817MW Under Construction: 556 MW 4 2


3 Wind Farms in Australia - Woolnorth Region WA SA NSW Vic QLD Tas Installed Under Construction 199 MW 388 MW 289 MW 17 MW 134 MW 192 MW 12 MW 67 MW 75 MW Total Installed: 817MW Under Construction: 556 MW 5 Wind Energy Statistics


4 Challenges Faced in Wind Energy Forecasting There are many challenges one faces in maximising the value of wind power: Their environmental value reduction in greenhouse emissions 7 Challenges Faced in Wind Energy Forecasting There are many challenges one faces in maximising the value of wind power: Their environmental value The appropriate location Archer, C.L., amd Jaconson, M.Z. (2005), Evaluation of global wind power, J. Geophys Res., vol 110, D
 to make an accurate/useful wind")
5 Challenges Faced in Wind Energy Forecasting There are many challenges one faces in maximising the value of wind power: Their environmental value The appropriate location Correct Operation To ensure correct operation, a key issue that relates all of the above is forecasting 9 Numerical Weather Prediction The ability of an Numerical Weather Prediction model (NWP) to make an accurate/useful wind forecast: Most NWP s are not geared towards detailed wind predictions, especially in the context of wind power and the electricity market. The question to answer here is are they a useful tool by themselves? 10 5


6 Data and Forecast Horizon Access to data: Will additional data sources contain any information of use to forecasting for the wind energy sector? Timing issues of when data is delivered Regional and Small Scale Requirements The resolution of the NWP model is of great importance, and also produces challenges in wind energy forecasting such as: The task of distinguishing between regional and small scale forecasts. 12 6
 provide a more useful forecast [1]?")
![What type of statistical methods/corrections could improve forecasts? [1] Craine, S., Massie, R., vander Schoor, K., Cohen, W., Bateman, B.](/docs-images/96/128477532/images/7-1.jpg ", Peterson, J., and Langford, S. (2004), Wind Resource Atlas for Southern Australia. Wind Engineering, 28, 4, pp. 355-366. http://www.cmar.csiro.")

7 What is the best model/method to utilize? What type of models will be the most advantageous to use? A new model from the BMRC WLAPS looks promising Besides a typical NWP could The Air Pollution Model (TAPM) provide a more useful forecast [1]? What type of statistical methods/corrections could improve forecasts? [1] Craine, S., Massie, R., vander Schoor, K., Cohen, W., Bateman, B., Peterson, J., and Langford, S. (2004), Wind Resource Atlas for Southern Australia. Wind Engineering, 28, 4, pp The National Electricity Market Requirements The National Electricity Market Management Company (NEMMCO) s regional aggregation requirements leads us to ask: What is the best way to produce a forecast that can incorporate individual and aggregated wind farms? AWEFS functional requirements ROI from NEMMCO website


8 An example Power curve showing the cut-in and cut-out speeds: Region I: 5ms -2 Region II: rated power at ~15ms -1 Region III: Cut out Speed 25ms -1 The Power Curve The power of the wind is the cube of the wind speed. The Wind Power Formula: P = ρ v π 2 r Where P = Power in Watts ρ = density of dry air in kgm -3 r= radius of the rotor in metres V = velocity in ms Woolnorth Wind Farm in Tasmania
9 The Power Curve for Woolnorth Power curve for the average of the wind farm for August 2005, showing the cut-in and cut-out speeds: Region I: approximatley 4 ms -2 Region II: rated power at ~15ms -1 Region III: Cut out Speed between 22 25ms The Power Curve for Woolnorth 18 9


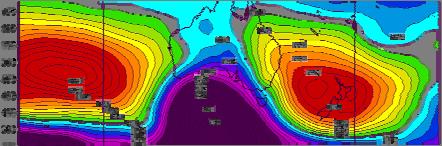
10 Typical Wind Patterns for Summer and Winter 19 Synoptic Features identifiable with Large Swings A front is defined as the narrow boundary zone between two air masses where there is a difference in density. Wind, temperature and weather vary rapidly across it. Cold fronts are associated with low pressure systems and are generally guided by upper air winds and travel from west to east. As the front passes there is usually a significant change in wind direction


11 Synoptic Features identifiable with Large Swings Troughs are elongated areas of low pressure it essentially acts as a slow moving system or a stationary front, where the temperature differences between the two sides is not significant. Troughs have the potential of intensifying rapidly with the result being stronger winds. 21 Cold Fronts Troughs Unstable low pressure systems 22 11


12

13


14

15


16


17 33 Woolnorth Wind Distribution for August
, would the")

18 Turbine Availability Compared to Synoptic Situation 35 Comparing NEMMCO Power Demand in August to the Output from Woolnorth An interesting question to ask is: During peak demand times (Figure 2), would the wind power from Woolnorth have been available at peak times? Figure 1: Power and wind speed over a 24 hour period Figure 2: 30 minute power demand for Tasmania demand data for Tasmania


19 Cape Grim Baseline Station To investigate the true nature of the weather and atmospheric conditions that approach Woolnorth, one needs access to detailed meteorological measurements. David Whillas, CSIRO Atmospheric Research 1989 The Cape Grim Baseline Air Pollution Station is situated approximately 2.1 km north of the top of the Woolnorth windfarm, and has measurements of meteorological parameters including wind speed and direction, rainfall, temperature, humidity and air pressure. 37 Cape Grim and Woolnorth August 2005 WS correlation between Woolnorth and Cape Grim August


20 Cape Grim and Woolnorth February 2005 WS correlation between Woolnorth and Cape Grim February Future Directions We are attempting to answer some of these questions: Initial work has been on classifying what synoptic weather events are correlated to rapid changes in wind power. On a smaller scale, how did the position of the turbines affect the amount of wind power it produced. Will a bias correction help the NWP forecast? I have been concentrating on the Woolnorth wind farm, and have acquired 5 years of minute observational data from Cape Grim. I am hoping to be able to correlate some of the wind farm observations at Woolnorth with the data from Cape Grim to see if there is some sort of pattern or a way to produce a type of forecast. Nesting of TAPM within a new NWP model 40 20

21 Acknowledgements MSLP and maps available from Bureau of Meteorology website: The data for wind power and wind speeds are courtesy of Roaring40 s MSLP colour animations provided by the NOAA/ESRL Physical Sciences Division, Boulder Colorado from their Web site at The project is funded by the Australian Greenhouse Office, as part of their Australian Wind Energy Forecasting Capability (WEFC) initiative. Funding: 41 21
The Forecasting Challenge. The Forecasting Challenge CEEM,
 Using NWP forecasts at multiple grid points to assist power system operators to predict large rapid changes in wind power Nicholas Cutler. n.cutler@unsw.edu.au 9 th April, 2008 CEEM, 2008 The Forecasting
High-Risk Scenarios for Wind Power Forecasting in Australia
 High-Risk Scenarios for Wind Power Forecasting in Australia Nicholas Cutler 1 *, Merlinde Kay 1, Hugh Outhred 1, Iain MacGill 1 1 University of New South Wales, Sydney, 2052, Australia. *Corresponding
WIND INTEGRATION IN ELECTRICITY GRIDS WORK PACKAGE 3: SIMULATION USING HISTORICAL WIND DATA
 WIND INTEGRATION IN ELECTRICITY GRIDS WORK PACKAGE 3: SIMULATION USING PREPARED BY: Strategy and Economics DATE: 18 January 2012 FINAL Australian Energy Market Operator Ltd ABN 94 072 010 327 www.aemo.com.au
AFAC 2006 page 536. Climate-Change Impacts on fire-weather in SE Australia Kevin Hennessy, Principal Research Scientist, CSIRO
 AFAC 2006 page 536 Climate-Change Impacts on fire-weather in SE Australia Kevin Hennessy, Principal Research Scientist, CSIRO AFAC 2006 page 537 Climate change impacts on fire-weather risk in south-east
Meteorological and Dispersion Modelling Using TAPM for Wagerup
 Meteorological and Dispersion Modelling Using TAPM for Wagerup Phase 1: Meteorology Appendix A: Additional modelling details Prepared for: Alcoa World Alumina Australia, P. O. Box 252, Applecross, Western
Ground-based temperature and humidity profiling using microwave radiometer retrievals at Sydney Airport.
 Ground-based temperature and humidity profiling using microwave radiometer retrievals at Sydney Airport. Peter Ryan Bureau of Meteorology, Melbourne, Australia Peter.J.Ryan@bom.gov.au ABSTRACT The aim
Weather Related Factors of the Adelaide floods ; 7 th to 8 th November 2005
 Weather Related Factors of the Adelaide floods ; th to th November 2005 Extended Abstract Andrew Watson Regional Director Bureau of Meteorology, South Australian Region 1. Antecedent Weather 1.1 Rainfall
TAPM Modelling for Wagerup: Phase 1 CSIRO 2004 Page 41
 We now examine the probability (or frequency) distribution of meteorological predictions and the measurements. Figure 12 presents the observed and model probability (expressed as probability density function
Summary of wool production estimates and forecasts for Australia. 2012/13 4th forecast 78.9
 Australian Wool Production Forecast Report Australian Wool Production Forecast Committee April 2013 Summary The Australian Wool Production Forecasting Committee has increased the forecast of shorn wool
Fire Weather Drivers, Seasonal Outlook and Climate Change. Steven McGibbony, Severe Weather Manager Victoria Region Friday 9 October 2015
 Fire Weather Drivers, Seasonal Outlook and Climate Change Steven McGibbony, Severe Weather Manager Victoria Region Friday 9 October 2015 Outline Weather and Fire Risk Environmental conditions leading to
Background and History
 p1 Background and History What is the Indian Ocean Climate Initiative? The Indian Ocean Climate Initiative (IOCI) is a strategic program of research and information transfer to support government decision-making.
Alberto Troccoli, Head of Weather and Energy Research Unit, CSIRO, Australia ICCS 2013 Jamaica, 5 December 2013 (remotely, unfortunately)
") 013 Alberto Troccoli, Head of Weather and Energy Research Unit, CSIRO, Australia ICCS 013 Jamaica, 5 December 013 (remotely, unfortunately) Historical and projected changes in World primary energy demand
013 Alberto Troccoli, Head of Weather and Energy Research Unit, CSIRO, Australia ICCS 013 Jamaica, 5 December 013 (remotely, unfortunately) Historical and projected changes in World primary energy demand
Assessing rainfall trends and remote drivers in regional climate change projections: The demanding test case of Tasmania
 IOP Conference Series: Earth and Environmental Science Assessing rainfall trends and remote drivers in regional climate change projections: The demanding test case of Tasmania To cite this article: M R
Forecasting scenarios of wind power generation for the next 48 hours to assist decision-making in the Australian National Electricity Market
 Forecasting scenarios of wind power generation for the next 48 hours to assist decision-making in the Australian National Electricity Market ABSTRACT Nicholas J. Cutler 1, Hugh R. Outhred 2, Iain F. MacGill
Sub-seasonal variability & prediction:
 Sub-seasonal variability & prediction: Exploring the reliability of forecasts at the weather-climate interface Harvey Stern, School of Earth Sciences, University of Melbourne 1 Conclusion The absence of
SAMPLE ASSESSMENT TASKS AVIATION ATAR YEAR 12
 SAMPLE ASSESSMENT TASKS AVIATION ATAR YEAR 12 Copyright School Curriculum and Standards Authority, 2015 This document apart from any third party copyright material contained in it may be freely copied,
Seven Day Streamflow Forecasting
 Seven Day Streamflow Forecasting - An ensemble streamflow forecasting system for Australia Dr. Sophie Zhang Water Forecasting Service Bureau of Meteorology 02 May 2018, Delft-FEWS Users Days and Workshop
Validation of operational NWP forecasts for global, diffuse and direct solar exposure over Australia
 Validation of operational NWP forecasts for global, diffuse and direct solar exposure over Australia www.bom.gov.au Lawrie Rikus, Paul Gregory, Zhian Sun, Tomas Glowacki Bureau of Meteorology Research
Application and verification of ECMWF products 2011
 Application and verification of ECMWF products 2011 National Meteorological Administration 1. Summary of major highlights Medium range weather forecasts are primarily based on the results of ECMWF and
Monthly overview. Rainfall
 Monthly overview 1 to 10 April 2018 Widespread rainfall continued to fall over most parts of the summer rainfall region during this period. Unseasonably good rain fell over the eastern half of the Northern
IN FOCUS: WHEAT PRODUCTION OUTLOOK JULY 2017
 IN FOCUS: WHEAT PRODUCTION OUTLOOK JULY 217 Author Phin Ziebell, Agribusiness Economist Photo Carl Davies CSIRO Sunset at Euroa, Victoria Photo Mai Thai CONTENTS 3 Summary and forecasts 4 Planting conditions
FORECAST ACCURACY REPORT 2017 FOR THE 2016 NATIONAL ELECTRICITY FORECASTING REPORT
 FORECAST ACCURACY REPORT 2017 FOR THE 2016 NATIONAL ELECTRICITY FORECASTING REPORT Published: November 2017 Purpose The National Electricity Rules (Rules) require AEMO to report to the Reliability Panel
Meteorology Division B Team Name: Team Number: Student Names: and
 Meteorology Division B Team Name: Team Number: Student Names: and You have 50 minutes to complete and revise this test. 1. Do not turn this page until you are told to do so. 2. Write your team name and
Assessment of the Australian Bureau of Meteorology hourly gridded solar data
 J.K. Copper Assessment of the Australian Bureau of Meteorology hourly gridded solar data J.K. Copper 1, A.G. Bruce 1 1 School of Photovoltaic and Renewable Energy Engineering, University of New South Wales,
On the use of radar rainfall estimates and nowcasts in an operational heavy rainfall warning service
 On the use of radar rainfall estimates and nowcasts in an operational heavy rainfall warning service Alan Seed, Ross Bunn, Aurora Bell Bureau of Meteorology Australia The Centre for Australian Weather
" max. T = 2.898#10 $3 metres Kelvin
 Question 1 The Earth s climate and weather is driven by energy coming from the Sun. The temperature of the Earth is determined by a balance between incoming radiation from the Sun and that radiated back
Monthly Overview. Rainfall
 Monthly Overview Rainfall during August occurred mainly over the Western and Eastern Cape provinces, and KwaZulu- Natal. Rain in these provinces were regularly accompanied by cold fronts as they made landfall
Current best practice of uncertainty forecast for wind energy
 Current best practice of uncertainty forecast for wind energy Dr. Matthias Lange Stochastic Methods for Management and Valuation of Energy Storage in the Future German Energy System 17 March 2016 Overview
The Kentucky Mesonet: Entering a New Phase
 The Kentucky Mesonet: Entering a New Phase Stuart A. Foster State Climatologist Kentucky Climate Center Western Kentucky University KCJEA Winter Conference Lexington, Kentucky February 9, 2017 Kentucky
NATIONAL ELECTRICITY FORECASTING REPORT UPDATE FOR THE NATIONAL ELECTRICITY MARKET
 NATIONAL ELECTRICITY FORECASTING REPORT UPDATE FOR THE NATIONAL ELECTRICITY MARKET Published: December 2014 IMPORTANT NOTICE Purpose The purpose of this publication is to report on the accuracy of the
Himawari-8 RGB product use and development amongst Australian / RAV / RAII stakeholders: the Australian VLab Centre of Excellence perspective
 Himawari-8 RGB product use and development amongst Australian / RAV / RAII stakeholders: the Australian VLab Centre of Excellence perspective EUMeTrain Event Week on MTG-I satellite 7-11 November 2016
POWER SYSTEM OPERATING PROCEDURE LOAD FORECASTING
 POWER SYSTEM OPERATING PROCEDURE LOAD FORECASTING PREPARED BY: PROCEDURE TYPE: DOCUMENT REFERENCE: FINAL APPROVER: Systems Capability System Operating Procedure SO_OP_3710 Christian Schaefer DOC. VERSION:
BARRA: A high-resolution atmospheric reanalysis over Australia for
 BARRA: A high-resolution atmospheric reanalysis over Australia for 1990-2016 Chun-Hsu Su, Australian Bureau of Meteorology N. Eizenberg 1, G. Kuciuba 1, P. Steinle 1, D. Jakob 1, P. Fox-Hughes 1, R. Renshaw
By: J Malherbe, R Kuschke
 2015-10-27 By: J Malherbe, R Kuschke Contents Summary...2 Overview of expected conditions over South Africa during the next few days...3 Significant weather events (27 October 2 November)...3 Conditions
peak half-hourly New South Wales
 Forecasting long-term peak half-hourly electricity demand for New South Wales Dr Shu Fan B.S., M.S., Ph.D. Professor Rob J Hyndman B.Sc. (Hons), Ph.D., A.Stat. Business & Economic Forecasting Unit Report
p = ρrt p = ρr d = T( q v ) dp dz = ρg
 dp dz = ρg") Chapter 1: Properties of the Atmosphere What are the major chemical components of the atmosphere? Atmospheric Layers and their major characteristics: Troposphere, Stratosphere Mesosphere, Thermosphere
Chapter 1: Properties of the Atmosphere What are the major chemical components of the atmosphere? Atmospheric Layers and their major characteristics: Troposphere, Stratosphere Mesosphere, Thermosphere
Monthly Overview. Rainfall
 Monthly Overview Weather news during February 2017 was dominated by the arrival of Tropical Cyclone Dineo, the first cyclone to make landfall over southern Africa since cyclone Eline in February 2000.
The Use of EDD for Weather Normalisation
 The Use of EDD for Weather Normalisation January 2014 Core Energy Group 2014 January 2014 i Disclaimer Disclaimer This document has been prepared by Core Energy Group Pty Limited, A.C.N. 110 347 085, holder
142 HAIL CLIMATOLOGY OF AUSTRALIA BASED ON LIGHTNING AND REANALYSIS
 142 HAIL CLIMATOLOGY OF AUSTRALIA BASED ON LIGHTNING AND REANALYSIS Christopher N. Bednarczyk* Peter J. Sousounis AIR Worldwide Corporation, Boston, MA 1. INTRODUCTION * The highly uneven distribution
Trends Forecasting. Overview: Objectives: GLEs Addressed: Materials: Activity Procedure:
 Trends Forecasting Overview: How do meteorologists forecast weather? Students learn one of 5 main methods for forecasting weather, use it to create a forecast, and analyze results. Objectives: The student
AOMSUC-6 Training Event
 Effective use of high temporal and spatial resolution Himawari-8 data AOMSUC-6 Training Event Bodo Zeschke Australian Bureau of Meteorology Training Centre Australian VLab Centre of Excellence Content
2013 FORECAST ACCURACY BENCHMARKING SURVEY AND ENERGY
 2013 FORECAST ACCURACY BENCHMARKING SURVEY AND ENERGY Itron Forecasting Brown Bag June 4, 2013 Please Remember» Phones are Muted: In order to help this session run smoothly, your phones are muted.» Full
Rainfall declines over Queensland from and links to the Subtropical Ridge and the SAM
 Rainfall declines over Queensland from 1951-2007 and links to the Subtropical Ridge and the SAM D A Cottrill 1 and J Ribbe 2 1 Bureau of Meteorology, 700 Collins St, Docklands, Melbourne, Victoria, Australia.
Enhanced Wind Power Forecasts using New Methods for Predicting Turbine Icing
 Enhanced Wind Power Forecasts using New Methods for Predicting Turbine Icing Lars Landberg and Jeremy Parkes EWEA Wind Power Forecasting Workshop 2013 Rotterdam, Netherlands Background NERC report (Sep,
Climate Futures for Eastern Melbourne. Data provided for the Eastern Alliance for Greenhouse Action CSIRO July 2010 (Updated 2013)
") Data provided for the Eastern Alliance for Greenhouse Action CSIRO July 2010 (Updated 2013) 2030 A1B Climate Futures for the 5 grid centred on 37.5 S 146.5 E the 2050s Climate Futures for the 5 grid centred
Data provided for the Eastern Alliance for Greenhouse Action CSIRO July 2010 (Updated 2013) 2030 A1B Climate Futures for the 5 grid centred on 37.5 S 146.5 E the 2050s Climate Futures for the 5 grid centred
A GRID SENSITIVITY ANALYSIS METHOD FOR THE CALIBRATION OF PROGNOSTIC METEOROLOGICAL MODELS IN AIR POLLUTION MODELING
 A GRID SENSITIVITY ANALYSIS METHOD FOR THE CALIBRATION OF PROGNOSTIC METEOROLOGICAL MODELS IN AIR POLLUTION MODELING Stamatis Zoras and Athanasios G. Triantafyllou Laboratory of Atmospheric Pollution and
UPDATE ELECTRICITY STATEMENT OF OPPORTUNITIES FOR THE NATIONAL ELECTRICITY MARKET
 UPDATE ELECTRICITY STATEMENT OF OPPORTUNITIES FOR THE NATIONAL ELECTRICITY MARKET Published: 26 October 2015 ELECTRICITY STATEMENT OF OPPORTUNITIES IMPORTANT NOTICE Purpose AEMO publishes the Electricity
AROME Nowcasting - tool based on a convective scale operational system
 AROME Nowcasting - tool based on a convective scale operational system RC - LACE stay report Supervisors (ZAMG): Yong Wang Florian Meier Christoph Wittmann Author: Mirela Pietrisi (NMA) 1. Introduction
Development and Validation of Polar WRF
 Polar Meteorology Group, Byrd Polar Research Center, The Ohio State University, Columbus, Ohio Development and Validation of Polar WRF David H. Bromwich 1,2, Keith M. Hines 1, and Le-Sheng Bai 1 1 Polar
Monthly Overview Rainfall
 Monthly Overview The month of November can be described as having had two parts. The first half of the month was categorised by regular severe weather warnings with large thunderstorms occurring over large
Highlight: Support for a dry climate increasing.
 Scott A. Yuknis High impact weather forecasts, climate assessment and prediction. 14 Boatwright s Loop Plymouth, MA 02360 Phone/Fax 508.927.4610 Cell: 508.813.3499 ClimateImpact@comcast.net Climate Impact
Monthly overview. Rainfall
 Monthly overview 1-10 August 2018 The month started off with light showers over the Western Cape. A large cold front made landfall around the 5th of the month. This front was responsible for good rainfall
Appendix B. Contents. Elliston instrument deployment data report. Olympic Dam Expansion Supplementary Environmental Impact Statement 2010
 Project Alternatives Appendix B Contents B1 Elliston instrument deployment data report 1 Olympic Dam Expansion Supplementary Environmental Impact Statement 2010 Appendix B1 Elliston instrument deployment
Temporal and Spatial Distribution of Tourism Climate Comfort in Isfahan Province
 2011 2nd International Conference on Business, Economics and Tourism Management IPEDR vol.24 (2011) (2011) IACSIT Press, Singapore Temporal and Spatial Distribution of Tourism Climate Comfort in Isfahan
POWER SYSTEM OPERATING PROCEDURE LOAD FORECASTING
 POWER SYSTEM OPERATING PROCEDURE LOAD FORECASTING PREPARED BY: PROCEDURE TYPE: DOCUMENT REFERENCE: FINAL APPROVER: Systems Capability System Operating Procedure SO_OP_3710 Mark Stedwell DOC. VERSION: 19
13 SHADOW FLICKER Introduction Methodology
 Table of contents 13 SHADOW FLICKER... 13-1 13.1 Introduction... 13-1 13.2 Methodology... 13-1 13.2.1 Factors Influencing Shadow Flicker Occurrence... 13-2 13.2.2 Shadow Flicker Analysis Methodology...
peak half-hourly Tasmania
 Forecasting long-term peak half-hourly electricity demand for Tasmania Dr Shu Fan B.S., M.S., Ph.D. Professor Rob J Hyndman B.Sc. (Hons), Ph.D., A.Stat. Business & Economic Forecasting Unit Report for
Bringing Renewables to the Grid. John Dumas Director Wholesale Market Operations ERCOT
 Bringing Renewables to the Grid John Dumas Director Wholesale Market Operations ERCOT 2011 Summer Seminar August 2, 2011 Quick Overview of ERCOT The ERCOT Market covers ~85% of Texas overall power usage
MASTERY ASSIGNMENT 2015
 Climate & Meteorology MASTERY ASSIGNMENT 2015 Directions: You must submit this document via Google Docs to lzimmerman@wcpss.net. The document must include the questions and pictures must be hand drawn
Examples of Pressure Gradient. Pressure Gradient Force. Chapter 7: Forces and Force Balances. Forces that Affect Atmospheric Motion 2/2/2015
 Chapter 7: Forces and Force Balances Forces that Affect Atmospheric Motion Fundamental force - Apparent force - Pressure gradient force Gravitational force Frictional force Centrifugal force Forces that
Plan for operational nowcasting system implementation in Pulkovo airport (St. Petersburg, Russia)
") Plan for operational nowcasting system implementation in Pulkovo airport (St. Petersburg, Russia) Pulkovo airport (St. Petersburg, Russia) is one of the biggest airports in the Russian Federation (150
Plan for operational nowcasting system implementation in Pulkovo airport (St. Petersburg, Russia) Pulkovo airport (St. Petersburg, Russia) is one of the biggest airports in the Russian Federation (150
Application and verification of ECMWF products 2009
 Application and verification of ECMWF products 2009 RHMS of Serbia 1. Summary of major highlights ECMWF products are operationally used in Hydrometeorological Service of Serbia from the beginning of 2003.
Application and verification of ECMWF products: 2010
 Application and verification of ECMWF products: 2010 Hellenic National Meteorological Service (HNMS) F. Gofa, D. Tzeferi and T. Charantonis 1. Summary of major highlights In order to determine the quality
Summary of wool production estimates and forecasts for Australia. 2014/15 Fourth forecast
 Australian Wool Production Forecast Report Australian Wool Production Forecast Committee Summary April 2015 The Australian Wool Production Forecasting Committee (AWPFC) has set its forecast production
Drought lesson plan ITEMS. Teachers lesson plan. Student assignments. About droughts. Real life stories. Droughts: Be prepared.
 Drought lesson plan The drought lesson plan provides teachers and students with an opportunity to investigate the Australian climate, water table and the impacts of drought through individual or classroom
AIR MASSES. Large bodies of air. SOURCE REGIONS areas where air masses originate
 Large bodies of air AIR MASSES SOURCE REGIONS areas where air masses originate Uniform in composition Light surface winds Dominated by high surface pressure The longer the air mass remains over a region,
International Workshop on Wind Energy Development Cairo, Egypt. ERCOT Wind Experience
 International Workshop on Wind Energy Development Cairo, Egypt ERCOT Wind Experience March 22, 21 Joel Mickey Direcr of Grid Operations Electric Reliability Council of Texas jmickey@ercot.com ERCOT 2 2
Integrating Hydrologic and Storm Surge Models for Improved Flood Warning
 Integ Hydrologic and Storm Surge Models for Improved Flood Warning Leahy, C.P, Entel, M, Sooriyakumaran, S, and Warren, G Flood Warning Program Office, Bureau of Meteorology, Docklands, Victoria National
Middle Latitude Cyclones a storm that forms at middle and high latitudes, outside of the tropics.
 Middle Latitude Cyclones a storm that forms at middle and high latitudes, outside of the tropics. Polar Front Theory a theory that explains the life cycle of mid latitude cyclones and their associated
Interdecadal variation in rainfall patterns in South West of Western Australia
 Interdecadal variation in rainfall patterns in South West of Western Australia Priya 1 and Bofu Yu 2 1 PhD Candidate, Australian Rivers Institute and School of Engineering, Griffith University, Brisbane,
DOWNLOAD PDF READING CLIMATE MAPS
 Chapter 1 : Template:Climate chart/how to read a climate chart - Wikipedia Maps don't just tell you which way to go they can tell you practically everything about an area of land, even the weather. Learn
RESERVE LEVEL DECLARATION GUIDELINES
 RESERVE LEVEL DECLARATION GUIDELINES PREPARED BY: AEMO Operations DOCUMENT REF: RLDG-V2.1-FINAL VERSION: 2.1 EFFECTIVE DATE: 12 December 2018 STATUS: FINAL Approved for distribution and use by: APPROVED
Modelling dust transport over central eastern Australia
 Meteorol. Appl. 13, 141 167 (2006) doi:10.1017/s1350482706002155 Modelling dust transport over central eastern Australia Lance M. Leslie 1 & Milton S. Speer 2,3 1 School of Meteorology, University of Oklahoma,
Annex I to Target Area Assessments
 Baltic Challenges and Chances for local and regional development generated by Climate Change Annex I to Target Area Assessments Climate Change Support Material (Climate Change Scenarios) SWEDEN September
Application and verification of ECMWF products 2016
 Application and verification of ECMWF products 2016 RHMS of Serbia 1 Summary of major highlights ECMWF forecast products became the backbone in operational work during last several years. Starting from
The Water and the Land (WATL) project; balancing farmer needs, atmospheric science, and information delivery.
 project; balancing farmer needs, atmospheric science, and information delivery.") The Water and the Land (WATL) project; balancing farmer needs, atmospheric science, and information delivery. Andrew Watkins National Climate Centre Bureau of Meteorology (Member: WMO CAgM ET on the Impact
The Water and the Land (WATL) project; balancing farmer needs, atmospheric science, and information delivery. Andrew Watkins National Climate Centre Bureau of Meteorology (Member: WMO CAgM ET on the Impact
The Weather Information Value Chain
 The Weather Information Value Chain Jeffrey K. Lazo Societal Impacts Program National Center for Atmospheric Research Boulder CO April 27 2016 HIWeather Exeter, England Outline Shout out on WMO/USAID/World
Monthly Overview. Rainfall
 Monthly Overview October started off with the first summer thunderstorms over large parts of the summer rainfall region. Many areas reported 10 mm and more during the first 10 days of the month. Some noticeable
The Southern Ocean Time Series moored observatory A technical and scientific review
 The Southern Ocean Time Series moored observatory A technical and scientific review www.cawcr.gov.au Presented by Diana Greenslade on behalf of: Eric Schulz 1,Tom Trull 2 & Simon Josey 3 1 CAWCR, Bureau
Topographic Mapping in Australia: The Future State
 Topographic ping in Australia: The Future State Context Australia s geography and demography Greg Scott Group Leader National ping & Information Group Chair Permanent Committee for Topographic Information
IMPACT OF GROUND-BASED GPS PRECIPITABLE WATER VAPOR AND COSMIC GPS REFRACTIVITY PROFILE ON HURRICANE DEAN FORECAST. (a) (b) (c)
 (b) (c)") 9B.3 IMPACT OF GROUND-BASED GPS PRECIPITABLE WATER VAPOR AND COSMIC GPS REFRACTIVITY PROFILE ON HURRICANE DEAN FORECAST Tetsuya Iwabuchi *, J. J. Braun, and T. Van Hove UCAR, Boulder, Colorado 1. INTRODUCTION
9B.3 IMPACT OF GROUND-BASED GPS PRECIPITABLE WATER VAPOR AND COSMIC GPS REFRACTIVITY PROFILE ON HURRICANE DEAN FORECAST Tetsuya Iwabuchi *, J. J. Braun, and T. Van Hove UCAR, Boulder, Colorado 1. INTRODUCTION
Speedwell High Resolution WRF Forecasts. Application
 Speedwell High Resolution WRF Forecasts Speedwell weather are providers of high quality weather data and forecasts for many markets. Historically we have provided forecasts which use a statistical bias
ABSTRACT 1.-INTRODUCTION
 Characterization of wind fields at a regional scale calculated by means of a diagnostic model using multivariate techniques M.L. Sanchez, M.A. Garcia, A. Calle Laboratory of Atmospheric Pollution, Dpto
QLD-S NSW-E NSW-W VIC TAS. A HEADER giving details of the time of issue and the associated validity period.
 FLIGHT FORECASTS Flight Forecasts are issued on request for flights for which GAFs are not available. They are subject to the requirements of AIP GEN 3.5 para 3.1 and AIP GEN 3.5 para 10.3. Flight forecasts
PowerPredict Wind Power Forecasting September 2011
 PowerPredict Wind Power Forecasting September 2011 For further information please contact: Dr Geoff Dutton, Energy Research Unit, STFC Rutherford Appleton Laboratory, Didcot, Oxon OX11 0QX E-mail: geoff.dutton@stfc.ac.uk
ERTH 465 Fall Laboratory Exercise 5. Surface Weather Observations (METARS) and Frontal Analysis (300 pts)
 and Frontal Analysis (300 pts)") ERTH 465 Fall 2017 Laboratory Exercise 5 Surface Weather Observations (METARS) and Frontal Analysis (300 pts) Insert in ringed-three hole binder. Point deductions for sloppy or late work. Due date: Tuesday
ERTH 465 Fall 2017 Laboratory Exercise 5 Surface Weather Observations (METARS) and Frontal Analysis (300 pts) Insert in ringed-three hole binder. Point deductions for sloppy or late work. Due date: Tuesday
Mapping Weather Information
 Charles Sturt University Wagga Wagga 17 October 2013 Mapping Weather Information Robert Dahni Bureau of Meteorology Bureau of Meteorology The Bureau's mission We provide Australians with environmental
Application and verification of ECMWF products 2012
 Application and verification of ECMWF products 2012 Instituto Português do Mar e da Atmosfera, I.P. (IPMA) 1. Summary of major highlights ECMWF products are used as the main source of data for operational
SHADOW FLICKER TURBINE LAYOUT 6A GULLEN RANGE WIND FARM GOLDWIND AUSTRALIA
 SHADOW FLICKER TURBINE LAYOUT 6A GULLEN RANGE WIND FARM GOLDWIND AUSTRALIA Document Control Status Written by Approved by Date Comment Revision A T.Lam D.Bolton 14/03/14 Initial Revision B T.Lam D.Bolton
Baseline Ozone in Western North America: Measurements and Models. David Parrish
 Baseline Ozone in Western North America: Measurements and Models David Parrish CIRES University of Colorado NOAA/ESRL Chemical Sciences Division Boulder, Colorado USA Consultant with David.D.Parrish, LLC
Diabatic processes and the structure of the warm conveyor belt
 2 nd European Windstorm Workshop Leeds, 3-4 September 2012 Diabatic processes and the structure of the warm conveyor belt Oscar Martínez-Alvarado J. Chagnon, S. Gray, R. Plant, J. Methven Department of
Will a warmer world change Queensland s rainfall?
 Will a warmer world change Queensland s rainfall? Nicholas P. Klingaman National Centre for Atmospheric Science-Climate Walker Institute for Climate System Research University of Reading The Walker-QCCCE
The Effects of Local Weather Patterns on Nitrate and Sulfate Rainwater Concentrations in Wilmington, North Carolina
 The North Carolina Geographer, Volume 14, 2006, pp. 29-38 29 The Effects of Local Weather Patterns on Nitrate and Sulfate Rainwater Concentrations in Wilmington, North Carolina Sarah Beth Jenkins Douglas
Severe weather. Some case studies for medium-range forecasting. T. La Rocca, Department of Synoptic Meteorology, Italian Met. Service, Rome.
 Severe weather. Some case studies for medium-range forecasting T. La Rocca, Department of Synoptic Meteorology, Italian Met. Service, Rome. The Met Alert Messages by the Watch Office of the Public Safety
Case Study: Australia. LI: To understand urbanisation issues and management strategies in Australia
 Case Study: Australia LI: To understand urbanisation issues and management strategies in Australia Warm Up Match the place names to the map: Urbanisation In 1910, fewer than 40% of Australians lived in
8.1 Attachment 1: Ambient Weather Conditions at Jervoise Bay, Cockburn Sound
 8.1 Attachment 1: Ambient Weather Conditions at Jervoise Bay, Cockburn Sound Cockburn Sound is 20km south of the Perth-Fremantle area and has two features that are unique along Perth s metropolitan coast
Improving the accuracy of solar irradiance forecasts based on Numerical Weather Prediction
 Improving the accuracy of solar irradiance forecasts based on Numerical Weather Prediction Bibek Joshi, Alistair Bruce Sproul, Jessie Kai Copper, Merlinde Kay Why solar power forecasting? Electricity grid
DATA FUSION NOWCASTING AND NWP
 DATA FUSION NOWCASTING AND NWP Brovelli Pascal 1, Ludovic Auger 2, Olivier Dupont 1, Jean-Marc Moisselin 1, Isabelle Bernard-Bouissières 1, Philippe Cau 1, Adrien Anquez 1 1 Météo-France Forecasting Department
A COMPARISON OF VERY SHORT-TERM QPF S FOR SUMMER CONVECTION OVER COMPLEX TERRAIN AREAS, WITH THE NCAR/ATEC WRF AND MM5-BASED RTFDDA SYSTEMS
 A COMPARISON OF VERY SHORT-TERM QPF S FOR SUMMER CONVECTION OVER COMPLEX TERRAIN AREAS, WITH THE NCAR/ATEC WRF AND MM5-BASED RTFDDA SYSTEMS Wei Yu, Yubao Liu, Tom Warner, Randy Bullock, Barbara Brown and
Real-World Performance of Temperature Measurements at Automated Weather Stations How well do we do it?
 CIMO TECO 2016 Australian Bureau of Meteorology Real-World Performance of Temperature Measurements at Automated Weather Stations How well do we do it? Dr Jane Warne and Ian Dollary Hello from the top of