DYNAMICAL DOWNSCALING OF COUPLED MODEL HISTORICAL RUNS
|
|
|
- Loraine Victoria Webb
- 5 years ago
- Views:
Transcription

1 FINAL REPORT FOR PROJECT DYNAMICAL DOWNSCALING OF COUPLED MODEL HISTORICAL RUNS PRINCIPAL INVESTIGATOR: DR. JOHN MCGREGOR, CSIRO Marine and Atmospheric Research, Tel: , Fax: , Address: PB1 Aspendale, Vic CO-AUTHOR: Dr. Kim Nguyen, CMAR. Date: January 2008
2 Abstract A 40-year simulation has been performed with a resolution of about 20 km over the GRDC region, using CCAM for downscaling from a Mk 3.0 coupled GCM simulation. The CCAM present-day climatology shows realistic detail compared to the coarser Mk 3.0 simulation. Over the GRDC region, seasonal rainfall biases are generally small. The simulated average daily maximum and minimum temperatures are found to be acceptable; the maximum temperatures are up to 3 degrees too cool in autumn and winter; the minimum temperatures are a little warm, except in Victoria in winter when they are up to 2 degrees too cool. The interannual variability of the mean annual rainfall of the simulation over the GRDC region is qualitatively similar to the observations, in regard to peak values and number of wet and dry episodes. The simulation produces an increasing trend of rainfall, whereas the observations show little trend over this period. The simulation also calculates an estimate of pan evaporation. No trend is found for pan evaporation over the GRDC region for the simulation. Date: January 2008 Project Objectives: Using CCAM, dynamically downscale the CSIRO Mk 3 GCM for a period corresponding to Compare the simulated climatology, in particular rainfall and temperature, against observations taken within the study region Produce derived fields (including surface fluxes and measures of potential evaporation) and compare them against available observations and observed trends 1. Model description CCAM is formulated on the quasi-uniform conformal-cubic grid. The CCAM regional climate simulations for SEACI use a C72 global grid (6 x 72 x 72 grid points). By using the Schmidt (1977) transformation with a stretching factor of 0.15, CCAM then achieves a fine resolution of 20 km for the central panel which is located over eastern Australia. The grid is illustrated in Figure 1. The previous SEACI Project described experiments using CCAM to downscale NCEP reanalyses from This project follows on from that project, using similar techniques to downscale from the Mk 3.0 coupled climate model, for model years corresponding to This report is laid out in a similar manner to that of Project The dynamical formulation of CCAM includes a number of distinctive features. The model is hydrostatic, with two-time-level semi-implicit time differencing. It employs semi-lagrangian horizontal advection with bi-cubic horizontal interpolation (McGregor, 1993; McGregor, 1996), in conjunction with total-variation-diminishing vertical advection. The grid is unstaggered, but the winds are transformed reversibly to/from C-staggered locations before/after the gravity wave calculations, providing improved dispersion characteristics (McGregor, 2005a). Three-dimensional Cartesian representation is used during the calculation of departure points, and also for the

3 advection or diffusion of vector quantities. Further details of the model dynamical formulation are provided by McGregor (2005b). CCAM includes a fairly comprehensive set of physical parameterizations. The GFDL parameterization for longwave and shortwave radiation (Schwarzkopf and Fels, 1991) is employed, with interactive cloud distributions determined by the liquid and icewater scheme of Rotstayn (1997). The model employs a stability-dependent boundary layer scheme based on Monin-Obukhov similarity theory (McGregor et al., 1993), together with non-local vertical mixing (Holtslag and Boville, 1993) and also enhanced mixing of cloudy boundary layer air (Smith, 1990). A canopy scheme is included, as described by Kowalczyk et al. (1994), having six layers for soil temperatures, six layers for soil moisture (solving Richard's equation), and three layers for snow. CCAM also includes a simple parameterization to enhance sea surface temperatures under conditions of low wind speed and large downward solar radiation, affecting the calculation of surface fluxes. The cumulus convection scheme uses the mass-flux closure described by McGregor (2003), and includes both downdrafts and detrainment. Figure 1. The C72 conformal-cubic grid used for the CCAM simulations. 2. Simulation design The current project uses CCAM to downscale from the Mk 3.0/M20 simulation, run for years corresponding to After 2000, the Mk 3.0 simulation branches into two simulations corresponding to the A2 and A1B scenarios. This report describes the present-day part of the simulation, corresponding to It should be noted that the Mk 3.0 model does not employ flux correction; hence there
 for January and July, in Figure 2. The CCAM simulation uses daily SSTs from Mk 3.")

4 are some biases of sea-surface temperatures (SSTs), up to 2 degrees near Australia, compared to observations. These average monthly biases are shown for a 30-year period ( ) for January and July, in Figure 2. The CCAM simulation uses daily SSTs from Mk 3.0, but with this monthly two-dimensional bias first subtracted. Sea-ice distributions are interpolated directly from the daily values of Mk 3.0; this simulation was submitted by CMAR to the Fourth Assessment Report of IPCC. Figure 2. SST biases in the Mk 3.0 coupled climate simulation, corresponding to for January (top) and July (bottom). For the prior simulation of Project downscaling from NCEP reanalyses, global nudging of winds above 500 hpa from the large-scale fields was employed, whilst outside the central high-resolution panel, gradually-increasing far-field nudging was also employed for MSL pressures and winds between 900 hpa and 500 hpa. This technique was adopted to help ensure that the north-south shifts of the jet-stream were captured. Likewise, we wish to have jet-stream locations in this CCAM simulation that are similar to those of the Mk 3.0 simulation. A new digital-filter technique is used in the present project, whereby large-scale features of MSL pressure and the winds above 500 hpa are similar to those of Mk 3.0; large-scale here is specified as
 in Figure 3, performed twice-daily.")

5 a length scale approximately the width of NSW. The digital filtering is efficiently achieved by a sequence of three one-dimensional passes, two of which are shown schematically (for a 60 km grid) in Figure 3, performed twice-daily. The model output was saved twice per day at 00 GMT and 12 GMT. These data have been post-processed onto a 0.2 degree grid covering 130E - 160E and 50S - 5S. Many prognostic and diagnostic fields have been saved. Figure 3. Schematic showing two one-dimensional passes of the Gaussian digitalfilter. 3. Seasonal averages of rainfall and temperature The 40-year ( ) monthly-mean CCAM rainfall was averaged to produce seasonal averages for December, January and February (DJF), March, April and May (MAM), June, July and August (JJA) and September, October and November (SON). These averages are compared against the observed seasonal rainfall, and the maximum and minimum temperatures provided by the Bureau of Meteorology. In general, CCAM simulates well the mean seasonal rainfall patterns (Figure 4). The large rainfall along the eastern coast is well captured for all seasons. The large rainfall along the Great Dividing Range and the eastern coast is also well captured, except in winter when it is deficient. Inland of the Great Dividing Range, summer rainfall is well captured, autumn and winter are somewhat lower than observed, whereas spring rainfall is somewhat larger than observed over inland New South Wales and Queensland. Seasonal rainfall biases are shown in Figure 5 for both CCAM and the host Mk3.0 simulations. For autumn, winter and spring the biases of Mk3.0 and CCAM are both generally quite small, with CCAM biases being a little smaller near the coastline. For summer, Mk3.0 has a rather large wet bias of 1-2 mm/day over much of New South Wales and Queensland, whereas the CCAM biases are again quite small.
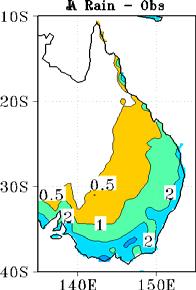
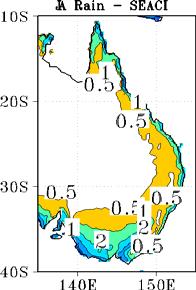
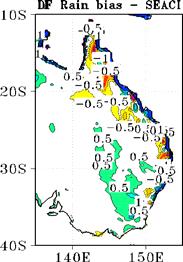
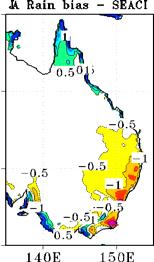
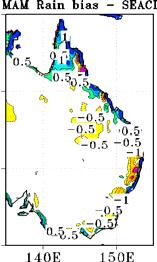
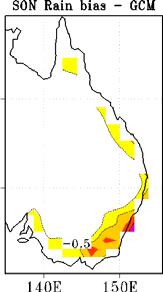
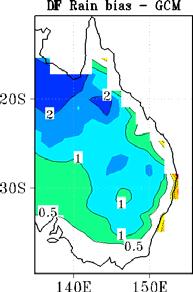
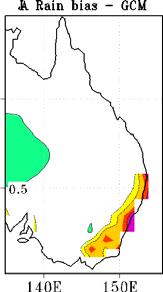
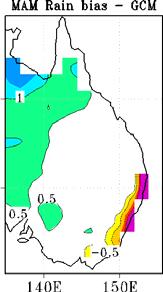
6 Figure 4. Seasonally-averaged rainfall (mm/day), with observations (top) and CCAM (downscaled from Mk3.0, bottom). Figure 5. Bias of seasonally-averaged rainfall (mm/day) for Mk3.0 (top) and CCAM (bottom).

7 Figure 6. Seasonally-averaged maximum temperatures (degrees C), with observations (top) and CCAM (bottom), compared to observations. The seasonally-averaged daily-maximum surface air temperatures are shown for observations and CCAM in Figure 6. The maximum temperature patterns are generally well simulated for all seasons; terrain effects are well captured. Maximum temperature biases are shown in Figure 7 for both Mk3.0 and CCAM. Over New South Wales and Queensland the CCAM biases are generally less than 1 degree, whereas Mk3.0 maximum temperature biases are up to 5 degrees too cool, especially in autumn and winter. In summer and spring, maximum temperatures over Victoria from CCAM are up to 2 degrees too warm.
 for Mk3.")


 for")
8 Figure 7. Bias of seasonally-averaged maximum temperatures (degrees C) for Mk3.0 (top) and CCAM (bottom), compared to observations. The seasonally-averaged daily-minimum surface air temperatures are shown for observations and CCAM in Figure 8. The minimum temperature patterns are also generally well simulated for all seasons, and again terrain effects are well captured. Minimum temperature biases are shown in Figure 9 for both Mk3.0 and CCAM. Mk3.0 minimum temperature biases (typically up to 1 degree too cool) are now generally smaller than for CCAM (up to 2 or 3 degrees too warm) for most seasons, and especially summer and spring. During summer, both Mk3.0 and CCAM are too warm over the southern half of the MDB
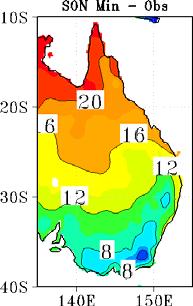
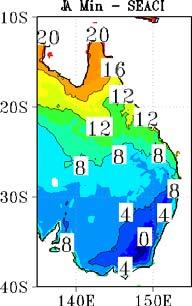
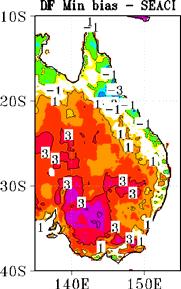
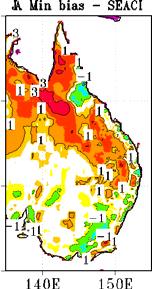
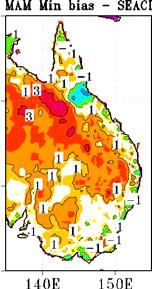
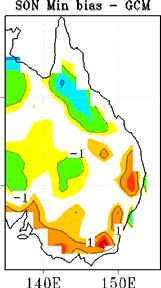
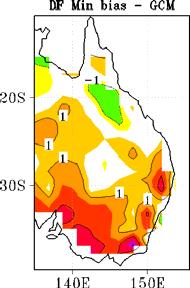
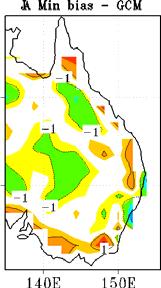
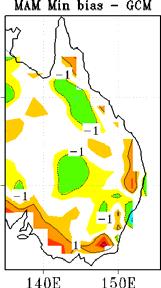
9 Figure 8. Seasonally-averaged minimum temperatures (degrees C), with observations (top) and CCAM (bottom). Figure 9. Bias of seasonally-averaged minimum temperatures (degrees C) for Mk3.0 (top) and CCAM (bottom), compared to observations.
10 4. Interannual variability of rainfall and pan evaporation The interannual variability of the simulation is illustrated by means of time series of the annual averages for rainfall and pan evaporation. The averages are taken over land points for two regions: Region 1: the GRDC southern region, 134E - 154E and 39S - 32S Region 2: a larger MDB region, 141E - 154E and 39S - 25S. Figure 10 shows the annual rainfall for region 1. While the individual high and low rainfall years do not coincide, this is not to be expected as the model is using GCM years rather than actual years. However, the peak values are similar. Both observations and CCAM have about 6 episodes with rather low (El Nino-like) rainfall, and about 6 episodes with higher rainfall. The simulation shows an increasing trend (2% per decade) for rainfall during this period, whereas the observations show no trend. The situation is similar for Region 2 (Figure 11); this region has generally higher average rainfall than Region 1, as it includes more of the tropical part of Australia Reg1 Rain CCAM Obs Figure 10. Time series of observed and simulated annual rainfall for region 1 (the southern GRDC region) for CCAM is shown for GCM model years, whilst OBS refers to actual years. Trend lines are also shown for CCAM (increasing trend) and observed (little trend).
11 3 2.5 Reg2 Rain CCAM Obs Figure 11. As for Figure 10, but showing the time series for the larger region 2. Plotted for observed and simulated. CCAM is shown for GCM model years, whilst OBS refers to actual years. Trend lines are also shown for CCAM (increasing trend) and observed (little trend). In the CCAM simulation, we also explicitly calculate pan evaporation, by predicting at each time step the water temperature for a pan located at each grid point. Sensible and latent heat fluxes are calculated as part of this process. Figure 12 shows the time series for the annual pan evaporation averaged over both regions. The Figure also shows the pan evaporation for from our prior simulation downscaling from NCEP reanalyses (Project 1.3.6). During this period, there is a negligible trend in pan evaporation simulated for either simulation or either region. Region 2 is on average warmer than region 1 and produces larger pan evaporation, as is to be expected. The current simulation produces somewhat (by up to 10%) larger estimates of pan evaporation than our prior simulation that downscaled from NCEP, for reasons we are yet to clarify (presumably related to one or more of low-level temperature, humidity or wind speed being different between the two simulations).
12 NCEP: Pan Evaporation Reg 1 Reg A2: Pan Evaporation Reg 1 Reg Figure 12. Time series of simulated pan evaporation (mm/year) averaged over regions 1 and 2 for The upper plot is for the prior CCAM simulation downscaling from NCEP reanalyses. The lower plot is for the current CCAM simulation, for Mk3.0 GCM years. Trend lines are also shown. 5. Rainfall extremes Rainfall extremes have been calculated from the daily output files for the maximum daily rainfall on a 0.5 degree latitude/longitude grid. These are compared in Figure 13 against Bureau of Meteorology values plotted on a similar 0.25 degree grid. The simulated maxima agree quite well along the coastal zone (up to about 250 mm/day). The interior extreme values are somewhat low. This will be partly due to interpolation
 for the duration of the 40-year run. CCAM is shown on the left, and observations on the right. 6.")
13 from the model 20 km grid to sparser points at 0.5 degrees (about 50 km). We plan to investigate this behaviour further. Figure 13. Maximum daily rainfall (mm/day) at each point (on a 0.5 degree grid) for the duration of the 40-year run. CCAM is shown on the left, and observations on the right. 6. Summary This report presents some results from a 40-year present-day simulation downscaling a present-day simulation of the Mk 3.0 coupled atmosphere-ocean GCM by using the CCAM variable-resolution model at 20 km resolution over eastern Australia.. Many detailed 6-hourly output fields were produced and these can be made available to other researchers. The CCAM present-day climatology shows realistic detail compared to the coarser Mk 3.0 simulation. CCAM reproduces well the mean seasonal rainfall patterns; the only deficiencies are that the winter rainfall is somewhat low along the east coast, inland autumn and winter rainfall is somewhat low, and spring rainfall is somewhat large over inland New South Wales and Queensland. The mean daily temperature patterns are also well captured, and generally the maximum temperatures have smaller errors than Mk 3.0; terrain effects are also better captured. The largest maximum temperature errors (up to 2 degrees) are in summer and spring over Victoria. The CCAM minimum temperatures are up to 2 or 3 degrees too warm, especially for summer and spring, whereas Mk 3.0 is typically about 1 degree too cool. During summer, both CCAM and Mk3.0 are too warm over the southern half of the MDB. The interannual variability of the mean annual rainfall of the simulation over the GRDC region is qualitatively similar to the observations, in regard to peak values and number of wet and dry episodes. The simulation produces an increasing trend of rainfall, whereas the observations show little trend over this period. The simulation also calculates an estimate of pan evaporation. Over the GRDC region, the values are about 10% larger than for the prior simulation downscaling from NCEP reanalyses. No trend is found for pan evaporation over the GRDC region for either of the simulations.
14 Maximum daily rainfall throughout the 40-year simulation was also calculated. Near the coastline it agrees quite well with observed values. Inland, the maximum values are somewhat lower than observed. The ongoing project 2.1.5, continues the simulation on to 2100 for both the A2 and A1B scenarios. List of publication titles: McGregor, J. L., Nguyen, K. C., and M. Thatcher, 2008: Regional climate simulation at 20 km using CCAM with a scale-selective digital filter. Research Activities in Atmospheric and Oceanic Modelling Report No. 38 (ed. J. Cote), WMO/TD. Thatcher, M., and J. L. McGregor, 2008: Using a scale-selective filter for dynamical downscaling with the conformal cubic atmospheric model. Submitted to Mon. Wea. Rev. Acknowledgements Dr. Marcus Thatcher co-developed the digital filter used in this simulation. Dr. Ian Watterson kindly produced Figure 13 displaying the extreme rainfall values. This project References Holtslag, A. A. M., and B. A. Boville, 1993: Local versus non-local boundary layer diffusion in a global climate model. J. Climate, 6, Kowalczyk, E. A., J. R. Garratt, and P. B. Krummel, 1994: Implementation of a soilcanopy scheme into the CSIRO GCM -regional aspects of the model response. CSIRO Div. Atmospheric Research Tech. Paper No. 32, 59 pp. McGregor, J. L., 1993: Economical determination of departure points for semi- Lagrangian models. Mon. Wea. Rev., 121, McGregor, J. L., 1996: Semi-Lagrangian advection on conformal-cubic grids. Mon. Wea. Rev., 124, McGregor, J. L., 2003: A new convection scheme using a simple closure. In "Current issues in the parameterization of convection", BMRC Research Report 93, McGregor, J. L., 2005a: Geostrophic adjustment for reversibly staggered grids. Mon. Wea. Rev., 133, McGregor, J. L., 2005b: C-CAM: Geometric aspects and dynamical formulation [electronic publication]. CSIRO Atmospheric Research Tech. Paper No. 70, 43 pp. McGregor, J. L., H. B. Gordon, I. G. Watterson, M. R. Dix, and L. D. Rotstayn, 1993: The CSIRO 9-level atmospheric general circulation model. CSIRO Div. Atmospheric Research Tech. Paper No. 26, 89 pp. Rotstayn, L. D., 1997: A physically based scheme for the treatment of stratiform clouds and precipitation in large-scale models. I: Description and evaluation of the microphysical processes. Quart. J. Roy. Meteor. Soc., 123, Schmidt, F., 1977: Variable fine mesh in spectral global model. Beitr. Phys. Atmos., 50, Schwarzkopf, M. D., and S. B. Fels, 1991: The simplified exchange method revisited: an accurate, rapid method for computation of infrared cooling rates and fluxes. J. Geophys. Res., 96,
15 Smith, R. N. B., 1990: A scheme for predicting layer clouds and their water content in a general circulation model. Quart. J. Roy. Meteor. Soc., 116, Project Milestone Reporting Table To be completed prior to commencing the project Milestone description 1 (brief) (up to 33% of project activity) 1. Compare alternative downscaling techniques (wind forcing from upperair versus farfield) 2. Complete the simulation from at 20 km resolution Performance indicators 2 (1-3 dot points) Complete 10- year trial simulations, and select the most appropriate downscaling methodology from the Mk 3.5 GCM. Completion of full simulation Satisfactory climatology of rainfall and maximum and minimum temperatures Completio n date 3 Xx/xx/xxx x Budget 4 for Mileston e ($) Completed at each Milestone date Progress 5 (1-3 dot points) 31/3/07 33k Trial simulations were performed, comparing methods for forcing by upper winds Downscaling was compared from both Mk 3.0 and Mk /6/07 34k A present-day climate simulation has been carried out downscaling from Mk 3.0 for years corresponding to Recommended changes to workplan 6 (1-3 dot points)
16 3. Comparison of model output with available observations Complete an analysis of rainfall, extremes and trends against available observations Produce an analysis of maximum and minimum temperatures Analyse measures of potential evaporation produced by the simulation Examine the model output with regard to behaviour during El Nino years. Produce 8 page report. 31/12/07 33k The various modelled fields have been compared against observations and a report produced.
Final report for Project Dynamical downscaling for SEACI. Principal Investigator: John McGregor
 Final report for Project 1.3.6 1.3.6 Dynamical downscaling for SEACI Principal Investigator: John McGregor CSIRO Marine and Atmospheric Research, john.mcgregor@csiro.au, Tel: 03 9239 4400, Fax: 03 9239
Regional climate downscaling for the Marine and Tropical Sciences Research Facility (MTSRF) between 1971 and 2000
 between 1971 and 2000") Regional climate downscaling for the Marine and Tropical Sciences Research Facility (MTSRF) between 1971 and 2000 M. Thatcher, J. McGregor and K. Nguyen September 2007 Supported by the Australian Government
Regional climate downscaling for the Marine and Tropical Sciences Research Facility (MTSRF) between 1971 and 2000 M. Thatcher, J. McGregor and K. Nguyen September 2007 Supported by the Australian Government
Ensemble one-kilometre forecasts for the South Esk Hydrological Sensor Web
 19th International Congress on Modelling and Simulation, Perth, Australia, 12 16 December 2011 http://mssanz.org.au/modsim2011 Ensemble one-kilometre forecasts for the South Esk Hydrological Sensor Web
Regional climate modelling using CCAM: simulations for CORDEX
 Regional climate modelling using CCAM: simulations for CORDEX John McGregor, Jack Katzfey, Kim Nguyen and Marcus Thatcher CSIRO Marine and Atmospheric Research Aspendale, Melbourne Pune 16 October 2012
Comparing the formulations of CCAM and VCAM and aspects of their performance
 Comparing the formulations of CCAM and VCAM and aspects of their performance John McGregor CSIRO Marine and Atmospheric Research Aspendale, Melbourne PDEs on the Sphere Cambridge 28 September 2012 CSIRO
Urban Water Security Research Alliance Technical Report No. 79
 Future Climates of South East Queensland: Results from High-Resolution Climate Modelling Kim C. Nguyen and John L. McGregor August 2012 Urban Water Security Research Alliance Technical Report No. 79 Urban
Will a warmer world change Queensland s rainfall?
 Will a warmer world change Queensland s rainfall? Nicholas P. Klingaman National Centre for Atmospheric Science-Climate Walker Institute for Climate System Research University of Reading The Walker-QCCCE
Climate Modeling: From the global to the regional scale
 Climate Modeling: From the global to the regional scale Filippo Giorgi Abdus Salam ICTP, Trieste, Italy ESA summer school on Earth System Monitoring and Modeling Frascati, Italy, 31 July 11 August 2006
Mozambique. General Climate. UNDP Climate Change Country Profiles. C. McSweeney 1, M. New 1,2 and G. Lizcano 1
 UNDP Climate Change Country Profiles Mozambique C. McSweeney 1, M. New 1,2 and G. Lizcano 1 1. School of Geography and Environment, University of Oxford. 2.Tyndall Centre for Climate Change Research http://country-profiles.geog.ox.ac.uk
Climate Change in Victoria
 Department of Sustainability and Environment Climate Change in Victoria Assessment of climate change for Victoria: 2001-2002 Undertaken for the Victorian Department of Sustainability and Environment by
Malawi. General Climate. UNDP Climate Change Country Profiles. C. McSweeney 1, M. New 1,2 and G. Lizcano 1
 UNDP Climate Change Country Profiles Malawi C. McSweeney 1, M. New 1,2 and G. Lizcano 1 1. School of Geography and Environment, University of Oxford. 2. Tyndall Centre for Climate Change Research http://country-profiles.geog.ox.ac.uk
Water Balance in the Murray-Darling Basin and the recent drought as modelled with WRF
 18 th World IMACS / MODSIM Congress, Cairns, Australia 13-17 July 2009 http://mssanz.org.au/modsim09 Water Balance in the Murray-Darling Basin and the recent drought as modelled with WRF Evans, J.P. Climate
The PRECIS Regional Climate Model
 The PRECIS Regional Climate Model General overview (1) The regional climate model (RCM) within PRECIS is a model of the atmosphere and land surface, of limited area and high resolution and locatable over
John Steffen and Mark A. Bourassa
 John Steffen and Mark A. Bourassa Funding by NASA Climate Data Records and NASA Ocean Vector Winds Science Team Florida State University Changes in surface winds due to SST gradients are poorly modeled
ENSO Cycle: Recent Evolution, Current Status and Predictions. Update prepared by Climate Prediction Center / NCEP 25 February 2013
 ENSO Cycle: Recent Evolution, Current Status and Predictions Update prepared by Climate Prediction Center / NCEP 25 February 2013 Outline Overview Recent Evolution and Current Conditions Oceanic Niño Index
Development of Super High Resolution Global and Regional Climate Models
 Development of Super High Resolution Global and Regional Climate Models Project Representative Akira Noda Meteorological Research Institute Authors Akira Noda 1, Shoji Kusunoki 1 and Masanori Yoshizaki
NOTES AND CORRESPONDENCE. Seasonal Variation of the Diurnal Cycle of Rainfall in Southern Contiguous China
 6036 J O U R N A L O F C L I M A T E VOLUME 21 NOTES AND CORRESPONDENCE Seasonal Variation of the Diurnal Cycle of Rainfall in Southern Contiguous China JIAN LI LaSW, Chinese Academy of Meteorological
ENSO Cycle: Recent Evolution, Current Status and Predictions. Update prepared by Climate Prediction Center / NCEP 5 August 2013
 ENSO Cycle: Recent Evolution, Current Status and Predictions Update prepared by Climate Prediction Center / NCEP 5 August 2013 Outline Overview Recent Evolution and Current Conditions Oceanic Niño Index
Modelling Fuel Moisture Under Climate Change
 18 th World IMACS / MODSIM Congress, Cairns, Australia 13-17 July 2009 http://mssanz.org.au/modsim09 Abstract: Modelling Fuel Moisture Under Climate Change Matthews, S. 1,2, Nguyen, K. 3, and McGregor,
The Formation of Precipitation Anomaly Patterns during the Developing and Decaying Phases of ENSO
 ATMOSPHERIC AND OCEANIC SCIENCE LETTERS, 2010, VOL. 3, NO. 1, 25 30 The Formation of Precipitation Anomaly Patterns during the Developing and Decaying Phases of ENSO HU Kai-Ming and HUANG Gang State Key
P1.34 MULTISEASONALVALIDATION OF GOES-BASED INSOLATION ESTIMATES. Jason A. Otkin*, Martha C. Anderson*, and John R. Mecikalski #
 P1.34 MULTISEASONALVALIDATION OF GOES-BASED INSOLATION ESTIMATES Jason A. Otkin*, Martha C. Anderson*, and John R. Mecikalski # *Cooperative Institute for Meteorological Satellite Studies, University of
Development of a Coupled Atmosphere-Ocean-Land General Circulation Model (GCM) at the Frontier Research Center for Global Change
 at the Frontier Research Center for Global Change") Chapter 1 Atmospheric and Oceanic Simulation Development of a Coupled Atmosphere-Ocean-Land General Circulation Model (GCM) at the Frontier Research Center for Global Change Project Representative Tatsushi
Chapter 1 Atmospheric and Oceanic Simulation Development of a Coupled Atmosphere-Ocean-Land General Circulation Model (GCM) at the Frontier Research Center for Global Change Project Representative Tatsushi
SUPPLEMENTARY INFORMATION
 Intensification of Northern Hemisphere Subtropical Highs in a Warming Climate Wenhong Li, Laifang Li, Mingfang Ting, and Yimin Liu 1. Data and Methods The data used in this study consists of the atmospheric
ENSO Cycle: Recent Evolution, Current Status and Predictions. Update prepared by Climate Prediction Center / NCEP 24 September 2012
 ENSO Cycle: Recent Evolution, Current Status and Predictions Update prepared by Climate Prediction Center / NCEP 24 September 2012 Outline Overview Recent Evolution and Current Conditions Oceanic Niño
Annex I to Target Area Assessments
 Baltic Challenges and Chances for local and regional development generated by Climate Change Annex I to Target Area Assessments Climate Change Support Material (Climate Change Scenarios) SWEDEN September
ENSO Cycle: Recent Evolution, Current Status and Predictions. Update prepared by Climate Prediction Center / NCEP 11 November 2013
 ENSO Cycle: Recent Evolution, Current Status and Predictions Update prepared by Climate Prediction Center / NCEP 11 November 2013 Outline Overview Recent Evolution and Current Conditions Oceanic Niño Index
ENSO Cycle: Recent Evolution, Current Status and Predictions. Update prepared by Climate Prediction Center / NCEP 23 April 2012
 ENSO Cycle: Recent Evolution, Current Status and Predictions Update prepared by Climate Prediction Center / NCEP 23 April 2012 Outline Overview Recent Evolution and Current Conditions Oceanic Niño Index
ENSO Cycle: Recent Evolution, Current Status and Predictions. Update prepared by Climate Prediction Center / NCEP 15 July 2013
 ENSO Cycle: Recent Evolution, Current Status and Predictions Update prepared by Climate Prediction Center / NCEP 15 July 2013 Outline Overview Recent Evolution and Current Conditions Oceanic Niño Index
Changes in Southern Hemisphere rainfall, circulation and weather systems
 19th International Congress on Modelling and Simulation, Perth, Australia, 12 16 December 2011 http://mssanz.org.au/modsim2011 Changes in Southern Hemisphere rainfall, circulation and weather systems Frederiksen,
Patterns of summer rainfall variability across tropical Australia - results from EOT analysis
 18 th World IMACS / MODSIM Congress, Cairns, Australia 13-17 July 29 http://mssanz.org.au/modsim9 Patterns of summer rainfall variability across tropical Australia - results from EOT analysis Smith, I.N.
Diagnosing the Climatology and Interannual Variability of North American Summer Climate with the Regional Atmospheric Modeling System (RAMS)
") Diagnosing the Climatology and Interannual Variability of North American Summer Climate with the Regional Atmospheric Modeling System (RAMS) Christopher L. Castro and Roger A. Pielke, Sr. Department of
Diagnosing the Climatology and Interannual Variability of North American Summer Climate with the Regional Atmospheric Modeling System (RAMS) Christopher L. Castro and Roger A. Pielke, Sr. Department of
5. General Circulation Models
 5. General Circulation Models I. 3-D Climate Models (General Circulation Models) To include the full three-dimensional aspect of climate, including the calculation of the dynamical transports, requires
Climate Change Projections for the Wooli Wooli Estuary and Batemans Bay. A report for the New South Wales Department of Environment and Climate Change
 Climate Change Projections for the Wooli Wooli Estuary and Batemans Bay Ian Macadam, Kathleen McInnes and Julian O Grady 27 November 2007 A report for the New South Wales Department of Environment and
Unified Cloud and Mixing Parameterizations of the Marine Boundary Layer: EDMF and PDF-based cloud approaches
 DISTRIBUTION STATEMENT A. Approved for public release; distribution is unlimited. Unified Cloud and Mixing Parameterizations of the Marine Boundary Layer: EDMF and PDF-based cloud approaches Joao Teixeira
ENSO Cycle: Recent Evolution, Current Status and Predictions. Update prepared by Climate Prediction Center / NCEP July 26, 2004
 ENSO Cycle: Recent Evolution, Current Status and Predictions Update prepared by Climate Prediction Center / NCEP July 26, 2004 Outline Overview Recent Evolution and Current Conditions Oceanic NiZo Index
Regional climate projections for NSW
 Regional climate projections for NSW Dr Jason Evans Jason.evans@unsw.edu.au Climate Change Projections Global Climate Models (GCMs) are the primary tools to project future climate change CSIROs Climate
AN ASSESSMENT OF SIMULATIONS OF CLIMATE VARIABILITY OVER AUSTRALIA WITH A LIMITED AREA MODEL
 INTERNATIONAL JOURNAL OF CLIMATOLOGY, VOL. 17, 201 223 (1997) AN ASSESSMENT OF SIMULATIONS OF CLIMATE VARIABILITY OVER AUSTRALIA WITH A LIMITED AREA MODEL KEVIN WALSH AND JOHN MCGREGOR CSIRO Division of
ENSO and April SAT in MSA. This link is critical for our regression analysis where ENSO and
 Supplementary Discussion The Link between El Niño and MSA April SATs: Our study finds a robust relationship between ENSO and April SAT in MSA. This link is critical for our regression analysis where ENSO
Projected change in the East Asian summer monsoon from dynamical downscaling
 Copyright KIOST, ALL RIGHTS RESERVED. Projected change in the East Asian summer monsoon from dynamical downscaling : Moisture budget analysis Chun-Yong Jung 1,2, Chan Joo Jang 1*, Ho-Jeong Shin 1 and Hyung-Jin
Characteristics of Global Precipitable Water Revealed by COSMIC Measurements
 Characteristics of Global Precipitable Water Revealed by COSMIC Measurements Ching-Yuang Huang 1,2, Wen-Hsin Teng 1, Shu-Peng Ho 3, Ying-Hwa Kuo 3, and Xin-Jia Zhou 3 1 Department of Atmospheric Sciences,
Summary and concluding remarks
 Contents Introduction Experimental design Model domain: CORDEX-East Asia domain Model description: HadGEM3-RA Evaluation results Mean climate Inter-annual variability Climate extreme Summary and concluding
Effects of sub-grid variability of precipitation and canopy water storage on climate model simulations of water cycle in Europe
 Adv. Geosci., 17, 49 53, 2008 Author(s) 2008. This work is distributed under the Creative Commons Attribution 3.0 License. Advances in Geosciences Effects of sub-grid variability of precipitation and canopy
Moist static energy budget diagnostics for. monsoon research. H. Annamalai
 Moist static energy budget diagnostics for monsoon research H. Annamalai JJAS Precipitation and SST Climatology I III II Multiple regional heat sources - EIO and SPCZ still experience high precipitation
Comparison of Convection Characteristics at the Tropical Western Pacific Darwin Site Between Observation and Global Climate Models Simulations
 Comparison of Convection Characteristics at the Tropical Western Pacific Darwin Site Between Observation and Global Climate Models Simulations G.J. Zhang Center for Atmospheric Sciences Scripps Institution
Atmospheric Processes
 Atmospheric Processes Atmospheric prognostic variables Wind Temperature Humidity Cloud Water/Ice Atmospheric processes Mixing Radiation Condensation/ Evaporation Precipitation Surface exchanges Friction
High-Resolution MPAS Simulations for Analysis of Climate Change Effects on Weather Extremes
 High-Resolution MPAS Simulations for Analysis of Climate Change Effects on Weather Extremes ALLISON MICHAELIS, GARY LACKMANN, & WALT ROBINSON Department of Marine, Earth, and Atmospheric Sciences, North
Zambia. General Climate. Recent Climate Trends. UNDP Climate Change Country Profiles. Temperature. C. McSweeney 1, M. New 1,2 and G.
 UNDP Climate Change Country Profiles Zambia C. McSweeney 1, M. New 1,2 and G. Lizcano 1 1. School of Geography and Environment, University of Oxford. 2. Tyndall Centre for Climate Change Research http://country-profiles.geog.ox.ac.uk
Evidence for Weakening of Indian Summer Monsoon and SA CORDEX Results from RegCM
 Evidence for Weakening of Indian Summer Monsoon and SA CORDEX Results from RegCM S K Dash Centre for Atmospheric Sciences Indian Institute of Technology Delhi Based on a paper entitled Projected Seasonal
Analysis of Cloud-Radiation Interactions Using ARM Observations and a Single-Column Model
 Analysis of Cloud-Radiation Interactions Using ARM Observations and a Single-Column Model S. F. Iacobellis, R. C. J. Somerville, D. E. Lane, and J. Berque Scripps Institution of Oceanography University
Antigua and Barbuda. General Climate. Recent Climate Trends. UNDP Climate Change Country Profiles. Temperature
 UNDP Climate Change Country Profiles Antigua and Barbuda C. McSweeney 1, M. New 1,2 and G. Lizcano 1 1. School of Geography and Environment, University of Oxford. 2. Tyndall Centre for Climate Change Research
Aiguo Dai * and Kevin E. Trenberth National Center for Atmospheric Research (NCAR) $, Boulder, CO. Abstract
 $, Boulder, CO. Abstract") 9.2 AMS 14 th Symposium on Global Change and Climate Variations, 9-13 Feb. 2003, Long Beach, CA. Diurnal Variations in the Community Climate System Model Aiguo Dai * and Kevin E. Trenberth National Center
9.2 AMS 14 th Symposium on Global Change and Climate Variations, 9-13 Feb. 2003, Long Beach, CA. Diurnal Variations in the Community Climate System Model Aiguo Dai * and Kevin E. Trenberth National Center
Meteorology. Circle the letter that corresponds to the correct answer
 Chapter 3 Worksheet 1 Meteorology Name: Circle the letter that corresponds to the correct answer 1) If the maximum temperature for a particular day is 26 C and the minimum temperature is 14 C, the daily
Improved rainfall and cloud-radiation interaction with Betts-Miller-Janjic cumulus scheme in the tropics
 Improved rainfall and cloud-radiation interaction with Betts-Miller-Janjic cumulus scheme in the tropics Tieh-Yong KOH 1 and Ricardo M. FONSECA 2 1 Singapore University of Social Sciences, Singapore 2
St Lucia. General Climate. Recent Climate Trends. UNDP Climate Change Country Profiles. Temperature. Precipitation
 UNDP Climate Change Country Profiles St Lucia C. McSweeney 1, M. New 1,2 and G. Lizcano 1 1. School of Geography and Environment, University of Oxford. 2. Tyndall Centre for Climate Change Research http://country-profiles.geog.ox.ac.uk
Numerical simulation of marine stratocumulus clouds Andreas Chlond
 Numerical simulation of marine stratocumulus clouds Andreas Chlond Marine stratus and stratocumulus cloud (MSC), which usually forms from 500 to 1000 m above the ocean surface and is a few hundred meters
Assessing rainfall trends and remote drivers in regional climate change projections: The demanding test case of Tasmania
 IOP Conference Series: Earth and Environmental Science Assessing rainfall trends and remote drivers in regional climate change projections: The demanding test case of Tasmania To cite this article: M R
FUTURE PROJECTIONS OF PRECIPITATION CHARACTERISTICS IN ASIA
 FUTURE PROJECTIONS OF PRECIPITATION CHARACTERISTICS IN ASIA AKIO KITOH, MASAHIRO HOSAKA, YUKIMASA ADACHI, KENJI KAMIGUCHI Meteorological Research Institute Tsukuba, Ibaraki 305-0052, Japan It is anticipated
How Will Low Clouds Respond to Global Warming?
 How Will Low Clouds Respond to Global Warming? By Axel Lauer & Kevin Hamilton CCSM3 UKMO HadCM3 UKMO HadGEM1 iram 2 ECHAM5/MPI OM 3 MIROC3.2(hires) 25 IPSL CM4 5 INM CM3. 4 FGOALS g1. 7 GISS ER 6 GISS
JRA-55 Product Users Handbook
 Climate Prediction Division Global Environment and Marine Department Japan Meteorological Agency September 2013 Change record Version Date Remarks 1.0 30 September 2013 First version 2.0 3 March 2014 Corrected
NOTES AND CORRESPONDENCE. On the Seasonality of the Hadley Cell
 1522 JOURNAL OF THE ATMOSPHERIC SCIENCES VOLUME 60 NOTES AND CORRESPONDENCE On the Seasonality of the Hadley Cell IOANA M. DIMA AND JOHN M. WALLACE Department of Atmospheric Sciences, University of Washington,
Environment and Climate Change Canada / GPC Montreal
 Environment and Climate Change Canada / GPC Montreal Assessment, research and development Bill Merryfield Canadian Centre for Climate Modelling and Analysis (CCCma) with contributions from colleagues at
Formulation and performance of the Variable-Cubic Atmospheric Model
 Formulation and performance of the Variable-Cubic Atmospheric Model John McGregor CSIRO Marine and Atmospheric Research Aspendale, Melbourne Southern Hemisphere PDEs on the Sphere NCAR 11 April 2014 CSIRO
The South Eastern Australian Climate Initiative
 The South Eastern Australian Climate Initiative Phase 2 of the South Eastern Australian Climate Initiative (SEACI) is a three-year (2009 2012), $9 million research program investigating the causes and
Analysis of meteorological measurements made over three rainy seasons in Sinazongwe District, Zambia.
 Analysis of meteorological measurements made over three rainy seasons in Sinazongwe District, Zambia. 1 Hiromitsu Kanno, 2 Hiroyuki Shimono, 3 Takeshi Sakurai, and 4 Taro Yamauchi 1 National Agricultural
Radiative Climatology of the North Slope of Alaska and the Adjacent Arctic Ocean
 Radiative Climatology of the North Slope of Alaska and the Adjacent Arctic Ocean C. Marty, R. Storvold, and X. Xiong Geophysical Institute University of Alaska Fairbanks, Alaska K. H. Stamnes Stevens Institute
Using a Scale-Selective Filter for Dynamical Downscaling with the Conformal Cubic Atmospheric Model
 1742 M O N T H L Y W E A T H E R R E V I E W VOLUME 137 Using a Scale-Selective Filter for Dynamical Downscaling with the Conformal Cubic Atmospheric Model MARCUS THATCHER AND JOHN L. MCGREGOR CSIRO Marine
Urban Water Security Research Alliance
 Urban Water Security Research Alliance Drought Frequency and Duration Projections for South East Queensland David Kent, Wenju Cai, Kim Nguyen Climate and Water 29 September 2010 Outline Previous projections
Incorporation of 3D Shortwave Radiative Effects within the Weather Research and Forecasting Model
 Incorporation of 3D Shortwave Radiative Effects within the Weather Research and Forecasting Model W. O Hirok and P. Ricchiazzi Institute for Computational Earth System Science University of California
ENSO: Recent Evolution, Current Status and Predictions. Update prepared by: Climate Prediction Center / NCEP 9 November 2015
 ENSO: Recent Evolution, Current Status and Predictions Update prepared by: Climate Prediction Center / NCEP 9 November 2015 Outline Summary Recent Evolution and Current Conditions Oceanic Niño Index (ONI)
Downscaling ability of the HadRM3P model over North America
 Downscaling ability of the HadRM3P model over North America Wilfran Moufouma-Okia and Richard Jones Crown copyright Met Office Acknowledgments Special thanks to the Met Office Hadley Centre staff in the
Application of the Ems-Wrf Model in Dekadal Rainfall Prediction over the Gha Region Franklin J. Opijah 1, Joseph N. Mutemi 1, Laban A.
 Application of the Ems-Wrf Model in Dekadal Rainfall Prediction over the Gha Region Franklin J. Opijah 1, Joseph N. Mutemi 1, Laban A. Ogallo 2 1 University of Nairobi; 2 IGAD Climate Prediction and Applications
Cuba. General Climate. Recent Climate Trends. UNDP Climate Change Country Profiles. Temperature. C. McSweeney 1, M. New 1,2 and G.
 UNDP Climate Change Country Profiles Cuba C. McSweeney 1, M. New 1,2 and G. Lizcano 1 1. School of Geography and Environment, University of Oxford. 2. Tyndall Centre for Climate Change Research http://country-profiles.geog.ox.ac.uk
Suriname. General Climate. Recent Climate Trends. UNDP Climate Change Country Profiles. Temperature. C. McSweeney 1, M. New 1,2 and G.
 UNDP Climate Change Country Profiles Suriname C. McSweeney 1, M. New 1,2 and G. Lizcano 1 1. School of Geography and Environment, University of Oxford. 2. Tyndall Centre for Climate Change Research http://country-profiles.geog.ox.ac.uk
4.3.2 Configuration. 4.3 Ensemble Prediction System Introduction
 4.3 Ensemble Prediction System 4.3.1 Introduction JMA launched its operational ensemble prediction systems (EPSs) for one-month forecasting, one-week forecasting, and seasonal forecasting in March of 1996,
Introduction to Climate ~ Part I ~
 2015/11/16 TCC Seminar JMA Introduction to Climate ~ Part I ~ Shuhei MAEDA (MRI/JMA) Climate Research Department Meteorological Research Institute (MRI/JMA) 1 Outline of the lecture 1. Climate System (
The Fifth-Generation NCAR / Penn State Mesoscale Model (MM5) Mark Decker Feiqin Xie ATMO 595E November 23, 2004 Department of Atmospheric Science
 Mark Decker Feiqin Xie ATMO 595E November 23, 2004 Department of Atmospheric Science") The Fifth-Generation NCAR / Penn State Mesoscale Model (MM5) Mark Decker Feiqin Xie ATMO 595E November 23, 2004 Department of Atmospheric Science Outline Basic Dynamical Equations Numerical Methods Initialization
The Fifth-Generation NCAR / Penn State Mesoscale Model (MM5) Mark Decker Feiqin Xie ATMO 595E November 23, 2004 Department of Atmospheric Science Outline Basic Dynamical Equations Numerical Methods Initialization
A "New" Mechanism for the Diurnal Variation of Convection over the Tropical Western Pacific Ocean
 A "New" Mechanism for the Diurnal Variation of Convection over the Tropical Western Pacific Ocean D. B. Parsons Atmospheric Technology Division National Center for Atmospheric Research (NCAR) Boulder,
What is happening to the Jamaican climate?
 What is happening to the Jamaican climate? Climate Change and Jamaica: Why worry? Climate Studies Group, Mona (CSGM) Department of Physics University of the West Indies, Mona Part 1 RAIN A FALL, BUT DUTTY
Sensitivity of Tropical Tropospheric Temperature to Sea Surface Temperature Forcing
 Sensitivity of Tropical Tropospheric Temperature to Sea Surface Temperature Forcing Hui Su, J. David Neelin and Joyce E. Meyerson Introduction During El Niño, there are substantial tropospheric temperature
NOTES AND CORRESPONDENCE. El Niño Southern Oscillation and North Atlantic Oscillation Control of Climate in Puerto Rico
 2713 NOTES AND CORRESPONDENCE El Niño Southern Oscillation and North Atlantic Oscillation Control of Climate in Puerto Rico BJÖRN A. MALMGREN Department of Earth Sciences, University of Göteborg, Goteborg,
ENSO: Recent Evolution, Current Status and Predictions. Update prepared by: Climate Prediction Center / NCEP 30 October 2017
 ENSO: Recent Evolution, Current Status and Predictions Update prepared by: Climate Prediction Center / NCEP 30 October 2017 Outline Summary Recent Evolution and Current Conditions Oceanic Niño Index (ONI)
DEVELOPMENT OF A LARGE-SCALE HYDROLOGIC PREDICTION SYSTEM
 JP3.18 DEVELOPMENT OF A LARGE-SCALE HYDROLOGIC PREDICTION SYSTEM Ji Chen and John Roads University of California, San Diego, California ABSTRACT The Scripps ECPC (Experimental Climate Prediction Center)
An Intercomparison of Single-Column Model Simulations of Summertime Midlatitude Continental Convection
 An Intercomparison of Single-Column Model Simulations of Summertime Midlatitude Continental Convection S. J. Ghan Pacific Northwest National Laboratory Richland, Washington D. A. Randall, K.-M. Xu, and
High-resolution (10km) ensemble regional climate projections for SE Asia
 ensemble regional climate projections for SE Asia") High-resolution (10km) ensemble regional climate projections for SE Asia Jack Katzfey, CSIRO Oceans and Atmosphere May 2016 Kim NGUYEN, John MCGREGOR, Peter HOFFMANN, Suppiah RAMASAMY, Tim ERWIN, John
High-resolution (10km) ensemble regional climate projections for SE Asia Jack Katzfey, CSIRO Oceans and Atmosphere May 2016 Kim NGUYEN, John MCGREGOR, Peter HOFFMANN, Suppiah RAMASAMY, Tim ERWIN, John
DESCRIPTION OF THE CANADIAN REGIONAL CLIMATE MODEL. 1. Introduction
 DESCRIPTION OF THE CANADIAN REGIONAL CLIMATE MODEL D. CAYA ~, R. LAPRISE ~, M. GIGUI~RE ', G. BERGERON ~, J. P. BLANCHET ~, B. J. STOCKS z, G. J. BOER 3 and N. A. McFARLANE 3 1Cooperative Centre for Research
The Texas drought. Kingtse Mo Climate Prediction Center NWS/NCEP/NOAA
 The 2011-2012 Texas drought Kingtse Mo Climate Prediction Center NWS/NCEP/NOAA 1 outline Evolution of the 2011-2012 Texas drought Climatology and historical perspective The 2011 drought Onset Feedback
The Ocean-Atmosphere System II: Oceanic Heat Budget
 The Ocean-Atmosphere System II: Oceanic Heat Budget C. Chen General Physical Oceanography MAR 555 School for Marine Sciences and Technology Umass-Dartmouth MAR 555 Lecture 2: The Oceanic Heat Budget Q
Fire Weather Drivers, Seasonal Outlook and Climate Change. Steven McGibbony, Severe Weather Manager Victoria Region Friday 9 October 2015
 Fire Weather Drivers, Seasonal Outlook and Climate Change Steven McGibbony, Severe Weather Manager Victoria Region Friday 9 October 2015 Outline Weather and Fire Risk Environmental conditions leading to
Name the surface winds that blow between 0 and 30. GEO 101, February 25, 2014 Monsoon Global circulation aloft El Niño Atmospheric water
 GEO 101, February 25, 2014 Monsoon Global circulation aloft El Niño Atmospheric water Name the surface winds that blow between 0 and 30 What is the atmospheric pressure at 0? What is the atmospheric pressure
Predictability and prediction of the North Atlantic Oscillation
 Predictability and prediction of the North Atlantic Oscillation Hai Lin Meteorological Research Division, Environment Canada Acknowledgements: Gilbert Brunet, Jacques Derome ECMWF Seminar 2010 September
4.4 EVALUATION OF AN IMPROVED CONVECTION TRIGGERING MECHANISM IN THE NCAR COMMUNITY ATMOSPHERE MODEL CAM2 UNDER CAPT FRAMEWORK
 . EVALUATION OF AN IMPROVED CONVECTION TRIGGERING MECHANISM IN THE NCAR COMMUNITY ATMOSPHERE MODEL CAM UNDER CAPT FRAMEWORK Shaocheng Xie, James S. Boyle, Richard T. Cederwall, and Gerald L. Potter Atmospheric
WATER VAPOR FLUXES OVER EQUATORIAL CENTRAL AFRICA
 WATER VAPOR FLUXES OVER EQUATORIAL CENTRAL AFRICA INTRODUCTION A good understanding of the causes of climate variability depend, to the large extend, on the precise knowledge of the functioning of the
2013 ATLANTIC HURRICANE SEASON OUTLOOK. June RMS Cat Response
 2013 ATLANTIC HURRICANE SEASON OUTLOOK June 2013 - RMS Cat Response Season Outlook At the start of the 2013 Atlantic hurricane season, which officially runs from June 1 to November 30, seasonal forecasts
Precipitation Structure and Processes of Typhoon Nari (2001): A Modeling Propsective
: A Modeling Propsective") Precipitation Structure and Processes of Typhoon Nari (2001): A Modeling Propsective Ming-Jen Yang Institute of Hydrological Sciences, National Central University 1. Introduction Typhoon Nari (2001) struck
Precipitation Structure and Processes of Typhoon Nari (2001): A Modeling Propsective Ming-Jen Yang Institute of Hydrological Sciences, National Central University 1. Introduction Typhoon Nari (2001) struck
Precipitation processes in the Middle East
 Precipitation processes in the Middle East J. Evans a, R. Smith a and R.Oglesby b a Dept. Geology & Geophysics, Yale University, Connecticut, USA. b Global Hydrology and Climate Center, NASA, Alabama,
Regional Climate Simulations with WRF Model
 WDS'3 Proceedings of Contributed Papers, Part III, 8 84, 23. ISBN 978-8-737852-8 MATFYZPRESS Regional Climate Simulations with WRF Model J. Karlický Charles University in Prague, Faculty of Mathematics
JRA-55 Product Users' Handbook
 Climate Prediction Division Global Environment and Marine Department Japan Meteorological Agency September 2013 Change record Version Date Remarks 1.0 30 September 2013 First version 2.0 3 March 2014 Corrected
Impacts of Climate Change on Autumn North Atlantic Wave Climate
 Impacts of Climate Change on Autumn North Atlantic Wave Climate Will Perrie, Lanli Guo, Zhenxia Long, Bash Toulany Fisheries and Oceans Canada, Bedford Institute of Oceanography, Dartmouth, NS Abstract
Improving projections of rainfall trends through regional climate modeling and wide-ranging assessment
 19th International Congress on Modelling and Simulation, Perth, Australia, 12 16 December 2011 http://mssanz.org.au/modsim2011 Improving projections of rainfall trends through regional climate modeling
High resolution rainfall projections for the Greater Sydney Region
 20th International Congress on Modelling and Simulation, Adelaide, Australia, 1 6 December 2013 www.mssanz.org.au/modsim2013 High resolution rainfall projections for the Greater Sydney Region F. Ji a,