RAPPORT LNR Wave exposure calculations for the Finnish coast
|
|
|
- Hugo Evan Rogers
- 5 years ago
- Views:
Transcription

1 RAPPORT LNR Wave exposure calculations for the Finnish coast
2
3
4 Wave exposure calculations for the Finnish coast Performed by NIVA at the request of Finnish Environment Institute, SYKE
5
6 Preface Habitat modelling has become an important task for management of coastal areas, driven both by national initiatives and EU. Wave exposure is one of the major factors that structure the littoral environment and is therefore an important input layer in such GIS models. The aim of this project was to produce wave exposure grids useful for habitat modelling along the Finnish coast. The grids are also useful for scientific activities such as marine biological studies on the coastal and communities. Oslo, Martin Isæus Project leader
7
8 Content Summary 5 1. Intruduction The Simplified Wave Model (SWM) 6 2. Methods and materials Land/Sea grids Comparison of shoreline maps Division of the coast into calculation areas Wind data Fetch calculations Wave exposure calculations Merging wave exposure grids Discussion References Appendix 1. Wave exposure grids 15
9
10 Summary Wave exposure is one of the major factors structuring the coastal environment, and is an important parameter in both coastal research and management. The aim of this project was to construct wave exposure grids covering the entire Finnish coast using the method SWM (Isæus 2004). A nested-grids technique was used to ensure long distance effects on the local wave exposure regime, and the resulting grids have a resolution of 25 m. The methods used and described in this report includes: evaluation of shoreline source map, division of shoreline into suitable calculation areas, converting shape features into grids, recalculation of wind data, calculation of fetch adjusted for refraction/diffraction effects, calculation of wave exposure grids, and merging the separate grids into a seamless description of wave exposure along the Finnish coast. The digital version of the grids was delivered to SYKE June , and a printed version is found in Appendix 1. 5
11 1. Introduction Geographic Information systems (GIS) have become an important tool for management as well as for research. This development has raised a demand for maps or models describing the environment to be used as input layers for the GIS analyses. Wave exposure is one of the major factors structuring the coastal environment, and the aim of this project was to construct wave exposure grids covering the entire Finnish coast. 1.1 The Simplified Wave Model (SWM) Wave exposure can be estimated in many ways and the method chosen for this project was the Simplified Wave Model (SWM), calculated with the software WaveImpact 1.0, which is fully described in the thesis by Isæus (2004). The method is called simplified since it uses the shoreline and not the bathymetry as input for describing the coastal shape. This is an adoption to the fact that bathymetry data is often poor, or restricted, and is therefore usually not available for larger areas such as a state coastline. The method has been tested successfully in Stockholm archipelago, which resembles Finnish archipelagos. SWM has also been compared to three other methods (FWM, STWAVE, Norsk Standard) and was found to be most ecologically relevant (Bekkby in prep.). SWM has been used for wave exposure calculations of the whole Swedish and Norwegian coasts, and the values should be comparable between the coasts. The extended use of the same method for describing the physical environment facilitates the implementation of common classification systems, such as EUNIS. 2. Methods and materials 2.1 Land/Sea grids Comparison of shoreline maps In order to find the most detailed and accurate shoreline for the wave exposure calculations a comparison was made between the three digital maps that were provided by SYKE. Comparisons were made in area 23 (the Vaasa region) by observing details of the shoreline, occurrence of small islands and manmade constructions. The available map files for area 23 where: Meri_Ranta20_Sea one polygon of all sea water in 1: scale Ranta_23m National Land Survey of Finland, separate water polygons 1: V23, National Land Survey of Finland Topographic database; Shoreline water polygons 1:5000 1: The Meri_Ranta20_Sea and Ranta_23m had identical shoreline in the area. Then Ranta_23m was excluded since it is more practical to work with one file such as Meri_Ranta20_Sea. 6
12 V23 contained much more manmade constructions such as wave breakers and harbour constructions than Meri_Ranta20_Sea. The coastline of V23 was generally more detailed than Meri_Ranta20_Sea but some small islands were missing compared to Meri_Ranta20_Sea, and island were often aggregated in V23 that was drawn separate in Meri_Ranta20_Sea. There were also some islands in Meri_Ranta20_Sea that were not present in V23. The shorelines differ significantly and it was not obvious which one is most accurate even though V23 was more detailed. However, the V23 should be more accurate since it is produced in a finer scale (1:5000 1:10 000), and since it also was more detailed and contained more manmade constructions it was chosen for the high resolution grids used in this project (25 and 100 m cellsize, see below for details). For the overview of the whole Baltic Sea region, a freeware map admin.shp delivered together with ESRI software was used. This map file was transformed to Finnish Zone 3 projected coordinate system and used to create the coarse 500 m input grid (see below for detailes) Division of the coast into calculation areas In order to include large areas in the model, but still deliver high resolution grids SWM uses a nested-grids technique. In this case a coarse grid (500 m cellsize) covering the whole Baltic Sea was used to support finer grids (100 m cellsize) with input fetch values, and the 100 m grids provides input values for the final 25 m grids. The extent of the 25 m grids was set to fulfil the criteria: 1. together cover the whole coastline with overlap 2. include coastline features that affect the fetch locally 3. a manageable size, set by computation capacity 4. if possible connected to administrative borders. This resulted in 10 grids (red rectangles in Figure 1). The grids were named after the input shoreline files. Then 10 coarser grids (100 m cell size) were created with an extent large enough to include each 25 m grid together with surrounding coastline features of importance to fetch calculations. These grids were never limited by computation capacity (blue rectangles in Figure 1). The extent of the coarse 500 m grid was set to include all land shapes that possibly could affect the fetch measured form the Finnish coast. Since this grid was not limited by computation capacity it was created to include most of the Baltic Sea (green rectangle in Figure 1). 7


13 Figure 1. The extent of grids used for nested wave exposure calculations. Green rectangle marks the grid with 500 m resolution, blue rectangles mark 100 m grids, and red rectangles are 25 m grids. Figure 2. The extent and names of the resulting wave exposure grids. The grids resolution is 25 m. 8
14 2.2 Wind data Wind stations For each 25 m grid a wind station was chosen (Table 1). The criteria for the choice of wind stations were: 1. positioned in the grid area 2. openly located in the outer shore or off-shore area 3. measurements available for a period of at least 10 years. Table 1. Wind stations with positions, elevation above sea level for wind speed measurments and start date fore measurements, and the grid it is associated with. * The elevation is estimated. WMO LPNN Station name Lat Long Zone3 Y Zone3 X Elevation Start date Grid Hailuoto Marjaniemi Nahkiainen * Pietarsaari Kallan Strömmingsbådan Kristiinankaupunki Karhusaar Rauma Kylmäpihlaja Märket L (north) Lemland Nyhamn L(south) Korppoo Utö M Kirkkonummi Mäkiluoto O Pernaja Orrengrund P All wind speed measurements were recalculated to represent the wind speed at 10 m above sea level by using the formula: Formula 1. U 10 = U z 10 1/ 7 z Where U 10 is the wind speed at 10 m above sea level, U z is the measured wind speed, and z is the elevation above sea level for wind speed measurements (Coastal engineering manual 2003). The wind data from the Finnish Meteorological institute were given for each 10. For this project wind data for 16 directions (N, NNE, NE, ENE etc.) were needed, each representing a sector of The mean of all available wind speed measurements from each sector was calculated. The wind data from adjacent stations were compared to avoid unreasonable large differences. One station (2873_5310 Hailuoto Marjaniemi, grid 26) was situated at the west coast of a large island and therefore sheltered from east, and there were no replacement station available. The mean wind values for easterly winds (NNE, NE, ENE, E, ESE, SE, SSE) were therefore raised by 1.00 m/s. 9
. 2993_14 Märket 2980_3 Lemland Nuhamn Figure 3. Data from different wind stations were used for the north and south part of area 19L Åland.")
15 For grid 19L, Åland, the wind regime was expected to be different at the north side compared to the south side of the archipelago, and therefore station 2993_14 Märket was used for the northern part and 2980_3 Lemland Nyhamn for the southern part (Figure 3). 2993_14 Märket 2980_3 Lemland Nuhamn Figure 3. Data from different wind stations were used for the north and south part of area 19L Åland. 2.3 Fetch calculations The wave exposure estimate was computed in a geographic information system (GIS), and a special software, WaveImpact 1.0, has been developed for this purpose. Grids with only two classes, Land and Sea, were used for the calculations. WaveImpact uses ASCII grids (text files) of the format that can be exported and imported into the GIS software ArcView 3.x and 9.0. The wave exposure values were based on fetch, i.e. the distance of open water at which the wind can act upon the sea and waves can develop. The fetch was calculated for every sea grid cell of the map, in 16 directions, which resulted in 16 maps. Basically this was done by starting at the map edge and increasing the grid cell values by the value of one cell size (in meters) for each sea grid cell in the propagation direction until land was reached, and then starting over again from zero if there were more sea cells on the other side of the land cells (Fig 1a). An advantage of using a grid solution is that the cell values of adjacent cells can be used as input data, which was used for simulating the patterns of refraction and diffraction in this study. This is illustrated by an example for southerly wind (Fig 1b-c). Instead of adding the cell size to the cell value behind (the southern side in this example), the cells behind-to-the-right and behind-to-the-left were used (Formula 1, Fig 1b). When the adjacent grid cell on the left side of the current grid cell was Land then only cell values from behind and from behind-to-the-right were used and vice versa (Fig. 1c). 10
 (i+1, J+1) (i+1, J+2) Figure 4. Example of calculation of fetch values, direction from south. a) The basic principle of increasing fetch values by increasing the cell size 10 m.")
16 a) b) c) Island Island Island (i, J) (i+1, J) (i+1, J+1) (i, J) (i+1, J-2) (i+1, J-1) (i+1, J+1) (i+1, J+2) Figure 4. Example of calculation of fetch values, direction from south. a) The basic principle of increasing fetch values by increasing the cell size 10 m. b) Values from adjacent cells to the side of the source cell were used to simulate refraction/diffraction patterns, c) Calculations when an island limited the use of values from adjacent cells. This method results in a pattern where the fetch values are evened out to the sides, and around island and skerries in a similar way that refraction and diffraction make waves deflect around islands. Aerial photographs of wave crests deflected around islands were used to coarsely calibrate the simulation of refraction/diffraction during construction of the method, Figure 5. Aerial photographs of wave crests (black lines) were used to calibrate the refraction/diffraction simulation during construction of SWM. The formula used for calculating a southerly wind/wave direction (corresponding to Figure 4), when no land pixels obstructed, was: Formula 2. OutputMatris(i, J) = OutputMatris(i + 1, J - 1) * (0.5 - Ref) + OutputMatris(i + 1, J + 1) * (0.5 - Ref) + OutputMatris(i + 1, J - 2) * Ref + OutputMatris(i + 1, J + 2) * Ref + Cellsize where OutputMatris(i, J) is the current cell position in the grid, i is increased downwards (southwards) in the grid relative to the current position, J is increased to the right (eastwards) in 11
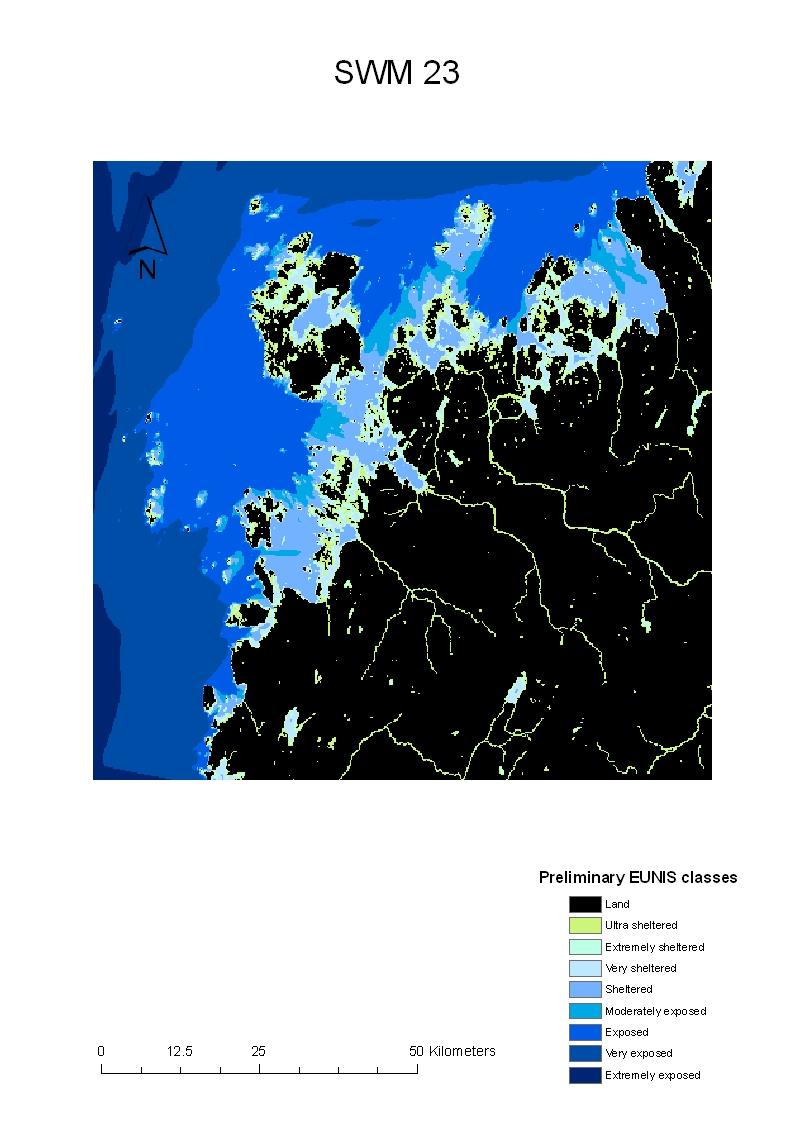
17 the same way, Ref is the calibration value of the refraction/diffraction effect (set to 0.35), and Cellsize is the cell size in meters. When there was a land pixel on the left (western) side the following formula was used: Formula 3. OutputMatris(i, J) = OutputMatris(i + 1, J) * (0.5 - Ref) + OutputMatris(i + 1, J + 1) * (0.5 + Ref) + Cellsize Corresponding formulas were used for land obstacles to the right (east), and for all 16 directions. 2.4 Wave exposure calculations For each wind direction and corresponding fetch grid the adjusted fetch values of each gridcell was multiplied by the mean wind speed which resulted in 16 new grids. The mean value of all 16 grids was calculated in an overlay analysis. This could be summarized in the formula: Formula 4. E SWM 16 ( F 16 * W ) i i = 1 = i where E SWM is the wave exposure value, F i is the adjusted fetch value of direction i, and W i is the mean wind speed of direction i. This was repeated for each of the 10 sub areas (red rectangles figure 25 m grids) along the Finnish coast. The quality of the resulting wave exposure grids was controlled by comparing them with adjacent grids and with grids along the Swedish coast. 2.5 Merging wave exposure grids The separate wave exposure grids are calculated from different wind data, which leads to somewhat different wave exposure values in areas where the grids overlap. To avoid two different wave exposure values in cells of overlapping grids, and to level out the differences between adjacent grids, the grids were merged and then clipped again. The grids were merged using the script Spatial.GridMosaic (ESRI 1998), which creates a seamless grid and smooth transition in overlapping areas. The merged grid was then clipped into 10 grids again to get grids of manageable sizes. Figur 6 shows an overview of all wave exposure grids along the Norwegian coast. The colours indicate preliminary EUNIS classes according to the legend. The 10 separate grids are delivered digitally to SYKE, and shown in Appendix 1. 12

18 Figur 6. An overview of the Finnish coast showing the resulting 10 wave exposure grids. The colors indicate preliminary EUNIS classes according to the legend 13
19 3. Discussion The resolution 25 m gridcell size was a compromise between the need for high resolution and manageable amounts of data. However, in an recent study by the Swedish National Board of Fishery on the effects of scale on wave exposure values calculated with the same method as in this study (WaveImpact, method SWM) it was concluded that 25 m resolution differed only little from finer resolution, but 50 m and coarser differed significantly (Göran Sundblad, pers. com.). The 25 m resolution seems then to bee an acceptable compromise even though studies of the most narrow bays might need a higher resolution. 4. References Bekkby, T., M. Isæus, K.M. Norderhaug, E. Rinde, P. Stenström (in prep.), Sammenligning exponeringsmodeller HAMOD Coastal Engineering Manual 2003 Environmental Systems Research Institute, Inc. (ESRI), last modified , script name Spatial.GridMosaic, downloaded from Isæus, M Factors structuring Fucus communities at open and complex coastlines in the Baltic Sea, Dept. of Botany, Stockholm University, Sweden, ISBN , p40. 14

20 5. Appendix 1. Wave exposure grids 15
21 16

22 17
23 18

24 19
25 20

26 21
27 22

28 23
29 24
FINMARINET: Inventories and Planning for the Marine Natura 2000 Network in Finland. A.2 Geological inventories of the seafloor Final Report
 LIFE07 NAT/FIN/000151 FINMARINET: Inventories and Planning for the Marine Natura 2000 Network in Finland A.2 Geological inventories of the seafloor Final Report Geological Survey of Finland, GTK 1. Introduction
TASMANIAN SEAGRASS COMMUNITIES
 TASMANIAN SEAGRASS COMMUNITIES by Christopher Grant Rees, B.Ed (}Ions.) Submitted in partial fulfilment of the requirement for the degree of Master of Environmental Studies (By Coursework) Centre for Environmental
Hydroacoustic survey and bathymetric map creation for Brant Lake, New York
 Hydroacoustic survey and bathymetric map creation for Brant Lake, New York Holly A. Waterfield CLM 1 INTRODUCTION Brant Lake is located in Warren County, New York, within the bounds of the Adirondack Park.
Predicted herring (Clupea harengus) spawning grounds on the Lithuanian coast
 spawning grounds on the Lithuanian coast") Predicted herring (Clupea harengus) spawning grounds on the Lithuanian coast Johan Näslund 1, Tomas Didrikas 1,2 and Aleksej Šaškov 2 1 AquaBiota Water Research 2 Coastal Research and Planning Institute,
Predicted herring (Clupea harengus) spawning grounds on the Lithuanian coast Johan Näslund 1, Tomas Didrikas 1,2 and Aleksej Šaškov 2 1 AquaBiota Water Research 2 Coastal Research and Planning Institute,
Technical Report No. 5 PREDICTED HERRING (CLUPEA HARENGUS) SPAWNING GROUNDS IN THE LITHUANIAN COASTAL WATERS
 SPAWNING GROUNDS IN THE LITHUANIAN COASTAL WATERS") Norwegian Financial Mechanism and Republic of Lithuania Coastal Research and Planning Institute, Klaipėda University Project: A system for the sustainable management of Lithuanian marine resources using
Norwegian Financial Mechanism and Republic of Lithuania Coastal Research and Planning Institute, Klaipėda University Project: A system for the sustainable management of Lithuanian marine resources using
Combatting nutrient spillage in the Archipelago Sea a model system for coastal management support
 Combatting nutrient spillage in the Archipelago Sea a model system for coastal management support H. Lauri% H. Ylinen*, J. Koponen*, H. Helminen* & P. Laihonen* ' Environmental Impact Assessment Centre
Additional information (material for interactions and analysis chapter) to document 3/1, the PLAN BOTHNIA MSP Assessment
 to document 3/1, the PLAN BOTHNIA MSP Assessment") Co-Financed Under European Integrated Maritime Policy PLAN BOTHNIA MSP 2/2011 MSP Assessment Add 1 PLAN BOTHNIA MSP 2 Uppsala, Sweden June 14-15 2011 Agenda Item 3 PLAN BOTHNIA MSP Assessment Document
Co-Financed Under European Integrated Maritime Policy PLAN BOTHNIA MSP 2/2011 MSP Assessment Add 1 PLAN BOTHNIA MSP 2 Uppsala, Sweden June 14-15 2011 Agenda Item 3 PLAN BOTHNIA MSP Assessment Document
NR402 GIS Applications in Natural Resources
 NR402 GIS Applications in Natural Resources Lesson 1 Introduction to GIS Eva Strand, University of Idaho Map of the Pacific Northwest from http://www.or.blm.gov/gis/ Welcome to NR402 GIS Applications in
Transactions on Information and Communications Technologies vol 18, 1998 WIT Press, ISSN
 STREAM, spatial tools for river basins, environment and analysis of management options Menno Schepel Resource Analysis, Zuiderstraat 110, 2611 SJDelft, the Netherlands; e-mail: menno.schepel@resource.nl
Welcome to NR502 GIS Applications in Natural Resources. You can take this course for 1 or 2 credits. There is also an option for 3 credits.
 Welcome to NR502 GIS Applications in Natural Resources. You can take this course for 1 or 2 credits. There is also an option for 3 credits. The 1st credit consists of a series of readings, demonstration,
REPORT TO THE PLANNING, TRANSPORTATION AND PROTECTIVE SERVICES COMMITTEE MEETING OF JUNE 26, 2013
 PPS/PS 2013-07 REPORT TO THE PLANNING, TRANSPORTATION AND PROTECTIVE SERVICES COMMITTEE MEETING OF JUNE 26, 2013 SUBJECT UPDATES TO THE CAPITAL REGIONAL DISTRICT MODELLING OF POTENTIAL TSUNAMI INUNDATION
Coastal Inlets Research Program US Army Corps of Engineers Engineering Research and Development Center
 Coastal Inlets Research Program US Army Corps of Engineers Engineering Research and Development Center Site of Moriches Inlet Nov. 1951 Julie Dean Rosati and Nicholas C. Kraus, CIRP Program Manager Shinnecock
Lecture 6 - Raster Data Model & GIS File Organization
 Lecture 6 - Raster Data Model & GIS File Organization I. Overview of Raster Data Model Raster data models define objects in a fixed manner see Figure 1. Each grid cell has fixed size (resolution). The
Lab 1: Importing Data, Rectification, Datums, Projections, and Output (Mapping)
") Lab 1: Importing Data, Rectification, Datums, Projections, and Output (Mapping) Topics covered in this lab: i. Importing spatial data to TAS ii. Rectification iii. Conversion from latitude/longitude to
Lab 1: Importing Data, Rectification, Datums, Projections, and Output (Mapping) Topics covered in this lab: i. Importing spatial data to TAS ii. Rectification iii. Conversion from latitude/longitude to
4. Regions Northland Region Distant Eastern source: South America (Chile/Peru)
") 4. Regions Maximum water surface elevation images are presented below for tsunamis generated from the sources discussed above; Distant Eastern source: South America (Chile/Peru), Regional Eastern source:
4. Regions Maximum water surface elevation images are presented below for tsunamis generated from the sources discussed above; Distant Eastern source: South America (Chile/Peru), Regional Eastern source:
GROUND WATER/SURFACE WATER INTERACTIONS 1-3 AWRA SUMMER SPECIALTP CONFERENCE USING GIs TO MAP THE DEPTH TO SEDIMENT IN A POND
 JULY.. GROUND WATER/SURFACE WATER INTERACTIONS 1-3 AWRA SUMMER SPECIALTP CONFERENCE 2002 USING GIs TO MAP THE DEPTH TO SEDIMENT IN A POND Frank P. Beck, Jr.', Patrick J. Clark2, Robert Ford' and Victor
Country Fiche Sweden.
 Country Fiche Sweden 1. General information the territorial sea (12- nm zone) 70,000 km2 the Exclusive Economic Zone 60,000 km2 the EEZ is limited to the central line between adjacent states because the
Nature and Nurture of the Northern Baltic Sea. Velmu-seminar Sonja Jaari
 Nature and Nurture of the Northern Baltic Sea Velmu-seminar 15.4.2010 Sonja Jaari Sonja.Jaari@novia.fi Background The Northern Baltic is a shallow nutrient rich area made up of a mosaique of islands and
GIS CONCEPTS ARCGIS METHODS AND. 3 rd Edition, July David M. Theobald, Ph.D. Warner College of Natural Resources Colorado State University
 GIS CONCEPTS AND ARCGIS METHODS 3 rd Edition, July 2007 David M. Theobald, Ph.D. Warner College of Natural Resources Colorado State University Copyright Copyright 2007 by David M. Theobald. All rights
Integrated Hydrodynamic Modeling System
 Integrated Hydrodynamic Modeling System Applied Science Associates, Inc. 70 Dean Knauss Drive Narragansett, RI USA 02882 www.asascience.com support@asascience.com 1 Introduction HYDROMAP is a globally
Geographical Information Systems
 Geographical Information Systems Geographical Information Systems (GIS) is a relatively new technology that is now prominent in the ecological sciences. This tool allows users to map geographic features
The Use of Geographic Information Systems to Assess Change in Salt Marsh Ecosystems Under Rising Sea Level Scenarios.
 The Use of Geographic Information Systems to Assess Change in Salt Marsh Ecosystems Under Rising Sea Level Scenarios Robert Hancock The ecological challenges presented by global climate change are vast,
Title of Paper: Computational grid generation modeling transport of pathogens in Lake Michigan
 Title of Paper: Computational grid generation modeling transport of pathogens in Lake Michigan Authors Names: Peter N. Shedivy, Hector Bravo PhD Abstract: An estimated 1.2 million people, mostly young
Coastal regions: People living along the coastline and integration of NUTS 2010 and latest population grid
 Statistics in focus (SIF-SE background article) Authors: Andries ENGELBERT, Isabelle COLLET Coastal regions: People living along the coastline and integration of NUTS 2010 and latest population grid Among
Flood protection structure detection with Lidar: examples on French Mediterranean rivers and coastal areas
 Flood protection structure detection with Lidar: examples on French Mediterranean rivers and coastal areas Céline Trmal 1,a, Frédéric Pons 1 and Patrick Ledoux 1 1 Cerema, Direction Territoriale Méditerranée,
Calculating the Natura 2000 network area in Europe: The GIS approach
 Calculating the Natura 2000 network area in Europe: The GIS approach 1. INTRODUCTION A precise area calculation is needed to check to what extent member states have designated Natura 2000 sites of their
A new fauna intercalibration typology
 A new fauna intercalibration typology WFD Intercalibration - 2nd phase - Baltic GIG Auftraggeber: Landesamt für Natur und Umwelt Schleswig-Holstein Hamburger Chaussee 25 24220 Flintbe Author: Torsten Berg
Cooperation for ecosystem based planning of the marine environment using GIS Project leader: Jens Perus
 Cooperation for ecosystem based planning of the marine environment using GIS http://seagis.org Project leader: Jens Perus Projectperiod june 2011-oct 2014 Budget: 1 M Aim of SeaGIS The overarching aim
Lab 1: Importing Data, Rectification, Datums, Projections, and Coordinate Systems
 Lab 1: Importing Data, Rectification, Datums, Projections, and Coordinate Systems Topics covered in this lab: i. Importing spatial data to TAS ii. Rectification iii. Conversion from latitude/longitude
Analysis on Factors of Summer Temperature Distribution in the Basin City
 Analysis on Factors of Summer Temperature Distribution in the Basin City SHOHEI NOGUCHI 1, TAKAHIRO TANAKA 2, SATORU SADOHARA 3 1 Graduate School of Engineering, Hiroshima University, Higashihiroshima,
Country Fiche Sweden Updated May 2018
 Country Fiche Sweden Updated May 2018 1. General information 2 the territorial sea (12-nm zone) 70,000 km2 the Exclusive Economic Zone 60,000 km2 the EEZ is limited to the central line between adjacent
Digital Cartography in the Royal Library - the National Library of Sweden
 LIBER QUARTERLY, ISSN 1435-5205 LIBER 1999. All rights reserved K.G. Saur, Munich. Printed in Germany Digital Cartography in the Royal Library - the National Library of Sweden by GÖRAN BÄÄRNHIELM Digital
A Boundary Delineation System for the Bureau of Ocean Energy Management
 A Boundary Delineation System for the Bureau of Ocean Energy Management Doug Vandegraft Chief, Mapping and Boundary Branch BOEM Coastal Geotools - 2015 Outline Introduction BOEM Marine Cadastre Background
NATIONAL REPORT OF ESTONIA
 BSHC 21 th Conference 27-29 Sept 2016 Klaipeda, Lithuania NATIONAL REPORT OF ESTONIA Executive summary This report summarizes the activities of the Estonian Maritime Administration in the field of hydrography
Automated Hydrologic and Hydraulic Modeling of a Hydroelectric System UC1131 July 2012
 Automated Hydrologic and Hydraulic Modeling of a Hydroelectric System UC1131 July 2012 Author: Eok Ngo, Integrated Spatial Solutions, Inc. Contact: engo@issi-gis.com ABSTRACT Balancing the needs of regulatory
Cooperation for ecosystem based planning of the marine. Project leader: Jens Perus. Projectperiod june 2011-oct 2014 Budget: 1 M
 Cooperation for ecosystem based planning of the marine environment using GIS http://seagis.org Project leader: Jens Perus Projectperiod june 2011-oct 2014 Budget: 1 M Aim of SeaGIS The overarching aim
COASTLINE CHANGE MEASUREMENT AND GENERATING RISK MAP FOR THE COAST USING GEOGRAPHIC INFORMATION SYSTEM
 COASTLINE CHANGE MEASUREMENT AND GENERATING RISK MAP FOR THE COAST USING GEOGRAPHIC INFORMATION SYSTEM Presentation by : Durairaju Kumaran Raju, Research Fellow Kanakappan Santosh, Research Engineer Chandrasekar
WP4: COASTAL PROCESSES
 WP4: COASTAL PROCESSES Coordinator: G. EBERHARDS Faculty of Geography and Earth Sciences, University of Latvia Daugavpils, 2008 Goal: The objective of this study is analysis of coastal changes and forecast
Create your own map for tidepooling, beach field trips, boating, camping, kayaking, fishing, and exploring the beaches in Southcentral Alaska.
 Create your own map for tidepooling, beach field trips, boating, camping, kayaking, fishing, and exploring the beaches in Southcentral Alaska. Here s an opportunity to download and customize your own free
The story of sharing environmental data
 The story of sharing environmental data Kallio, Pyhälahti, Harju, Teiniranta, Lahtinen, Finnish Environment Institute SYKE OKFestival, Finnish Open Data, 18. Sep 2012 Contents Call for environmental knowledge
Proposal to Include a Grid Referencing System in S-100
 1 st IHO-HSSC Meeting The Regent Hotel, Singapore, 22-24 October 2009 Paper for consideration by HSSC Proposal to Include a Grid Referencing System in S-100 Submitted by: Executive Summary: Related Documents:
Possibilities of LIDAR in the shallow waters of the Baltic Sea and it s application for habitat modeling
 Possibilities of LIDAR in the shallow waters of the Baltic Sea and it s application for habitat modeling Michael Haldin Natural Heritage Services / Metsähallitus Markku Viitasalo SYKE BACKGROUND LIDAR
7B.4 ASSESSMENT OF THE GROSS U.S. OFFSHORE WIND ENERGY POTENTIAL
 7B.4 ASSESSMENT OF THE GROSS U.S. OFFSHORE WIND ENERGY POTENTIAL Marc Schwartz, Donna Heimiller, Steve Haymes, and Walt Musial National Renewable Energy Laboratory, Golden, Colorado 1. INTRODUCTION Offshore
Display data in a map-like format so that geographic patterns and interrelationships are visible
 Vilmaliz Rodríguez Guzmán M.S. Student, Department of Geology University of Puerto Rico at Mayagüez Remote Sensing and Geographic Information Systems (GIS) Reference: James B. Campbell. Introduction to
Accessibility to urban areas of different sizes
 Working paper/pm 2010:10 Accessibility to urban areas of different sizes - Modelling through indexed accessibility The Swedish Agency for Growth Policy Analysis has developed a tool for measuring and analysing
Surface Circulation in the North Atlantic & off of Southern California: Two Models
 Surface Circulation in the North Atlantic & off of Southern California: Two Models Objective 1. To become familiar with large scale surface circulation patterns in ocean. 2. To be able to predict current
Application and verification of ECMWF products 2017
 Application and verification of ECMWF products 2017 Finnish Meteorological Institute compiled by Weather and Safety Centre with help of several experts 1. Summary of major highlights FMI s forecasts are
Home About Us Articles Press Releases Image Gallery Contact Us Media Kit Free Subscription 10/5/2006 5:56:35 PM
 Home About Us Articles Press Releases Image Gallery Contact Us Media Kit Free Subscription 10/5/2006 5:56:35 PM Industry Resources Industry Directory NASA Links Missions/Launches Calendar Human development
Uta Gjertsen 1 and Günther Haase 2. Norwegian Meteorological Institute, Oslo, Norway
 4.11 RADAR DATA QUALITY THE CHALLENGE OF BEAM BLOCKAGES AND PROPAGATION CHANGES Uta Gjertsen 1 and Günther Haase 2 1 Norwegian Meteorological Institute, Oslo, Norway 2 Swedish Meteorological and Hydrological
Delineation of high landslide risk areas as a result of land cover, slope, and geology in San Mateo County, California
 Delineation of high landslide risk areas as a result of land cover, slope, and geology in San Mateo County, California Introduction Problem Overview This project attempts to delineate the high-risk areas
Integration Activities in Indonesia: The Integration of Land and Marine Spatial Data Sets as Part of Indonesian SDI Development
 Integration Activities in Indonesia: The Integration of Land and Marine Spatial Data Sets as Part of Indonesian SDI Development M. Arief Syafi i National Coordination Agency for Surveys and Mapping (B
Bathymetry Data and Models: Best Practices
 Bathymetry Data and Models: Best Practices Barry Eakins & Lisa Taylor The NOAA National Geophysical Data Center Over 600 data types - from the core of the Earth to the surface of the Sun NGDC Bathymetry
Ufs. No Notices to Mariners, SWEDEN Swedish Maritime Administration.
 Ufs No 482 2014-02-20 Notices to Mariners, SWEDEN Swedish Maritime Administration Editorial office Swedish Maritime Administration Ufs/BALTICO 601 78 NORRKÖPING Sweden tel: 0771 630 605 e-mail: ufs@sjofartsverket.se
USING GIS CARTOGRAPHIC MODELING TO ANALYSIS SPATIAL DISTRIBUTION OF LANDSLIDE SENSITIVE AREAS IN YANGMINGSHAN NATIONAL PARK, TAIWAN
 CO-145 USING GIS CARTOGRAPHIC MODELING TO ANALYSIS SPATIAL DISTRIBUTION OF LANDSLIDE SENSITIVE AREAS IN YANGMINGSHAN NATIONAL PARK, TAIWAN DING Y.C. Chinese Culture University., TAIPEI, TAIWAN, PROVINCE
The MSC Beaufort Wind and Wave Reanalysis
 The MSC Beaufort Wind and Wave Reanalysis Val Swail Environment Canada Vincent Cardone, Brian Callahan, Mike Ferguson, Dan Gummer and Andrew Cox Oceanweather Inc. Cos Cob, CT, USA Introduction: History
Compact guides GISCO. Geographic information system of the Commission
 Compact guides GISCO Geographic information system of the Commission What is GISCO? GISCO, the Geographic Information System of the COmmission, is a permanent service of Eurostat that fulfils the requirements
A Numerical Simulation for Predicting Sea Waves Characteristics and Downtime for Marine and Offshore Structures Installation Operations
 K. Sadeghi, GAU J. Soc. & Appl. Sci., 3(5), 1-12, 2007 A Numerical Simulation for Predicting Sea Waves Characteristics and Downtime for Marine and Offshore Structures Installation Operations Kabir Sadeghi
Popular Mechanics, 1954
 Introduction to GIS Popular Mechanics, 1954 1986 $2,599 1 MB of RAM 2017, $750, 128 GB memory, 2 GB of RAM Computing power has increased exponentially over the past 30 years, Allowing the existence of
WESTERN GRAY WHALE ADVISORY PANEL WGWAP 5/18 5 th Meeting December 2008 ENGLISH. Comparison of shore-based scan counts WGWAP 5/18
 WESTERN GRAY WHALE ADVISORY PANEL WGWAP 5/18 5 th Meeting December 2008 ENGLISH Comparison of shore-based scan counts WGWAP 5/18 Comparison of Shore-Based Scan Counts Background As part of the recommendations
What are the five components of a GIS? A typically GIS consists of five elements: - Hardware, Software, Data, People and Procedures (Work Flows)
") LECTURE 1 - INTRODUCTION TO GIS Section I - GIS versus GPS What is a geographic information system (GIS)? GIS can be defined as a computerized application that combines an interactive map with a database
LECTURE 1 - INTRODUCTION TO GIS Section I - GIS versus GPS What is a geographic information system (GIS)? GIS can be defined as a computerized application that combines an interactive map with a database
LAKE SURVEY REPORT. Fisheries Management. DOW Number: Survey ID Date: 07/31/2017. Lake Identification. Lake Location. Legal Descriptions
 Fisheries Management LAKE SURVEY REPORT Lake Name: Kroon Survey Type: Targeted Survey DOW Number: 13-0013-00 Survey ID Date: 07/31/2017 Lake Identification Alternate Lake Name: N/A Primary Lake Class ID:
Introduction-Overview. Why use a GIS? What can a GIS do? Spatial (coordinate) data model Relational (tabular) data model
 data model Relational (tabular) data model") Introduction-Overview Why use a GIS? What can a GIS do? How does a GIS work? GIS definitions Spatial (coordinate) data model Relational (tabular) data model intro_gis.ppt 1 Why use a GIS? An extension
Introduction-Overview Why use a GIS? What can a GIS do? How does a GIS work? GIS definitions Spatial (coordinate) data model Relational (tabular) data model intro_gis.ppt 1 Why use a GIS? An extension
Regional influence on road slipperiness during winter precipitation events. Marie Eriksson and Sven Lindqvist
 Regional influence on road slipperiness during winter precipitation events Marie Eriksson and Sven Lindqvist Physical Geography, Department of Earth Sciences, Göteborg University Box 460, SE-405 30 Göteborg,
DATA SOURCES AND INPUT IN GIS. By Prof. A. Balasubramanian Centre for Advanced Studies in Earth Science, University of Mysore, Mysore
 DATA SOURCES AND INPUT IN GIS By Prof. A. Balasubramanian Centre for Advanced Studies in Earth Science, University of Mysore, Mysore 1 1. GIS stands for 'Geographic Information System'. It is a computer-based
Coastal Landuse Change Detection Using Remote Sensing Technique: Case Study in Banten Bay, West Java Island, Indonesia
 Kasetsart J. (Nat. Sci.) 39 : 159-164 (2005) Coastal Landuse Change Detection Using Remote Sensing Technique: Case Study in Banten Bay, West Java Island, Indonesia Puvadol Doydee ABSTRACT Various forms
COASTAL FLOODING IMPACT REPORT (100-YEAR RETURN PERIOD EVENT) CORDECO DISCOVERY BAY RESORT & MARINA BO. ESPINAL, AGUADA, P.R.
 CORDECO DISCOVERY BAY RESORT & MARINA BO. ESPINAL, AGUADA, P.R.") COASTAL FLOODING IMPACT REPORT (100-YEAR RETURN PERIOD EVENT) CORDECO DISCOVERY BAY RESORT & MARINA BO. ESPINAL, AGUADA, P.R. submitted to CORDECO NORTHWEST CORP. 2305 LAUREL ST. SAN JUAN, P.R. 00913 by
COASTAL FLOODING IMPACT REPORT (100-YEAR RETURN PERIOD EVENT) CORDECO DISCOVERY BAY RESORT & MARINA BO. ESPINAL, AGUADA, P.R. submitted to CORDECO NORTHWEST CORP. 2305 LAUREL ST. SAN JUAN, P.R. 00913 by
Significant Ecological Marine Area Assessment Sheet
 Significant Ecological arine Area Assessment Sheet Name: Eastern Bay of Island Biogenic Soft Sediment Complex Summary: The semi-sheltered areas between the central islands of the Eastern Bay of Islands
NEW TOOLS TO IMPROVE DESKTOP SURVEYS
 NEW TOOLS TO IMPROVE DESKTOP SURVEYS Pablo Vengoechea (Telemediciones S.A.), Jorge O. García (Telemediciones S.A.), Email: Telemediciones S.A. / Cra. 46 94-17 Bogotá D.C.
GIS CONCEPTS ARCGIS METHODS AND. 2 nd Edition, July David M. Theobald, Ph.D. Natural Resource Ecology Laboratory Colorado State University
 GIS CONCEPTS AND ARCGIS METHODS 2 nd Edition, July 2005 David M. Theobald, Ph.D. Natural Resource Ecology Laboratory Colorado State University Copyright Copyright 2005 by David M. Theobald. All rights
Bathymetry. EMODnet Stakeholder Conference & Sea-basin Workshops February Bathymetry
 EMODnet Stakeholder Conference & Sea-basin Workshops 14-15 February 2017 Arctic checkpoint Belinda Kater On behalf of all Checkpoints http://www.emodnet.eu 1 ? is the study of the "beds" or "floors" of
User Manual for the New Zealand Marine Environment Classification
 User Manual for the New Zealand Marine Environment Classification User Manual for the New Zealand Marine Environment Classification Katie Dey Mark Weatherhead Prepared for Ministry for the Environment
THE DIGITAL TERRAIN MAP LIBRARY: AN EXPLORATIONIST S RESOURCE
 THE DIGITAL TERRAIN MAP LIBRARY: AN EXPLORATIONIST S RESOURCE By I.C.L. Webster, P.J. Desjardins and W.E. Kilby KEYWORDS: digital terrain maps, digital terrain stability maps, surficial geology, GIS, raster
GIS 2010: Coastal Erosion in Mississippi Delta
 1) Introduction Problem overview To what extent do large storm events play in coastal erosion rates, and what is the rate at which coastal erosion is occurring in sediment starved portions of the Mississippi
A Boundary Delineation System for the Bureau of Ocean Energy Management
 A Boundary Delineation System for the Bureau of Ocean Energy Management Doug Vandegraft Chief, Mapping and Boundary Branch BOEM Esri Ocean GIS Forum - 2015 Outline Introduction BOEM Marine Cadastre Background
ISAT: NEMO: Nonpoint Education for Municipal Officials. Impervious Surface Analysis Tool. Nonpoint Education for Municipal Officials
 ISAT: Analysis Tool NOAA Coastal Services Center University of Connecticut NEMO Project NEMO: Nonpoint Education for Municipal Officials Mission: An educational program for local land use officials that
3 SHORELINE CLASSIFICATION METHODOLOGY
 3 SHORELINE CLASSIFICATION METHODOLOGY Introduction The ESI scale, as described in Section 2, categorizes coastal habitats in terms of their susceptibility to spilled oil, taking into consideration a number
ERAD Challenges for precipitation estimation in mountainous regions. Proceedings of ERAD (2002): c Copernicus GmbH 2002
: c Copernicus GmbH 2002") Proceedings of ERAD (2002): 250 254 c Copernicus GmbH 2002 ERAD 2002 Challenges for precipitation estimation in mountainous regions U. Gjertsen and J. I. Dahl Norwegian Meteorological Institute, Research
Proceedings of ERAD (2002): 250 254 c Copernicus GmbH 2002 ERAD 2002 Challenges for precipitation estimation in mountainous regions U. Gjertsen and J. I. Dahl Norwegian Meteorological Institute, Research
Natural Susceptibility to Coastal Erosion: Methodology and Mapping Summary
 Natural Susceptibility to Coastal Erosion: Methodology and Mapping Summary. Introduction The Flood Risk Management (Scotland) Act 2009 (FRM Act) introduced a coordinated and partnership approach to how
ODOR FOOTPRINTS AND THE ODOR FOOTPRINT TOOL
 ODOR FOOTPRINTS AND THE ODOR FOOTPRINT TOOL An Overview Introduction: As animal production has changed and the facilities in which livestock and poultry are raised have grown in size, neighbors of animal
The Integration of Land and Marine Spatial Data Set As Part of Indonesian Spatial Data Infrastructure Development
 UNITED NATIONS E/CONF.97/6/IP. 46 ECONOMIC AND SOCIAL COUNCIL Seventeenth United Nations Regional Cartographic Conference for Asia and the Pacific Bangkok, 18-22 September 2006 Item 7 of the provisional
Effects of Rising Sea Levels on Coral Reef and Mangrove Distributions along the Great Barrier Reef in Australia
 Effects of Rising Sea Levels on Coral Reef and Mangrove Distributions along the Great Barrier Reef in Australia Sarah Barfield Graduate Student Department of Integrative Biology University of Texas, Austin
Sea ice concentration off Dronning Maud Land, Antarctica
 Rapportserie nr. 117 Olga Pavlova and Jan-Gunnar Winther Sea ice concentration off Dronning Maud Land, Antarctica The Norwegian Polar Institute is Norway s main institution for research, monitoring and
Pan-Arctic Digital Elevation Map (Pan-Arctic DEM)
") Memorandum to CAFF Board 07/28/2017 BACKGROUND: Pan-Arctic Digital Elevation Map (Pan-Arctic DEM) ArcticDEM is a National Geospatial-Intelligence Agency (NGA)-National Science Foundation (NSF) publicprivate
Memorandum to CAFF Board 07/28/2017 BACKGROUND: Pan-Arctic Digital Elevation Map (Pan-Arctic DEM) ArcticDEM is a National Geospatial-Intelligence Agency (NGA)-National Science Foundation (NSF) publicprivate
HELSINKI COMMISSION Baltic Marine Environment Protection Commission
 HELSINKI COMMISSION Baltic Marine Environment Protection Commission HELCOM RECOMMENDATION 24/10 Adopted 25 June 2003, having regard to Article 20, Paragraph 1 b) of the 1992 Helsinki Convention IMPLEMENTATION
Bryan F.J. Manly and Andrew Merrill Western EcoSystems Technology Inc. Laramie and Cheyenne, Wyoming. Contents. 1. Introduction...
 Comments on Statistical Aspects of the U.S. Fish and Wildlife Service's Modeling Framework for the Proposed Revision of Critical Habitat for the Northern Spotted Owl. Bryan F.J. Manly and Andrew Merrill
Developed in Consultation with Florida Educators
 Developed in Consultation with Florida Educators Table of Contents Next Generation Sunshine State Standards Correlation Chart... 7 Benchmarks Chapter 1 The Practice of Science...................... 11
Modeling Coastal Change Using GIS Technology
 Emily Scott NRS 509 Final Report December 5, 2013 Modeling Coastal Change Using GIS Technology In the past few decades, coastal communities around the world are being threatened by accelerating rates of
Annual algae communities on Baltic infralittoral coarse sediment
 European Red List of Habitats Marine: Baltic Sea Habitat Group Annual algae communities on Baltic infralittoral coarse sediment Summary This habitat is found in all the Baltic Sea subbasins and is especially
Donald K. Stauble and Bill Birkemeier Coastal and Hydraulics Laboratory US Army Corps of Engineers
 Donald K. Stauble and Bill Birkemeier Coastal and Hydraulics Laboratory US Army Corps of Engineers Define the Problem Navigation Shore Protection Environmental Political So what is the problem? Management
A Study on Residual Flow in the Gulf of Tongking
 Journal of Oceanography, Vol. 56, pp. 59 to 68. 2000 A Study on Residual Flow in the Gulf of Tongking DINH-VAN MANH 1 and TETSUO YANAGI 2 1 Department of Civil and Environmental Engineering, Ehime University,
Who is polluting the Columbia River Gorge?
 Who is polluting the Columbia River Gorge? Final report to the Yakima Nation Prepared by: Dan Jaffe, Ph.D Northwest Air Quality, Inc. 7746 Ravenna Avenue NE Seattle WA 98115 NW_airquality@hotmail.com December
Hydraulic Processes Analysis System (HyPAS)
") Hydraulic Processes Analysis System (HyPAS) by Thad C. Pratt and Daryl S. Cook PURPOSE: This Coastal Engineering Technical Note (CETN) describes a PC-Windows-based system for analyzing, visualizing, and
Hydraulic Processes Analysis System (HyPAS) by Thad C. Pratt and Daryl S. Cook PURPOSE: This Coastal Engineering Technical Note (CETN) describes a PC-Windows-based system for analyzing, visualizing, and
Preliminary Data Release for the Humboldt Bay Sea Level Rise Vulnerability Assessment: Humboldt Bay Sea Level Rise Inundation Mapping
 Preliminary Data Release for the Humboldt Bay Sea Level Rise Vulnerability Assessment: Humboldt Bay Sea Level Rise Inundation Mapping Prepared by: Jeff Anderson, Northern Hydrology & Engineering (jeff@northernhydrology.com)
A Geographic Information System Based Model John L Marshall Geography 562 GIS Coastal Resources - Final Project: Fall 2017 University of Washington
 EFFECTS OF OYSTER CULTURE ON NATIVE EELGRASS AND RELATED NATURAL RESOURCES IN THE PUGET SOUND A Geographic Information System Based Model John L Marshall Geography 562 GIS Coastal Resources - Final Project:
European Commission STUDY ON INTERIM EVALUATION OF EUROPEAN MARINE OBSERVATION AND DATA NETWORK. Executive Summary
 European Commission STUDY ON INTERIM EVALUATION OF EUROPEAN MARINE OBSERVATION AND DATA NETWORK Executive Summary by NILOS Netherlands Institute for the Law of the Sea June 2011 Page ii Study on Interim
GEBCO 2013 TSCOM. EMODNET Hydrography status report
 www.emodnet-hydrography.eu GEBCO 2013 TSCOM EMODNET Hydrography status report Eric Moussat, Ifremer on behalf of the Emodnet consortium 1 Background and objectives EU proposed to take steps in 2008 towards
GROUNDFISH AMENDMENT 28 REGULATION DEVELOPMENT UPDATE
 Agenda Item I.2.a NMFS Report 1 September 2018 GROUNDFISH AMENDMENT 28 REGULATION DEVELOPMENT UPDATE In drafting regulations for the Council s final preferred alternative for Amendment 28, recommended
Operational water balance model for Siilinjärvi mine
 Operational water balance model for Siilinjärvi mine Vesa Kolhinen, Tiia Vento, Juho Jakkila, Markus Huttunen, Marie Korppoo, Bertel Vehviläinen Finnish Environment Institute (SYKE) Freshwater Centre/Watershed
HELCOM-VASAB Maritime Spatial Planning Working Group Twelfth Meeting Gdansk, Poland, February 2016
 HELCOM-VASAB Maritime Spatial Planning Working Group Twelfth Meeting Gdansk, Poland, 24-25 February 2016 Document title HELCOM database for the coastal and marine Baltic Sea protected areas (HELCOM MPAs).
WIND EFFECTS ON CHEMICAL SPILL IN ST ANDREW BAY SYSTEM
 WIND EFFECTS ON CHEMICAL SPILL IN ST ANDREW BAY SYSTEM PETER C. CHU, PATRICE PAULY Naval Postgraduate School, Monterey, CA93943 STEVEN D. HAEGER Naval Oceanographic Office, Stennis Space Center MATHEW