Some Aspects of the 2005 Ozone Season
|
|
|
- Caren Walton
- 5 years ago
- Views:
Transcription
1 Some Aspects of the 2005 Ozone Season William F. Ryan Department of Meteorology The Pennsylvania State University 2005 MARAMA Monitoring Committee Meeting Ocean City, Maryland November 15-17, 2005
2 Three Topics of Interest Was 2005 a typical summer O 3 season? Is it enough to just be hot? Are O 3 concentrations falling in response to regional NO x controls? Is the ground moving under our feet? Improvements in O 3 forecast capability. Now a reliable forecast tool?
3 Philadelphia Mean Daily Peak O 3 80 Mean Daily 8-h Ozone (ppbv) mean is 5 ppbv (~ 8%) lower than the average Year
4 Philadelphia O 3 Concentrations by Color Code Orange 16% Red 5% Orange 10% Red 4% Green 48% Green 53% Yellow 33% Yellow 31% In 2005, less Code Orange and more Code Green
5 Frequency of Code Red Days Philadelphia Code Red Ozone ( ) Year 1994 Number of Days
6 Frequency of Days 85 ppbv Philadelphia Red and Orange ( ) Number of Code Orange or Red days in 2005 is 45% less than Number of Days Year
7 But It Was a Hot Summer..

8 Hot Even by Recent Standards

9 Hot and Dry.Usually Means Bad Air
10 Is Hot Weather Enough for High O 3? Average maximum temperature for Code Red cases in Baltimore ( ) is 93 F For PHL average maximum temperature is also 93 F ( ) Count BWI Hourly Maximum Temperature (F) Proportion per Bar
11 Hot Days Very Frequent in Number of Days >= 90 F
12 Hot Weather is Necessary but not Sufficient for Code Red though usually for Code Orange Only 30% of all cases where maximum temperature reaches or exceeds 90 F reach the Code Red threshold. Count All Cases Code Red Cases Value For PHL ~ 29% of hot days are Code Red but 74% are at least Code Orange. ( ) BWI Maximum Temperature (F)

13 Why Doesn t Hot Weather Always Mean High O 3? Cloud cover, rain and wind associated with convection (thunderstorms). Strong winds alone can be enough to keep O 3 below the Code Red range. Source of the air mass can matter, onshore winds with maritime air mass characteristics are low in O 3 and precursors.

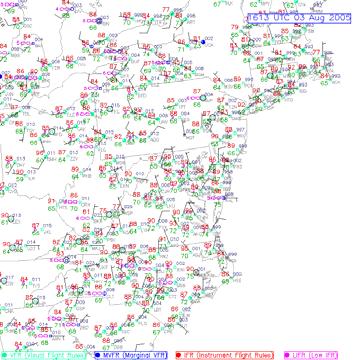
14 No Significant Difference in Transport Pattern Aloft in 2005 HYSPLIT (NOAA/ARL) back trajectory model results. 24-hour back trajectories terminating at 1000 m above ground level at 1200 UTC (0800 am local).
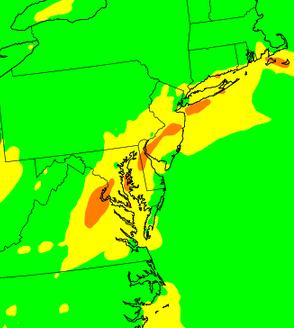
15 But, More Likely to Have Stagnation and Reverse Corridor Flow at Low Levels
16 Very Hot in 2005 but Weaker O 3 Response Number of Days Departure from Normal Temperature (F) Year O3 > 85 Ave T While departure from normal temperature was > 2º F (similar to 1999, ), number of days > 85 ppbv was 40% less frequent
17 Since 2003, the Number of Days 90 ºF Exceed the Number of Days 85 ppbv Number of Days High O3 T > Year

18 Are We Seeing the Impact of the 22 State NO x Rule?
19 Regional NO x Controls and Local O 3 The working scientific hypothesis for O 3 control was: O 3 concentrations are limited by NO x for most of the eastern US excluding urban and nearurban areas. Point source NO x controls will decrease regional-scale (baseline) O 3. A lower baseline concentration would make it less likely for urban area O 3 spikes to exceed the NAAQS standard.
20 Phase in of Regional NO x Controls

21 Expected NO x Reductions are Significant Figure courtesy of DOE:
22 What Predictions from Hypothesis? If baseline O 3 is falling: Should see fewer total Code Red and Code Orange days While urban areas will still have local emissions sufficient for Code Red, should see fewer extreme O 3 cases Urban plume of high O3 should be smaller so that fewer monitors exceed Code Red or Code Orange for any given bad air day. Rural monitors should show lower O 3.
23 Number of Code Orange or Red Days (PHL) Philadelphia Red and Orange ( ) Recall: Number of Code Orange or Red days in 2005 is 45% less than Number of Days Year
24 In MARAMA Region, Number of Monitors Exceeding 85 ppbv Much Reduced Number of Monitors But 2003 and 2004 were not O 3 conducive although 2005 was.
25 And the Number of Monitors Exceeding 85 ppbv per Code Orange (or Red) Day are Lower as Well Monitors/Day Year
26 Total number of extreme O 3 Days (8-hour O ppbv) for all MARAMA states Number of Days > 110 ppbv
27 Mean O 3 and Frequency of High O 3 Days at Shenandoah NP Days > 70 ppbv Mean Ozone (ppbv) >= 70 median
28 Caveats No statistical significance with small data sample containing strong serial correlation. Although 2005 was hot and dry, classical high O 3 patterns not as frequent as and 2004 were low O 3 summer weather-wise.
29 NOAA O 3 Forecast Models: Current Configuration 1X 5X 3X

30 NOAA Forecast Model Assumes Large NO x Reductions

31 Overall Performance of Model Encouraging Figure Courtesy of Rohit Mathur (ARL/NOAA)
32 Analysis of Forecast Skill in PHL Performance in Difficult Cases Was Good Onset of high O 3 episode Termination of high O 3 episode Non-standard high O 3 cases Code Red Cases Large Error Cases Caught by Other Methods Systematic Errors Did Occur Urban core over-prediction High concentrations at sea/land boundary
33 Forecast Accuracy for O 3 Episode Days in PHL (Developmental Model 5X) PHL Domain 8-h Maximum Ozone (ppbv) During High Ozone Episodes (n = 8) Bias MAE Median rms NOAA PHL-FC Stat


34 July 26: Code Red Forecast Verifies But over-prediction in the urban corridor from Wilmington through Philadelphia.


35 July 22: Code Red Forecast Verifies Forecast 1-h Downtown PHL: ppbv observed The opposite problem was found in 2003 (see below).


36 August 12: Missed Code Red Slight Westward Displacement of High O 3 Plume


37 August 4: Missed Code Red Convection in NJ Forecast Convection observed as forecast, no one told northern Delaware though..


38 Non-Standard Case: Low level winds drain from north to south
39 Systematic Errors: Abnormally high O 3 at bay/land interfaces


40 Large Error Case: False Alarm of Code Orange NAM-12 did not forecast cloud cover, statistical models handled case well.


41 Large Error Case: Offshore circulation causes stagnation near I-95
42 Conclusions for NOAA Model Performance in high O 3 episodes very promising: Onset and termination of high O 3 episodes well forecast Code Red cases identified Over-prediction in near-urban environment, adjusted for by post-processing? Large error cases occurred but caught by other forecasting approaches (e.g., statistical models) so didn t impact operational forecasting Problems remain with water surfaces: Atlantic coast and Chesapeake and Delaware Bays
43 Overall Conclusions 2005 was a hot summer and generally conducive to high O 3 although frequency of westerly transport a bit less. Peak O 3 concentrations lower, given the weather, than we would have expected. Suggestion, not proof, of NO x Rule impact. NOAA O 3 Forecast model shows promise but all bets off next year (WRF).
PM 2.5 Forecasting: Preliminary Results
 PM 2.5 Forecasting: Preliminary Results William F. Ryan The Pennsylvania State University Department of Meteorology Joint MARAMA/NESCAUM Air Monitoring Meeting West Atlantic City, NJ 9/6 120 100 80 60
8.1 THE EFFECT OF RECENT REGIONAL EMISSIONS REDUCTIONS ON AIR QUALITY FORECASTING IN THE MID-ATLANTIC
 8.1 THE EFFECT OF RECENT REGIONAL EMISSIONS REDUCTIONS ON AIR QUALITY FORECASTING IN THE MID-ATLANTIC William F. Ryan Jeannine E. Bradbury The Pennsylvania State University, University Park, Pennsylvania
End of Ozone Season Report
 End of Ozone Season Report Central Ohio: April 1 through October 31, 2016 The Mid-Ohio Regional Planning Commission (MORPC) is part of a network of agencies across the country that issues daily air quality
Central Ohio Air Quality End of Season Report. 111 Liberty Street, Suite 100 Columbus, OH Mid-Ohio Regional Planning Commission
 217 218 Central Ohio Air Quality End of Season Report 111 Liberty Street, Suite 1 9189-2834 1 Highest AQI Days 122 Nov. 217 Oct. 218 July 13 Columbus- Maple Canyon Dr. 11 July 14 London 11 May 25 New Albany
Appendix G-5: The Low Level Jet in Maryland: Profiler Observations and Preliminary Climatology
 Appendix G-5: The Low Level Jet in Maryland: Profiler Observations and Preliminary Climatology 1 The Low Level Jet in Maryland: Profiler Observations and Preliminary Climatology Report Prepared for the
Preliminary Experiences with the Multi Model Air Quality Forecasting System for New York State
 Preliminary Experiences with the Multi Model Air Quality Forecasting System for New York State Prakash Doraiswamy 1, Christian Hogrefe 1,2, Winston Hao 2, Brian Colle 3, Mark Beauharnois 1, Ken Demerjian
Recent Performance of the NOAA Air Quality Forecasting Capability and the Impact of Driving Meteorology
 Recent Performance of the NOAA Air Quality Forecasting Capability and the Impact of Driving Meteorology http://www.emc.ncep.noaa.gov/mmb/aq Jeff McQueen, Jianping Huang, Ho-Chun Huang, Perry Shafran NCEP/EMC
1 INTRODUCTION 2 DESCRIPTION OF THE MODELS. In 1989, two models were able to make smog forecasts; the MPA-model and
 The national smog warning system in The Netherlands; a combination of measuring and modelling H. Noordijk Laboratory of Air Research, National Institute of Public Health and Environmental Protection (WFM;,
Heavy Rainfall and Flooding of 23 July 2009 By Richard H. Grumm And Ron Holmes National Weather Service Office State College, PA 16803
 Heavy Rainfall and Flooding of 23 July 2009 By Richard H. Grumm And Ron Holmes National Weather Service Office State College, PA 16803 1. INTRODUCTION Heavy rains fall over Pennsylvania and eastern New
1. INTRODUCTION * Figure 1. National Weather Service Storm Prediction Center (SPC) storm reports for December 1, 2006.
 storm reports for December 1, 2006.") P1.14 FORECAST ISSUES RELATED TO THE UNPRECEDENTED SEVERE AND HIGH WIND EVENT OF DECEMBER 2006 by Greg A. DeVoir* and Richard H. Grumm National Weather Service Office State College, PA 16803 1. INTRODUCTION
P1.14 FORECAST ISSUES RELATED TO THE UNPRECEDENTED SEVERE AND HIGH WIND EVENT OF DECEMBER 2006 by Greg A. DeVoir* and Richard H. Grumm National Weather Service Office State College, PA 16803 1. INTRODUCTION
AREP GAW. Section 14 Daily Air Quality Forecast Operations
 Section 14 Daily Air Quality Forecast Operations Daily Forecast Operations Nine steps to produce an accurate air quality forecast a suggested method 1. 2. 3. 4. 5. 6. 7. 8. 9. Review yesterday s forecast
New Generation Aerosol Satellite Products for Air Quality Mapping and Analysis
 New Generation Aerosol Satellite Products for Air Quality Mapping and Analysis Amy K. Huff Penn State University 2017 MARAMA Air Quality Monitoring Training Workshop November 3, 2017 Satellites Identify
Heavy Rainfall Event of June 2013
 Heavy Rainfall Event of 10-11 June 2013 By Richard H. Grumm National Weather Service State College, PA 1. Overview A 500 hpa short-wave moved over the eastern United States (Fig. 1) brought a surge of
Using Convection-Allowing Models to Produce Forecast Guidance For Severe Thunderstorm Hazards via a Surrogate-Severe Approach!
 Using Convection-Allowing Models to Produce Forecast Guidance For Severe Thunderstorm Hazards via a Surrogate-Severe Approach! Ryan Sobash! University of Oklahoma, School of Meteorology, Norman, OK! J.
Hurricanes. April 14, 2009
 Tropical Weather & Hurricanes Chapter 15 April 14, 2009 Tropical meteorology Tropics characterized by seasonal wet and drier periods- wet when sun is nearly overhead at noon and inter-tropical convergence
UPDATE OF REGIONAL WEATHER AND SMOKE HAZE (September 2017)
") UPDATE OF REGIONAL WEATHER AND SMOKE HAZE (September 2017) 1. Review of Regional Weather Conditions in August 2017 1.1 Southwest Monsoon conditions continued to prevail in the region in August 2017. The
UPDATE OF REGIONAL WEATHER AND SMOKE HAZE (September 2017) 1. Review of Regional Weather Conditions in August 2017 1.1 Southwest Monsoon conditions continued to prevail in the region in August 2017. The
Fronts in November 1998 Storm
 Fronts in November 1998 Storm Much of the significant weather observed in association with extratropical storms tends to be concentrated within narrow bands called frontal zones. Fronts in November 1998
Analysis of PM10 measurements and comparison with model results during 2007 wildfire season
 Analysis of PM10 measurements and comparison with model results during 2007 wildfire season Autori S. Finardi, M. Mircea*, G.Righini* * ENEA/UTVALAMB-AIR Riferimento imento ARIANET R2011.16 May 2011 ARIANET
Fog and Icing Occurrence, and Air Quality Factors. for the Rhode Island Ocean Special Area Management Plan John Merrill
 7. Fog and Icing Occurrence, and Air Quality Factors for the Rhode Island Ocean Special Area Management Plan 2010 by John Merrill University of Rhode Island, June 28, 2010 June 28, 2010 Technical Report
The Weather Wire. Contents: Summer 2018 Outlook. Summer 2018 Outlook Drought Monitor May Summary/Statistics June Preview Rainfall Totals
 The Weather Wire June 2018 Volume 25 Number 6 Contents: Summer 2018 Outlook Drought Monitor May Summary/Statistics June Preview Rainfall Totals Summer 2018 Outlook June 1 st marked the first day of meteorological
NIWA Outlook: October - December 2015
 October December 2015 Issued: 1 October 2015 Hold mouse over links and press ctrl + left click to jump to the information you require: Overview Regional predictions for the next three months: Northland,
Christopher ISU
 Christopher Anderson @ ISU Excessive spring rain will be more frequent (except this year). Will it be more manageable? Christopher J. Anderson, PhD 89th Annual Soil Management and Land Valuation Conference
Ice Age Forcings Imply Global Climate Sensitivity ~ ¾ C per W/m 2. Source: Hansen et al., Natl. Geogr. Res. & Explor., 9, 141, 1993.
 Ice Age Forcings Imply Global Climate Sensitivity ~ ¾ C per W/m 2. Source: Hansen et al., Natl. Geogr. Res. & Explor., 9, 141, 1993. Impact of Climate Change on Air Pollution Presented at the 2008 MARAMA
BIAS-ADJUSTMENT TECHNIQUES FOR IMPROVING OZONE AIR QUALITY FORECASTS. US Environmental Protection Agency, RTP, NC 27711, USA
 BIAS-ADJUSTMENT TECHNIQUES FOR IMPROVING OZONE AIR QUALITY FORECASTS Daiwen Kang* $#, Rohit Mathur +, S. Trivikrama Rao +, and Shaocai Yu $ + Atmospheric Modeling Division, National Exposure Research Laboratory,
Appalachian Lee Troughs and their Association with Severe Thunderstorms
 Appalachian Lee Troughs and their Association with Severe Thunderstorms Daniel B. Thompson, Lance F. Bosart and Daniel Keyser Department of Atmospheric and Environmental Sciences University at Albany/SUNY,
Performance of TANC (Taiwan Auto- Nowcaster) for 2014 Warm-Season Afternoon Thunderstorm
 for 2014 Warm-Season Afternoon Thunderstorm") Performance of TANC (Taiwan Auto- Nowcaster) for 2014 Warm-Season Afternoon Thunderstorm Wei-Peng Huang, Hui-Ling Chang, Yu-Shuang Tang, Chia-Jung Wu, Chia-Rong Chen Meteorological Satellite Center, Central
Performance of TANC (Taiwan Auto- Nowcaster) for 2014 Warm-Season Afternoon Thunderstorm Wei-Peng Huang, Hui-Ling Chang, Yu-Shuang Tang, Chia-Jung Wu, Chia-Rong Chen Meteorological Satellite Center, Central
Determination of Planetary Boundary Layer Heights on Short Spatial and Temporal Scales from Surface and Airborne Vertical Profilers during DISCOVER AQ
 Determination of Planetary Boundary Layer Heights on Short Spatial and Temporal Scales from Surface and Airborne Vertical Profilers during DISCOVER AQ Ruben Delgado 1, Timothy Berkoff 1,9, Jaime S. Compton
ESCI 241 Meteorology Lesson 19 Tropical Cyclones Dr. DeCaria
 ESCI 241 Meteorology Lesson 19 Tropical Cyclones Dr. DeCaria READING: Chapter 16 GENERAL A tropical cyclone is a large, low-pressure system that forms over the tropical oceans. Tropical cyclones are classified
Extracting probabilistic severe weather guidance from convection-allowing model forecasts. Ryan Sobash 4 December 2009 Convection/NWP Seminar Series
 Extracting probabilistic severe weather guidance from convection-allowing model forecasts Ryan Sobash 4 December 2009 Convection/NWP Seminar Series Identification of severe convection in high-resolution
The Pennsylvania Observer
 The Pennsylvania Observer October 1, 2015 September 2015 - Pennsylvania Weather Recap By: Quinn Lease The month of September will be remembered for its above normal temperatures and dry conditions that
KUALA LUMPUR MONSOON ACTIVITY CENT
 T KUALA LUMPUR MONSOON ACTIVITY CENT 2 ALAYSIAN METEOROLOGICAL http://www.met.gov.my DEPARTMENT MINISTRY OF SCIENCE. TECHNOLOGY AND INNOVATIO Introduction Atmospheric and oceanic conditions over the tropical
UPDATE OF REGIONAL WEATHER AND SMOKE HAZE (May 2017)
") UPDATE OF REGIONAL WEATHER AND SMOKE HAZE (May 2017) 1. Review of Regional Weather Conditions in April 2017 1.1 Inter monsoon conditions, characterised by afternoon showers and winds that are generally
UPDATE OF REGIONAL WEATHER AND SMOKE HAZE (May 2017) 1. Review of Regional Weather Conditions in April 2017 1.1 Inter monsoon conditions, characterised by afternoon showers and winds that are generally
Localized Aviation Model Output Statistics Program (LAMP): Improvements to convective forecasts in response to user feedback
: Improvements to convective forecasts in response to user feedback") Localized Aviation Model Output Statistics Program (LAMP): Improvements to convective forecasts in response to user feedback Judy E. Ghirardelli National Weather Service Meteorological Development Laboratory
Localized Aviation Model Output Statistics Program (LAMP): Improvements to convective forecasts in response to user feedback Judy E. Ghirardelli National Weather Service Meteorological Development Laboratory
The climate change penalty on US air quality: New perspectives from statistical models
 The climate change penalty on US air quality: New perspectives from statistical models Charles River Path, Boston, July 2010 Salt Lake City, January 2013 Loretta J. Mickley, Lu Shen, Xu Yue Harvard University
Percentage of normal rainfall for August 2017 Departure from average air temperature for August 2017
 New Zealand Climate Update No 219, August 2017 Current climate August 2017 Overall, mean sea level pressure was lower than normal over and to the west of New Zealand during August while higher than normal
Toward improved initial conditions for NCAR s real-time convection-allowing ensemble. Ryan Sobash, Glen Romine, Craig Schwartz, and Kate Fossell
 Toward improved initial conditions for NCAR s real-time convection-allowing ensemble Ryan Sobash, Glen Romine, Craig Schwartz, and Kate Fossell Storm-scale ensemble design Can an EnKF be used to initialize
Application and verification of the ECMWF products Report 2007
 Application and verification of the ECMWF products Report 2007 National Meteorological Administration Romania 1. Summary of major highlights The medium range forecast activity within the National Meteorological
1. INTRODUCTION. In addition to the severe weather, the
 Anomalous Low and its weather impacts 10-12 May 2008 By Richard Grumm National Weather Service Office State College, PA And Al Cope National Weather Service Office Mount Holly, NJ 1. INTRODUCTION An unusually
FRAPPÉ/DISCOVER-AQ (July/August 2014) in perspective of multi-year ozone analysis
 in perspective of multi-year ozone analysis") FRAPPÉ/DISCOVER-AQ (July/August 2014) in perspective of multi-year ozone analysis Project Report #2: Monitoring network assessment for the City of Fort Collins Prepared by: Lisa Kaser kaser@ucar.edu ph:
FRAPPÉ/DISCOVER-AQ (July/August 2014) in perspective of multi-year ozone analysis Project Report #2: Monitoring network assessment for the City of Fort Collins Prepared by: Lisa Kaser kaser@ucar.edu ph:
Climate Outlook through 2100 South Florida Ecological Services Office Vero Beach, FL January 13, 2015
 Climate Outlook through 2100 South Florida Ecological Services Office Vero Beach, FL January 13, 2015 Short Term Drought Map: Short-term (
CASE STUDY OF THE NOVEMBER WINDSTORM IN SOUTH CENTRAL COLORADO
 32 CASE STUDY OF THE 12-13 NOVEMBER WINDSTORM IN SOUTH CENTRAL COLORADO Paul Wolyn * NOAA/NWS Pueblo, CO 1. INTRODUCTION During the evening and early morning of 12-13 November 2011, a damaging downslope
Denver International Airport MDSS Demonstration Verification Report for the Season
 Denver International Airport MDSS Demonstration Verification Report for the 2015-2016 Season Prepared by the University Corporation for Atmospheric Research Research Applications Division (RAL) Seth Linden
NOAA 2015 Updated Atlantic Hurricane Season Outlook
 NOAA 2015 Updated Atlantic Hurricane Season Outlook Dr. Gerry Bell Lead Seasonal Forecaster Climate Prediction Center/ NOAA/ NWS Collaboration With National Hurricane Center/ NOAA/ NWS Hurricane Research
P2.9 Use of the NOAA ARL HYSPLIT Trajectory Model For the Short Range Prediction of Stratus and Fog
 Ellrod, G. P., 2013: Use of the NOAA ARL HYSPLIT Trajectory Model for the Short Range Prediction of Stratus and Fog. Extended Abstract, 38 th National Weather Association Annual Meeting, Charleston, SC,
Application and verification of ECMWF products 2016
 Application and verification of ECMWF products 2016 Icelandic Meteorological Office (www.vedur.is) Bolli Pálmason and Guðrún Nína Petersen 1. Summary of major highlights Medium range weather forecasts
Average Weather For Coeur d'alene, Idaho, USA
 Average Weather For Coeur d'alene, Idaho, USA Information courtesy of weatherspark.com Location This report describes the typical weather at the Coeur d'alene Air Terminal (Coeur d'alene, Idaho, United
NOAA s National Weather Service Philadelphia/Mt. Holly NJ. Summary. Changes
 Summary A crippling and potentially historic east coast snow storm will lead to blizzard conditions and major coastal flooding for portions of the area this weekend. Changes Blizzard Warning has been expanded
3.4 METEOROLOGICAL CONDITIONS ASSOCIATED WITH THE RAPID TRANSPORT OF CANADIAN WILDFIRE PRODUCTS INTO THE NORTHEAST DURING 5-8 JULY 2002
 3.4 METEOROLOGICAL CONDITIONS ASSOCIATED WITH THE RAPID TRANSPORT OF CANADIAN WILDFIRE PRODUCTS INTO THE NORTHEAST DURING 5-8 JULY 2002 1. INTRODUCTION John R. Scala *, Christopher Hain, and Wayne M. MacKenzie,
Hurricanes and Tropical Weather Systems:
 Hurricanes and Tropical Weather Systems: An influence on weather in parts of the USA Meteorology 411 Iowa State University Week 2 Bill Gallus Classification/Terminology Tropical Disturbance enhanced convection
Forecasting Extreme Events
 Forecasting Extreme Events Ivan Tsonevsky, ivan.tsonevsky@ecmwf.int Slide 1 Outline Introduction How can we define what is extreme? - Model climate (M-climate); The Extreme Forecast Index (EFI) Use and
Climate Outlook and Review
 Climate Outlook and Review September 2018 Author: Prof Roger C Stone Overview The European, UK, and US long-term climate models that focus on forecasting central Pacific sea surface temperatures are continuing
1. What type of wind is needed for a hurricane to form? Low to medium winds, blowing in the same direction (weak wind shear).
.") Explain 1. What type of wind is needed for a hurricane to form? Low to medium winds, blowing in the same direction (weak wind shear). 2. What is wind shear? Any change in wind speed or direction. When
Explain 1. What type of wind is needed for a hurricane to form? Low to medium winds, blowing in the same direction (weak wind shear). 2. What is wind shear? Any change in wind speed or direction. When
PRELIMINARY EXPERIENCES WITH THE MULTI-MODEL AIR QUALITY FORECASTING SYSTEM FOR NEW YORK STATE
 PRELIMINARY EXPERIENCES WITH THE MULTI-MODEL AIR QUALITY FORECASTING SYSTEM FOR NEW YORK STATE Prakash Doraiswamy 1,,*, Christian Hogrefe 1,2, Winston Hao 2, Brian Colle 3, Mark Beauharnois 1, Ken Demerjian
Combining Deterministic and Probabilistic Methods to Produce Gridded Climatologies
 Combining Deterministic and Probabilistic Methods to Produce Gridded Climatologies Michael Squires Alan McNab National Climatic Data Center (NCDC - NOAA) Asheville, NC Abstract There are nearly 8,000 sites
Conceptual Model for Ozone in the Austin-Round Rock Metropolitan Statistical Area
 CAPCOG FY14-15 PGA FY14-1 Deliverable 5.1.2 Amendment 1 Conceptual Model for Ozone in the Austin-Round Rock Metropolitan Statistical Area Prepared by the Capital Area Council of Governments October 8,
Application and verification of ECMWF products: 2010
 Application and verification of ECMWF products: 2010 Hellenic National Meteorological Service (HNMS) F. Gofa, D. Tzeferi and T. Charantonis 1. Summary of major highlights In order to determine the quality
UPDATE OF REGIONAL WEATHER AND SMOKE HAZE (December 2017)
") UPDATE OF REGIONAL WEATHER AND SMOKE HAZE (December 2017) 1. Review of Regional Weather Conditions for November 2017 1.1 In November 2017, Southeast Asia experienced inter-monsoon conditions in the first
UPDATE OF REGIONAL WEATHER AND SMOKE HAZE (December 2017) 1. Review of Regional Weather Conditions for November 2017 1.1 In November 2017, Southeast Asia experienced inter-monsoon conditions in the first
Weather Briefing Mixed Winter Storm Event February 26-27, 2013
 Weather Briefing Mixed Winter Storm Event February 26-27, 2013 Prepared 1200 PM EST Tuesday, February 26th, 2013 Joe Miketta NOAA s NJ Forecast Office http://www.erh.noaa.gov/phi/ Purpose of Briefing Briefing
Application and verification of ECMWF products 2014
 Application and verification of ECMWF products 2014 Israel Meteorological Service (IMS), 1. Summary of major highlights ECMWF deterministic runs are used to issue most of the operational forecasts at IMS.
Type of storm viewed by Spotter A Ordinary, multi-cell thunderstorm. Type of storm viewed by Spotter B Supecell thunderstorm
 ANSWER KEY Part I: Locating Geographical Features 1. The National Weather Service s Storm Prediction Center (www.spc.noaa.gov) has issued a tornado watch on a warm spring day. The watch covers a large
ENSO Cycle: Recent Evolution, Current Status and Predictions. Update prepared by Climate Prediction Center / NCEP 25 February 2013
 ENSO Cycle: Recent Evolution, Current Status and Predictions Update prepared by Climate Prediction Center / NCEP 25 February 2013 Outline Overview Recent Evolution and Current Conditions Oceanic Niño Index
Application and verification of ECMWF products in Norway 2008
 Application and verification of ECMWF products in Norway 2008 The Norwegian Meteorological Institute 1. Summary of major highlights The ECMWF products are widely used by forecasters to make forecasts for
 Contributors: Arlene Fiore 1, Lee Murray 1, Luke Valin 1, Olivia Clifton 1, Jean Guo 1 Author: Melissa Seto 1 Analysis of Wisconsin 2007 High-Ozone event Section 1A: Can satellite NO 2 columns inform us
Heavy rains and precipitable water anomalies August 2010 By Richard H. Grumm And Jason Krekeler National Weather Service State College, PA 16803
 Heavy rains and precipitable water anomalies 17-19 August 2010 By Richard H. Grumm And Jason Krekeler National Weather Service State College, PA 16803 1. INTRODUCTION Heavy rain fell over the Gulf States,
2016 Meteorology Summary
 2016 Meteorology Summary New Jersey Department of Environmental Protection AIR POLLUTION AND METEOROLOGY Meteorology plays an important role in the distribution of pollution throughout the troposphere,
Air Quality Modelling for Health Impacts Studies
 Air Quality Modelling for Health Impacts Studies Paul Agnew RSS Conference September 2014 Met Office Air Quality and Composition team Paul Agnew Lucy Davis Carlos Ordonez Nick Savage Marie Tilbee April
7.5 THE EFFECTS OF LOCAL AND REGIONAL SCALE CIRCULATIONS ON AIR POLLUTANTS DURING NARSTO-NE-OPS
 7.5 THE EFFECTS OF LOCAL AND REGIONAL SCALE CIRCULATIONS ON AIR POLLUTANTS DURING NARSTO-NE-OPS 1999-2001 Richard D. Clark Millersville University of Pennsylvania, Millersville, Pennsylvania C. Russell
Satellites, Weather and Climate Module??: Polar Vortex
 Satellites, Weather and Climate Module??: Polar Vortex SWAC Jan 2014 AKA Circumpolar Vortex Science or Hype? Will there be one this year? Today s objectives Pre and Post exams What is the Polar Vortex
NOAA-EPA s s U.S. National Air Quality Forecast Capability
 NOAA-EPA s s U.S. National Air Quality Forecast Capability May 10, 2006 Paula M. Davidson 1, Nelson Seaman 1, Jeff McQueen 1, Rohit Mathur 1,2, Chet Wayland 2 1 National Oceanic and Atmospheric Administration
COLORADO STATE UNIVERSITY FORECAST OF ATLANTIC HURRICANE ACTIVITY FROM AUGUST 4-17, 2015
 COLORADO STATE UNIVERSITY FORECAST OF ATLANTIC HURRICANE ACTIVITY FROM AUGUST 4-17, 2015 We expect that the next two weeks will be characterized by below-average amounts (
Creating Meteorology for CMAQ
 Creating Meteorology for CMAQ Tanya L. Otte* Atmospheric Sciences Modeling Division NOAA Air Resources Laboratory Research Triangle Park, NC * On assignment to the National Exposure Research Laboratory,
DATA FUSION NOWCASTING AND NWP
 DATA FUSION NOWCASTING AND NWP Brovelli Pascal 1, Ludovic Auger 2, Olivier Dupont 1, Jean-Marc Moisselin 1, Isabelle Bernard-Bouissières 1, Philippe Cau 1, Adrien Anquez 1 1 Météo-France Forecasting Department
DEPARTMENT OF EARTH & CLIMATE SCIENCES Name SAN FRANCISCO STATE UNIVERSITY Nov 29, ERTH 360 Test #2 200 pts
 DEPARTMENT OF EARTH & CLIMATE SCIENCES Name SAN FRANCISCO STATE UNIVERSITY Nov 29, 2018 ERTH 360 Test #2 200 pts Each question is worth 4 points. Indicate your BEST CHOICE for each question on the Scantron
SNOW COVER MAPPING USING METOP/AVHRR AND MSG/SEVIRI
 SNOW COVER MAPPING USING METOP/AVHRR AND MSG/SEVIRI Niilo Siljamo, Markku Suomalainen, Otto Hyvärinen Finnish Meteorological Institute, P.O.Box 503, FI-00101 Helsinki, Finland Abstract Weather and meteorological
6.10 CHARACTERIZATION OF NOCTURNAL JETS OVER PHILADELPHIA DURING AIR-POLLUTION EPISODES
 6.10 CHARACTERIZATION OF NOCTURNAL JETS OVER PHILADELPHIA DURING AIR-POLLUTION EPISODES Sachin J. Verghese*, Sriram N. Kizhakkemadam, Adam Willitsford, Jason P. Collier, Sameer Unni and C. Russell Philbrick
Climate Outlook through 2100 South Florida Ecological Services Office Vero Beach, FL September 9, 2014
 Climate Outlook through 2100 South Florida Ecological Services Office Vero Beach, FL September 9, 2014 Short Term Drought Map: Short-term (
Use of Seasonal forecasts in Electrical Load Prediction
 Use of Seasonal forecasts in Electrical Load Prediction Tina Greenfield Eric Aligo Linda Mudoni Iowa State University Department of Geological and Atmospheric Sciences May 2, 22 1 1. Introduction The electricity
Northeastern United States Snowstorm of 9 February 2017
 Northeastern United States Snowstorm of 9 February 2017 By Richard H. Grumm and Charles Ross National Weather Service State College, PA 1. Overview A strong shortwave produced a stripe of precipitation
Monthly overview. Rainfall
 Monthly overview 1 to 10 April 2018 Widespread rainfall continued to fall over most parts of the summer rainfall region during this period. Unseasonably good rain fell over the eastern half of the Northern
Will a warmer world change Queensland s rainfall?
 Will a warmer world change Queensland s rainfall? Nicholas P. Klingaman National Centre for Atmospheric Science-Climate Walker Institute for Climate System Research University of Reading The Walker-QCCCE
Climate Outlook and Review Focus on sugar industry requirements. Issued 1 October Roger C Stone
 Climate Outlook and Review Focus on sugar industry requirements Issued 1 October 2017 Roger C Stone University of Southern Queensland Document title 1 Overview A short La Nina-type pattern trying to develop
AQRP Monthly Technical Report
 AQRP Monthly Technical Report PROJECT TITLE PROJECT PARTICIPANTS Impact of large-scale circulation patterns on surface ozone concentrations in Houston-Galveston-Brazoria (HGB) Texas A&M University at Galveston
A LOOK AT TROPICAL STORM GASTON FLOODING IN VIRGINIA
 J12B.4 A LOOK AT TROPICAL STORM GASTON FLOODING IN VIRGINIA John Billet* and Keith Lynch NOAA/NWS Wakefield, VA 1. INTRODUCTION Hurricane Gaston made landfall north of Charleston, SC on Sunday morning
The Hungarian Meteorological Service has made
 ECMWF Newsletter No. 129 Autumn 11 Use of ECMWF s ensemble vertical profiles at the Hungarian Meteorological Service István Ihász, Dávid Tajti The Hungarian Meteorological Service has made extensive use
Weather and Climate Summary and Forecast Summer 2017
 Weather and Climate Summary and Forecast Summer 2017 Gregory V. Jones Southern Oregon University August 4, 2017 July largely held true to forecast, although it ended with the start of one of the most extreme
Severe storm forecast guidance based on explicit identification of convective phenomena in WRF-model forecasts
 Severe storm forecast guidance based on explicit identification of convective phenomena in WRF-model forecasts Ryan Sobash 10 March 2010 M.S. Thesis Defense 1 Motivation When the SPC first started issuing
Seasonal Variations of the Urban Heat Island Effect:
 Seasonal Variations of the Urban Heat Island Effect: Examining the Differences in Temperature Between the City of Philadelphia and its Outlying Suburbs By: Frank Vecchio 1 P a g e We re calling for a high
How far in advance can we forecast cold/heat spells?
 Sub-seasonal time scales: a user-oriented verification approach How far in advance can we forecast cold/heat spells? Laura Ferranti, L. Magnusson, F. Vitart, D. Richardson, M. Rodwell Danube, Feb 2012
Stability in SeaWinds Quality Control
 Ocean and Sea Ice SAF Technical Note Stability in SeaWinds Quality Control Anton Verhoef, Marcos Portabella and Ad Stoffelen Version 1.0 April 2008 DOCUMENTATION CHANGE RECORD Reference: Issue / Revision:
THE ATMOSPHERE IN MOTION
 Funding provided by NOAA Sectoral Applications Research Project THE ATMOSPHERE IN MOTION Basic Climatology Oklahoma Climatological Survey Factor 1: Our Energy Source Hi, I m the Sun! I provide 99.9999+
Atmospheric Circulation
 Atmospheric Circulation Introductory Oceanography Instructor: Ray Rector Atmospheric Circulation Key Topics Composition and Structure Solar Heating and Convection The Coriolis Effect Global Wind Patterns
2/20/2013. Meteorology and Climatology 101. Why do we have weather? MARAMA Webinar February 21, 2013
 Meteorology and Climatology 101 MARAMA Webinar February 21, 2013 Sean Nolan PA DEP Meteorologist 717.787.1454 senolan@pa.gov Table of Contents Meteorology The Basics The Energy Balance Forces of Motion
Seasonal Climate Watch July to November 2018
 Seasonal Climate Watch July to November 2018 Date issued: Jun 25, 2018 1. Overview The El Niño-Southern Oscillation (ENSO) is now in a neutral phase and is expected to rise towards an El Niño phase through
Allison Monarski, University of Maryland Masters Scholarly Paper, December 6, Department of Atmospheric and Oceanic Science
 Allison Monarski, University of Maryland Masters Scholarly Paper, December 6, 2011 1 Department of Atmospheric and Oceanic Science Verification of Model Output Statistics forecasts associated with the
Hyperlocal Marine Weather: What s Happening?
 Hyperlocal Marine Weather: What s Happening? André van der Westhuysen 1,2 and Jeff McQueen 1 1 NOAA / National Weather Service National Centers for Environmental Prediction 2 I.M Systems Group, Rockville
A Study of Long Range Transport of Ozone and Aerosols to the San Joaquin Valley
 A Study of Long Range Transport of Ozone and Aerosols to the San Joaquin Valley Ian Faloona, Andrew Post, Anthony Wexler, Steve Cliff, and Steve Conley Air Quality Research Center, University of California
Addendum to the. Submitted to U.S. EPA Region 9 March 17, Prepared by:
 Addendum to the Exceptional Events Demonstration for 2015 Ozone Exceedance in Washoe County from the 2015 California Wildfires August 21, 2015 Submitted to U.S. EPA Region 9 March 17, 2017 Prepared by:
UPDATE OF REGIONAL WEATHER AND SMOKE HAZE (February 2018)
") UPDATE OF REGIONAL WEATHER AND SMOKE HAZE (February 2018) 1. Review of Regional Weather Conditions for January 2018 1.1 The prevailing Northeast monsoon conditions over Southeast Asia strengthened in January
UPDATE OF REGIONAL WEATHER AND SMOKE HAZE (February 2018) 1. Review of Regional Weather Conditions for January 2018 1.1 The prevailing Northeast monsoon conditions over Southeast Asia strengthened in January
Application and verification of ECMWF products 2010
 Application and verification of ECMWF products Hydrological and meteorological service of Croatia (DHMZ) Lovro Kalin. Summary of major highlights At DHMZ, ECMWF products are regarded as the major source
ENSO Cycle: Recent Evolution, Current Status and Predictions. Update prepared by Climate Prediction Center / NCEP 5 August 2013
 ENSO Cycle: Recent Evolution, Current Status and Predictions Update prepared by Climate Prediction Center / NCEP 5 August 2013 Outline Overview Recent Evolution and Current Conditions Oceanic Niño Index