Uncertainty in IDF Curves
|
|
|
- Evangeline Craig
- 5 years ago
- Views:
Transcription
1 Uncertainty in IDF Curves Rami Mansour, Fahad Alzahrani and Donald H. Burn Department of Civil & Environmental Engineering University of Waterloo Waterloo ON CANADA
2 Introduction Work has focused on quantifying the uncertainty in IDF curves for a single site for current conditions Rami has led this work (January to April) The next steps will involve looking at two additional issues (work by Fahad): Uncertainty in regional estimates of IDF curves Uncertainty in IDF estimates under climate change
3 Methodology The starting point for the work is the weather generator, which was used to obtain daily precipitation values Used the 7 variable version of the model Used stations that are close to London (<50 km) Results in 9 stations not all have hourly daily Turned off the perturbation feature Gives better agreement with historical data
4 Methodology Goal was to evaluate the capability to reproduce the historical (observed) IDF curve for London Requires disaggregation of generated daily data to hourly data A model based on the method of fragments was developed to do this Similar events are identified based on similarity in daily precipitation and hourly precipitation for the last hour of the previous day Simpler version of the model developed by Karen Hofbauer (Wey)
5 Results First step was the calibration and testing of the disaggregation model Single parameter to adjust in this model Weight to apply to similarity in daily versus hourly values Model results were found to not be overly sensitive to the parameter Testing was done using data from London Other sites have not been tested

6 Results
7 Results Disaggregation model was then used to get hourly precipitation values from each daily value generated by the weather generator These were used to extract, for each year, the values required to create an IDF curve for each rainfall duration of interest 1, 2, 6, 12 and 24 hour Since we have 27 years of input data for the weather generator, we created sequences of length 27 years This has been done 50 times and IDF curves obtained for each sequence
8 Results Percentage Error in IDF Values (based on 50 sequences) Return Period Rainfall Duration (hours) % 5.95% 12.70% 6.78% 0.20% % 4.28% 7.62% 4.31% -3.76% % 3.58% 5.44% 3.19% -5.49% % 2.94% 3.43% 2.12% -7.11% % 2.58% 2.29% 1.50% -8.03% % 2.29% 1.37% 0.98% -8.78%
9 Results
10 Results
11 Results
12 Results
13 Results
14 Conclusions from this phase Disaggregation model creates reasonable hourly data Agreement between generated and historical IDF data is good Better for shorter durations and shorter return periods Approach can be used to quantify the uncertainty in IDF curves under current conditions
15 Next Steps Multiple sites and regional estimates of IDF IDF data have to be extracted for all sites (not just London) Data from multiple sites to be combined to estimate IDF for London (regional estimate) Future work on climate change scenarios The uncertainty in estimates of IDF will be analysed
16 Con t By using Gumbel extreme values type 1 distribution, the function quantile is calculated based on return period (year) and average of the intensity values, standard deviation for different duration of event. The return periods that are used are 2, 5,10, 25, 50, 100 years The event durations are 1, 2, 6, 12, 24 hours.
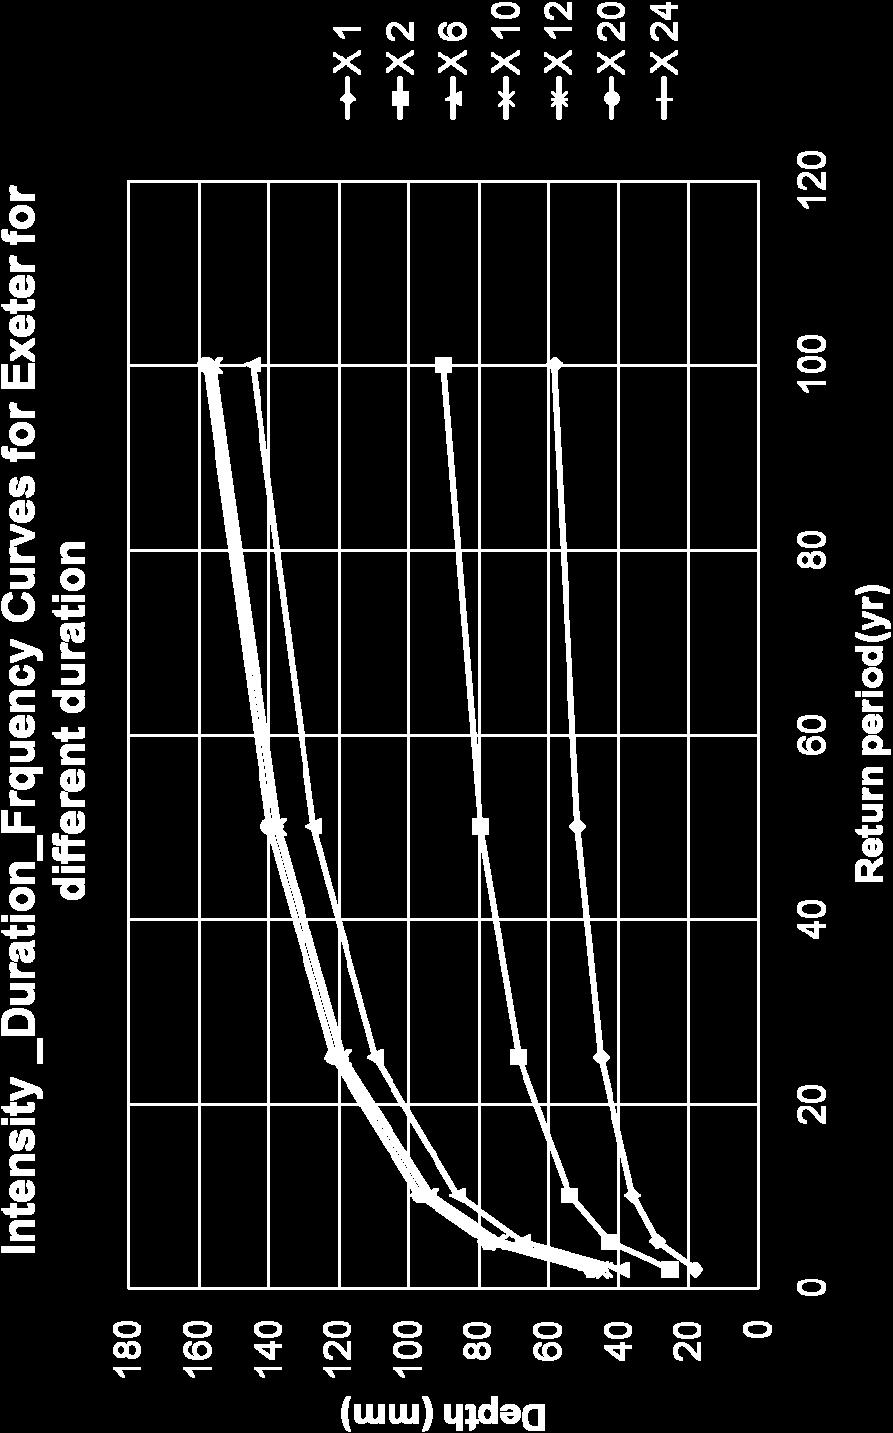
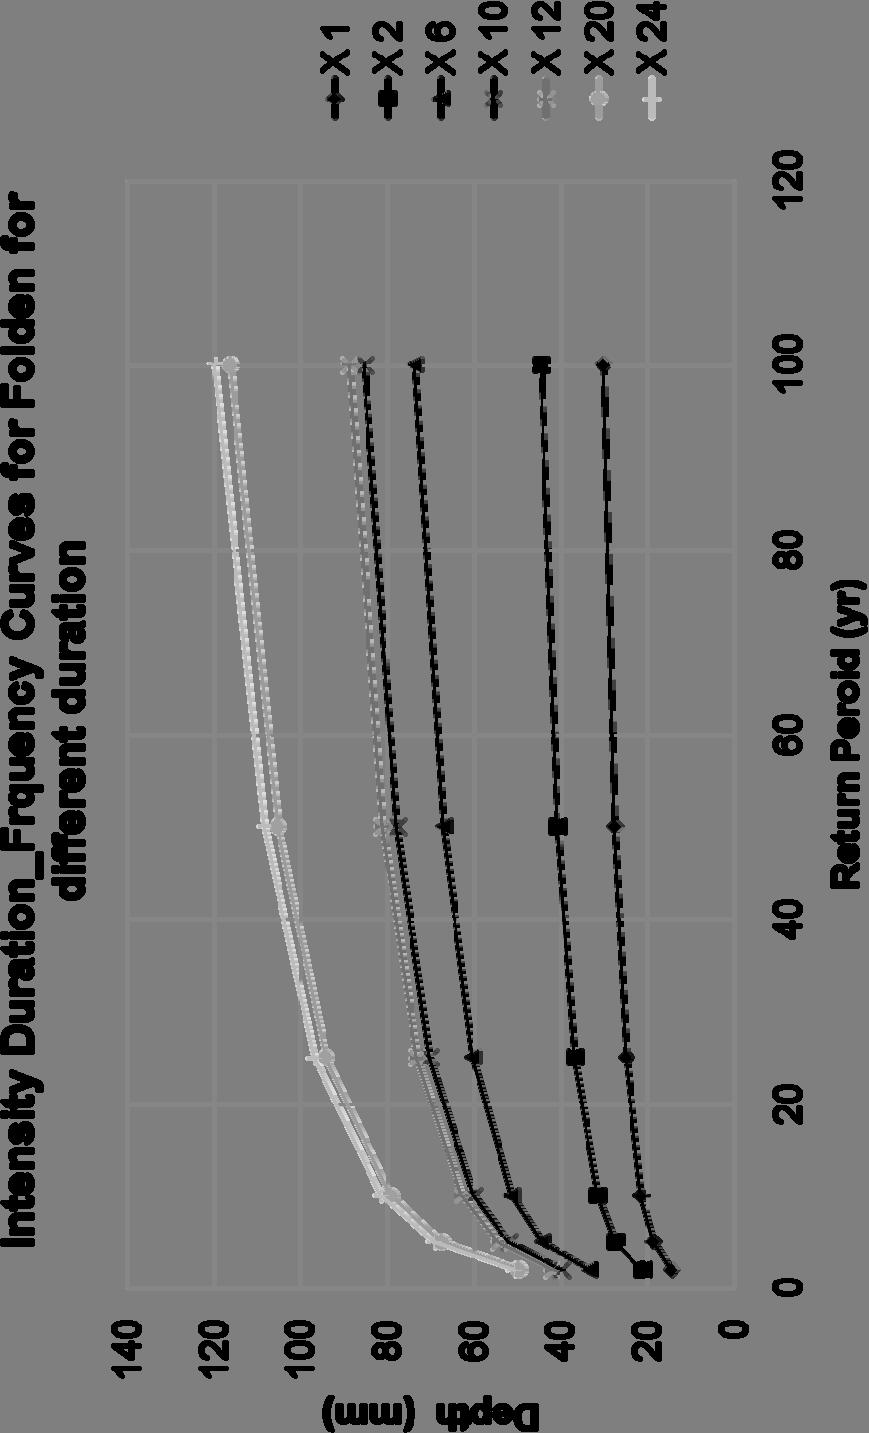
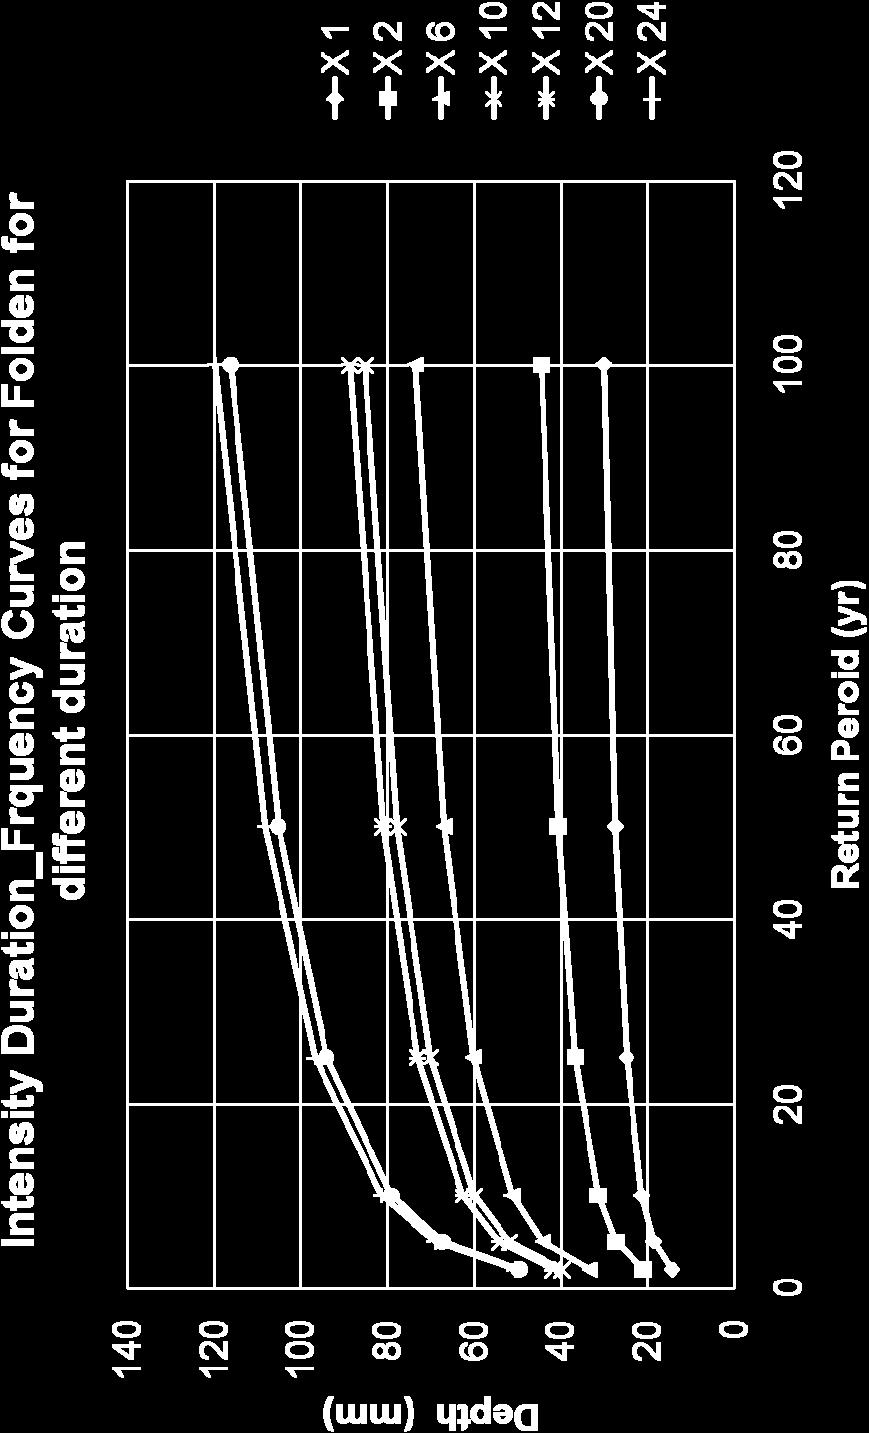
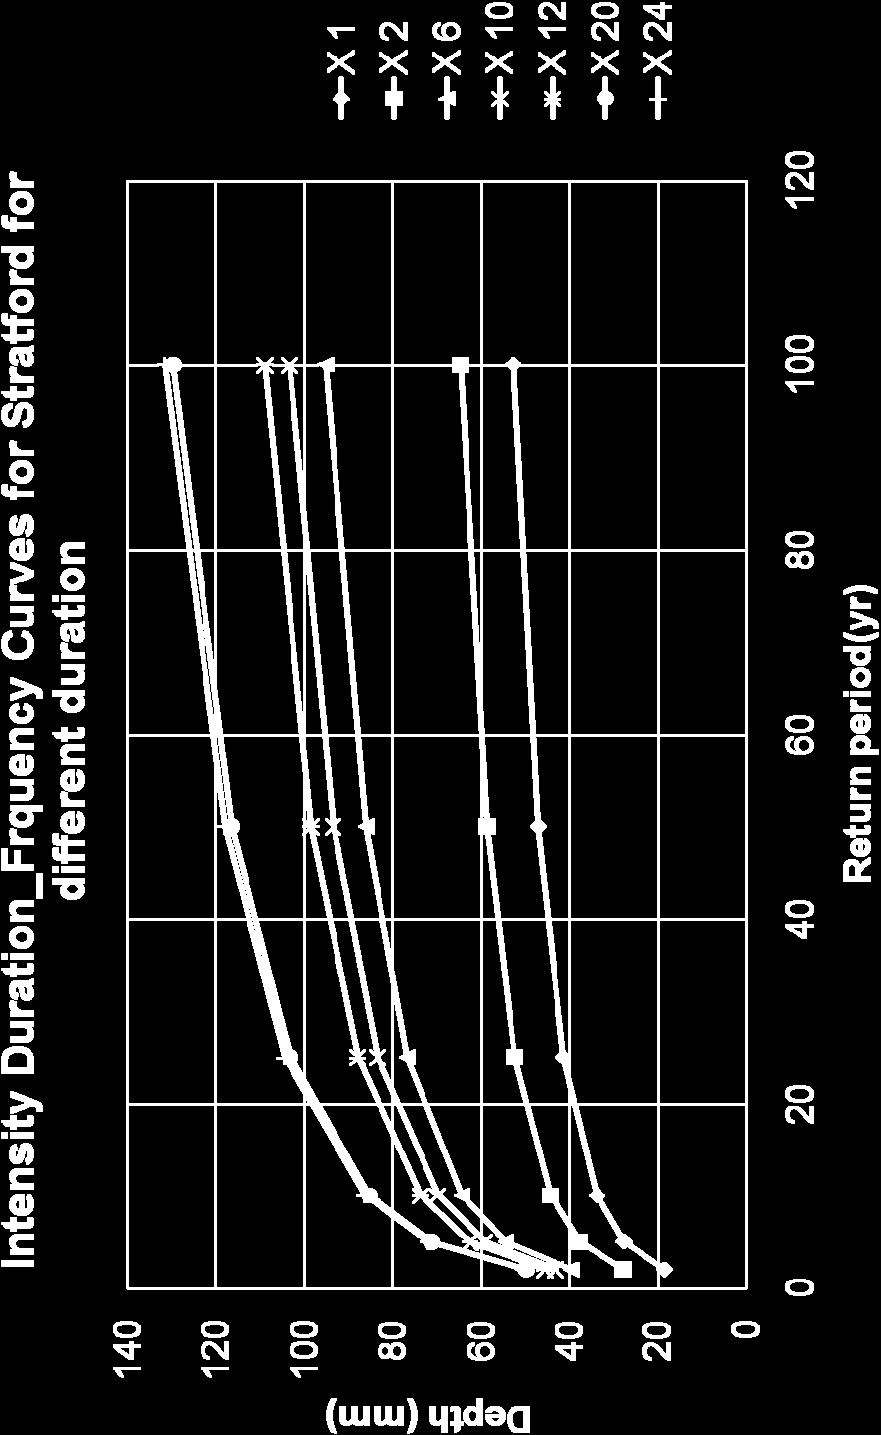
17 Con t We have 9 climate stations that are located around 50 km from London, ON. As mentioned in the beginning, the hourly data are used through WG to create the intensity value for each station for different duration of event.
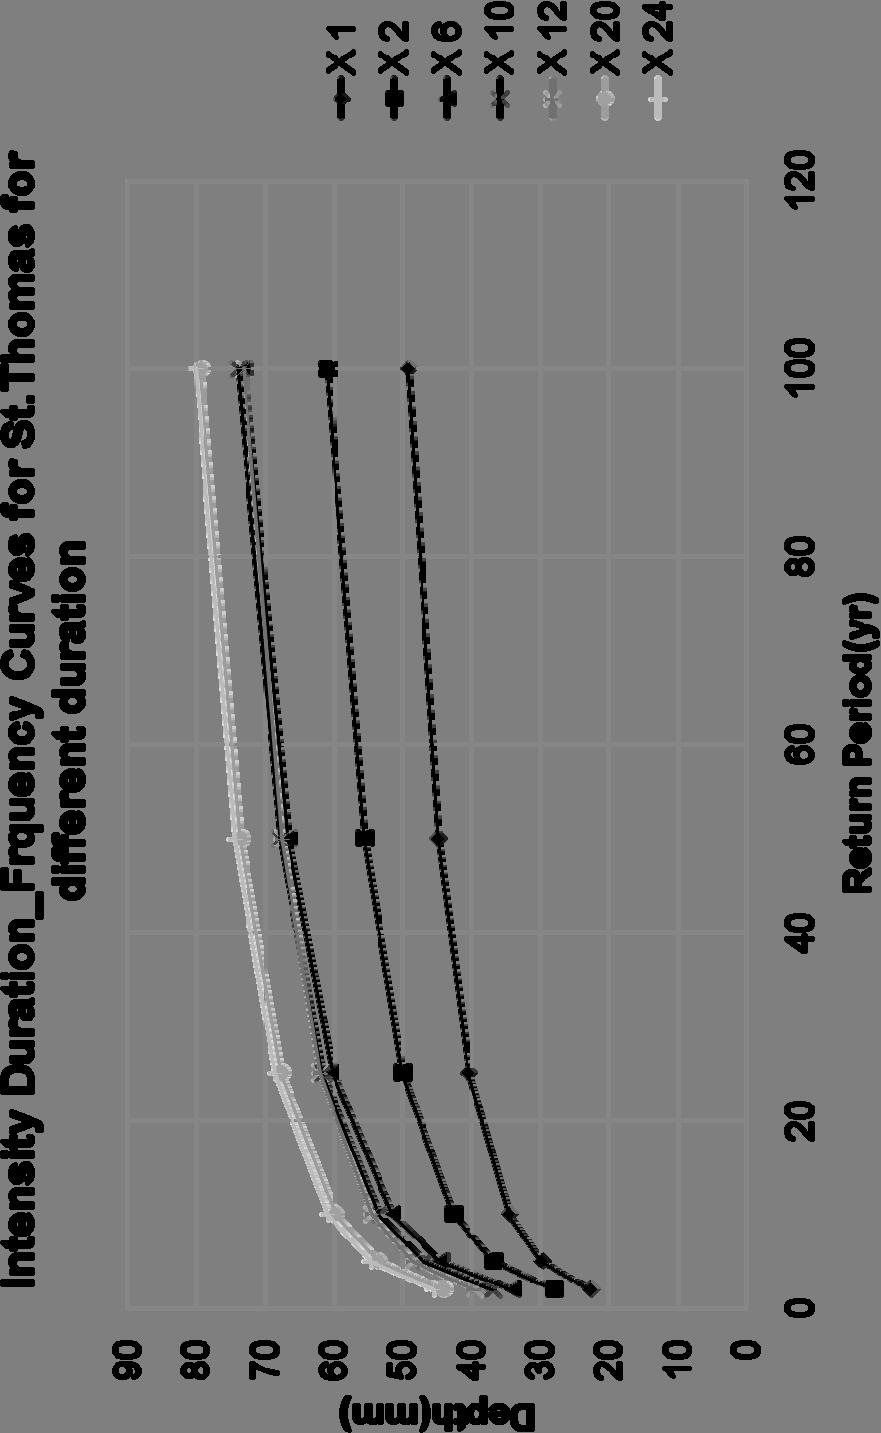
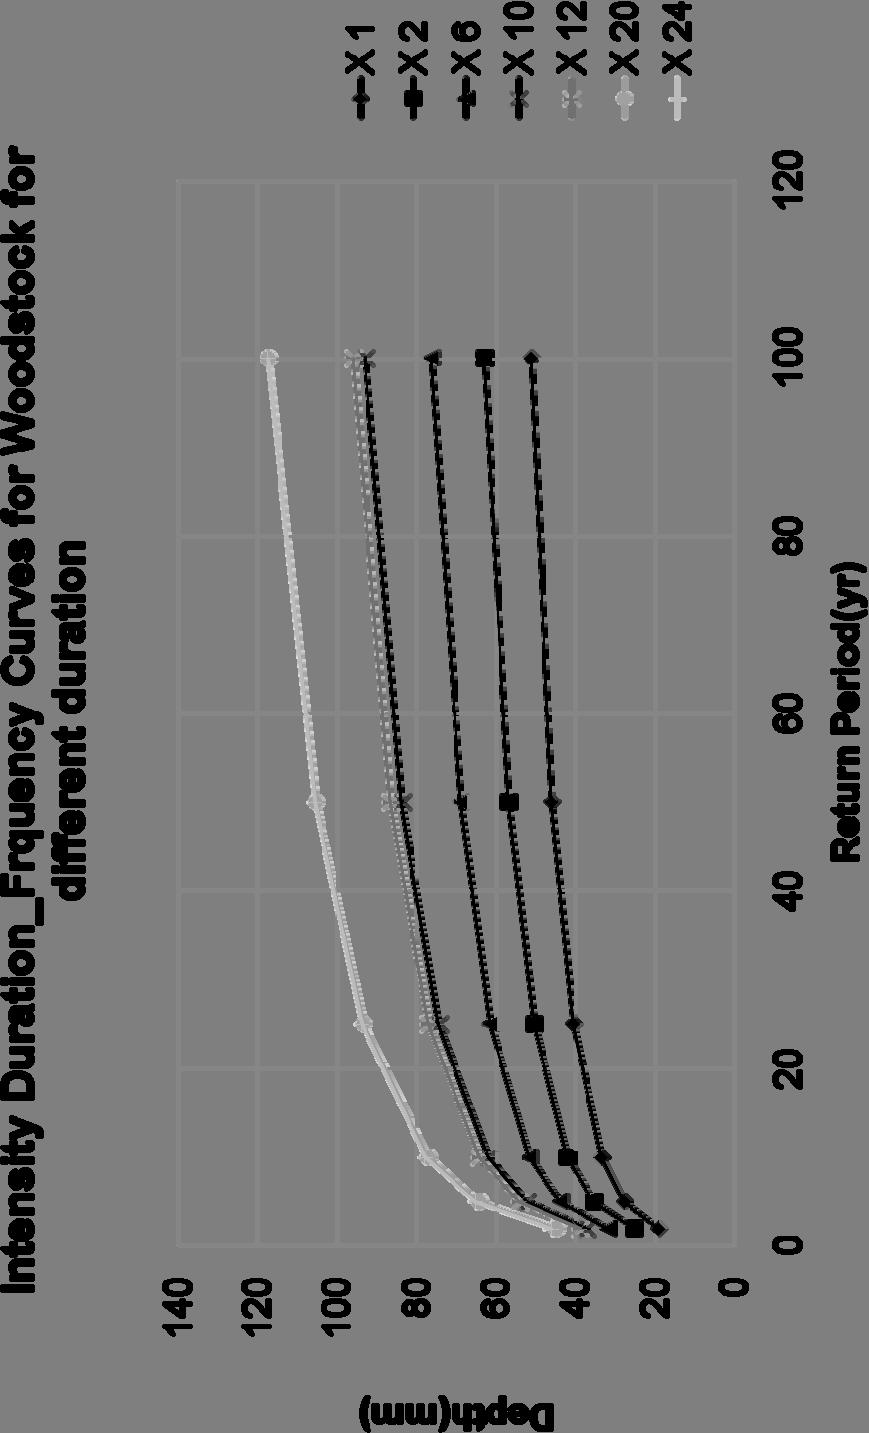
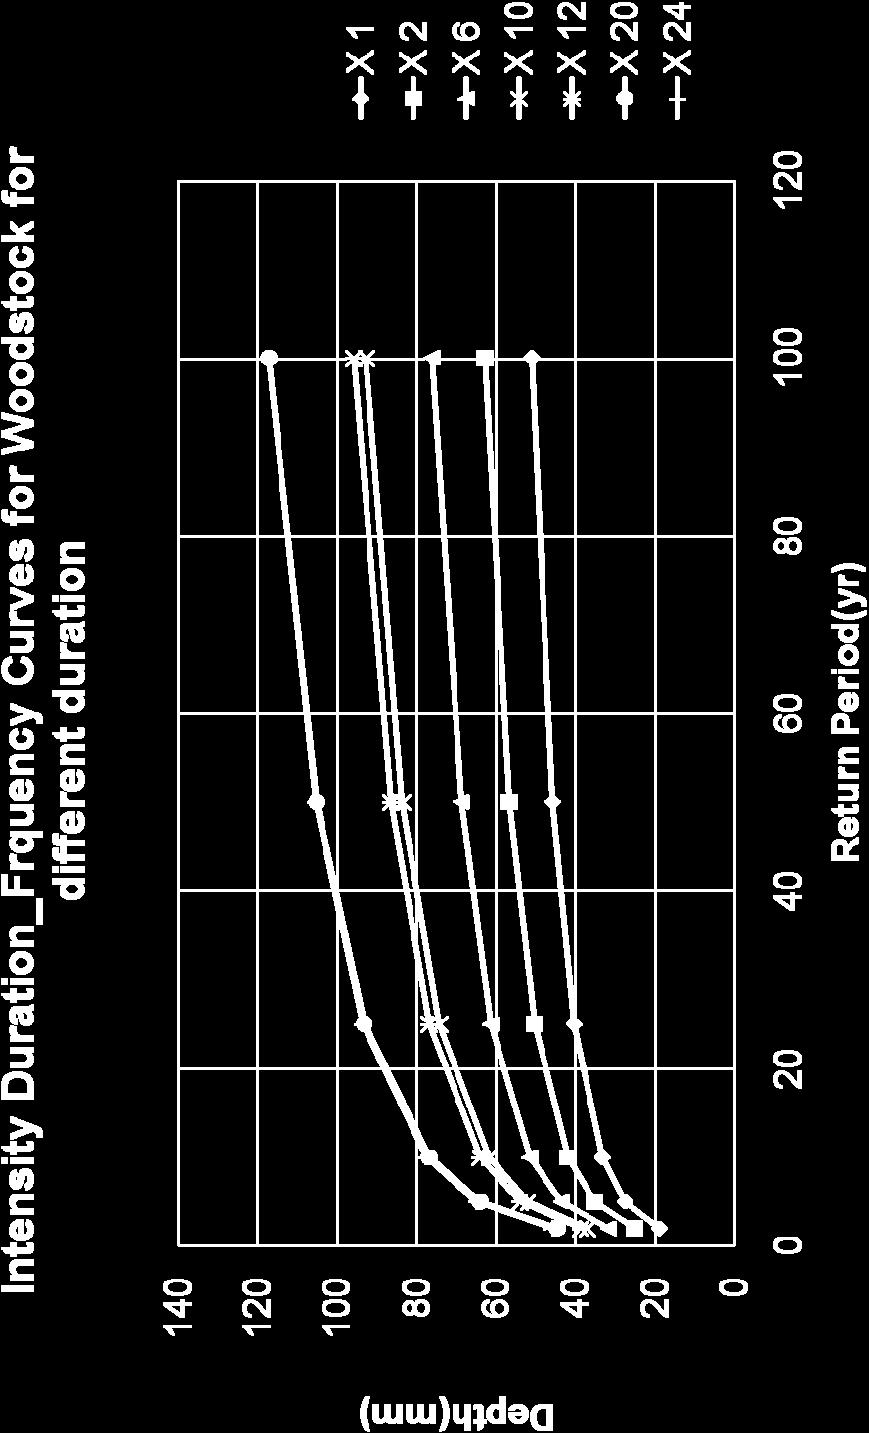
18 Table of 9 climate stations A Table of nine stations that are used in WG perturbation removed close. Station s name Dorchester 1 Embro 2 Exeter 3 Folden 4 Stratford 5 St. Thomas 6 Woodstock 7 London 8 Ilderton 9 No.
19 Results After running the model, IDF values have been received and created the curves. IDF Curves show us the extreme rainfall of each station for different return period. There are differences in values of function quantile WG perturbation removed because the distance between each stations that are located around London


20 The IDF curves from WG perturbation removed close.

21
22


23

24

25
26
27 Issues and Challenges Weather generator model is slow and the procedure is computationally intensive May need to improve the weather generator performance Need to determine if we should use the perturbation feature for the climate change scenarios May need to address the uncertainty in IDFs that arises from the limited record length This may be fairly easy to do, but computationally intensive
Weather Generator and Hourly Disaggregation Model
 Weather Generator and Hourly Disaggregation Model A Report Describing the Work Done With the Weather Generator Prepared By: Rami Mansour and Donald H. Burn, Ph.D., P.Eng. Department of Civil and Environmental
CFCAS project: Assessment of Water Resources Risk and Vulnerability to Changing Climatic Conditions. Project Report II.
 CFCAS project: Assessment of Water Resources Risk and Vulnerability to Changing Climatic Conditions Project Report II. January 2004 Prepared by and CFCAS Project Team: University of Western Ontario Slobodan
Quantifying Uncertainty in Modelled Estimates of Future Extreme Precipitation Events CFCAS Project Progress Report
 Quantifying Uncertainty in Modelled Estimates of Future Extreme Precipitation Events CFCAS Project Progress Report The University of Western Ontario Outline A - Reanalysis Data for UTRW C Quantifying GCM
Thessaloniki, Greece
 9th International Conference on Urban Drainage Modelling Effects of Climate Change on the Estimation of Intensity-Duration- Frequency (IDF) curves for, Greece, Greece G. Terti, P. Galiatsatou, P. Prinos
Updated rainfall intensity duration frequency curves for the City of London under the changing climate
 Updated rainfall intensity duration frequency curves for the City of London under the changing climate By: Slobodan P. Simonovic and Angela Peck Department of Civil and Environmental Engineering The University
Review of existing statistical methods for flood frequency estimation in Greece
 EU COST Action ES0901: European Procedures for Flood Frequency Estimation (FloodFreq) 3 rd Management Committee Meeting, Prague, 28 29 October 2010 WG2: Assessment of statistical methods for flood frequency
Water Resources Research Report
 THE UNIVERSITY OF WESTERN ONTARIO DEPARTMENT OF CIVIL AND ENVIRONMENTAL ENGINEERING Water Resources Research Report Development of Probability Based Intensity- Duration-Frequency Curves under Climate Change
DOWNSCALING INTERCOMPARISON PROJECT SUMMARY REPORT
 DOWNSCALING INTERCOMPARISON PROJECT SUMMARY REPORT 1 DOWNSCALING INTERCOMPARISON PROJECT Method tests and future climate projections The Pacific Climate Impacts Consortium (PCIC) recently tested a variety
Simulating climate change scenarios using an improved K-nearest neighbor model
 Journal of Hydrology 325 (2006) 179 196 www.elsevier.com/locate/jhydrol Simulating climate change scenarios using an improved K-nearest neighbor model Mohammed Sharif, Donald H Burn * Department of Civil
Water Resources Research Report
 THE UNIVERSITY OF WESTERN ONTARIO DEPARTMENT OF CIVIL AND ENVIRONMENTAL ENGINEERING Water Resources Research Report Assessment of Climatic Vulnerability in the Upper Thames River Basin: Part 2 By: Leanna
Precipitation Intensity-Duration- Frequency Analysis in the Face of Climate Change and Uncertainty
 Precipitation Intensity-Duration- Frequency Analysis in the Face of Climate Change and Uncertainty Supporting Casco Bay Region Climate Change Adaptation RRAP Eugene Yan, Alissa Jared, Edom Moges Environmental
IMPACT OF CLIMATE CHANGE ON URBAN DRAINAGE SYSTEM PERFORMANCE
 9 th INTERNATIONAL WORKSHOP on PRECIPITATION IN URBAN AREAS IMPACT OF CLIMATE CHANGE ON URBAN DRAINAGE SYSTEM PERFORMANCE by C. Egger (1), M. Honti (1) and M. Maurer (1) (1) Eawag, The Swiss Federal Institute
Intensity-Duration-Frequency (IDF) Curves Example
 Curves Example") Intensity-Duration-Frequency (IDF) Curves Example Intensity-Duration-Frequency (IDF) curves describe the relationship between rainfall intensity, rainfall duration, and return period (or its inverse, probability
Intensity-Duration-Frequency (IDF) Curves Example Intensity-Duration-Frequency (IDF) curves describe the relationship between rainfall intensity, rainfall duration, and return period (or its inverse, probability
Draft Water Resources Management Plan 2019 Annex 3: Supply forecast Appendix B: calibration of the synthetic weather generator
 Draft Water Resources Management Plan 2019 Annex 3: Supply forecast Appendix B: calibration of the synthetic weather generator November 30, 2017 Version 1 Introduction This appendix contains calibration
NATIONAL HYDROPOWER ASSOCIATION MEETING. December 3, 2008 Birmingham Alabama. Roger McNeil Service Hydrologist NWS Birmingham Alabama
 NATIONAL HYDROPOWER ASSOCIATION MEETING December 3, 2008 Birmingham Alabama Roger McNeil Service Hydrologist NWS Birmingham Alabama There are three commonly described types of Drought: Meteorological drought
RAINFALL DURATION-FREQUENCY CURVE FOR UNGAGED SITES IN THE HIGH RAINFALL, BENGUET MOUNTAIN REGION IN THE PHILIPPINES
 RAINFALL DURATION-FREQUENCY CURVE FOR UNGAGED SITES IN THE HIGH RAINFALL, BENGUET MOUNTAIN REGION IN THE PHILIPPINES GUILLERMO Q. TABIOS III Department of Civil Engineering, University of the Philippines
Lecture 2: Precipitation
 2-1 GEOG415 Lecture 2: Precipitation Why do we study precipitation? Precipitation measurement -- depends on the study purpose. Non-recording (cumulative) Recording (tipping bucket) Important parameters
Mapping extreme rainfall statistics for Canada under climate change using updated Intensity-Duration-Frequency curves
 Mapping extreme rainfall statistics for Canada under climate change using updated Intensity-Duration-Frequency curves Slobodan P. Simonović Civil and Environmental Engineering Institute for Catastrophic
WEIGHING GAUGES MEASUREMENT ERRORS AND THE DESIGN RAINFALL FOR URBAN SCALE APPLICATIONS
 WEIGHING GAUGES MEASUREMENT ERRORS AND THE DESIGN RAINFALL FOR URBAN SCALE APPLICATIONS by M. Colli (1), L.G. Lanza (1),(2) and P. La Barbera (1) (1) University of Genova, Dep. of Construction, Chemical
Specialist rainfall scenarios and software package
 Building Knowledge for a Changing Climate Specialist rainfall scenarios and software package Chris Kilsby Ahmad Moaven-Hashemi Hayley Fowler Andrew Smith Aidan Burton Michael Murray University of Newcastle
Generation of synthetic design storms for the Upper Thames River basin
 Generation of synthetic design storms for the Upper Thames River basin CFCAS project: Assessment of Water Resources Risk and Vulnerability to Changing Climatic Conditions Project Report V. November 2004
Indices of droughts (SPI & PDSI) over Canada as simulated by a statistical downscaling model: current and future periods
 over Canada as simulated by a statistical downscaling model: current and future periods") Indices of droughts (SPI & PDSI) over Canada as simulated by a statistical downscaling model: current and future periods Philippe Gachon 1, Rabah Aider 1 & Grace Koshida Adaptation & Impacts Research Division,
Indices of droughts (SPI & PDSI) over Canada as simulated by a statistical downscaling model: current and future periods Philippe Gachon 1, Rabah Aider 1 & Grace Koshida Adaptation & Impacts Research Division,
Results of Intensity-Duration- Frequency Analysis for Precipitation and Runoff under Changing Climate
 Results of Intensity-Duration- Frequency Analysis for Precipitation and Runoff under Changing Climate Supporting Casco Bay Region Climate Change Adaptation RRAP Eugene Yan, Alissa Jared, Julia Pierce,
Climate Change Impact on Intensity-Duration- Frequency Curves in Ho Chi Minh city
 Climate Change Impact on Intensity-Duration- Frequency Curves in Ho Chi Minh city Minh Truong Ha Institute of Meteorology, Hydrology and Climate Change, Hanoi, Vietnam Kuala Lumpur, 06-2018 Rationale Unpredictable
Dirk Schlabing and András Bárdossy. Comparing Five Weather Generators in Terms of Entropy
 Dirk Schlabing and András Bárdossy Comparing Five Weather Generators in Terms of Entropy Motivation 1 Motivation What properties of weather should be reproduced [...]? Dirk Schlabing & András Bárdossy,
Intensity-Duration-Frequency Curve Update for Newfoundland and Labrador
 Intensity-Duration-Frequency Curve Update for Newfoundland and Labrador Allyson Bingeman 1 Juraj Cunderlik 1 Gerald Crane 2 Amir Ali Khan 3 1 GHD Limited 2 Office of Climate Change and Energy Efficiency
Climate Change Impact Analysis
 Climate Change Impact Analysis Patrick Breach M.E.Sc Candidate pbreach@uwo.ca Outline July 2, 2014 Global Climate Models (GCMs) Selecting GCMs Downscaling GCM Data KNN-CAD Weather Generator KNN-CADV4 Example
Regional climate projections for NSW
 Regional climate projections for NSW Dr Jason Evans Jason.evans@unsw.edu.au Climate Change Projections Global Climate Models (GCMs) are the primary tools to project future climate change CSIROs Climate
Statistical downscaling methods for climate change impact assessment on urban rainfall extremes for cities in tropical developing countries A review
 1 Statistical downscaling methods for climate change impact assessment on urban rainfall extremes for cities in tropical developing countries A review International Conference on Flood Resilience: Experiences
Climate Change Impact on Intensity-Duration- Frequency Curves in Ho Chi Minh city
 Climate Change Impact on Intensity-Duration- Frequency Curves in Ho Chi Minh city Khiem Van Mai, Minh Truong Ha, Linh Nhat Luu Institute of Meteorology, Hydrology and Climate Change, Hanoi, Vietnam Hanoi,
Modeling Rainfall Intensity Duration Frequency (R-IDF) Relationship for Seven Divisions of Bangladesh
 Relationship for Seven Divisions of Bangladesh") EUROPEAN ACADEMIC RESEARCH Vol. III, Issue 5/ August 2015 ISSN 2286-4822 www.euacademic.org Impact Factor: 3.4546 (UIF) DRJI Value: 5.9 (B+) Modeling Rainfall Intensity Duration Frequency (R-IDF) Relationship
EUROPEAN ACADEMIC RESEARCH Vol. III, Issue 5/ August 2015 ISSN 2286-4822 www.euacademic.org Impact Factor: 3.4546 (UIF) DRJI Value: 5.9 (B+) Modeling Rainfall Intensity Duration Frequency (R-IDF) Relationship
URBAN DRAINAGE MODELLING
 9th International Conference URBAN DRAINAGE MODELLING Evaluating the impact of climate change on urban scale extreme rainfall events: Coupling of multiple global circulation models with a stochastic rainfall
MULTI MODEL ENSEMBLE FOR ASSESSING THE IMPACT OF CLIMATE CHANGE ON THE HYDROLOGY OF A SOUTH INDIAN RIVER BASIN
 MULTI MODEL ENSEMBLE FOR ASSESSING THE IMPACT OF CLIMATE CHANGE ON THE HYDROLOGY OF A SOUTH INDIAN RIVER BASIN P.S. Smitha, B. Narasimhan, K.P. Sudheer Indian Institute of Technology, Madras 2017 International
not for commercial-scale installations. Thus, there is a need to study the effects of snow on
 1. Problem Statement There is a great deal of uncertainty regarding the effects of snow depth on energy production from large-scale photovoltaic (PV) solar installations. The solar energy industry claims
The general procedure for estimating 24-hour PMP includes the following steps:
 14th Conference on Applied Climatology Abstract # 71520 Using PRISM Climate Grids and GIS for Extreme Precipitation Mapping George H. Taylor and Christopher Daly Oregon State University Corvallis Oregon
peak half-hourly Tasmania
 Forecasting long-term peak half-hourly electricity demand for Tasmania Dr Shu Fan B.S., M.S., Ph.D. Professor Rob J Hyndman B.Sc. (Hons), Ph.D., A.Stat. Business & Economic Forecasting Unit Report for
peak half-hourly New South Wales
 Forecasting long-term peak half-hourly electricity demand for New South Wales Dr Shu Fan B.S., M.S., Ph.D. Professor Rob J Hyndman B.Sc. (Hons), Ph.D., A.Stat. Business & Economic Forecasting Unit Report
Uncertainty in the SWAT Model Simulations due to Different Spatial Resolution of Gridded Precipitation Data
 Uncertainty in the SWAT Model Simulations due to Different Spatial Resolution of Gridded Precipitation Data Vamsi Krishna Vema 1, Jobin Thomas 2, Jayaprathiga Mahalingam 1, P. Athira 4, Cicily Kurian 1,
Assessing methods to disaggregate daily precipitation for hydrological simulation
 Assessing methods to disaggregate daily precipitation for hydrological simulation Peng Gao, Gregory Carbone, Daniel Tufford, Aashka Patel, and Lauren Rouen Department of Geography University of South Carolina
CLIMATE CHANGE IMPACTS ON RAINFALL INTENSITY- DURATION-FREQUENCY CURVES OF HYDERABAD, INDIA
 CLIMATE CHANGE IMPACTS ON RAINFALL INTENSITY- DURATION-FREQUENCY CURVES OF HYDERABAD, INDIA V. Agilan Department of Civil Engineering, National Institute of Technology, Warangal, Telangana, India-506004,
Development of Projected Intensity-Duration-Frequency Curves for Welland, Ontario, Canada
 NATIONAL ENGINEERING VULNERABILITY ASSESSMENT OF PUBLIC INFRASTRUCTURE TO CLIMATE CHANGE CITY OF WELLAND STORMWATER AND WASTEWATER INFRASTRUCTURE Final Report Development of Projected Intensity-Duration-Frequency
ANSWER KEY. Part I: Weather and Climate. Lab 16 Answer Key. Explorations in Meteorology 72
 ANSWER KEY Part I: Weather and Climate Table 2 lists the maximum and minimum temperatures (in F) and precipitation (in inches) for every day during April 2003 at Fairbanks, Alaska. You will compare your
First step: Construction of Extreme Rainfall timeseries
 First step: Construction of Extreme Rainfall timeseries You may compile timeseries of extreme rainfalls from accumulated intervals within the environment of Hydrognomon or import your existing data e.g.
Stochastic disaggregation of spatial-temporal rainfall with limited data
 XXVI General Assembly of the European Geophysical Society Nice, France, 25-3 March 2 Session NP5.3/ Scaling, multifractals and nonlinearity in geophysics: Stochastic rainfall modelling: scaling and other
Temporal Disaggregation of Daily Precipitation Data in a Changing Climate
 Temporal Disaggregation of Daily Precipitation Data in a Changing Climate by Karen M. Wey thesis presented to the University of Waterloo in fulfillment of the thesis requirement for the degree of Master
Alex J. Cannon Climate Research Division Environment and Climate Change Canada GEWEX Open Science Conference Canmore, AB May 9, 2018
 Projected intensification of sub-daily rainfall extremes in convection-permitting climate model simulations over North America: Implications for future Intensity-Duration-Frequency curves Alex J. Cannon
Changes to Extreme Precipitation Events: What the Historical Record Shows and What It Means for Engineers
 Changes to Extreme Precipitation Events: What the Historical Record Shows and What It Means for Engineers Geoffrey M Bonnin National Oceanic and Atmospheric Administration National Weather Service Office
A Spatial-Temporal Downscaling Approach To Construction Of Rainfall Intensity-Duration- Frequency Relations In The Context Of Climate Change
 City University of New York (CUNY) CUNY Academic Works International Conference on Hydroinformatics 8-1-2014 A Spatial-Temporal Downscaling Approach To Construction Of Rainfall Intensity-Duration- Frequency
Muhammad Noor* & Tarmizi Ismail
 Malaysian Journal of Civil Engineering 30(1):13-22 (2018) DOWNSCALING OF DAILY AVERAGE RAINFALL OF KOTA BHARU KELANTAN, MALAYSIA Muhammad Noor* & Tarmizi Ismail Department of Hydraulic and Hydrology, Faculty
CLIMATE CHANGE IMPACT PREDICTION IN UPPER MAHAWELI BASIN
 6 th International Conference on Structural Engineering and Construction Management 2015, Kandy, Sri Lanka, 11 th -13 th December 2015 SECM/15/163 CLIMATE CHANGE IMPACT PREDICTION IN UPPER MAHAWELI BASIN
Modelling changes in the runoff regime in Slovakia using high resolution climate scenarios
 Modelling changes in the runoff regime in Slovakia using high resolution climate scenarios K. HLAVČOVÁ, R. VÝLETA, J. SZOLGAY, S. KOHNOVÁ, Z. MACUROVÁ & P. ŠÚREK Department of Land and Water Resources
5.0 WHAT IS THE FUTURE ( ) WEATHER EXPECTED TO BE?
 WEATHER EXPECTED TO BE?") 5.0 WHAT IS THE FUTURE (2040-2049) WEATHER EXPECTED TO BE? This chapter presents some illustrative results for one station, Pearson Airport, extracted from the hour-by-hour simulations of the future period
5.0 WHAT IS THE FUTURE (2040-2049) WEATHER EXPECTED TO BE? This chapter presents some illustrative results for one station, Pearson Airport, extracted from the hour-by-hour simulations of the future period
A downscaling and adjustment method for climate projections in mountainous regions
 A downscaling and adjustment method for climate projections in mountainous regions applicable to energy balance land surface models D. Verfaillie, M. Déqué, S. Morin, M. Lafaysse Météo-France CNRS, CNRM
Application of Radar QPE. Jack McKee December 3, 2014
 Application of Radar QPE Jack McKee December 3, 2014 Topics Context Precipitation Estimation Techniques Study Methodology Preliminary Results Future Work Questions Introduction Accurate precipitation data
Reliability of Daily and Annual Stochastic Rainfall Data Generated from Different Data Lengths and Data Characteristics
 Reliability of Daily and Annual Stochastic Rainfall Data Generated from Different Data Lengths and Data Characteristics 1 Chiew, F.H.S., 2 R. Srikanthan, 2 A.J. Frost and 1 E.G.I. Payne 1 Department of
Spatiotemporal Variation of Extreme Rainfall Events in Greater New York Area
 1 Spatiotemporal Variation of Extreme Rainfall Events in Greater New York Area Ali Hamidi, CCNY, NOAA-CREST Naresh Devineni, CCNY, NOAA-CREST James F. Booth, CCNY, NOAA-CREST Ralph R. Ferraro, NOAA STAR,
METEOROLOGICAL SERVICE JAMAICA CLIMATE BRANCH
 METEOROLOGICAL SERVICE JAMAICA CLIMATE BRANCH PRELIMINARY MONTHLY RAINFALL SUMMARY FOR JANUARY 2016 Introduction This rainfall summary is prepared by the Climate Branch of the Meteorological Service, Jamaica.
Heavier summer downpours with climate change revealed by weather forecast resolution model
 SUPPLEMENTARY INFORMATION DOI: 10.1038/NCLIMATE2258 Heavier summer downpours with climate change revealed by weather forecast resolution model Number of files = 1 File #1 filename: kendon14supp.pdf File
Confronting Climate Change in the Great Lakes Region. Technical Appendix Climate Change Projections EXTREME EVENTS
 Confronting Climate Change in the Great Lakes Region Technical Appendix Climate Change Projections EXTREME EVENTS Human health and well-being, as well as energy requirements, building standards, agriculture
International Journal of Advance Engineering and Research Development
 Scientific Journal of Impact Factor (SJIF): 4.72 e-issn (O): 2348-4470 p-issn (P): 2348-6406 International Journal of Advance Engineering and Research Development NATIONAL CONFERENCE ON APPLICATIONS OF
Using PRISM Climate Grids and GIS for Extreme Precipitation Mapping
 Using PRISM Climate Grids and GIS for Extreme Precipitation Mapping George H. Taylor, State Climatologist Oregon Climate Service 316 Strand Ag Hall Oregon State University Corvallis OR 97331-2209 Tel:
Artificial Neural Network Prediction of Future Rainfall Intensity
 Ryan Patrick McGehee Dr. Puneet Srivastava Artificial Neural Network Prediction of Future Rainfall Intensity A Precursor to Understanding Climate Change Outcomes for the Southeastern United States Why
Climate Models and Snow: Projections and Predictions, Decades to Days
 Climate Models and Snow: Projections and Predictions, Decades to Days Outline Three Snow Lectures: 1. Why you should care about snow 2. How we measure snow 3. Snow and climate modeling The observational
Summary of the 2017 Spring Flood
 Ottawa River Regulation Planning Board Commission de planification de la régularisation de la rivière des Outaouais The main cause of the exceptional 2017 spring flooding can be described easily in just
Will a warmer world change Queensland s rainfall?
 Will a warmer world change Queensland s rainfall? Nicholas P. Klingaman National Centre for Atmospheric Science-Climate Walker Institute for Climate System Research University of Reading The Walker-QCCCE
Appendix D. Model Setup, Calibration, and Validation
 . Model Setup, Calibration, and Validation Lower Grand River Watershed TMDL January 1 1. Model Selection and Setup The Loading Simulation Program in C++ (LSPC) was selected to address the modeling needs
1. Evaluation of maximum daily temperature
 1. Evaluation of maximum daily temperature The cumulative distribution of maximum daily temperature is shown in Figure S1. Overall, among all of the 23 states, the cumulative distributions of daily maximum
Estimation of extreme flow quantiles and quantile uncertainty for ungauged catchments
 Quantification and Reduction of Predictive Uncertainty for Sustainable Water Resources Management (Proceedings of Symposium HS2004 at IUGG2007, Perugia, July 2007). IAHS Publ. 313, 2007. 417 Estimation
Central Ohio Air Quality End of Season Report. 111 Liberty Street, Suite 100 Columbus, OH Mid-Ohio Regional Planning Commission
 217 218 Central Ohio Air Quality End of Season Report 111 Liberty Street, Suite 1 9189-2834 1 Highest AQI Days 122 Nov. 217 Oct. 218 July 13 Columbus- Maple Canyon Dr. 11 July 14 London 11 May 25 New Albany
Historical and Modelled Climate Data issues with Extreme Weather: An Agricultural Perspective. Neil Comer, Ph.D.
 Historical and Modelled Climate Data issues with Extreme Weather: An Agricultural Perspective Neil Comer, Ph.D. When Crops are in the fields it s looking good: Trend in Summer Temperature (L) & Summer
SOUTH MOUNTAIN WEATHER STATION: REPORT FOR QUARTER 2 (APRIL JUNE) 2011
 2011") SOUTH MOUNTAIN WEATHER STATION: REPORT FOR QUARTER 2 (APRIL JUNE) 2011 Prepared for ESTANCIA BASIN WATERSHED HEALTH, RESTORATION AND MONITORING STEERING COMMITTEE c/o CLAUNCH-PINTO SOIL AND WATER CONSERVATION
SOUTH MOUNTAIN WEATHER STATION: REPORT FOR QUARTER 2 (APRIL JUNE) 2011 Prepared for ESTANCIA BASIN WATERSHED HEALTH, RESTORATION AND MONITORING STEERING COMMITTEE c/o CLAUNCH-PINTO SOIL AND WATER CONSERVATION
Impact of climate change on Australian flood risk: A review of recent evidence
 Impact of climate change on Australian flood risk: A review of recent evidence 30/5/2018 FMA Conference, Gold Coast S Westra 1, B Bennett 1, J Evans 2, F Johnson 3, M Leonard 1, A Sharma 3, C Wasko 4,
Speedwell High Resolution WRF Forecasts. Application
 Speedwell High Resolution WRF Forecasts Speedwell weather are providers of high quality weather data and forecasts for many markets. Historically we have provided forecasts which use a statistical bias
FUTURE CARIBBEAN CLIMATES FROM STATISTICAL AND DYNAMICAL DOWNSCALING
 FUTURE CARIBBEAN CLIMATES FROM STATISTICAL AND DYNAMICAL DOWNSCALING Arnoldo Bezanilla Morlot Center For Atmospheric Physics Institute of Meteorology, Cuba The Caribbean Community Climate Change Centre
5.2 PRE-PROCESSING OF ATMOSPHERIC FORCING FOR ENSEMBLE STREAMFLOW PREDICTION
 5.2 PRE-PROCESSING OF ATMOSPHERIC FORCING FOR ENSEMBLE STREAMFLOW PREDICTION John Schaake*, Sanja Perica, Mary Mullusky, Julie Demargne, Edwin Welles and Limin Wu Hydrology Laboratory, Office of Hydrologic
Hidden Markov Models for precipitation
 Hidden Markov Models for precipitation Pierre Ailliot Université de Brest Joint work with Peter Thomson Statistics Research Associates (NZ) Page 1 Context Part of the project Climate-related risks for
Downscaling in Time. Andrew W. Robertson, IRI. Advanced Training Institute on Climate Variability and Food Security, 12 July 2002
 Downscaling in Time Andrew W. Robertson, IRI Advanced Training Institute on Climate Variability and Food Security, 12 July 2002 Preliminaries Crop yields are driven by daily weather variations! Current
What makes it difficult to predict extreme climate events in the long time scales?
 What makes it difficult to predict extreme climate events in the long time scales? Monirul Mirza Department of Physical and Environmental Sciences University of Toronto at Scarborough Email: monirul.mirza@utoronto.ca
Appendix O. Sediment Transport Modelling Technical Memorandum
 Appendix O Sediment Transport Modelling Technical Memorandum w w w. b a i r d. c o m Baird o c e a n s engineering l a k e s design r i v e r s science w a t e r s h e d s construction Final Report Don
Canadian Climate Data and Scenarios (CCDS) ccds-dscc.ec.gc.ca
 ccds-dscc.ec.gc.ca") Canadian Climate Data and Scenarios (CCDS) ccds-dscc.ec.gc.ca Benita Tam Canadian Centre for Climate Modelling and Analysis (CCCma) Climate Research Division (CRD), Science and Technology Branch Environment
Canadian Climate Data and Scenarios (CCDS) ccds-dscc.ec.gc.ca Benita Tam Canadian Centre for Climate Modelling and Analysis (CCCma) Climate Research Division (CRD), Science and Technology Branch Environment
Weather Station Data Quality Assessment
 Weather Station Data Quality Assessment Satoshi Hirabayashi Version 1.3 August 17, 2017 The Davey Tree Expert Company, 5 Moon Library, State University of New York, Syracuse, New York 13210, United States
138 ANALYSIS OF FREEZING RAIN PATTERNS IN THE SOUTH CENTRAL UNITED STATES: Jessica Blunden* STG, Inc., Asheville, North Carolina
 138 ANALYSIS OF FREEZING RAIN PATTERNS IN THE SOUTH CENTRAL UNITED STATES: 1979 2009 Jessica Blunden* STG, Inc., Asheville, North Carolina Derek S. Arndt NOAA National Climatic Data Center, Asheville,
Presented by Larry Rundquist Alaska-Pacific River Forecast Center Anchorage, Alaska April 14, 2009
 Presented by Larry Rundquist Alaska-Pacific River Forecast Center Anchorage, Alaska April 14, 2009 Presentation Outline Who we are Breakup characteristics Climate and weather influences 2009 breakup outlook
Training: Climate Change Scenarios for PEI. Training Session April Neil Comer Research Climatologist
 Training: Climate Change Scenarios for PEI Training Session April 16 2012 Neil Comer Research Climatologist Considerations: Which Models? Which Scenarios?? How do I get information for my location? Uncertainty
Intensity-Duration-Frequency Analysis of Rainfall for a Site in Chennai City
 Intensity-Duration-Frequency Analysis of Rainfall for a Site in Chennai City James Jesudasan Julius Karunya Institute of Technology and Sciences, Coimbatore IRCC Intern, Indian Institute of Technology
Development of Rainfall Intensity-Duration-Frequency (IDF) Relationships for Siti Zone, In Case of Ethiopia Somali Regional State Abstract Keywords:
 Relationships for Siti Zone, In Case of Ethiopia Somali Regional State Abstract Keywords:") Development of Rainfall Intensity-Duration-Frequency (IDF) Relationships for Siti Zone, In Case of Ethiopia Somali Regional State Yohannes Gerezihier Gebremedhin Lecturer, Department of Natural Resources
Development of Rainfall Intensity-Duration-Frequency (IDF) Relationships for Siti Zone, In Case of Ethiopia Somali Regional State Yohannes Gerezihier Gebremedhin Lecturer, Department of Natural Resources
Climpact2 and regional climate models
 Climpact2 and regional climate models David Hein-Griggs Scientific Software Engineer 18 th February 2016 What is the Climate System?? What is the Climate System? Comprises the atmosphere, hydrosphere,
Bias correction of Dynamic Downscaled Typhoons Rainfall Data for Hydrological Applications
 Bias correction of Dynamic Downscaled Typhoons Rainfall Data for Hydrological Applications National Science and Technology Center for Disaster Reduction Dr. Yuan-Fong Su 27 May 2015 2015 International
Overview of Extreme Value Analysis (EVA)
") Overview of Extreme Value Analysis (EVA) Brian Reich North Carolina State University July 26, 2016 Rossbypalooza Chicago, IL Brian Reich Overview of Extreme Value Analysis (EVA) 1 / 24 Importance of extremes
Overview of Extreme Value Analysis (EVA) Brian Reich North Carolina State University July 26, 2016 Rossbypalooza Chicago, IL Brian Reich Overview of Extreme Value Analysis (EVA) 1 / 24 Importance of extremes
The Analysis of Uncertainty of Climate Change by Means of SDSM Model Case Study: Kermanshah
 World Applied Sciences Journal 23 (1): 1392-1398, 213 ISSN 1818-4952 IDOSI Publications, 213 DOI: 1.5829/idosi.wasj.213.23.1.3152 The Analysis of Uncertainty of Climate Change by Means of SDSM Model Case
Toward the new CH2018 climate scenarios for Switzerland
 Federal Department of Home Affairs FDHA Federal Office of Meteorology and Climatology MeteoSwiss Toward the new CH2018 climate scenarios for Switzerland Andreas Fischer, Abteilung Klima, MeteoSchweiz Elias
Renewal and Update of MTO IDF Curves: Defining the Uncertainty
 Renewal and Update of MTO IDF Curves: Defining the Uncertainty Eric D. Soulis, Daniel Princz and John Wong University of Waterloo, Waterloo, Ontario. Received 204 05 4, accepted 205 0 29, published 205
METEOROLOGICAL SERVICE JAMAICA CLIMATE BRANCH
 METEOROLOGICAL SERVICE JAMAICA CLIMATE BRANCH PRELIMINARY MONTHLY RAINFALL SUMMARY FOR MARCH 2016 Introduction This rainfall summary is prepared by the Climate Branch of the Meteorological Service, Jamaica.
PRICING AND PROBABILITY DISTRIBUTIONS OF ATMOSPHERIC VARIABLES
 PRICING AND PROBABILITY DISTRIBUTIONS OF ATMOSPHERIC VARIABLES TECHNICAL WHITE PAPER WILLIAM M. BRIGGS Abstract. Current methods of assessing the probability distributions of atmospheric variables are
NASA Products to Enhance Energy Utility Load Forecasting
 NASA Products to Enhance Energy Utility Load Forecasting Erica Zell, Battelle zelle@battelle.org, Arlington, VA ESIP 2010 Summer Meeting, Knoxville, TN, July 20-23 Project Overview Funded by the NASA Applied
INDIAN INSTITUTE OF SCIENCE STOCHASTIC HYDROLOGY. Lecture -27 Course Instructor : Prof. P. P. MUJUMDAR Department of Civil Engg., IISc.
 INDIAN INSTITUTE OF SCIENCE STOCHASTIC HYDROLOGY Lecture -27 Course Instructor : Prof. P. P. MUJUMDAR Department of Civil Engg., IISc. Summary of the previous lecture Frequency factors Normal distribution
Multivariate Regression Model Results
 Updated: August, 0 Page of Multivariate Regression Model Results 4 5 6 7 8 This exhibit provides the results of the load model forecast discussed in Schedule. Included is the forecast of short term system
New Intensity-Frequency- Duration (IFD) Design Rainfalls Estimates
 Design Rainfalls Estimates") New Intensity-Frequency- Duration (IFD) Design Rainfalls Estimates Janice Green Bureau of Meteorology 17 April 2013 Current IFDs AR&R87 Current IFDs AR&R87 Current IFDs - AR&R87 Options for estimating
New Intensity-Frequency- Duration (IFD) Design Rainfalls Estimates Janice Green Bureau of Meteorology 17 April 2013 Current IFDs AR&R87 Current IFDs AR&R87 Current IFDs - AR&R87 Options for estimating
Downscaled Climate Change Projection for the Department of Energy s Savannah River Site
 Downscaled Climate Change Projection for the Department of Energy s Savannah River Site Carolinas Climate Resilience Conference Charlotte, North Carolina: April 29 th, 2014 David Werth Atmospheric Technologies
11B.1 OPTIMAL APPLICATION OF CLIMATE DATA TO THE DEVELOPMENT OF DESIGN WIND SPEEDS
 11B.1 OPTIMAL APPLICATION OF CLIMATE DATA TO THE DEVELOPMENT OF DESIGN WIND SPEEDS Andries C. Kruger * South African Weather Service, Pretoria, South Africa Johan V. Retief University of Stellenbosch,