Central limit theorem - go to web applet
|
|
|
- Norah Bailey
- 5 years ago
- Views:
Transcription
1 Central limit theorem - go to web applet
2

3


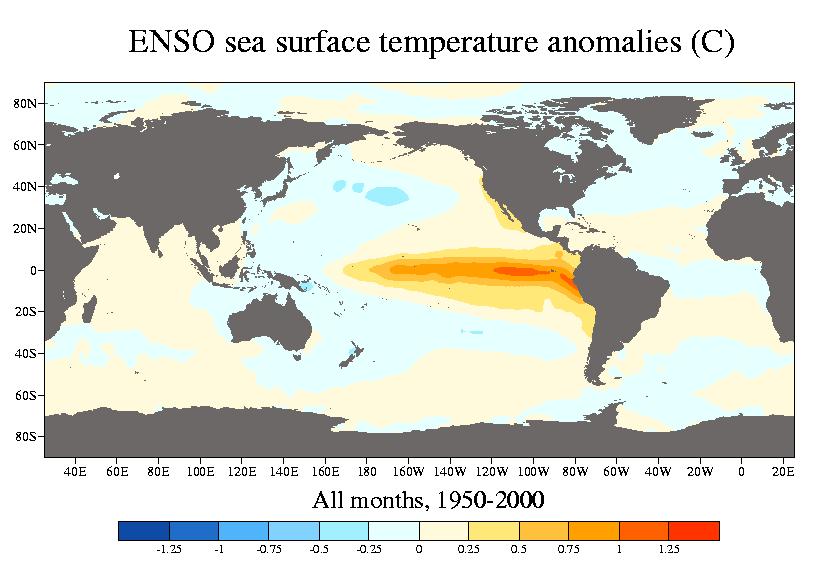
 + Z(55N,115W) -")
4 Correlation maps vs. regression maps PNA is a time series of fluctuations in 500 mb heights PNA = 0.25 * [ Z(20N,160W) - Z(45N,165W) + Z(55N,115W) - Z(30N,85W) ] index vs. time
5 Correlation maps vs. regression maps PNA is a time series of fluctuations in 500 mb heights PNA = 0.25 * [ Z(20N,160W) - Z(45N,165W) + Z(55N,115W) - Z(30N,85W) ] PNA - Correlation map (r values of each point with index) PNA - Regression map (meters/std deviation of index) r = x' y' σ x σ y r = x' y' σ x σ y σ y Correlation maps put each point on equal footing Regression maps show magnitude of typical variability
6 Empirical Orthogonal Functions (EOFs): An overview What are the dominant patterns of variabililty in time and space? Mathematical technique which decomposes your data matrix into spatial structures (EOFs) and associated amplitude time series (PCs) The EOFs and PCs are constructed to efficiently explain the maximum amount of variance in the data set. By construction, the EOFs are orthogonal to each other, as are the PCs. In general, the majority of the variance in a data set can be explained with just a few EOFs. Provide an objective method for finding structure in a data set, but interpretation requires physical facts or intuition.
7 3 Products of Principle Component Analysis Singular Value Decomposition (SVD) X = UΣV T 1) Eigenvectors Some 2-D Data (X) 2) Eigenvalues 3) Principle Components Eigenanalysis XX T = C; CE = ΛE
 3) Principle Components Variations explained in the time")
8 Examples for Today 1) Eigenvectors Variations explained in space (MAPS) Fake and Real Space- Time Data (X) 2) Eigenvalues - % of Variance explained (spectrum) 3) Principle Components Variations explained in the time (TIMESERIES)
9 Eigenvectors, Eigenvalues, PC s Eigenvectors explain variance in one dimension; Principle components explain variance in the other dimension. Each eigenvector has a corresponding principle component. The PAIR define a mode that explains variance. Each eigenvector/pc pair has an associated eigenvalue which relates to how much of the total variance is explained by that mode.
10 EOF s and PC s for geophysical data 1 st EOF is the spatial pattern which explains the most variance of the data in space and time. The 1 st principal component is the time series of the fluctuations of that pattern. 2 nd EOF is the spatial pattern that explains the most of the remaining variance. 2 nd P.C. is the associated time series EOFs are orthogonal to each other (i.e., e 1.e 2 = 0, where e is vector representing the spatial pattern), and P.C.s are orthogonal to each other (i.e., t 1.t 2 = 0, where t is vector of time series) In general, the majority of the variance in a data set can be explained with just a few EOFs. Go to Joe C. s photo example.
11 EOF s and PC s for geophysical data By construction, the EOFs are orthogonal to each other, as are the PCs. Provide an objective method for finding structure in a data set, but interpretation requires physical facts or intuition.
12 EOFs: An example based on phony data
13 EOF 1 EOF 2 PC 1 PC 2
14 EOF 1-60% variance expl. EOF 2-40% variance expl. PC 1 PC 2
15 EOFS: What are they mathematically? Say you have a 2-D data matrix X, where the rows are measurements in time, the columns are measurements in space. The EOFs are eigenvectors of the dispersion matrix X*X T Each eigenvector has an associated eigenvalue which relates to how much of the total variance is explained by that EOF. By solving for the eigenvectors, you have diagonalized the dispersion matrix. This is a coordinate transformation, mapping X*X T into a space where variations are uncorrelated with each other. The PCs and EOFs are related directly through the original data set. The PCs may be obtained by projecting the data set onto the EOFs, and vice versa.
16 Eigenvalue Spectrum EOF 1-60% variance expl. EOF 2-40% variance expl. PC 1 PC 2
17 EOFs: Example 2 based on contrived data Data
18 Data EOF 1-65% variance expl. EOF 2-35% variance expl. PC 1 PC 2
19 EOFs of Real Data: Winter SLP anomalies EOF 1: AO/NAM (23% expl). EOF 2: PNA (13% expl.) EOF 3: non-distinct(10% expl.)
 EOF 2 (PNA) EOF 3 (?) PC1 (AO/NAM) PC2 (PNA) PC3 (?")
20 EOFs of seal level pressure in the northern hemisphere EOF 1 (AO/NAM) EOF 2 (PNA) EOF 3 (?) PC1 (AO/NAM) PC2 (PNA) PC3 (?)

21
22 EOF significance Each EOF / PC pair comes with an associated eigenvalue First 25 Eigenvalues for DJF SLP The normalized eigenvalues (each eigenvalue divided by the sum of all of the eigenvalues) tells you the percent of variance explained by that EOF / PC pair. Eigenvalues need to be well seperated from each other to be considered distinct modes.
23 EOF significance: The North Test North et al (1982) provide estimate of error in estimating eigenvalues Requires estimating DOF of the data set. If eigenvalues overlap, those EOFs cannot be considered distinct. Any linear combination of overlapping EOFs is an equally viable structure. First 25 Eigenvalues for DJF SLP Example of overlapping eigenvalues These two just barely overlap. Need physical intuition to help judge.
24 Validity of EOFs: Questions to ask Is the variance explained more than expected for null hypothesis (red noise, white noise, etc.)? Do we have an a priori reason for expecting this structure? Does it fit with a physical theory? Are the EOFs sensitive to choice of spatial domain? Are the EOFs sensitive to choice of sample? If data set is subdivided (in time), do you still get the same EOFs?
25 EOFs: Practical Considerations EOFs are easy to calculate, difficult to interpret. There are no hard and fast rules, physical intuition is a must. EOFs are created using linear methods, so they only capture linear relationships. Due to the constraint of orthogonality, EOFs tend to create wave-like structures, even in data sets of pure noise. So pretty so suggestive so meaningless. Beware of this. By nature, EOFs give are fixed spatial patterns which only vary in strength and in sign. E.g., the positive phase of an EOF looks exactly like the negative phase, just with its sign changed. Many phenomena in the climate system don t exhibit this kind of symmetry, so EOFs can t resolve them properly.

26


27 Global EOFs (illustrates than domain size matters )

28 Global EOFs

29 Arctic Oscillation in different phases what are the influences on temperature?
30

31 PDO I st EOF of Pacific sea surface temperatures Be careful!!!

32 Be careful!!! What oscillation? What decadal?
DATA MINING LECTURE 8. Dimensionality Reduction PCA -- SVD
 DATA MINING LECTURE 8 Dimensionality Reduction PCA -- SVD The curse of dimensionality Real data usually have thousands, or millions of dimensions E.g., web documents, where the dimensionality is the vocabulary
Machine Learning (Spring 2012) Principal Component Analysis
 Principal Component Analysis") 1-71 Machine Learning (Spring 1) Principal Component Analysis Yang Xu This note is partly based on Chapter 1.1 in Chris Bishop s book on PRML and the lecture slides on PCA written by Carlos Guestrin in
1-71 Machine Learning (Spring 1) Principal Component Analysis Yang Xu This note is partly based on Chapter 1.1 in Chris Bishop s book on PRML and the lecture slides on PCA written by Carlos Guestrin in
Principal Component Analysis of Sea Surface Temperature via Singular Value Decomposition
 Principal Component Analysis of Sea Surface Temperature via Singular Value Decomposition SYDE 312 Final Project Ziyad Mir, 20333385 Jennifer Blight, 20347163 Faculty of Engineering Department of Systems
Fig.3.1 Dispersion of an isolated source at 45N using propagating zonal harmonics. The wave speeds are derived from a multiyear 500 mb height daily
 Fig.3.1 Dispersion of an isolated source at 45N using propagating zonal harmonics. The wave speeds are derived from a multiyear 500 mb height daily data set in January. The four panels show the result
Singular Value Decomposition
 Singular Value Decomposition Motivatation The diagonalization theorem play a part in many interesting applications. Unfortunately not all matrices can be factored as A = PDP However a factorization A =
Eigenvalues and diagonalization
 Eigenvalues and diagonalization Patrick Breheny November 15 Patrick Breheny BST 764: Applied Statistical Modeling 1/20 Introduction The next topic in our course, principal components analysis, revolves
Dimensionality Reduction: PCA. Nicholas Ruozzi University of Texas at Dallas
 Dimensionality Reduction: PCA Nicholas Ruozzi University of Texas at Dallas Eigenvalues λ is an eigenvalue of a matrix A R n n if the linear system Ax = λx has at least one non-zero solution If Ax = λx
Snapshots of sea-level pressure are dominated in mid-latitude regions by synoptic-scale features known as cyclones (SLP minima) and anticyclones (SLP
 and anticyclones (SLP") 1 Snapshots of sea-level pressure are dominated in mid-latitude regions by synoptic-scale features known as cyclones (SLP minima) and anticyclones (SLP maxima). These features have lifetimes on the order
1 Snapshots of sea-level pressure are dominated in mid-latitude regions by synoptic-scale features known as cyclones (SLP minima) and anticyclones (SLP maxima). These features have lifetimes on the order
Principal Components Analysis (PCA)
") Principal Components Analysis (PCA) Principal Components Analysis (PCA) a technique for finding patterns in data of high dimension Outline:. Eigenvectors and eigenvalues. PCA: a) Getting the data b) Centering
Principal Components Analysis (PCA) Principal Components Analysis (PCA) a technique for finding patterns in data of high dimension Outline:. Eigenvectors and eigenvalues. PCA: a) Getting the data b) Centering
Clara Deser*, James W. Hurrell and Adam S. Phillips. Climate and Global Dynamics Division. National Center for Atmospheric Research
 1 2 Supplemental Material 3 4 5 The Role of the North Atlantic Oscillation in European Climate Projections 6 7 Clara Deser*, James W. Hurrell and Adam S. Phillips 8 9 10 11 Climate and Global Dynamics
What is Principal Component Analysis?
 What is Principal Component Analysis? Principal component analysis (PCA) Reduce the dimensionality of a data set by finding a new set of variables, smaller than the original set of variables Retains most
Structure in Data. A major objective in data analysis is to identify interesting features or structure in the data.
 Structure in Data A major objective in data analysis is to identify interesting features or structure in the data. The graphical methods are very useful in discovering structure. There are basically two
Lecture: Face Recognition and Feature Reduction
 Lecture: Face Recognition and Feature Reduction Juan Carlos Niebles and Ranjay Krishna Stanford Vision and Learning Lab Lecture 11-1 Recap - Curse of dimensionality Assume 5000 points uniformly distributed
Principal Component Analysis-I Geog 210C Introduction to Spatial Data Analysis. Chris Funk. Lecture 17
 Principal Component Analysis-I Geog 210C Introduction to Spatial Data Analysis Chris Funk Lecture 17 Outline Filters and Rotations Generating co-varying random fields Translating co-varying fields into
MATH 829: Introduction to Data Mining and Analysis Principal component analysis
 1/11 MATH 829: Introduction to Data Mining and Analysis Principal component analysis Dominique Guillot Departments of Mathematical Sciences University of Delaware April 4, 2016 Motivation 2/11 High-dimensional
On Sampling Errors in Empirical Orthogonal Functions
 3704 J O U R N A L O F C L I M A T E VOLUME 18 On Sampling Errors in Empirical Orthogonal Functions ROBERTA QUADRELLI, CHRISTOPHER S. BRETHERTON, AND JOHN M. WALLACE University of Washington, Seattle,
4. Matrix Methods for Analysis of Structure in Data Sets:
 ATM 552 Notes: Matrix Methods: EOF, SVD, ETC. D.L.Hartmann Page 68 4. Matrix Methods for Analysis of Structure in Data Sets: Empirical Orthogonal Functions, Principal Component Analysis, Singular Value
December 20, MAA704, Multivariate analysis. Christopher Engström. Multivariate. analysis. Principal component analysis
 .. December 20, 2013 Todays lecture. (PCA) (PLS-R) (LDA) . (PCA) is a method often used to reduce the dimension of a large dataset to one of a more manageble size. The new dataset can then be used to make
Lecture: Face Recognition and Feature Reduction
 Lecture: Face Recognition and Feature Reduction Juan Carlos Niebles and Ranjay Krishna Stanford Vision and Learning Lab 1 Recap - Curse of dimensionality Assume 5000 points uniformly distributed in the
Principal Component Analysis. Applied Multivariate Statistics Spring 2012
 Principal Component Analysis Applied Multivariate Statistics Spring 2012 Overview Intuition Four definitions Practical examples Mathematical example Case study 2 PCA: Goals Goal 1: Dimension reduction
Principal Component Analysis
 Principal Component Analysis Yingyu Liang yliang@cs.wisc.edu Computer Sciences Department University of Wisconsin, Madison [based on slides from Nina Balcan] slide 1 Goals for the lecture you should understand
PCA, Kernel PCA, ICA
 PCA, Kernel PCA, ICA Learning Representations. Dimensionality Reduction. Maria-Florina Balcan 04/08/2015 Big & High-Dimensional Data High-Dimensions = Lot of Features Document classification Features per
The Forcing of the Pacific Decadal Oscillation
 The Forcing of the Pacific Decadal Oscillation Schneider and Cornuelle, 2005 Patrick Shaw 3/29/06 Overlying Questions What processes statistically influence variability in the PDO? On what time scales
Multivariate Statistical Analysis
 Multivariate Statistical Analysis Fall 2011 C. L. Williams, Ph.D. Lecture 4 for Applied Multivariate Analysis Outline 1 Eigen values and eigen vectors Characteristic equation Some properties of eigendecompositions
Covariance to PCA. CS 510 Lecture #8 February 17, 2014
 Covariance to PCA CS 510 Lecture 8 February 17, 2014 Status Update Programming Assignment 2 is due March 7 th Expect questions about your progress at the start of class I still owe you Assignment 1 back
Notes on Latent Semantic Analysis
 Notes on Latent Semantic Analysis Costas Boulis 1 Introduction One of the most fundamental problems of information retrieval (IR) is to find all documents (and nothing but those) that are semantically
Ch.3 Canonical correlation analysis (CCA) [Book, Sect. 2.4]
![Ch.3 Canonical correlation analysis (CCA) [Book, Sect. 2.4]](/thumbs/89/97560498.jpg "Ch.3 Canonical correlation analysis (CCA) [Book, Sect. 2.4]") Ch.3 Canonical correlation analysis (CCA) [Book, Sect. 2.4] With 2 sets of variables {x i } and {y j }, canonical correlation analysis (CCA), first introduced by Hotelling (1936), finds the linear modes
Ch.3 Canonical correlation analysis (CCA) [Book, Sect. 2.4] With 2 sets of variables {x i } and {y j }, canonical correlation analysis (CCA), first introduced by Hotelling (1936), finds the linear modes
Finding Climate Indices and Dipoles Using Data Mining
 Finding Climate Indices and Dipoles Using Data Mining Michael Steinbach, Computer Science Contributors: Jaya Kawale, Stefan Liess, Arjun Kumar, Karsten Steinhauser, Dominic Ormsby, Vipin Kumar Climate
SIO 211B, Rudnick, adapted from Davis 1
 SIO 211B, Rudnick, adapted from Davis 1 XVII.Empirical orthogonal functions Often in oceanography we collect large data sets that are time series at a group of locations. Moored current meter arrays do
CS 143 Linear Algebra Review
 CS 143 Linear Algebra Review Stefan Roth September 29, 2003 Introductory Remarks This review does not aim at mathematical rigor very much, but instead at ease of understanding and conciseness. Please see
MLCC 2015 Dimensionality Reduction and PCA
 MLCC 2015 Dimensionality Reduction and PCA Lorenzo Rosasco UNIGE-MIT-IIT June 25, 2015 Outline PCA & Reconstruction PCA and Maximum Variance PCA and Associated Eigenproblem Beyond the First Principal Component
Linear Algebra Methods for Data Mining
 Linear Algebra Methods for Data Mining Saara Hyvönen, Saara.Hyvonen@cs.helsinki.fi Spring 2007 The Singular Value Decomposition (SVD) continued Linear Algebra Methods for Data Mining, Spring 2007, University
Timescales of variability discussion
 Timescales of variability discussion Stochastic process? Randomly changing over time (at least in part).. (Probability distribution of time series) 1 Stationary process? Statistics (e.g., mean and variance)
Principal Component Analysis and Linear Discriminant Analysis
 Principal Component Analysis and Linear Discriminant Analysis Ying Wu Electrical Engineering and Computer Science Northwestern University Evanston, IL 60208 http://www.eecs.northwestern.edu/~yingwu 1/29
PCA & ICA. CE-717: Machine Learning Sharif University of Technology Spring Soleymani
 PCA & ICA CE-717: Machine Learning Sharif University of Technology Spring 2015 Soleymani Dimensionality Reduction: Feature Selection vs. Feature Extraction Feature selection Select a subset of a given
Covariance to PCA. CS 510 Lecture #14 February 23, 2018
 Covariance to PCA CS 510 Lecture 14 February 23, 2018 Overview: Goal Assume you have a gallery (database) of images, and a probe (test) image. The goal is to find the database image that is most similar
(a) If A is a 3 by 4 matrix, what does this tell us about its nullspace? Solution: dim N(A) 1, since rank(a) 3. Ax =
 If A is a 3 by 4 matrix, what does this tell us about its nullspace? Solution: dim N(A) 1, since rank(a) 3. Ax =") . (5 points) (a) If A is a 3 by 4 matrix, what does this tell us about its nullspace? dim N(A), since rank(a) 3. (b) If we also know that Ax = has no solution, what do we know about the rank of A? C(A)
. (5 points) (a) If A is a 3 by 4 matrix, what does this tell us about its nullspace? dim N(A), since rank(a) 3. (b) If we also know that Ax = has no solution, what do we know about the rank of A? C(A)
Proxy reconstructions of Pacific decadal variability. March 8, 2006
 Proxy reconstructions of Pacific decadal variability Michael N. Evans Laboratory of Tree-Ring Research/Geosciences/Atmospheric Sciences ATMO/GEOS 513 web pages: http://ic.ltrr.arizona.edu/ic/enso/ March
GI07/COMPM012: Mathematical Programming and Research Methods (Part 2) 2. Least Squares and Principal Components Analysis. Massimiliano Pontil
 2. Least Squares and Principal Components Analysis. Massimiliano Pontil") GI07/COMPM012: Mathematical Programming and Research Methods (Part 2) 2. Least Squares and Principal Components Analysis Massimiliano Pontil 1 Today s plan SVD and principal component analysis (PCA) Connection
GI07/COMPM012: Mathematical Programming and Research Methods (Part 2) 2. Least Squares and Principal Components Analysis Massimiliano Pontil 1 Today s plan SVD and principal component analysis (PCA) Connection
Introduction to Machine Learning. PCA and Spectral Clustering. Introduction to Machine Learning, Slides: Eran Halperin
 1 Introduction to Machine Learning PCA and Spectral Clustering Introduction to Machine Learning, 2013-14 Slides: Eran Halperin Singular Value Decomposition (SVD) The singular value decomposition (SVD)
Principal Component Analysis (PCA)
") Principal Component Analysis (PCA) Additional reading can be found from non-assessed exercises (week 8) in this course unit teaching page. Textbooks: Sect. 6.3 in [1] and Ch. 12 in [2] Outline Introduction
Principal Component Analysis (PCA) Additional reading can be found from non-assessed exercises (week 8) in this course unit teaching page. Textbooks: Sect. 6.3 in [1] and Ch. 12 in [2] Outline Introduction
Principal Component Analysis
 I.T. Jolliffe Principal Component Analysis Second Edition With 28 Illustrations Springer Contents Preface to the Second Edition Preface to the First Edition Acknowledgments List of Figures List of Tables
Assignment #10: Diagonalization of Symmetric Matrices, Quadratic Forms, Optimization, Singular Value Decomposition. Name:
 Assignment #10: Diagonalization of Symmetric Matrices, Quadratic Forms, Optimization, Singular Value Decomposition Due date: Friday, May 4, 2018 (1:35pm) Name: Section Number Assignment #10: Diagonalization
Dimensionality Reduction
 394 Chapter 11 Dimensionality Reduction There are many sources of data that can be viewed as a large matrix. We saw in Chapter 5 how the Web can be represented as a transition matrix. In Chapter 9, the
Notes on singular value decomposition for Math 54. Recall that if A is a symmetric n n matrix, then A has real eigenvalues A = P DP 1 A = P DP T.
 Notes on singular value decomposition for Math 54 Recall that if A is a symmetric n n matrix, then A has real eigenvalues λ 1,, λ n (possibly repeated), and R n has an orthonormal basis v 1,, v n, where
Noise & Data Reduction
 Noise & Data Reduction Paired Sample t Test Data Transformation - Overview From Covariance Matrix to PCA and Dimension Reduction Fourier Analysis - Spectrum Dimension Reduction 1 Remember: Central Limit
Lecture 13. Principal Component Analysis. Brett Bernstein. April 25, CDS at NYU. Brett Bernstein (CDS at NYU) Lecture 13 April 25, / 26
 Lecture 13 April 25, / 26") Principal Component Analysis Brett Bernstein CDS at NYU April 25, 2017 Brett Bernstein (CDS at NYU) Lecture 13 April 25, 2017 1 / 26 Initial Question Intro Question Question Let S R n n be symmetric. 1
Principal Component Analysis Brett Bernstein CDS at NYU April 25, 2017 Brett Bernstein (CDS at NYU) Lecture 13 April 25, 2017 1 / 26 Initial Question Intro Question Question Let S R n n be symmetric. 1
Ecological indicators: Software development
 Ecological indicators: Software development Sergei N. Rodionov Joint Institute for the Study of the Atmosphere and Ocean, University of Washington, Seattle, WA 98185, U.S.A. E-mail: sergei.rodionov@noaa.gov
IV. Matrix Approximation using Least-Squares
 IV. Matrix Approximation using Least-Squares The SVD and Matrix Approximation We begin with the following fundamental question. Let A be an M N matrix with rank R. What is the closest matrix to A that
Numerical Methods I Singular Value Decomposition
 Numerical Methods I Singular Value Decomposition Aleksandar Donev Courant Institute, NYU 1 donev@courant.nyu.edu 1 MATH-GA 2011.003 / CSCI-GA 2945.003, Fall 2014 October 9th, 2014 A. Donev (Courant Institute)
Interannual Teleconnection between Ural-Siberian Blocking and the East Asian Winter Monsoon
 Interannual Teleconnection between Ural-Siberian Blocking and the East Asian Winter Monsoon Hoffman H. N. Cheung 1,2, Wen Zhou 1,2 (hoffmancheung@gmail.com) 1 City University of Hong Kong Shenzhen Institute
Unsupervised Machine Learning and Data Mining. DS 5230 / DS Fall Lecture 7. Jan-Willem van de Meent
 Unsupervised Machine Learning and Data Mining DS 5230 / DS 4420 - Fall 2018 Lecture 7 Jan-Willem van de Meent DIMENSIONALITY REDUCTION Borrowing from: Percy Liang (Stanford) Dimensionality Reduction Goal:
Chapter 4: Factor Analysis
 Chapter 4: Factor Analysis In many studies, we may not be able to measure directly the variables of interest. We can merely collect data on other variables which may be related to the variables of interest.
e 2 e 1 (a) (b) (d) (c)
 (b) (d) (c)") 2.13 Rotated principal component analysis [Book, Sect. 2.2] Fig.: PCA applied to a dataset composed of (a) 1 cluster, (b) 2 clusters, (c) and (d) 4 clusters. In (c), an orthonormal rotation and (d) an
2.13 Rotated principal component analysis [Book, Sect. 2.2] Fig.: PCA applied to a dataset composed of (a) 1 cluster, (b) 2 clusters, (c) and (d) 4 clusters. In (c), an orthonormal rotation and (d) an
Problems. Looks for literal term matches. Problems:
 Problems Looks for literal term matches erms in queries (esp short ones) don t always capture user s information need well Problems: Synonymy: other words with the same meaning Car and automobile 电脑 vs.
on climate and its links with Arctic sea ice cover
 The influence of autumnal Eurasian snow cover on climate and its links with Arctic sea ice cover Guillaume Gastineau* 1, Javier García- Serrano 2 and Claude Frankignoul 1 1 Sorbonne Universités, UPMC/CNRS/IRD/MNHN,
Semiblind Source Separation of Climate Data Detects El Niño as the Component with the Highest Interannual Variability
 Semiblind Source Separation of Climate Data Detects El Niño as the Component with the Highest Interannual Variability Alexander Ilin Neural Networks Research Centre Helsinki University of Technology P.O.
Quantitative Understanding in Biology Principal Components Analysis
 Quantitative Understanding in Biology Principal Components Analysis Introduction Throughout this course we have seen examples of complex mathematical phenomena being represented as linear combinations
Dimension reduction, PCA & eigenanalysis Based in part on slides from textbook, slides of Susan Holmes. October 3, Statistics 202: Data Mining
 Dimension reduction, PCA & eigenanalysis Based in part on slides from textbook, slides of Susan Holmes October 3, 2012 1 / 1 Combinations of features Given a data matrix X n p with p fairly large, it can
Nonlinear atmospheric teleconnections
 GEOPHYSICAL RESEARCH LETTERS, VOL.???, XXXX, DOI:10.1029/, Nonlinear atmospheric teleconnections William W. Hsieh, 1 Aiming Wu, 1 and Amir Shabbar 2 Neural network models are used to reveal the nonlinear
Empirical Orthogonal Function (EOF) (Lorenz, 1956) Hotelling, H., 1935: The most predictable criterion. J. Ed. Phych., 26,
 (Lorenz, 1956) Hotelling, H., 1935: The most predictable criterion. J. Ed. Phych., 26,") Principal Component Analysis (PCA) or Empirical Orthogonal Function (EOF) (Lorenz, 1956) Hotelling, H., 1935: The most predictable criterion. J. Ed. Phych., 26, 139-142. (from Jackson, 1991 and Graham,1996
Principal Component Analysis (PCA) or Empirical Orthogonal Function (EOF) (Lorenz, 1956) Hotelling, H., 1935: The most predictable criterion. J. Ed. Phych., 26, 139-142. (from Jackson, 1991 and Graham,1996
Latent Semantic Indexing (LSI) CE-324: Modern Information Retrieval Sharif University of Technology
 CE-324: Modern Information Retrieval Sharif University of Technology") Latent Semantic Indexing (LSI) CE-324: Modern Information Retrieval Sharif University of Technology M. Soleymani Fall 2016 Most slides have been adapted from: Profs. Manning, Nayak & Raghavan (CS-276,
Latent Semantic Indexing (LSI) CE-324: Modern Information Retrieval Sharif University of Technology M. Soleymani Fall 2016 Most slides have been adapted from: Profs. Manning, Nayak & Raghavan (CS-276,
Independent Component Analysis and Its Application on Accelerator Physics
 Independent Component Analysis and Its Application on Accelerator Physics Xiaoying Pang LA-UR-12-20069 ICA and PCA Similarities: Blind source separation method (BSS) no model Observed signals are linear
Singular Value Decomposition. 1 Singular Value Decomposition and the Four Fundamental Subspaces
 Singular Value Decomposition This handout is a review of some basic concepts in linear algebra For a detailed introduction, consult a linear algebra text Linear lgebra and its pplications by Gilbert Strang
Math Fall Final Exam
 Math 104 - Fall 2008 - Final Exam Name: Student ID: Signature: Instructions: Print your name and student ID number, write your signature to indicate that you accept the honor code. During the test, you
COMPLEX PRINCIPAL COMPONENT SPECTRA EXTRACTION
 COMPLEX PRINCIPAL COMPONEN SPECRA EXRACION PROGRAM complex_pca_spectra Computing principal components o begin, click the Formation attributes tab in the AASPI-UIL window and select program complex_pca_spectra:
(a)
") Chapter 8 Subspace Methods 8. Introduction Principal Component Analysis (PCA) is applied to the analysis of time series data. In this context we discuss measures of complexity and subspace methods for
Chapter 8 Subspace Methods 8. Introduction Principal Component Analysis (PCA) is applied to the analysis of time series data. In this context we discuss measures of complexity and subspace methods for
Foundations of Computer Vision
 Foundations of Computer Vision Wesley. E. Snyder North Carolina State University Hairong Qi University of Tennessee, Knoxville Last Edited February 8, 2017 1 3.2. A BRIEF REVIEW OF LINEAR ALGEBRA Apply
Exercises * on Principal Component Analysis
 Exercises * on Principal Component Analysis Laurenz Wiskott Institut für Neuroinformatik Ruhr-Universität Bochum, Germany, EU 4 February 207 Contents Intuition 3. Problem statement..........................................
Vulnerability of economic systems
 Vulnerability of economic systems Quantitative description of U.S. business cycles using multivariate singular spectrum analysis Andreas Groth* Michael Ghil, Stéphane Hallegatte, Patrice Dumas * Laboratoire
Learning with Singular Vectors
 Learning with Singular Vectors CIS 520 Lecture 30 October 2015 Barry Slaff Based on: CIS 520 Wiki Materials Slides by Jia Li (PSU) Works cited throughout Overview Linear regression: Given X, Y find w:
Predictability and prediction of the North Atlantic Oscillation
 Predictability and prediction of the North Atlantic Oscillation Hai Lin Meteorological Research Division, Environment Canada Acknowledgements: Gilbert Brunet, Jacques Derome ECMWF Seminar 2010 September
Basics of Multivariate Modelling and Data Analysis
 Basics of Multivariate Modelling and Data Analysis Kurt-Erik Häggblom 6. Principal component analysis (PCA) 6.1 Overview 6.2 Essentials of PCA 6.3 Numerical calculation of PCs 6.4 Effects of data preprocessing
Announcements (repeat) Principal Components Analysis
 Principal Components Analysis") 4/7/7 Announcements repeat Principal Components Analysis CS 5 Lecture #9 April 4 th, 7 PA4 is due Monday, April 7 th Test # will be Wednesday, April 9 th Test #3 is Monday, May 8 th at 8AM Just hour long
4/7/7 Announcements repeat Principal Components Analysis CS 5 Lecture #9 April 4 th, 7 PA4 is due Monday, April 7 th Test # will be Wednesday, April 9 th Test #3 is Monday, May 8 th at 8AM Just hour long
ENSO Interdecadal Modulation in CCSM4: A Linear Inverse Modeling Approach
 ENSO Interdecadal Modulation in CCSM4: A Linear Inverse Modeling Approach Antonietta.Capotondi@noaa.gov and Prashant Sardeshmukh University of Colorado, CIRES NOAA Earth System Research Laboratory, PSD
Example Linear Algebra Competency Test
 Example Linear Algebra Competency Test The 4 questions below are a combination of True or False, multiple choice, fill in the blank, and computations involving matrices and vectors. In the latter case,
E = UV W (9.1) = I Q > V W
 = I Q > V W") 91 9. EOFs, SVD A common statistical tool in oceanography, meteorology and climate research are the so-called empirical orthogonal functions (EOFs). Anyone, in any scientific field, working with large
91 9. EOFs, SVD A common statistical tool in oceanography, meteorology and climate research are the so-called empirical orthogonal functions (EOFs). Anyone, in any scientific field, working with large
Preferred spatio-temporal patterns as non-equilibrium currents
 Preferred spatio-temporal patterns as non-equilibrium currents Escher Jeffrey B. Weiss Atmospheric and Oceanic Sciences University of Colorado, Boulder Arin Nelson, CU Baylor Fox-Kemper, Brown U Royce
AMOC Impacts on Climate
 AMOC Impacts on Climate Rong Zhang GFDL/NOAA, Princeton, NJ, USA Paleo-AMOC Workshop, Boulder, CO, USA May 24, 2016 Atlantic Meridional Overturning Circulation (AMOC) Kuklbrodt et al. 2007 McManus et al.,
Latent Semantic Indexing (LSI) CE-324: Modern Information Retrieval Sharif University of Technology
 CE-324: Modern Information Retrieval Sharif University of Technology") Latent Semantic Indexing (LSI) CE-324: Modern Information Retrieval Sharif University of Technology M. Soleymani Fall 2014 Most slides have been adapted from: Profs. Manning, Nayak & Raghavan (CS-276,
Latent Semantic Indexing (LSI) CE-324: Modern Information Retrieval Sharif University of Technology M. Soleymani Fall 2014 Most slides have been adapted from: Profs. Manning, Nayak & Raghavan (CS-276,
Winter Forecast for GPC Tokyo. Shotaro TANAKA Tokyo Climate Center (TCC) Japan Meteorological Agency (JMA)
 Japan Meteorological Agency (JMA)") Winter Forecast for 2013 2014 GPC Tokyo Shotaro TANAKA Tokyo Climate Center (TCC) Japan Meteorological Agency (JMA) NEACOF 5, October 29 November 1, 2013 1 Outline 1. Numerical prediction 2. Interannual
Winter Forecast for 2013 2014 GPC Tokyo Shotaro TANAKA Tokyo Climate Center (TCC) Japan Meteorological Agency (JMA) NEACOF 5, October 29 November 1, 2013 1 Outline 1. Numerical prediction 2. Interannual
Dimensionality Reduction
 Dimensionality Reduction Le Song Machine Learning I CSE 674, Fall 23 Unsupervised learning Learning from raw (unlabeled, unannotated, etc) data, as opposed to supervised data where a classification of
Statistics-and-PCA. September 7, m = 1 n. x k. k=1. (x k m) 2. Var(x) = S 2 = 1 n 1. k=1
 2. Var(x) = S 2 = 1 n 1. k=1") Statistics-and-PCA September 7, 2017 In [1]: using PyPlot 1 Mean and variance Suppose we have a black box (a distribution) that generates data points x k (samples) k = 1,...,. If we have n data points,
Statistics-and-PCA September 7, 2017 In [1]: using PyPlot 1 Mean and variance Suppose we have a black box (a distribution) that generates data points x k (samples) k = 1,...,. If we have n data points,
Definition of Antarctic Oscillation Index
 1 Definition of Antarctic Oscillation Index Daoyi Gong and Shaowu Wang Department of Geophysics, Peking University, P.R. China Abstract. Following Walker s work about his famous three oscillations published
SSA analysis and forecasting of records for Earth temperature and ice extents
 SSA analysis and forecasting of records for Earth temperature and ice extents V. Kornikov, A. Pepelyshev, A. Zhigljavsky December 19, 2016 St.Petersburg State University, Cardiff University Abstract In
Average Predictability Time. Part II: Seamless Diagnoses of Predictability on Multiple Time Scales
 1188 J O U R N A L O F T H E A T M O S P H E R I C S C I E N C E S VOLUME 66 Average Predictability Time. Part II: Seamless Diagnoses of Predictability on Multiple Time Scales TIMOTHY DELSOLE George Mason
Linear Algebra & Geometry why is linear algebra useful in computer vision?
 Linear Algebra & Geometry why is linear algebra useful in computer vision? References: -Any book on linear algebra! -[HZ] chapters 2, 4 Some of the slides in this lecture are courtesy to Prof. Octavia
Dimensionality Reduction
 Lecture 5 1 Outline 1. Overview a) What is? b) Why? 2. Principal Component Analysis (PCA) a) Objectives b) Explaining variability c) SVD 3. Related approaches a) ICA b) Autoencoders 2 Example 1: Sportsball
Math 102, Winter Final Exam Review. Chapter 1. Matrices and Gaussian Elimination
 Math 0, Winter 07 Final Exam Review Chapter. Matrices and Gaussian Elimination { x + x =,. Different forms of a system of linear equations. Example: The x + 4x = 4. [ ] [ ] [ ] vector form (or the column
Principal Component Analysis
 Principal Component Analysis Anders Øland David Christiansen 1 Introduction Principal Component Analysis, or PCA, is a commonly used multi-purpose technique in data analysis. It can be used for feature
Impacts of modes of climate variability, monsoons, ENSO, annular modes
 Impacts of modes of climate variability, monsoons, ENSO, annular modes Iracema Fonseca de Albuquerque Cavalcanti National Institute for Space Research INPE Modes of variability- preferred patterns of variability.
GEOG 4110/5100 Advanced Remote Sensing Lecture 15
 GEOG 4110/5100 Advanced Remote Sensing Lecture 15 Principal Component Analysis Relevant reading: Richards. Chapters 6.3* http://www.ce.yildiz.edu.tr/personal/songul/file/1097/principal_components.pdf *For
Efficient Observation of Random Phenomena
 Lecture 9 Efficient Observation of Random Phenomena Tokyo Polytechnic University The 1st Century Center of Excellence Program Yukio Tamura POD Proper Orthogonal Decomposition Stochastic Representation
Machine Learning. Principal Components Analysis. Le Song. CSE6740/CS7641/ISYE6740, Fall 2012
 Machine Learning CSE6740/CS7641/ISYE6740, Fall 2012 Principal Components Analysis Le Song Lecture 22, Nov 13, 2012 Based on slides from Eric Xing, CMU Reading: Chap 12.1, CB book 1 2 Factor or Component
UNIT 6: The singular value decomposition.
 UNIT 6: The singular value decomposition. María Barbero Liñán Universidad Carlos III de Madrid Bachelor in Statistics and Business Mathematical methods II 2011-2012 A square matrix is symmetric if A T
CS168: The Modern Algorithmic Toolbox Lecture #8: How PCA Works
 CS68: The Modern Algorithmic Toolbox Lecture #8: How PCA Works Tim Roughgarden & Gregory Valiant April 20, 206 Introduction Last lecture introduced the idea of principal components analysis (PCA). The
Properties of Matrices and Operations on Matrices
 Properties of Matrices and Operations on Matrices A common data structure for statistical analysis is a rectangular array or matris. Rows represent individual observational units, or just observations,
15 Singular Value Decomposition
 15 Singular Value Decomposition For any high-dimensional data analysis, one s first thought should often be: can I use an SVD? The singular value decomposition is an invaluable analysis tool for dealing
Linear Algebra (Review) Volker Tresp 2017
 Volker Tresp 2017") Linear Algebra (Review) Volker Tresp 2017 1 Vectors k is a scalar (a number) c is a column vector. Thus in two dimensions, c = ( c1 c 2 ) (Advanced: More precisely, a vector is defined in a vector space.
Linear Algebra (Review) Volker Tresp 2017 1 Vectors k is a scalar (a number) c is a column vector. Thus in two dimensions, c = ( c1 c 2 ) (Advanced: More precisely, a vector is defined in a vector space.
MIT Final Exam Solutions, Spring 2017
 MIT 8.6 Final Exam Solutions, Spring 7 Problem : For some real matrix A, the following vectors form a basis for its column space and null space: C(A) = span,, N(A) = span,,. (a) What is the size m n of