Statistical challenges in Disease Ecology
|
|
|
- Roger West
- 5 years ago
- Views:
Transcription
1 Statistical challenges in Disease Ecology Jennifer Hoeting Department of Statistics Colorado State University February 2018
2 Statistics rocks!
 including a new program in Data Science Master of")
3 Get thee to graduate school Colorado State University, Department of Statistics offers multiple options: Master of Applied Statistics (Distance and on Campus) including a new program in Data Science Master of Science PhD
4 How did I get here? Background: BS in Statistics and Psychology MS and PhD in Statistics University of Michigan University of Washington Research Develop statistical methods to solve problems in ecology Diverse areas of application: Animal abundance (prairie dogs to whales) Saving the remaining whopping cranes Stream and wetland ecology Understanding climate change Google Street View cars to detect natural gas leaks Estimating the of people who have died in the war in Syria


5 Ecology of infectious diseases Explores the relationships between 1. Diseases: Parasitic, bacterial, viral infectious 2. Hosts: animal and human 3. Their environment
6 Challenges in the ecology of infectious diseases Data can be messy and sparse You have to find the animals who are sick, they don t visit the nearest health clinic You need knowledge of mathematical biology You need to able to synthesize a broad range of statistical methods Sounds like fun!
7 Ecology Modeling Ecological models can be deterministic or stochastic Bolker, Ecological Models and Data in R, 2008 Classification of modeling approaches Mathematical Statistical Deterministic Stochastic Mechanistic Phenomenological Process Pattern
8 Mathematical Model for infectious diseases λ S I R β N I γ μ μ μ Susceptible-Infected-Recovered (SIR) model for disease transmission where the state variables are described by a set of differential equations.
9 Statistical Model for infectious diseases Logistic regression model Y i = 1 if deer i is disease positive, 0 otherwise Assume Y i Bernoulli(π i ) logit (π i )=β 0 + β 1 X 1i + β 2 X 2i where for animal i X 1i = animal age X 2i = level of exposure to disease

10

11 April 2016: The first detection of CWD in Europe
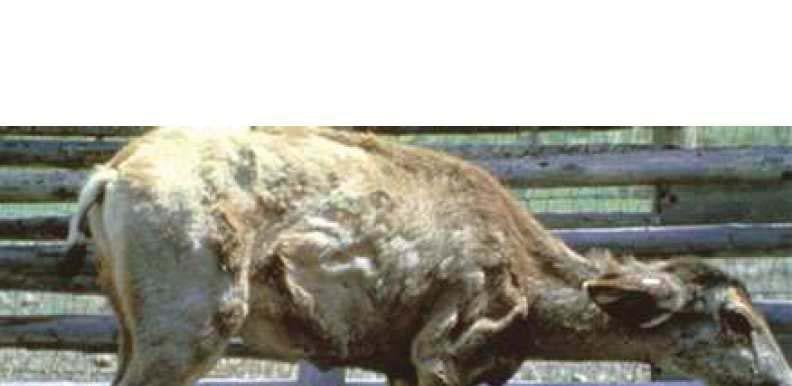
12 Chronic wasting disease: mule deer in Colorado A wide variety of statistical methods and advances based on research on chronic wasting disease 1. Estimating parameters for stochastic differential equations 2. Selecting between different dynamical models 3. Spatial statistics and issues of scale 4. Models for animal movement and genetics 5. Functional data analysis
13 CWD Transmission Deer were held at the Colorado Division of Wildlife in Fort Collins, Colorado Annual observations of cumulative mortality from two CWD epidemics in captive mule deer Epidemic 1: 1974 to 1985 Epidemic 2: 1992 to 2001 (in a new deer herd) 21 observations over time The dataset also includes the annual number of new deer added to the herd and the per capita losses due to natural deaths and removals
14 CWD Transmission We develop a type of Susceptible-Infected-Recovered (SIR) model for disease transmission where the state variables are described by a set of differential equations. Consider the state vector X(t) =(S(t), I(t), C(t)) T, where S is the number of susceptible animals, I is the number of infected animals, C is the cumulative number of deaths from CWD over time. Only C(t) and N(t) =S(t) +I(t) +C(t) are observed for t = 1,...,21. The other two state variables, S(t) and I(t), are unobserved.
15 ODE model for CWD where ds =[a S(βI + m)] dt di =[βsi I(μ + m)] dt dc =μidt β is the CWD transmission coefficient μ is the per capita CWD mortality rate } unknown a is the number of susceptible animals annually added to the population via births or importation known m is the per capita natural mortality rate We assume X(0) =(S(0), I(0), C(0)) T are (un)known initial conditions.
16 Ordinary Differential Equation Model for CWD Cumulative deaths from CWD Deterministic dynamical models can be used to determine whether or not transmission will occur. Year
17 Stochastic Differential Equation Model for CWD Cumulative deaths from CWD Stochastic dynamical models Can be used to determine the probability of disease transmission between two individuals Allow more realistic description of the transmission of disease. Year
18 SDE Model for CWD A SDE model for direct transmission of CWD is given by where ds =[a S(βI + m)]dt + B 11 dw 1 + B 12 dw 2 + B 13 dw 3, di =[βsi I(μ + m)]dt + B 21 dw 1 + B 22 dw 2 + B 23 dw 3, dc =μidt + B 31 dw 1 + B 32 dw 2 + B 33 dw 3, initial condition X(0) =(S(0), I(0), C(0)) T assumed known W is a k-dimensional standard Wiener process. B =(B ij )= Σ with Σ= a + S(βI + m) βsi 0 βsi βsi + I(μ + m) μi. 0 μi μi
19 Method 1: Parameter estimation for SDEs Goal: Statistical inference for SDE model parameters Challenges: Multivariate state space Data are partially observed, discrete, sparse. The transition density between two observations is typically unknown. Likelihood functions involving SDEs are computationally expensive
20 Method 1: Parameter estimation for SDEs Sun, Lee, Hoeting 2015 Computational Statistics and Data Analysis Improved importance sampling: Automatic tuning of importance sampler via an auxiliary parameter Parameter estimation via penalized simulated maximum likelihood where we simultaneously estimate dynamical model parameters θ and optimize the importance sampler using parameter ρ to minimize the variation of the Monte Carlo approximation of the transition density.
21 Method 1: Penalized simulated maximum likelihood (PSML) The PSML estimator (ˆθ, ˆρ) is defined by n (ˆθ, ˆρ) =arg max log 1 J h ρ subject to J i=1 j=1 n ĉv (h ρ ) s, i=1 where s 0 is a tuning parameter h ρ is the importance sampling ratio where ρ is an auxiliary parameter used to tune the importance sampling function. ĉv(h ρ ) is the sample coefficient of variation of h ρ
22 Estimated parameters for CWD 90% confidence intervals: Rate of direct transmission: ˆβ =[0.03, 0.10] Per capita CWD mortality rate: ˆμ =[0.16, 0.34]
23 Basic reproductive number R 0 The basic reproduction number R 0, is the average number of secondary infections that occur when one infected individual is introduced into a completely susceptible population. For deterministic models, if R0 > 1 = the infection persists in the population if R 0 1 = the infection will eventually die out. For stochastic models, SDE models predict the infection will die out eventually, regardless of R 0 value If R0 > 1, the infection may die out quickly, with probability ( 1 ) I(0) R 0 where I(0) is the initial number of infected animals, the infection persists with probability 1 (R 0 ) I(0)
24 Basic reproductive number R 0 For example, assuming a natural mortality rate of m = 0.15 (Miller et al., 2006) and closed susceptible population, the corresponding estimate for the basic reproductive number R 0 equals βnˆ 0 ˆμ + m 0.09N 0 with 90% confidence interval [0.07N 0 ; 0.32N 0 ], where N 0 is the initial population or susceptible size. Hence, we would expect that CWD will spread if a few infected animals are introduced to a closed susceptible population with of at least 1/ animals.
25 CWD real data example Simulated sample paths of the SDE CWD direct transmission model with estimated parameters. CWD Death Estimates via penalized importance sampling successfully capture the pattern of the CWD death data over time, especially for such a small sample size. Year
26 Method 2: Model selection for dynamical models Hierarchical models Stage 1: Observation model Stage 2: Process model (dynamical model) Stage 3: Parameter model Goal: Choose between 3 dynamical models used at stage 2 1. Ordinary differential equation (ODE) model 2. Stochastic differential equation (SDE) model 3. Continuous time Markov chain (CTMC) model Libo, Sun, Hoeting (Envirometrics, 2015) use an Approximate Bayesian Computation method (ABC-SMC)
27 Method 2: Model selection for dynamical models Approximate Bayesian Computation (ABC): Method to estimate the model parameters when the likelihood is difficult to compute Basic idea: Simulate data from the model and compute a distance function between simulated data and the observed data ABC-SMC (sequential Monte Carlo): Improve ABC by simulating data through a sequence of intermediate distributions Model selection: Compare models using Bayes factors (Kass & Raftery 1995)
28 Method 3: Spatial statistical models Linking Chronic Wasting Disease to Mule Deer Movement Scales Goal: identify scales of mule deer movement and mixing that exerted the greatest influence on the spatial pattern of CWD in northcentral Colorado. We hypothesized that three scales of mixing might control spatial variation in disease prevalence individual winter subpopulation or summer subpopulation
29 Method 3: Spatial statistical models Background: Chronic Wasting Disease (CWD): a deadly disease in deer and elk in Colorado (and elsewhere) Of keen interest because Data: CWD is a prion disease (like Mad Cow) CWD could wipe out deer population ($) Transmission to humans or other wildlife populations response (y): 3855 mule deer tested for presence of CWD from in Colorado predictors (x): age, sex, % private land, and two other GIS covariates Data are analyzed on a grid cell level because precise locations are unknown and to investigate issues related to scale

30 Method 3: Modeling Chronic Wasting Disease Study Site Colorado Kilometers
31 Method 3: Spatial statistical models Analysis: Bayesian hierarchical model Let y ij be the CWD status for the jth deer in the ith grid cell y ij π ij Bernoulli(π ij ) iid logit(π ij )=μ + xij T β + γ i + δ i where μ = overall mean (intercept) x ij = vector of covariates for the jth deer in the ith grid cell β = regression parameters γ i = spatial random effect for ith grid cell δ i = independent random effect for ith grid cell Next level of hierarchy: priors on parameters
32 Method 3: Spatial statistical models Output Parameter estimates Maps Model comparisons: which scale is appropriate? Predictions for unobserved locations For more details see: M. L. Farnsworth, J. A. Hoeting, N. T. Hobbs, M. W. Miller (2006) Linking mule deer movement scales to the spatial distribution of chronic wasting disease: a hierarchical Bayesian approach, Ecological Applications, 16(3),
33 Method 3: Spatial statistical models Model selection results to identify the candidate models best explaining observed spatial patterns of chronic wasting disease (CWD) prevalence in mule deer in north-central Colorado, USA. Model Scale km2 Model pd DIC w DIC 1 9 Demo + Space Demo + Env + Space + Het Demo + Env + Space Demo + Space + Het Demo + Env + Space Demo + Env + Het Demo + Env + Het Demo + Env + Space + Het Demo + Env Demo + Space + Het
34 Method 3: Spatial statistical models Univariate parameter estimates from Model 1 and Model 2. Estimates for individual-level covariates SEX and AGE are from Model 1, the top DIC model, which did not contain environmental covariates, with environmental covariate effects from Model 2, the best model containing these effects Variable Model rank Mean Std.dev. 2.5% C.I. 97.5% C.I. SEX AGE %PRIV %HAB DISP

35 Method 3: Spatial statistical models CWD Spatial Random Effects
36 Method 3: Spatial statistical models We developed a Bayesian spatial hierarchical model for CWD presence/absence. Findings: Strong evidence that the finest mixing scale corresponded best to the spatial distribution of CWD infection. Evidence that land ownership and habitat use play a role in exacerbating the disease, along with the known effects of sex and age.
37 Summary Studying wildlife diseases can lead to the development of new statistical methods. The study of diseases in wildlife can lead to new scientific discoveries. Webpage: Jennifer Hoeting jah
ecological, or environmental dynamical process. In most cases, one prefers either deterministic or stochastic
 Environmetrics 00, 1 24 DOI: 10.1002/env.XXXX Parameter inference and model selection in deterministic and stochastic dynamical models via approximate Bayesian computation: modeling a wildlife epidemic
A Spatial Model for Chronic Wasting Disease in Rocky Mountain Mule Deer
 A Spatial Model for Chronic Wasting Disease in Rocky Mountain Mule Deer Christopher H. Mehl Craig J. Johns June 3, 23 Abstract Chronic wasting disease (CWD) causes damage to portions of the brain and nervous
Estimating the Exponential Growth Rate and R 0
 Junling Ma Department of Mathematics and Statistics, University of Victoria May 23, 2012 Introduction Daily pneumonia and influenza (P&I) deaths of 1918 pandemic influenza in Philadelphia. 900 800 700
Thursday. Threshold and Sensitivity Analysis
 Thursday Threshold and Sensitivity Analysis SIR Model without Demography ds dt di dt dr dt = βsi (2.1) = βsi γi (2.2) = γi (2.3) With initial conditions S(0) > 0, I(0) > 0, and R(0) = 0. This model can
Transmission in finite populations
 Transmission in finite populations Juliet Pulliam, PhD Department of Biology and Emerging Pathogens Institute University of Florida and RAPIDD Program, DIEPS Fogarty International Center US National Institutes
Introduction to SEIR Models
 Department of Epidemiology and Public Health Health Systems Research and Dynamical Modelling Unit Introduction to SEIR Models Nakul Chitnis Workshop on Mathematical Models of Climate Variability, Environmental
Tutorial on Approximate Bayesian Computation
 Tutorial on Approximate Bayesian Computation Michael Gutmann https://sites.google.com/site/michaelgutmann University of Helsinki Aalto University Helsinki Institute for Information Technology 16 May 2016
LINKING CHRONIC WASTING DISEASE TO MULE DEER MOVEMENT SCALES: A HIERARCHICAL BAYESIAN APPROACH
 Ecological Applications, 16(3), 2006, pp. 1026 1036 Ó 2006 by the Ecological Society of America LINKING CHRONIC WASTING DISEASE TO MULE DEER MOVEMENT SCALES: A HIERARCHICAL BAYESIAN APPROACH MATTHEW L.
Likelihood-based inference for dynamic systems
 Likelihood-based inference for dynamic systems Edward Ionides University of Michigan, Department of Statistics Slides are online at http://dept.stat.lsa.umich.edu/~ionides/ talks/research_overview.pdf
Models of Infectious Disease Formal Demography Stanford Summer Short Course James Holland Jones, Instructor. August 15, 2005
 Models of Infectious Disease Formal Demography Stanford Summer Short Course James Holland Jones, Instructor August 15, 2005 1 Outline 1. Compartmental Thinking 2. Simple Epidemic (a) Epidemic Curve 1:
Bayesian Methods for Machine Learning
 Bayesian Methods for Machine Learning CS 584: Big Data Analytics Material adapted from Radford Neal s tutorial (http://ftp.cs.utoronto.ca/pub/radford/bayes-tut.pdf), Zoubin Ghahramni (http://hunch.net/~coms-4771/zoubin_ghahramani_bayesian_learning.pdf),
POMP inference via iterated filtering
 POMP inference via iterated filtering Edward Ionides University of Michigan, Department of Statistics Lecture 3 at Wharton Statistics Department Thursday 27th April, 2017 Slides are online at http://dept.stat.lsa.umich.edu/~ionides/talks/upenn
Approximate Bayesian Computation
 Approximate Bayesian Computation Michael Gutmann https://sites.google.com/site/michaelgutmann University of Helsinki and Aalto University 1st December 2015 Content Two parts: 1. The basics of approximate
Malaria transmission: Modeling & Inference
 University of Michigan, Ann Arbor June 8, 2009 Overview Malaria data and model Inference via Iterated Filtering Results (Joint work with Karina Laneri, Ed Ionides and Mercedes Pascual of the University
Models of Infectious Disease Formal Demography Stanford Spring Workshop in Formal Demography May 2008
 Models of Infectious Disease Formal Demography Stanford Spring Workshop in Formal Demography May 2008 James Holland Jones Department of Anthropology Stanford University May 3, 2008 1 Outline 1. Compartmental
Stochastic modelling of epidemic spread
 Stochastic modelling of epidemic spread Julien Arino Centre for Research on Inner City Health St Michael s Hospital Toronto On leave from Department of Mathematics University of Manitoba Julien Arino@umanitoba.ca
Multistate Modelling Vertical Transmission and Determination of R 0 Using Transition Intensities
 Applied Mathematical Sciences, Vol. 9, 2015, no. 79, 3941-3956 HIKARI Ltd, www.m-hikari.com http://dx.doi.org/10.12988/ams.2015.52130 Multistate Modelling Vertical Transmission and Determination of R 0
Mathematical Modeling and Analysis of Infectious Disease Dynamics
 Mathematical Modeling and Analysis of Infectious Disease Dynamics V. A. Bokil Department of Mathematics Oregon State University Corvallis, OR MTH 323: Mathematical Modeling May 22, 2017 V. A. Bokil (OSU-Math)
Statistical Inference for Stochastic Epidemic Models
 Statistical Inference for Stochastic Epidemic Models George Streftaris 1 and Gavin J. Gibson 1 1 Department of Actuarial Mathematics & Statistics, Heriot-Watt University, Riccarton, Edinburgh EH14 4AS,
Inference for partially observed stochastic dynamic systems: A new algorithm, its theory and applications
 Inference for partially observed stochastic dynamic systems: A new algorithm, its theory and applications Edward Ionides Department of Statistics, University of Michigan ionides@umich.edu Statistics Department
A Simple Ecological Model
 Department of Mathematics Florida State University Florida State University, Tallahassee, FL, Jul 22, 2009 Ecology 1 The branch of biology that deals with the relations of organisms to one another and
Prerequisite: STATS 7 or STATS 8 or AP90 or (STATS 120A and STATS 120B and STATS 120C). AP90 with a minimum score of 3
. AP90 with a minimum score of 3") University of California, Irvine 2017-2018 1 Statistics (STATS) Courses STATS 5. Seminar in Data Science. 1 Unit. An introduction to the field of Data Science; intended for entering freshman and transfers.
University of California, Irvine 2017-2018 1 Statistics (STATS) Courses STATS 5. Seminar in Data Science. 1 Unit. An introduction to the field of Data Science; intended for entering freshman and transfers.
Recap on Data Assimilation
 Concluding Thoughts Recap on Data Assimilation FORECAST ANALYSIS Kalman Filter Forecast Analysis Analytical projection of the ANALYSIS mean and cov from t-1 to the FORECAST mean and cov for t Update FORECAST
Understanding the contribution of space on the spread of Influenza using an Individual-based model approach
 Understanding the contribution of space on the spread of Influenza using an Individual-based model approach Shrupa Shah Joint PhD Candidate School of Mathematics and Statistics School of Population and
Derivation of Itô SDE and Relationship to ODE and CTMC Models
 Derivation of Itô SDE and Relationship to ODE and CTMC Models Biomathematics II April 23, 2015 Linda J. S. Allen Texas Tech University TTU 1 Euler-Maruyama Method for Numerical Solution of an Itô SDE dx(t)
Mathematical Epidemiology Lecture 1. Matylda Jabłońska-Sabuka
 Lecture 1 Lappeenranta University of Technology Wrocław, Fall 2013 What is? Basic terminology Epidemiology is the subject that studies the spread of diseases in populations, and primarily the human populations.
Modeling Longitudinal Count Data with Excess Zeros and Time-Dependent Covariates: Application to Drug Use
 Modeling Longitudinal Count Data with Excess Zeros and : Application to Drug Use University of Northern Colorado November 17, 2014 Presentation Outline I and Data Issues II Correlated Count Regression
Creating Non-Gaussian Processes from Gaussian Processes by the Log-Sum-Exp Approach. Radford M. Neal, 28 February 2005
 Creating Non-Gaussian Processes from Gaussian Processes by the Log-Sum-Exp Approach Radford M. Neal, 28 February 2005 A Very Brief Review of Gaussian Processes A Gaussian process is a distribution over
Fast Likelihood-Free Inference via Bayesian Optimization
 Fast Likelihood-Free Inference via Bayesian Optimization Michael Gutmann https://sites.google.com/site/michaelgutmann University of Helsinki Aalto University Helsinki Institute for Information Technology
Stochastic modelling of epidemic spread
 Stochastic modelling of epidemic spread Julien Arino Department of Mathematics University of Manitoba Winnipeg Julien Arino@umanitoba.ca 19 May 2012 1 Introduction 2 Stochastic processes 3 The SIS model
Chris Fraley and Daniel Percival. August 22, 2008, revised May 14, 2010
 Model-Averaged l 1 Regularization using Markov Chain Monte Carlo Model Composition Technical Report No. 541 Department of Statistics, University of Washington Chris Fraley and Daniel Percival August 22,
Statistical Analysis of Spatio-temporal Point Process Data. Peter J Diggle
 Statistical Analysis of Spatio-temporal Point Process Data Peter J Diggle Department of Medicine, Lancaster University and Department of Biostatistics, Johns Hopkins University School of Public Health
Bayesian Hierarchical Models
 Bayesian Hierarchical Models Gavin Shaddick, Millie Green, Matthew Thomas University of Bath 6 th - 9 th December 2016 1/ 34 APPLICATIONS OF BAYESIAN HIERARCHICAL MODELS 2/ 34 OUTLINE Spatial epidemiology
Efficient Likelihood-Free Inference
 Efficient Likelihood-Free Inference Michael Gutmann http://homepages.inf.ed.ac.uk/mgutmann Institute for Adaptive and Neural Computation School of Informatics, University of Edinburgh 8th November 2017
Mathematical Analysis of Epidemiological Models: Introduction
 Mathematical Analysis of Epidemiological Models: Introduction Jan Medlock Clemson University Department of Mathematical Sciences 8 February 2010 1. Introduction. The effectiveness of improved sanitation,
Three Disguises of 1 x = e λx
 Three Disguises of 1 x = e λx Chathuri Karunarathna Mudiyanselage Rabi K.C. Winfried Just Department of Mathematics, Ohio University Mathematical Biology and Dynamical Systems Seminar Ohio University November
Introduction to risk assessment
 Introduction to risk assessment Inception workshop of the project Strengthening the regional preparedness, prevention and response against lumpy skin disease in Belarus, Moldova and Ukraine (TCP/RER/3605)
A Generic Multivariate Distribution for Counting Data
 arxiv:1103.4866v1 [stat.ap] 24 Mar 2011 A Generic Multivariate Distribution for Counting Data Marcos Capistrán and J. Andrés Christen Centro de Investigación en Matemáticas, A. C. (CIMAT) Guanajuato, MEXICO.
A New Mathematical Approach for. Rabies Endemy
 Applied Mathematical Sciences, Vol. 8, 2014, no. 2, 59-67 HIKARI Ltd, www.m-hikari.com http://dx.doi.org/10.12988/ams.2014.39525 A New Mathematical Approach for Rabies Endemy Elif Demirci Ankara University
Name Student ID. Good luck and impress us with your toolkit of ecological knowledge and concepts!
 Page 1 BIOLOGY 150 Final Exam Winter Quarter 2000 Before starting be sure to put your name and student number on the top of each page. MINUS 3 POINTS IF YOU DO NOT WRITE YOUR NAME ON EACH PAGE! You have
Represent processes and observations that span multiple levels (aka multi level models) R 2
 R 2") Hierarchical models Hierarchical models Represent processes and observations that span multiple levels (aka multi level models) R 1 R 2 R 3 N 1 N 2 N 3 N 4 N 5 N 6 N 7 N 8 N 9 N i = true abundance on a
Hierarchical models Hierarchical models Represent processes and observations that span multiple levels (aka multi level models) R 1 R 2 R 3 N 1 N 2 N 3 N 4 N 5 N 6 N 7 N 8 N 9 N i = true abundance on a
Frailty Modeling for Spatially Correlated Survival Data, with Application to Infant Mortality in Minnesota By: Sudipto Banerjee, Mela. P.
 Frailty Modeling for Spatially Correlated Survival Data, with Application to Infant Mortality in Minnesota By: Sudipto Banerjee, Melanie M. Wall, Bradley P. Carlin November 24, 2014 Outlines of the talk
AN INTRODUCTION TO STOCHASTIC EPIDEMIC MODELS-PART I
 AN INTRODUCTION TO STOCHASTIC EPIDEMIC MODELS-PART I Linda J. S. Allen Department of Mathematics and Statistics Texas Tech University Lubbock, Texas U.S.A. 2008 Summer School on Mathematical Modeling of
LAW OF LARGE NUMBERS FOR THE SIRS EPIDEMIC
 LAW OF LARGE NUMBERS FOR THE SIRS EPIDEMIC R. G. DOLGOARSHINNYKH Abstract. We establish law of large numbers for SIRS stochastic epidemic processes: as the population size increases the paths of SIRS epidemic
Predicting Long-term Exposures for Health Effect Studies
 Predicting Long-term Exposures for Health Effect Studies Lianne Sheppard Adam A. Szpiro, Johan Lindström, Paul D. Sampson and the MESA Air team University of Washington CMAS Special Session, October 13,
Brief Glimpse of Agent-Based Modeling
 Brief Glimpse of Agent-Based Modeling Nathaniel Osgood Using Modeling to Prepare for Changing Healthcare Need January 9, 2014 Agent-Based Models Agent-based model characteristics One or more populations
Approximation of epidemic models by diffusion processes and their statistical inferencedes
 Approximation of epidemic models by diffusion processes and their statistical inferencedes Catherine Larédo 1,2 1 UR 341, MaIAGE, INRA, Jouy-en-Josas 2 UMR 7599, LPMA, Université Paris Diderot December
Final Project Descriptions Introduction to Mathematical Biology Professor: Paul J. Atzberger. Project I: Predator-Prey Equations
 Final Project Descriptions Introduction to Mathematical Biology Professor: Paul J. Atzberger Project I: Predator-Prey Equations The Lotka-Volterra Predator-Prey Model is given by: du dv = αu βuv = ρβuv
Optimal Translocation Strategies for Threatened Species
 Optimal Translocation Strategies for Threatened Species Rout, T. M., C. E. Hauser and H. P. Possingham The Ecology Centre, University of Queensland, E-Mail: s428598@student.uq.edu.au Keywords: threatened
Dynamic network sampling
 Dynamic network sampling Steve Thompson Simon Fraser University thompson@sfu.ca Graybill Conference Colorado State University June 10, 2013 Dynamic network sampling The population of interest has spatial
Multivariate Survival Analysis
 Multivariate Survival Analysis Previously we have assumed that either (X i, δ i ) or (X i, δ i, Z i ), i = 1,..., n, are i.i.d.. This may not always be the case. Multivariate survival data can arise in
Bayesian Linear Regression
 Bayesian Linear Regression Sudipto Banerjee 1 Biostatistics, School of Public Health, University of Minnesota, Minneapolis, Minnesota, U.S.A. September 15, 2010 1 Linear regression models: a Bayesian perspective
Dynamic Modeling and Inference for Ecological and Epidemiological Systems
 1 Dynamic Modeling and Inference for Ecological and Epidemiological Systems European Meeting of Statisticians July, 2013 Edward Ionides The University of Michigan, Department of Statistics 2 Outline 1.
Master of Science in Statistics A Proposal
 1 Master of Science in Statistics A Proposal Rationale of the Program In order to cope up with the emerging complexity on the solutions of realistic problems involving several phenomena of nature it is
Generalized common spatial factor model
 Biostatistics (2003), 4, 4,pp. 569 582 Printed in Great Britain Generalized common spatial factor model FUJUN WANG Eli Lilly and Company, Indianapolis, IN 46285, USA MELANIE M. WALL Division of Biostatistics,
Downloaded from:
 Camacho, A; Kucharski, AJ; Funk, S; Breman, J; Piot, P; Edmunds, WJ (2014) Potential for large outbreaks of Ebola virus disease. Epidemics, 9. pp. 70-8. ISSN 1755-4365 DOI: https://doi.org/10.1016/j.epidem.2014.09.003
UNIVERSITY OF MASSACHUSETTS Department of Mathematics and Statistics Applied Statistics Friday, January 15, 2016
 UNIVERSITY OF MASSACHUSETTS Department of Mathematics and Statistics Applied Statistics Friday, January 15, 2016 Work all problems. 60 points are needed to pass at the Masters Level and 75 to pass at the
Probabilistic machine learning group, Aalto University Bayesian theory and methods, approximative integration, model
 Aki Vehtari, Aalto University, Finland Probabilistic machine learning group, Aalto University http://research.cs.aalto.fi/pml/ Bayesian theory and methods, approximative integration, model assessment and
STA414/2104 Statistical Methods for Machine Learning II
 STA414/2104 Statistical Methods for Machine Learning II Murat A. Erdogdu & David Duvenaud Department of Computer Science Department of Statistical Sciences Lecture 3 Slide credits: Russ Salakhutdinov Announcements
Niche Modeling. STAMPS - MBL Course Woods Hole, MA - August 9, 2016
 Niche Modeling Katie Pollard & Josh Ladau Gladstone Institutes UCSF Division of Biostatistics, Institute for Human Genetics and Institute for Computational Health Science STAMPS - MBL Course Woods Hole,
Hierarchical Linear Models
 Hierarchical Linear Models Statistics 220 Spring 2005 Copyright c 2005 by Mark E. Irwin The linear regression model Hierarchical Linear Models y N(Xβ, Σ y ) β σ 2 p(β σ 2 ) σ 2 p(σ 2 ) can be extended
Supplemental Information Likelihood-based inference in isolation-by-distance models using the spatial distribution of low-frequency alleles
 Supplemental Information Likelihood-based inference in isolation-by-distance models using the spatial distribution of low-frequency alleles John Novembre and Montgomery Slatkin Supplementary Methods To
Or How to select variables Using Bayesian LASSO
 Or How to select variables Using Bayesian LASSO x 1 x 2 x 3 x 4 Or How to select variables Using Bayesian LASSO x 1 x 2 x 3 x 4 Or How to select variables Using Bayesian LASSO On Bayesian Variable Selection
AARMS Homework Exercises
 1 For the gamma distribution, AARMS Homework Exercises (a) Show that the mgf is M(t) = (1 βt) α for t < 1/β (b) Use the mgf to find the mean and variance of the gamma distribution 2 A well-known inequality
Mixture modelling of recurrent event times with long-term survivors: Analysis of Hutterite birth intervals. John W. Mac McDonald & Alessandro Rosina
 Mixture modelling of recurrent event times with long-term survivors: Analysis of Hutterite birth intervals John W. Mac McDonald & Alessandro Rosina Quantitative Methods in the Social Sciences Seminar -
MATHEMATICAL MODELS Vol. III - Mathematical Models in Epidemiology - M. G. Roberts, J. A. P. Heesterbeek
 MATHEMATICAL MODELS I EPIDEMIOLOGY M. G. Roberts Institute of Information and Mathematical Sciences, Massey University, Auckland, ew Zealand J. A. P. Heesterbeek Faculty of Veterinary Medicine, Utrecht
Proteomics and Variable Selection
 Proteomics and Variable Selection p. 1/55 Proteomics and Variable Selection Alex Lewin With thanks to Paul Kirk for some graphs Department of Epidemiology and Biostatistics, School of Public Health, Imperial
Bayesian hierarchical methods for sea turtle mixed stock analysis
 Bayesian hierarchical methods for sea turtle mixed stock analysis Ben Bolker Department of Zoology & Archie Carr Center for Sea Turtle Research University of Florida 9 December 2003 Outline Background
Gaussian Mixture Model
 Case Study : Document Retrieval MAP EM, Latent Dirichlet Allocation, Gibbs Sampling Machine Learning/Statistics for Big Data CSE599C/STAT59, University of Washington Emily Fox 0 Emily Fox February 5 th,
STAT 518 Intro Student Presentation
 STAT 518 Intro Student Presentation Wen Wei Loh April 11, 2013 Title of paper Radford M. Neal [1999] Bayesian Statistics, 6: 475-501, 1999 What the paper is about Regression and Classification Flexible
Dynamical Systems and Chaos Part II: Biology Applications. Lecture 6: Population dynamics. Ilya Potapov Mathematics Department, TUT Room TD325
 Dynamical Systems and Chaos Part II: Biology Applications Lecture 6: Population dynamics Ilya Potapov Mathematics Department, TUT Room TD325 Living things are dynamical systems Dynamical systems theory
Approximate Bayesian computation: methods and applications for complex systems
 Approximate Bayesian computation: methods and applications for complex systems Mark A. Beaumont, School of Biological Sciences, The University of Bristol, Bristol, UK 11 November 2015 Structure of Talk
A Bayesian multi-dimensional couple-based latent risk model for infertility
 A Bayesian multi-dimensional couple-based latent risk model for infertility Zhen Chen, Ph.D. Eunice Kennedy Shriver National Institute of Child Health and Human Development National Institutes of Health
McGill University. Department of Epidemiology and Biostatistics. Bayesian Analysis for the Health Sciences. Course EPIB-682.
 McGill University Department of Epidemiology and Biostatistics Bayesian Analysis for the Health Sciences Course EPIB-682 Lawrence Joseph Intro to Bayesian Analysis for the Health Sciences EPIB-682 2 credits
Analysing geoadditive regression data: a mixed model approach
 Analysing geoadditive regression data: a mixed model approach Institut für Statistik, Ludwig-Maximilians-Universität München Joint work with Ludwig Fahrmeir & Stefan Lang 25.11.2005 Spatio-temporal regression
Non-Linear Models Cont d: Infectious Diseases. Non-Linear Models Cont d: Infectious Diseases
 Cont d: Infectious Diseases Infectious Diseases Can be classified into 2 broad categories: 1 those caused by viruses & bacteria (microparasitic diseases e.g. smallpox, measles), 2 those due to vectors
Introduction to Geostatistics
 Introduction to Geostatistics Abhi Datta 1, Sudipto Banerjee 2 and Andrew O. Finley 3 July 31, 2017 1 Department of Biostatistics, Bloomberg School of Public Health, Johns Hopkins University, Baltimore,
An Introduction to Stochastic Epidemic Models
 An Introduction to Stochastic Epidemic Models Linda J. S. Allen Department of Mathematics and Statistics Texas Tech University Lubbock, Texas 79409-1042, U.S.A. linda.j.allen@ttu.edu 1 Introduction The
Variability within multi-component systems. Bayesian inference in probabilistic risk assessment The current state of the art
 PhD seminar series Probabilistics in Engineering : g Bayesian networks and Bayesian hierarchical analysis in engeering g Conducted by Prof. Dr. Maes, Prof. Dr. Faber and Dr. Nishijima Variability within
Integrated Non-Factorized Variational Inference
 Integrated Non-Factorized Variational Inference Shaobo Han, Xuejun Liao and Lawrence Carin Duke University February 27, 2014 S. Han et al. Integrated Non-Factorized Variational Inference February 27, 2014
Appraoaches to Landscape-Scale Modeling
 Appraoaches to Landscape-Scale Modeling A hypothetical landscape with agency management units (e.g., county, wildlife management unit), over which data is frequently modeled or summarized at the landscape
Disease mapping with Gaussian processes
 EUROHEIS2 Kuopio, Finland 17-18 August 2010 Aki Vehtari (former Helsinki University of Technology) Department of Biomedical Engineering and Computational Science (BECS) Acknowledgments Researchers - Jarno
Bayesian spatial hierarchical modeling for temperature extremes
 Bayesian spatial hierarchical modeling for temperature extremes Indriati Bisono Dr. Andrew Robinson Dr. Aloke Phatak Mathematics and Statistics Department The University of Melbourne Maths, Informatics
Bayesian statistics and modelling in ecology
 Bayesian statistics and modelling in ecology Prof Paul Blackwell University of Sheffield, UK February 2011 Bayesian statistics Bayesian statistics: the systematic use of probability to express uncertainty
CPSC 540: Machine Learning
 CPSC 540: Machine Learning MCMC and Non-Parametric Bayes Mark Schmidt University of British Columbia Winter 2016 Admin I went through project proposals: Some of you got a message on Piazza. No news is
CHAPTER. Population Ecology
 CHAPTER 4 Population Ecology Chapter 4 TOPIC POPULATION ECOLOGY Indicator Species Serve as Biological Smoke Alarms Indicator species Provide early warning of damage to a community Can monitor environmental
Bayesian inference and model selection for stochastic epidemics and other coupled hidden Markov models
 Bayesian inference and model selection for stochastic epidemics and other coupled hidden Markov models (with special attention to epidemics of Escherichia coli O157:H7 in cattle) Simon Spencer 3rd May
1 Inference for binomial proportion (Matlab/Python)
") Bayesian data analysis exercises from 2015 1 Inference for binomial proportion (Matlab/Python) Algae status is monitored in 274 sites at Finnish lakes and rivers. The observations for the 2008 algae status
Bayesian data analysis exercises from 2015 1 Inference for binomial proportion (Matlab/Python) Algae status is monitored in 274 sites at Finnish lakes and rivers. The observations for the 2008 algae status
Hierarchical Modeling for Univariate Spatial Data
 Hierarchical Modeling for Univariate Spatial Data Geography 890, Hierarchical Bayesian Models for Environmental Spatial Data Analysis February 15, 2011 1 Spatial Domain 2 Geography 890 Spatial Domain This
Hierarchical Nearest-Neighbor Gaussian Process Models for Large Geo-statistical Datasets
 Hierarchical Nearest-Neighbor Gaussian Process Models for Large Geo-statistical Datasets Abhirup Datta 1 Sudipto Banerjee 1 Andrew O. Finley 2 Alan E. Gelfand 3 1 University of Minnesota, Minneapolis,
σ(a) = a N (x; 0, 1 2 ) dx. σ(a) = Φ(a) =
 = a N (x; 0, 1 2 ) dx. σ(a) = Φ(a) =") Until now we have always worked with likelihoods and prior distributions that were conjugate to each other, allowing the computation of the posterior distribution to be done in closed form. Unfortunately,
Until now we have always worked with likelihoods and prior distributions that were conjugate to each other, allowing the computation of the posterior distribution to be done in closed form. Unfortunately,
Kernel adaptive Sequential Monte Carlo
 Kernel adaptive Sequential Monte Carlo Ingmar Schuster (Paris Dauphine) Heiko Strathmann (University College London) Brooks Paige (Oxford) Dino Sejdinovic (Oxford) December 7, 2015 1 / 36 Section 1 Outline
Physician Performance Assessment / Spatial Inference of Pollutant Concentrations
 Physician Performance Assessment / Spatial Inference of Pollutant Concentrations Dawn Woodard Operations Research & Information Engineering Cornell University Johns Hopkins Dept. of Biostatistics, April
CHAPTER 14. Interactions in Ecosystems: Day One
 CHAPTER 14 Interactions in Ecosystems: Day One Habitat versus Niche Review! What is a habitat? All of the biotic and abiotic factors in the area where an organism lives. Examples: grass, trees, and watering
An introduction to Sequential Monte Carlo
 An introduction to Sequential Monte Carlo Thang Bui Jes Frellsen Department of Engineering University of Cambridge Research and Communication Club 6 February 2014 1 Sequential Monte Carlo (SMC) methods
CS224W: Analysis of Networks Jure Leskovec, Stanford University
 Announcements: Please fill HW Survey Weekend Office Hours starting this weekend (Hangout only) Proposal: Can use 1 late period CS224W: Analysis of Networks Jure Leskovec, Stanford University http://cs224w.stanford.edu
Metropolis-Hastings Algorithm
 Strength of the Gibbs sampler Metropolis-Hastings Algorithm Easy algorithm to think about. Exploits the factorization properties of the joint probability distribution. No difficult choices to be made to
Random Effects Models for Network Data
 Random Effects Models for Network Data Peter D. Hoff 1 Working Paper no. 28 Center for Statistics and the Social Sciences University of Washington Seattle, WA 98195-4320 January 14, 2003 1 Department of
Econometrics I KS. Module 2: Multivariate Linear Regression. Alexander Ahammer. This version: April 16, 2018
 Econometrics I KS Module 2: Multivariate Linear Regression Alexander Ahammer Department of Economics Johannes Kepler University of Linz This version: April 16, 2018 Alexander Ahammer (JKU) Module 2: Multivariate
Relationship between weather factors and survival of mule deer fawns in the Peace Region of British Columbia
 P E A C E R E G I O N T E C H N I C A L R E P O R T Relationship between weather factors and survival of mule deer fawns in the Peace Region of British Columbia by: Nick Baccante and Robert B. Woods Fish