Chapter 9 Time-Weighted Control Charts. Statistical Quality Control (D. C. Montgomery)
|
|
|
- Benjamin Charles
- 5 years ago
- Views:
Transcription
1 Chapter 9 Time-Weighted Control Charts 許湘伶 Statistical Quality Control (D. C. Montgomery)
2 Introduction I Shewhart control chart: Chap. 5 7: basic SPC methods Useful in phase I implementation( 完成 ) of SPC
3 Introduction II Disadvantage: use only the information about the process contained in the last sample observation ignores any information given by the entire sequence of points insensitive( 不敏感 ) to small process shift (ex: µ 1 µ 0 1.5σ) less useful in phase II monitoring problems
4 Introduction III Two effective approaches: small process shift cumulative sum (CUSUM) control chart ( 累積和管制圖 ) exponentially weighted moving average (EWMA) control chart ( 指數加權移動平均管制圖 ) Sometimes called time-weighted control chart
5 The Cumulative Sum Control Chart I Monitoring the process mean: x 1,..., x 20 N (10, 1 2 ) x 21,..., x 30 N (11, 1 2 ) µ 0 = 10, µ 1 = 11, σ = 1
6 The Cumulative Sum Control Chart II Table 9.1: small shift; no strong evidence that the process is out of control Shewhart control chart has failed to detect the shift relative small magnitude( 量 ) of the shift Shewhart chart: effective if the shift is 1.5σ to 2σ or larger
7 The Cumulative Sum Control Chart III CUSUM chart: incorporate( 包含 ) all the information in the sequence of sample values plotting the cumulative sums of the deviations of the sample values from a target value n 1 µ 0 : the target for the process mean C i : the cumulatice sum up to and including the ith sample i i 1 C i = ( x j µ 0 ) = ( x i µ 0 )+ ( x j µ 0 ) = ( x i µ 0 )+C i 1 j=1 j=1 combing information from several samples

8 The Cumulative Sum Control Chart IV More effective than Shewhart charts for detecting small process shifts; particular with n = 1 In control at µ 0 : C i is a random walk with mean zero µ 0 µ 1 : µ 0 < µ 1 C i 向上趨勢 µ 0 µ 1 : µ 0 > µ 1 C i 向下趨勢
9 The Cumulative Sum Control Chart V n = 1 x i = x i ; µ 0 = 10 not a control chart; lack of limits
) CUSUM: preferable 2.")
10 The Cumulative Sum Control Chart VI Two ways to represent CUSUMs: 1. tabular (or algorithmic( 規則系統的 )) CUSUM: preferable 2. V-mask form of the CUSUM: not the best representation of a CUSUM
11 Tabular CUSUM for µ I CUSUMs: for individual observations; for the average of rational subgroups x i : the ith observation on the process In control: x i N (µ 0, σ 2 ) (σ: known or a reliable estimate is available) Upper-sided CUSUM: C + i = max [ 0, x i (µ 0 + K) + C i 1 + ] Lower-sided CUSUM: C i = max [ 0, (µ 0 K) x i + Ci 1 ] (Minitab: Ci = min(0, x i µ 0 + k + Ci 1 ) C i 0) C + 0 = C0 = 0 µ 1 = µ 0 + δσ Reference value(slack value 寬鬆變數值 ): K = δ 2 σ = µ 1 µ 0 2
12 Tabular CUSUM for µ II C + i (or C i ) > H the process is out of control H : decision interval K, H : two important parameters for CUSUM 一般取 : K = µ 1 µ 0, H = 5σ 2 Using ARL to choose (K, H )

13 Tabular CUSUM for µ III
 q = cusum(data,sizes=1,center=10,std.")
14 Tabular CUSUM for µ IV require(qcc) data = read.table("table9_1.csv",sep=",",header=t) q = cusum(data,sizes=1,center=10,std.dev=1) summary(q) plot(q, chart.all=false)

15 Tabular CUSUM for µ V
16 Tabular CUSUM for µ VI vertical bar: the value of C i +, Ci solid dot: x i =the value of the observations
 the shift occurred between")
17 Tabular CUSUM for µ VII Sample 29: C + 29 = 5.28 > H = 5 且 N + = 7 (the first period) the shift occurred between periods (29-7=22)
18 Tabular CUSUM for µ VIII helpful in determining when the assignable cause has occurred count backward from the out-of-control signal to the time period process shift: adjustment back to the target value µ 0 ˆµ = µ 0 + K + C + i, if C + N + i > H µ 0 K C i N, if C i > H Table 9.2: ˆµ = µ 0 + K + C + i N + = = 11.25
19 Tabular CUSUM for µ IX successive values of C i +, Ci are not independent: sensitizing rules; zone rules; run tests Choosing of K, H : ARL Define K = kσ, H = hσ Using h = 4 or h = 5, k = 1/2: generally provide a CUSUM that has good ARL properties against a shift about 1σ in the process mean
20 Tabular CUSUM for µ X a 1σ shift: require samples to detect the shift for a Shewhart charts

21 Tabular CUSUM for µ XI h = 4.77 ARL 0 = 370 samples (matches for a Shewhart charts with 3σ limits)
22 Tabular CUSUM for µ XII Siegmund s approximation: (one-sided CUSUM) ARL = exp( 2 b) + 2 b Upper one-sided CUSUM: = δ k Lower one-sided CUSUM: = δ k δ = (µ 1 µ 0 )/σ (shift in the mean, in the units of σ) b = h if = 0 ARL = b 2 δ = 0 approximate ARL 0 δ 0 approximate ARL 1
23 Tabular CUSUM for µ XIII ARL +, ARL : ARL of the two one-sided statistics ARL of the two-sided CUSUM: 1 ARL = 1 ARL ARL Ex: k = 1/2, h = 5, δ = 0; = δ k = 1/2; b = h = ARL + 0 exp [ 2( 1/2)(6.166)] + 2( 1/2) ( 1/2) 2 = ARL + 0 = ARL 0 (symmetric) 1 ARL 0 = 1 ARL ARL 0 (In Table 9.3: ARL 0 = 465) ARL 0 = 469.1
, = 2.5(lower) ARL 1 = 3.")
24 Tabular CUSUM for µ XIV Ex: the mean shift by 2σ δ = 2 = 1.5(upper), = 2.5(lower) ARL 1 = 3.89
25 Standardized CUSUM I standardize x i : y i = x i µ 0 σ Standardized Two-Sided CUSUM [ ] C i + = max 0, y i k + C i 1 + [ ] Ci = max 0, k y i + Ci 1 h, k: the choices do not depend on σ Standardized CUSUM: for controlling variability
26 Improving CUSUM for Large Shifts I CUSUM: effective in detecting small shift; not as effective as the Shewhart chart in detecting large shift Approach for improving the ability to detect large process shifts: combined CUSUM-Shewhart procedure for on-line control Shewhart control limits: ±3.5σ from CL or the target µ0 An out-of-control signal on either (or both) charts: an action signal

27 Improving CUSUM for Large Shifts II FIR(Fast Initial Response 快速起始反應 or Headstart( 有利的開端 ) Feature): improve the sensitivity of a CUSUM at process start-up C + 0, C 0 : some nonzero value: 一般取 H /2 (50% headstart)

28 Improving CUSUM for Large Shifts III decline( 下降 ) rapidly to zero from the starting value Period 2 for C i + headstart or Period 3 for C i : unaffected by the
 detect the shift more quickly shorter out-of-control ARL")
29 Improving CUSUM for Large Shifts IV Benefit: quickly drop to zero if in control (little effect by the headstart) detect the shift more quickly shorter out-of-control ARL values
30 Improving CUSUM for Large Shifts V If the process is in control when the CUSUM is reset but shifts out of control later, the more appropriate ARL is Column (a) in Table 9.5
31 CUSUM for process variability I Hawkins (1981, 1993a): a new standardized quantity v i = yi (H.W.), y i = x i µ 0 σ sensitive to variance changes rather than mean changes approx. In control: v i N (0, 1) (in control distribution) CUSUM for v i : (S + 0 = S 0 = 0 unless a FIR feature is used) S + i = max[0, v i k + S + i 1 ] S i = max[0, k v i + S i 1 ] choose h, k and interpretation is similar to the CUSUM of the mean
32 Self-Starting CUSUM I Hawkins (1987): easy to implement( 執行 ) x n : the average of the first n observations w n : the sum of squared deviations from x n w n = Recursive form n (x i x n ) 2 i=1 x n = x n 1 + x n x n 1 n w n = w n 1 + (n 1)(x n x n 1 ) 2 n
33 Self-Starting CUSUM II s 2 n = w n /(n 1): sample variance of the first n observations Standardize new process observation: (n 3) T n = x n x n 1 s n 1 n 1 n T n T n 1 F( ): the cumulative t distribution with n 1 d.f. ( ) n 1 n 1 n 1 P(T n t) = P( n T n t n ) = F t n Φ 1 : the inverse normal cumulative distribution n 1 U n = Φ 1 [F(a n T n )], a n = n plot all values of U n, n 3 on a N(0,1) CUSUM
.")
34 Self-Starting CUSUM III The users of a self-starting CUSUM should take investigative and corrective action immediately following an out-of-control signal. If the process is not adjusted and the CUSUM reset, the self-starting CUSUM will turn back downward( 往後推移地 ).
35 EWMA I Exponentially Weighted Moving Average Control Chart Exponentially weighted moving average: z i = λx i + (1 λ)z i 1, 0 < λ 1 z 0 = µ 0 (target value) Sometimes: z 0 = x z i : a weighted average of all previous sample means
36 EWMA II z i = λx i + (1 λ)[λx i 1 + (1 λ)z i 2 ] = λx i + λ(1 λ)x i 1 + (1 λ) 2 z i 2 i 1 z i = λ (1 λ) j x i j + (1 λ) i z 0 j=0 weights λ(1 λ) j : decreasing geometrically with the age of the sample mean a weighted average of all past and current observations insensitive to the normality assumption
37 EWMA III i 1 λ j=0 (1 λ) j = 1 (1 λ) i EWMA also called a geometric moving average (GMA) If x i are independent r.v. with variance σ 2 ( ) λ [ σz 2 i = σ 2 1 (1 λ) 2i] 2 λ
38 EWMA IV EWMA control chart UCL = µ 0 + Lσ Central Line = µ 0 LCL = µ 0 Lσ ( ) λ [1 (1 λ) 2 λ 2i ] ( ) λ [1 (1 λ) 2 λ 2i ] [1 (1 λ) 2i ] i gets large 1: approach steady-state ( ) λ UCL = µ 0 + Lσ 2 λ ( ) λ LCL = µ 0 Lσ 2 λ
z 0 = 0.1(9.")
39 EWMA V Example 9.2 λ = 0.10; L = 2.7 µ 0 = 10; σ = 1 z 1 = λx 1 + (1 λ)z 0 = 0.1(9.45) + 0.9(10) = 9.945
40 EWMA VI i = 1 UCL = µ 0 + Lσ = CL = µ 0 = 10 ( LCL = µ 0 Lσ = 9.37 i = 2 UCL = CL = µ 0 = 10 LCL = 9.64 ( ) λ [1 (1 λ) 2i ] 2 λ λ 2 λ ) [1 (1 λ) 2i ]
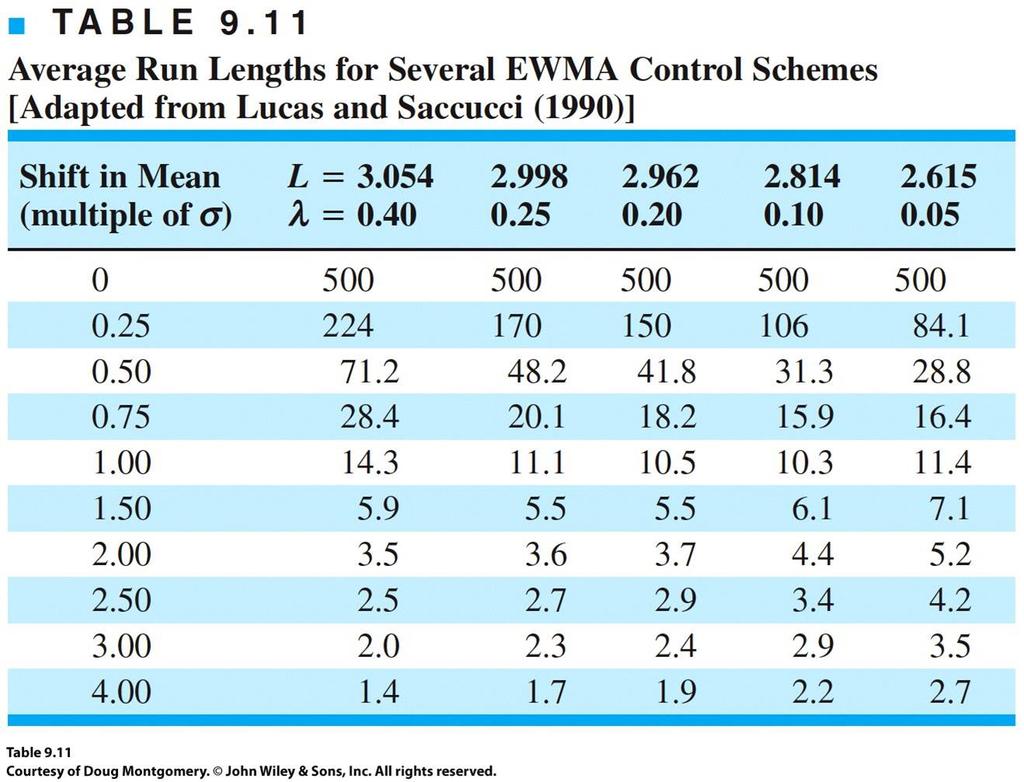
41 EWMA VII effective against small process shifts L, λ: choose to give ARL performance for the EWMA control chart that closely approximates CUSUM ARL performances for detecting small shifts General: λ [0.05, 0.25] work well in practice ( 通常取 λ = 0.05, 0.10, 0.20) a good rule of thumb( 經驗法則 ): use small values of λ to detect small shifts { L = 3 :works well, when the larger value of λ 2.6 L 2.8 :when λ is small (λ 0.1) λ = 0.1, L = 2.7 ARL 0 500; ARL 1 = 10.3 (detecting a shift of σ, 約與 h = 5, k = 1/2 的 cusum 相同 )
42 EWMA VIII
43 EWMA for Variability I Monitoring Variability: exponentially weighted mean square error(ewms) x i N (µ, σ 2 ) S 2 i = λ(x i µ) 2 + (1 λ)s 2 i 1 E(S 2 i ) = σ 2 (for large i) if x i are independent and normally distributed σ 0 : in-control or target value S 2 i σ 2 approx. χ 2 v, v = (2 λ)/λ
44 EWMA for Variability II EWRMS: exponentially weighted root mean square χ 2 v,α/2 UCL = σ 0 v χ 2 v,1 α/2 LCL = σ 0 v MacGregor and Harris (1993): the EWMS can be sensitive to shifts in both the process mean and the standard deviation Replace µ with ˆµ i at each point in time; a logical estimate of µ: the ordinary EWMA z i S 2 i = λ(x i z i ) 2 + (1 λ)s 2 i 1
45 Moving average control chart I The moving average of span w at time i: M i = x i + x i x i w+1 w V (M i ) = 1 i w 2 V (x j ) = 1 w 2 j=i w+1 The three-sigma control limit for M i UCL = µ 0 + 3σ w LCL = µ 0 3σ 2 i j=i w+1 σ 2 = σ2 w

46 Moving average control chart II Example 9.3: w = 5
First Semester Dr. Abed Schokry SQC Chapter 9: Cumulative Sum and Exponential Weighted Moving Average Control Charts
 Department of Industrial Engineering First Semester 2014-2015 Dr. Abed Schokry SQC Chapter 9: Cumulative Sum and Exponential Weighted Moving Average Control Charts Learning Outcomes After completing this
Linear Regression. Applied Linear Regression Models (Kutner, Nachtsheim, Neter, Li) hsuhl (NUK) SDA Regression 1 / 34
 hsuhl (NUK) SDA Regression 1 / 34") Linear Regression 許湘伶 Applied Linear Regression Models (Kutner, Nachtsheim, Neter, Li) hsuhl (NUK) SDA Regression 1 / 34 Regression analysis is a statistical methodology that utilizes the relation between
Linear Regression 許湘伶 Applied Linear Regression Models (Kutner, Nachtsheim, Neter, Li) hsuhl (NUK) SDA Regression 1 / 34 Regression analysis is a statistical methodology that utilizes the relation between
Chapter 1 Linear Regression with One Predictor Variable
 Chapter 1 Linear Regression with One Predictor Variable 許湘伶 Applied Linear Regression Models (Kutner, Nachtsheim, Neter, Li) hsuhl (NUK) LR Chap 1 1 / 41 Regression analysis is a statistical methodology
0 0 = 1 0 = 0 1 = = 1 1 = 0 0 = 1
 0 0 = 1 0 = 0 1 = 0 1 1 = 1 1 = 0 0 = 1 : = {0, 1} : 3 (,, ) = + (,, ) = + + (, ) = + (,,, ) = ( + )( + ) + ( + )( + ) + = + = = + + = + = ( + ) + = + ( + ) () = () ( + ) = + + = ( + )( + ) + = = + 0
Monitoring Expense Report Errors: Control Charts Under Independence and Dependence. Darren Williams. (Under the direction of Dr.
 Monitoring Expense Report Errors: Control Charts Under Independence and Dependence by Darren Williams (Under the direction of Dr. Lynne Seymour) Abstract Control charts were devised to evaluate offices
Algorithms and Complexity
 Algorithms and Complexity 2.1 ALGORITHMS( 演算法 ) Def: An algorithm is a finite set of precise instructions for performing a computation or for solving a problem The word algorithm algorithm comes from the
生物統計教育訓練 - 課程. Introduction to equivalence, superior, inferior studies in RCT 謝宗成副教授慈濟大學醫學科學研究所. TEL: ext 2015
 生物統計教育訓練 - 課程 Introduction to equivalence, superior, inferior studies in RCT 謝宗成副教授慈濟大學醫學科學研究所 tchsieh@mail.tcu.edu.tw TEL: 03-8565301 ext 2015 1 Randomized controlled trial Two arms trial Test treatment
Statistical Intervals and the Applications. Hsiuying Wang Institute of Statistics National Chiao Tung University Hsinchu, Taiwan
 and the Applications Institute of Statistics National Chiao Tung University Hsinchu, Taiwan 1. Confidence Interval (CI) 2. Tolerance Interval (TI) 3. Prediction Interval (PI) Example A manufacturer wanted
2.830J / 6.780J / ESD.63J Control of Manufacturing Processes (SMA 6303) Spring 2008
 Spring 2008") MIT OpenCourseWare http://ocw.mit.edu 2.830J / 6.780J / ESD.63J Control of Processes (SMA 6303) Spring 2008 For information about citing these materials or our Terms of Use, visit: http://ocw.mit.edu/terms.
MIT OpenCourseWare http://ocw.mit.edu 2.830J / 6.780J / ESD.63J Control of Processes (SMA 6303) Spring 2008 For information about citing these materials or our Terms of Use, visit: http://ocw.mit.edu/terms.
MCUSUM CONTROL CHART PROCEDURE: MONITORING THE PROCESS MEAN WITH APPLICATION
 Journal of Statistics: Advances in Theory and Applications Volume 6, Number, 206, Pages 05-32 Available at http://scientificadvances.co.in DOI: http://dx.doi.org/0.8642/jsata_700272 MCUSUM CONTROL CHART
Frequency Response (Bode Plot) with MATLAB
 with MATLAB") Frequency Response (Bode Plot) with MATLAB 黃馨儀 216/6/15 適應性光子實驗室 常用功能選單 File 選單上第一個指令 New 有三個選項 : M-file Figure Model 開啟一個新的檔案 (*.m) 用以編輯 MATLAB 程式 開始一個新的圖檔 開啟一個新的 simulink 檔案 Help MATLAB Help 查詢相關函式 MATLAB
Frequency Response (Bode Plot) with MATLAB 黃馨儀 216/6/15 適應性光子實驗室 常用功能選單 File 選單上第一個指令 New 有三個選項 : M-file Figure Model 開啟一個新的檔案 (*.m) 用以編輯 MATLAB 程式 開始一個新的圖檔 開啟一個新的 simulink 檔案 Help MATLAB Help 查詢相關函式 MATLAB
Introduction to Time Series (I)
") Introduction to Time Series (I) ZHANG RONG Department of Social Networking Operations Social Networking Group Tencent Company November 20, 2017 ZHANG RONG Introduction to Time Series (I) 1/69 Outline 1
Introduction to Time Series (I) ZHANG RONG Department of Social Networking Operations Social Networking Group Tencent Company November 20, 2017 ZHANG RONG Introduction to Time Series (I) 1/69 Outline 1
On Efficient Memory-Type Control Charts for Monitoring out of Control Signals in a Process Using Diabetic Data
 Biomedical Statistics and Informatics 017; (4): 138-144 http://www.sciencepublishinggroup.com/j/bsi doi: 10.11648/j.bsi.017004.1 On Efficient Memory-Type Control Charts for Monitoring out of Control Signals
Faculty of Science and Technology MASTER S THESIS
 Faculty of Science and Technology MASTER S THESIS Study program/ Specialization: Spring semester, 20... Open / Restricted access Writer: Faculty supervisor: (Writer s signature) External supervisor(s):
Quality Control & Statistical Process Control (SPC)
") Quality Control & Statistical Process Control (SPC) DR. RON FRICKER PROFESSOR & HEAD, DEPARTMENT OF STATISTICS DATAWORKS CONFERENCE, MARCH 22, 2018 Agenda Some Terminology & Background SPC Methods & Philosophy
Quality Control & Statistical Process Control (SPC) DR. RON FRICKER PROFESSOR & HEAD, DEPARTMENT OF STATISTICS DATAWORKS CONFERENCE, MARCH 22, 2018 Agenda Some Terminology & Background SPC Methods & Philosophy
Chapter 4 Experiments with Blocking Factors
 Chapter 4 Experiments with Blocking Factors 許湘伶 Design and Analysis of Experiments (Douglas C. Montgomery) hsuhl (NUK) DAE Chap. 4 1 / 54 The Randomized Complete Block Design (RCBD; 隨機化完全集區設計 ) 1 Variability
= lim(x + 1) lim x 1 x 1 (x 2 + 1) 2 (for the latter let y = x2 + 1) lim
 lim x 1 x 1 (x 2 + 1) 2 (for the latter let y = x2 + 1) lim") 1061 微乙 01-05 班期中考解答和評分標準 1. (10%) (x + 1)( (a) 求 x+1 9). x 1 x 1 tan (π(x )) (b) 求. x (x ) x (a) (5 points) Method without L Hospital rule: (x + 1)( x+1 9) = (x + 1) x+1 x 1 x 1 x 1 x 1 (x + 1) (for the
1061 微乙 01-05 班期中考解答和評分標準 1. (10%) (x + 1)( (a) 求 x+1 9). x 1 x 1 tan (π(x )) (b) 求. x (x ) x (a) (5 points) Method without L Hospital rule: (x + 1)( x+1 9) = (x + 1) x+1 x 1 x 1 x 1 x 1 (x + 1) (for the
COMPARISON OF MCUSUM AND GENERALIZED VARIANCE S MULTIVARIATE CONTROL CHART PROCEDURE WITH INDUSTRIAL APPLICATION
 Journal of Statistics: Advances in Theory and Applications Volume 8, Number, 07, Pages 03-4 Available at http://scientificadvances.co.in DOI: http://dx.doi.org/0.864/jsata_700889 COMPARISON OF MCUSUM AND
Chapter 22 Lecture. Essential University Physics Richard Wolfson 2 nd Edition. Electric Potential 電位 Pearson Education, Inc.
 Chapter 22 Lecture Essential University Physics Richard Wolfson 2 nd Edition Electric Potential 電位 Slide 22-1 In this lecture you ll learn 簡介 The concept of electric potential difference 電位差 Including
Chapter 8 Lecture. Essential University Physics Richard Wolfson 2 nd Edition. Gravity 重力 Pearson Education, Inc. Slide 8-1
 Chapter 8 Lecture Essential University Physics Richard Wolfson 2 nd Edition Gravity 重力 Slide 8-1 In this lecture you ll learn 簡介 Newton s law of universal gravitation 萬有引力 About motion in circular and
Section II: Assessing Chart Performance. (Jim Benneyan)
") Section II: Assessing Chart Performance (Jim Benneyan) 1 Learning Objectives Understand concepts of chart performance Two types of errors o Type 1: Call an in-control process out-of-control o Type 2: Call
Section II: Assessing Chart Performance (Jim Benneyan) 1 Learning Objectives Understand concepts of chart performance Two types of errors o Type 1: Call an in-control process out-of-control o Type 2: Call
Chapter 13 Introduction to Nonlinear Regression( 非線性迴歸 )
") Chapter 13 Introduction to Nonlinear Regression( 非線性迴歸 ) and Neural Networks( 類神經網路 ) 許湘伶 Applied Linear Regression Models (Kutner, Nachtsheim, Neter, Li) hsuhl (NUK) LR Chap 10 1 / 35 13 Examples of nonlinear
Chapter 13 Introduction to Nonlinear Regression( 非線性迴歸 ) and Neural Networks( 類神經網路 ) 許湘伶 Applied Linear Regression Models (Kutner, Nachtsheim, Neter, Li) hsuhl (NUK) LR Chap 10 1 / 35 13 Examples of nonlinear
Multivariate Process Control Chart for Controlling the False Discovery Rate
 Industrial Engineering & Management Systems Vol, No 4, December 0, pp.385-389 ISSN 598-748 EISSN 34-6473 http://dx.doi.org/0.73/iems.0..4.385 0 KIIE Multivariate Process Control Chart for Controlling e
Total Quality Management (TQM)
") Total Quality Management (TQM) Use of statistical techniques for controlling and improving quality and their integration in the management system Statistical Process Control (SPC) Univariate and multivariate
Total Quality Management (TQM) Use of statistical techniques for controlling and improving quality and their integration in the management system Statistical Process Control (SPC) Univariate and multivariate
Ch.9 Liquids and Solids
 Ch.9 Liquids and Solids 9.1. Liquid-Vapor Equilibrium 1. Vapor Pressure. Vapor Pressure versus Temperature 3. Boiling Temperature. Critical Temperature and Pressure 9.. Phase Diagram 1. Sublimation. Melting
Digital Integrated Circuits Lecture 5: Logical Effort
 Digital Integrated Circuits Lecture 5: Logical Effort Chih-Wei Liu VLSI Signal Processing LAB National Chiao Tung University cwliu@twins.ee.nctu.edu.tw DIC-Lec5 cwliu@twins.ee.nctu.edu.tw 1 Outline RC
Variations in a manufacturing process can be categorized into common cause and special cause variations. In the presence of
 Research Article (wileyonlinelibrary.com) DOI: 10.1002/qre.1514 Published online in Wiley Online Library Memory-Type Control Charts for Monitoring the Process Dispersion Nasir Abbas, a * Muhammad Riaz
Finite Interval( 有限區間 ) open interval ( a, closed interval [ ab, ] = { xa x b} half open( or half closed) interval. Infinite Interval( 無限區間 )
![Finite Interval( 有限區間 ) open interval ( a, closed interval [ ab, ] = { xa x b} half open( or half closed) interval. Infinite Interval( 無限區間 )](/thumbs/84/89512751.jpg "Finite Interval( 有限區間 ) open interval ( a, closed interval [ ab, ] = { xa x b} half open( or half closed) interval. Infinite Interval( 無限區間 )") Finite Interval( 有限區間 ) open interval ( a, b) { a< < b} closed interval [ ab, ] { a b} hal open( or hal closed) interval ( ab, ] { a< b} [ ab, ) { a < b} Ininite Interval( 無限區間 ) [ a, ) { a < } (, b] {
Finite Interval( 有限區間 ) open interval ( a, b) { a< < b} closed interval [ ab, ] { a b} hal open( or hal closed) interval ( ab, ] { a< b} [ ab, ) { a < b} Ininite Interval( 無限區間 ) [ a, ) { a < } (, b] {
Chapter 1 Linear Regression with One Predictor Variable
 Chapter 1 Linear Regression with One Predictor Variable 許湘伶 Applied Linear Regression Models (Kutner, Nachtsheim, Neter, Li) hsuhl (NUK) LR Chap 1 1 / 52 迴歸分析 Regression analysis is a statistical methodology
Hybrid Simulations of Ground Motions for the Earthquake Scenarios of Shanchiao and Hengchun faults
 Hybrid Simulations of Ground Motions for the Earthquake Scenarios of Shanchiao and Hengchun faults 顏銀桐 Yin Tung Yen Sinotech Engineering Consultants, Inc. 2012.09.11@NCU Institute of Nuclear Energy Research
Chapter 20 Cell Division Summary
 Chapter 20 Cell Division Summary Bk3 Ch20 Cell Division/1 Table 1: The concept of cell (Section 20.1) A repeated process in which a cell divides many times to make new cells Cell Responsible for growth,
2.830J / 6.780J / ESD.63J Control of Manufacturing Processes (SMA 6303) Spring 2008
 Spring 2008") MIT OpenCourseWare http://ocw.mit.edu 2.830J / 6.780J / ESD.63J Control of Processes (SMA 6303) Spring 2008 For information about citing these materials or our Terms of Use, visit: http://ocw.mit.edu/term
MIT OpenCourseWare http://ocw.mit.edu 2.830J / 6.780J / ESD.63J Control of Processes (SMA 6303) Spring 2008 For information about citing these materials or our Terms of Use, visit: http://ocw.mit.edu/term
MECHANICS OF MATERIALS
 CHAPTER 2 MECHANICS OF MATERIALS Ferdinand P. Beer E. Russell Johnston, Jr. John T. DeWolf David F. Mazurek Lecture Notes: J. Walt Oler Texas Tech University Stress and Strain Axial Loading 2.1 An Introduction
d) There is a Web page that includes links to both Web page A and Web page B.
 There is a Web page that includes links to both Web page A and Web page B.") P403-406 5. Determine whether the relation R on the set of all eb pages is reflexive( 自反 ), symmetric( 对 称 ), antisymmetric( 反对称 ), and/or transitive( 传递 ), where (a, b) R if and only if a) Everyone who
P403-406 5. Determine whether the relation R on the set of all eb pages is reflexive( 自反 ), symmetric( 对 称 ), antisymmetric( 反对称 ), and/or transitive( 传递 ), where (a, b) R if and only if a) Everyone who
Numbers and Fundamental Arithmetic
 1 Numbers and Fundamental Arithmetic Hey! Let s order some pizzas for a party! How many pizzas should we order? There will be 1 people in the party. Each people will enjoy 3 slices of pizza. Each pizza
CONTROL CHARTS FOR THE GENERALIZED POISSON PROCESS WITH UNDER-DISPERSION
 International J. of Math. Sci. & Engg. Appls. (IJMSEA) ISSN 0973-9424, Vol. 10 No. III (December, 2016), pp. 173-181 CONTROL CHARTS FOR THE GENERALIZED POISSON PROCESS WITH UNDER-DISPERSION NARUNCHARA
Candidates Performance in Paper I (Q1-4, )
") HKDSE 2016 Candidates Performance in Paper I (Q1-4, 10-14 ) 7, 17 November 2016 General Comments General and Common Weaknesses Weak in calculations Unable to give the appropriate units for numerical answers
HKDSE 2016 Candidates Performance in Paper I (Q1-4, 10-14 ) 7, 17 November 2016 General Comments General and Common Weaknesses Weak in calculations Unable to give the appropriate units for numerical answers
arxiv: v1 [stat.me] 14 Jan 2019
![arxiv: v1 [stat.me] 14 Jan 2019](/thumbs/93/114174698.jpg "arxiv: v1 [stat.me] 14 Jan 2019") arxiv:1901.04443v1 [stat.me] 14 Jan 2019 An Approach to Statistical Process Control that is New, Nonparametric, Simple, and Powerful W.J. Conover, Texas Tech University, Lubbock, Texas V. G. Tercero-Gómez,Tecnológico
arxiv:1901.04443v1 [stat.me] 14 Jan 2019 An Approach to Statistical Process Control that is New, Nonparametric, Simple, and Powerful W.J. Conover, Texas Tech University, Lubbock, Texas V. G. Tercero-Gómez,Tecnológico
Advanced Engineering Mathematics 長榮大學科工系 105 級
 工程數學 Advanced Engineering Mathematics 長榮大學科工系 5 級 姓名 : 學號 : 工程數學 I 目錄 Part I: Ordinary Differential Equations (ODE / 常微分方程式 ) Chapter First-Order Differential Equations ( 一階 ODE) 3 Chapter Second-Order
Chapter 6. Series-Parallel Circuits ISU EE. C.Y. Lee
 Chapter 6 Series-Parallel Circuits Objectives Identify series-parallel relationships Analyze series-parallel circuits Determine the loading effect of a voltmeter on a circuit Analyze a Wheatstone bridge
CUMULATIVE SUM CHARTS FOR HIGH YIELD PROCESSES
 Statistica Sinica 11(2001), 791-805 CUMULATIVE SUM CHARTS FOR HIGH YIELD PROCESSES T. C. Chang and F. F. Gan Infineon Technologies Melaka and National University of Singapore Abstract: The cumulative sum
On the performance of Shewhart-type synthetic and runs-rules charts combined with an chart
 On the performance of Shewhart-type synthetic and runs-rules charts combined with an chart Sandile Charles Shongwe and Marien Alet Graham Department of Statistics University of Pretoria South Africa Abstract
Chapter 11 Building the Regression Model II:
 Chapter 11 Building the Regression Model II: Remedial Measures( 補救措施 ) 許湘伶 Applied Linear Regression Models (Kutner, Nachtsheim, Neter, Li) hsuhl (NUK) LR Chap 11 1 / 48 11.1 WLS remedial measures may
An Adaptive Exponentially Weighted Moving Average Control Chart for Monitoring Process Variances
 An Adaptive Exponentially Weighted Moving Average Control Chart for Monitoring Process Variances Lianjie Shu Faculty of Business Administration University of Macau Taipa, Macau (ljshu@umac.mo) Abstract
The magnetic field. The force can be detected by
 The magnetic field When a field is generated in a volume of space it means that there is a change in energy of that volume, and furthermore that there is an energy gradient so that a force is produced.
Chapter 2 Inferences in Regression and Correlation Analysis
 Chapter 2 Inferences in Regression and Correlation Analysis 許湘伶 Applied Linear Regression Models (Kutner, Nachtsheim, Neter, Li) hsuhl (NUK) LR Chap 2 1 / 102 Inferences concerning the regression parameters
EXPERMENT 9. To determination of Quinine by fluorescence spectroscopy. Introduction
 EXPERMENT 9 To determination of Quinine by fluorescence spectroscopy Introduction Many chemical compounds can be excited by electromagnetic radication from normally a singlet ground state S o to upper
Multi-Variate-Attribute Quality Control (MVAQC)
") by Submitted in total fulfillment of the requirements of the degree of Doctor of Philosophy July 2014 Department of Mechanical Engineering The University of Melboune Abstract When the number of quality
by Submitted in total fulfillment of the requirements of the degree of Doctor of Philosophy July 2014 Department of Mechanical Engineering The University of Melboune Abstract When the number of quality
大原利明 算法点竄指南 点竄術 算 額 絵馬堂
 算額 大原利明 算法点竄指南 点竄術 算 額 絵馬 絵 馬 絵馬堂 甲 一 乙 二 丙 三 丁 四 戊 五 己 六 庚 七 辛 八 壬 九 癸 十 十五 二十 百 千 甲 乙 丙 丁 傍書法 関孝和 点竄術 松永良弼 甲 甲 甲 甲 甲 乙 甲 甲 乙 甲 乙 甲 乙 甲 乙 丙 丁 戊 a + b 2 c 甲 a a 二乙 2 b b 2 小 c c SOLVING SANGAKU 5 3.1.
Analysis and Design of One- and Two-Sided Cusum Charts with Known and Estimated Parameters
 Georgia Southern University Digital Commons@Georgia Southern Electronic Theses & Dissertations Graduate Studies, Jack N. Averitt College of Spring 2007 Analysis and Design of One- and Two-Sided Cusum Charts
Module B1: Multivariate Process Control
 Module B1: Multivariate Process Control Prof. Fugee Tsung Hong Kong University of Science and Technology Quality Lab: http://qlab.ielm.ust.hk I. Multivariate Shewhart chart WHY MULTIVARIATE PROCESS CONTROL
Chapter 5-7 Errors, Random Errors, and Statistical Data in Chemical Analyses
 Chapter 5-7 Errors, Random Errors, and Statistical Data in Chemical Analyses Impossible: The analytical results are free of errors or uncertainties. Possible: Minimize these errors and estimate their size
21.1 Traditional Monitoring Techniques Extensions of Statistical Process Control Multivariate Statistical Techniques
 1 Process Monitoring 21.1 Traditional Monitoring Techniques 21.2 Quality Control Charts 21.3 Extensions of Statistical Process Control 21.4 Multivariate Statistical Techniques 21.5 Control Performance
Mathematical and Computer Modelling. Economic design of EWMA control charts based on loss function
 Mathematical and Computer Modelling 49 (2009) 745 759 Contents lists available at ScienceDirect Mathematical and Computer Modelling journal homepage: www.elsevier.com/locate/mcm Economic design of EWMA
THE DETECTION OF SHIFTS IN AUTOCORRELATED PROCESSES WITH MR AND EWMA CHARTS
 THE DETECTION OF SHIFTS IN AUTOCORRELATED PROCESSES WITH MR AND EWMA CHARTS Karin Kandananond, kandananond@hotmail.com Faculty of Industrial Technology, Rajabhat University Valaya-Alongkorn, Prathumthani,
An Investigation of Combinations of Multivariate Shewhart and MEWMA Control Charts for Monitoring the Mean Vector and Covariance Matrix
 Technical Report Number 08-1 Department of Statistics Virginia Polytechnic Institute and State University, Blacksburg, Virginia January, 008 An Investigation of Combinations of Multivariate Shewhart and
Directionally Sensitive Multivariate Statistical Process Control Methods
 Directionally Sensitive Multivariate Statistical Process Control Methods Ronald D. Fricker, Jr. Naval Postgraduate School October 5, 2005 Abstract In this paper we develop two directionally sensitive statistical
期中考前回顧 助教 : 王珊彗. Copyright 2009 Cengage Learning
 期中考前回顧 助教 : 王珊彗 考前提醒 考試時間 :11/17( 四 )9:10~12:10 考試地點 : 管二 104 ( 上課教室 ) 考試範圍 :C1-C9, 選擇 + 計算 注意事項 : 考試請務必帶工程計算機 可帶 A4 參考紙 ( 單面 不能浮貼 ) 計算過程到第四位, 結果寫到小數點第二位 不接受沒有公式, 也不接受沒算出最後答案 考試只會附上 standard normal distribution
Performance of Conventional X-bar Chart for Autocorrelated Data Using Smaller Sample Sizes
 , 23-25 October, 2013, San Francisco, USA Performance of Conventional X-bar Chart for Autocorrelated Data Using Smaller Sample Sizes D. R. Prajapati Abstract Control charts are used to determine whether
統計學 ( 一 ) 第七章信賴區間估計 (Estimation Using Confidence Intervals) 授課教師 : 唐麗英教授 國立交通大學工業工程與管理學系聯絡電話 :(03)
 第七章信賴區間估計 (Estimation Using Confidence Intervals) 授課教師 : 唐麗英教授 國立交通大學工業工程與管理學系聯絡電話 :(03)") 統計學 ( 一 ) 第七章信賴區間估計 (Estimation Using Confidence Intervals) 授課教師 : 唐麗英教授 國立交通大學工業工程與管理學系聯絡電話 :(03)573896 e-mail:litong@cc.nctu.edu.tw 03 本講義未經同意請勿自行翻印 本課程內容參考書目 教科書 Mendenhall, W., & Sincich, T. (007).
統計學 ( 一 ) 第七章信賴區間估計 (Estimation Using Confidence Intervals) 授課教師 : 唐麗英教授 國立交通大學工業工程與管理學系聯絡電話 :(03)573896 e-mail:litong@cc.nctu.edu.tw 03 本講義未經同意請勿自行翻印 本課程內容參考書目 教科書 Mendenhall, W., & Sincich, T. (007).
1 dx (5%) andˆ x dx converges. x2 +1 a
 andˆ x dx converges. x2 +1 a") 微甲 - 班期末考解答和評分標準. (%) (a) (7%) Find the indefinite integrals of secθ dθ.) d (5%) and + d (%). (You may use the integral formula + (b) (%) Find the value of the constant a for which the improper integral
微甲 - 班期末考解答和評分標準. (%) (a) (7%) Find the indefinite integrals of secθ dθ.) d (5%) and + d (%). (You may use the integral formula + (b) (%) Find the value of the constant a for which the improper integral
2019 年第 51 屆國際化學奧林匹亞競賽 國內初選筆試 - 選擇題答案卷
 2019 年第 51 屆國際化學奧林匹亞競賽 國內初選筆試 - 選擇題答案卷 一 單選題 :( 每題 3 分, 共 72 分 ) 題號 1 2 3 4 5 6 7 8 答案 B D D A C B C B 題號 9 10 11 12 13 14 15 16 答案 C E D D 送分 E A B 題號 17 18 19 20 21 22 23 24 答案 D A E C A C 送分 B 二 多選題
Numerical Analysis in Geotechnical Engineering
 M.Sc. in Geological Engineering: Subject No. 8183B2 Numerical Analysis in Geotechnical Engineering Hong-Hu ZHU ( 朱鸿鹄 ) School of Earth Sciences and Engineering, Nanjing University www.slope.com.cn Lecture
Selection of Variable Selecting the right variable for a control chart means understanding the difference between discrete and continuous data.
 Statistical Process Control, or SPC, is a collection of tools that allow a Quality Engineer to ensure that their process is in control, using statistics. Benefit of SPC The primary benefit of a control
壓差式迴路式均熱片之研製 Fabrication of Pressure-Difference Loop Heat Spreader
 壓差式迴路式均熱片之研製 Fabrication of Pressure-Difference Loop Heat Spreader 1 2* 3 4 4 Yu-Tang Chen Shei Hung-Jung Sheng-Hong Tsai Shung-Wen Kang Chin-Chun Hsu 1 2* 3! "# $ % 4& '! " ( )* +, -. 95-2622-E-237-001-CC3
Zero-Inflated Models in Statistical Process Control
 Chapter 6 Zero-Inflated Models in Statistical Process Control 6.0 Introduction In statistical process control Poisson distribution and binomial distribution play important role. There are situations wherein
Chapter 1 Physics and Measurement
 Chapter 1 Physics and Measurement We have always been curious about the world around us. Classical Physics It constructs the concepts Galileo (1564-1642) and Newton s space and time. It includes mechanics
Source mechanism solution
 Source mechanism solution Contents Source mechanism solution 1 1. A general introduction 1 2. A step-by-step guide 1 Step-1: Prepare data files 1 Step-2: Start GeoTaos or GeoTaos_Map 2 Step-3: Convert
國立中正大學八十一學年度應用數學研究所 碩士班研究生招生考試試題
 國立中正大學八十一學年度應用數學研究所 碩士班研究生招生考試試題 基礎數學 I.(2%) Test for convergence or divergence of the following infinite series cos( π (a) ) sin( π n (b) ) n n=1 n n=1 n 1 1 (c) (p > 1) (d) n=2 n(log n) p n,m=1 n 2 +
Differential Equations (DE)
") 工程數學 -- 微分方程 51 Differenial Equaions (DE) 授課者 : 丁建均 教學網頁 :hp://djj.ee.nu.edu.w/de.hm 本著作除另有註明外, 採取創用 CC 姓名標示 - 非商業性 - 相同方式分享 台灣 3. 版授權釋出 Chaper 8 Sysems of Linear Firs-Order Differenial Equaions 另一種解 聯立微分方程式
工程數學 -- 微分方程 51 Differenial Equaions (DE) 授課者 : 丁建均 教學網頁 :hp://djj.ee.nu.edu.w/de.hm 本著作除另有註明外, 採取創用 CC 姓名標示 - 非商業性 - 相同方式分享 台灣 3. 版授權釋出 Chaper 8 Sysems of Linear Firs-Order Differenial Equaions 另一種解 聯立微分方程式
Statistical quality control (SQC)
") Statistical quality control (SQC) The application of statistical techniques to measure and evaluate the quality of a product, service, or process. Two basic categories: I. Statistical process control (SPC):
Statistical quality control (SQC) The application of statistical techniques to measure and evaluate the quality of a product, service, or process. Two basic categories: I. Statistical process control (SPC):
Statistical Quality Control In The Production Of Pepsi Drinks
 Statistical Quality Control In The Production Of Pepsi Drins Lasisi K. E and 2 Abdulazeez K. A Mathematical Sciences, Abubaar Tafawa Balewa University, P.M.B.0248, Bauchi, Nigeria 2 Federal College of
Exponentially Weighted Moving Average Control Charts for Monitoring Increases in Poisson Rate
 Exponentially Weighted Moving Average Control Charts for Monitoring Increases in Poisson Rate Lianjie SHU 1,, Wei JIANG 2, and Zhang WU 3 EndAName 1 Faculty of Business Administration University of Macau
SCIENCE & TECHNOLOGY
 Pertanika J. Sci. & Technol. 24 (1): 177-189 (2016) SCIENCE & TECHNOLOGY Journal homepage: http://www.pertanika.upm.edu.my/ A Comparative Study of the Group Runs and Side Sensitive Group Runs Control Charts
Candidates Performance in Paper I (Q1-4, )
") HKDSE 2018 Candidates Performance in Paper I (Q1-4, 10-14 ) 8, 9 November 2018 General and Common Weaknesses Weak in calculations Weak in conversion of units in calculations (e.g. cm 3 to dm 3 ) Weak in
HKDSE 2018 Candidates Performance in Paper I (Q1-4, 10-14 ) 8, 9 November 2018 General and Common Weaknesses Weak in calculations Weak in conversion of units in calculations (e.g. cm 3 to dm 3 ) Weak in
授課大綱 課號課程名稱選別開課系級學分 結果預視
 授課大綱 課號課程名稱選別開課系級學分 B06303A 流體力學 Fluid Mechanics 必 結果預視 課程介紹 (Course Description): 機械工程學系 三甲 3 在流體力學第一課的學生可能會問 : 什麼是流體力學? 為什麼我必須研究它? 我為什麼要研究它? 流體力學有哪些應用? 流體包括液體和氣體 流體力學涉及靜止和運動時流體的行為 對流體力學的基本原理和概念的了解和理解對分析任何工程系統至關重要,
邏輯設計 Hw#6 請於 6/13( 五 ) 下課前繳交
 下課前繳交") 邏輯設計 Hw#6 請於 6/3( 五 ) 下課前繳交 . A sequential circuit with two D flip-flops A and B, two inputs X and Y, and one output Z is specified by the following input equations: D A = X A + XY D B = X A + XB Z = XB
邏輯設計 Hw#6 請於 6/3( 五 ) 下課前繳交 . A sequential circuit with two D flip-flops A and B, two inputs X and Y, and one output Z is specified by the following input equations: D A = X A + XY D B = X A + XB Z = XB
Lecture Note on Linear Algebra 14. Linear Independence, Bases and Coordinates
 Lecture Note on Linear Algebra 14 Linear Independence, Bases and Coordinates Wei-Shi Zheng, wszheng@ieeeorg, 211 November 3, 211 1 What Do You Learn from This Note Do you still remember the unit vectors
Chapter 10 Building the Regression Model II: Diagnostics
 Chapter 10 Building the Regression Model II: Diagnostics 許湘伶 Applied Linear Regression Models (Kutner, Nachtsheim, Neter, Li) hsuhl (NUK) LR Chap 10 1 / 41 10.1 Model Adequacy for a Predictor Variable-Added
2001 HG2, 2006 HI6, 2010 HI1
 - Individual 9 50450 8 4 5 8 9 04 6 6 ( 8 ) 7 6 8 4 9 x, y 0 ( 8 8.64) 4 4 5 5 - Group Individual Events I 6 07 + 006 4 50 5 0 6 6 7 0 8 *4 9 80 0 5 see the remark Find the value of the unit digit of +
THE CUSUM MEDIAN CHART FOR KNOWN AND ESTIMATED PARAMETERS
 THE CUSUM MEDIAN CHART FOR KNOWN AND ESTIMATED PARAMETERS Authors: Philippe Castagliola Université de Nantes & LS2N UMR CNRS 6004, Nantes, France (philippe.castagliola@univ-nantes.fr) Fernanda Otilia Figueiredo
Statistical Quality Control - Stat 3081
 Statistical Quality Control - Stat 3081 Awol S. Department of Statistics College of Computing & Informatics Haramaya University Dire Dawa, Ethiopia March 2015 Introduction Industrial Statistics and Quality
台灣大學開放式課程 有機化學乙 蔡蘊明教授 本著作除另有註明, 作者皆為蔡蘊明教授, 所有內容皆採用創用 CC 姓名標示 - 非商業使用 - 相同方式分享 3.0 台灣授權條款釋出
 台灣大學開放式課程 有機化學乙 蔡蘊明教授 本著作除另有註明, 作者皆為蔡蘊明教授, 所有內容皆採用創用 姓名標示 - 非商業使用 - 相同方式分享 3.0 台灣授權條款釋出 hapter S Stereochemistry ( 立體化學 ): chiral molecules ( 掌性分子 ) Isomerism constitutional isomers butane isobutane 分子式相同但鍵結方式不同
國立成功大學 航空太空工程學系 碩士論文 研究生 : 柯宗良 指導教授 : 楊憲東
 國立成功大學 航空太空工程學系 碩士論文 波函數的統計力學詮釋 Statistical Interpretation of Wave Function 研究生 : 柯宗良 指導教授 : 楊憲東 Department of Aeronautics and Astronautics National Cheng Kung University Tainan, Taiwan, R.O.C. Thesis
IE 361 Module 25. Introduction to Shewhart Control Charting Part 2 (Statistical Process Control, or More Helpfully: Statistical Process Monitoring)
") IE 361 Module 25 Introduction to Shewhart Control Charting Part 2 (Statistical Process Control, or More Helpfully: Statistical Process Monitoring) Reading: Section 3.1 Statistical Methods for Quality Assurance
IE 361 Module 25 Introduction to Shewhart Control Charting Part 2 (Statistical Process Control, or More Helpfully: Statistical Process Monitoring) Reading: Section 3.1 Statistical Methods for Quality Assurance
第二章 : Hydrostatics and Atmospheric Stability. Ben Jong-Dao Jou Autumn 2010
 第二章 : Hydrostatics and Atmospheric Stability Ben Jong-Dao Jou Autumn 2010 Part I: Hydrostatics 1. Gravity 2. Geopotential: The concept of geopotential is used in measurement of heights in the atmosphere
2( 2 r 2 2r) rdrdθ. 4. Your result fits the correct answer: get 2 pts, if you make a slight mistake, get 1 pt. 0 r 1
 rdrdθ. 4. Your result fits the correct answer: get 2 pts, if you make a slight mistake, get 1 pt. 0 r 1") Page 1 of 1 112 微甲 7-11 班期末考解答和評分標準 1. (1%) Find the volume of the solid bounded below by the cone z 2 4(x 2 + y 2 ) and above by the ellipsoid 4(x 2 + y 2 ) + z 2 8. Method 1 Use cylindrical coordinates:
Page 1 of 1 112 微甲 7-11 班期末考解答和評分標準 1. (1%) Find the volume of the solid bounded below by the cone z 2 4(x 2 + y 2 ) and above by the ellipsoid 4(x 2 + y 2 ) + z 2 8. Method 1 Use cylindrical coordinates:
5.5 Using Entropy to Calculate the Natural Direction of a Process in an Isolated System
 5.5 Using Entropy to Calculate the Natural Direction of a Process in an Isolated System 熵可以用來預測自發改變方向 我們現在回到 5.1 節引入兩個過程 第一個過程是關於金屬棒在溫度梯度下的自然變化方向 試問, 在系統達平衡狀態時, 梯度變大或更小? 為了模擬這過程, 考慮如圖 5.5 的模型, 一孤立的複合系統受
A Theoretically Appropriate Poisson Process Monitor
 International Journal of Performability Engineering, Vol. 8, No. 4, July, 2012, pp. 457-461. RAMS Consultants Printed in India A Theoretically Appropriate Poisson Process Monitor RYAN BLACK and JUSTIN
Confirmation Sample Control Charts
 Confirmation Sample Control Charts Stefan H. Steiner Dept. of Statistics and Actuarial Sciences University of Waterloo Waterloo, NL 3G1 Canada Control charts such as X and R charts are widely used in industry
Self-Starting Control Chart for Simultaneously Monitoring Process Mean and Variance
 International Journal of Production Research Vol. 00, No. 00, 15 March 2008, 1 14 Self-Starting Control Chart for Simultaneously Monitoring Process Mean and Variance Zhonghua Li a, Jiujun Zhang a,b and
Institute of Actuaries of India
 Institute of Actuaries of India Subject CT3 Probability and Mathematical Statistics For 2018 Examinations Subject CT3 Probability and Mathematical Statistics Core Technical Syllabus 1 June 2017 Aim The
Galileo Galilei ( ) Title page of Galileo's Dialogue concerning the two chief world systems, published in Florence in February 1632.
 Title page of Galileo's Dialogue concerning the two chief world systems, published in Florence in February 1632.") Special Relativity Galileo Galilei (1564-1642) Title page of Galileo's Dialogue concerning the two chief world systems, published in Florence in February 1632. 2 Galilean Transformation z z!!! r ' = r
Special Relativity Galileo Galilei (1564-1642) Title page of Galileo's Dialogue concerning the two chief world systems, published in Florence in February 1632. 2 Galilean Transformation z z!!! r ' = r
2.830J / 6.780J / ESD.63J Control of Manufacturing Processes (SMA 6303)
") MIT OpenCourseWare http://ocw.mit.edu 2.830J / 6.780J / ESD.63J Control of Processes (SMA 6303) Spring 2008 For information about citing these materials or our Terms of Use, visit: http://ocw.mit.edu/terms.
MIT OpenCourseWare http://ocw.mit.edu 2.830J / 6.780J / ESD.63J Control of Processes (SMA 6303) Spring 2008 For information about citing these materials or our Terms of Use, visit: http://ocw.mit.edu/terms.
國立交通大學 電子工程學系電子研究所碩士班 碩士論文
 國立交通大學 電子工程學系電子研究所碩士班 碩士論文 萃取接觸阻抗係數方法之比較研究 CBKR 結構與改良式 TLM 結構 A Comparison Study of the Specific Contact Resistivity Extraction Methods: CBKR Method and Modified TLM Method 研究生 : 曾炫滋 指導教授 : 崔秉鉞教授 中華民國一
tan θ(t) = 5 [3 points] And, we are given that d [1 points] Therefore, the velocity of the plane is dx [4 points] (km/min.) [2 points] (The other way)
![tan θ(t) = 5 [3 points] And, we are given that d [1 points] Therefore, the velocity of the plane is dx [4 points] (km/min.) [2 points] (The other way)](/thumbs/74/69694342.jpg "tan θ(t) = 5 [3 points] And, we are given that d [1 points] Therefore, the velocity of the plane is dx [4 points] (km/min.) [2 points] (The other way)") 1051 微甲 06-10 班期中考解答和評分標準 1. (10%) A plane flies horizontally at an altitude of 5 km and passes directly over a tracking telescope on the ground. When the angle of elevation is π/3, this angle is decreasing
1051 微甲 06-10 班期中考解答和評分標準 1. (10%) A plane flies horizontally at an altitude of 5 km and passes directly over a tracking telescope on the ground. When the angle of elevation is π/3, this angle is decreasing
Chapter 9 The introduction of EELS EELS principle
 Chapter 9 The introduction of EELS EELS principle (Chap. 37, 38, 39, 40) Textbook: R.F. Egerton, Electron Energy-Loss Spectroscopy in the Electron Microscope, 2nd edition Particle picture of scattering
Reactive Fluid Dynamics 1 G-COE 科目 複雑システムのデザイン体系 第 1 回 植田利久 慶應義塾大学大学院理工学研究科開放環境科学専攻 2009 年 4 月 14 日. Keio University
 Reactive Fluid Dynamics 1 G-COE 科目 複雑システムのデザイン体系 第 1 回 植田利久 慶應義塾大学大学院理工学研究科開放環境科学専攻 2009 年 4 月 14 日 Reactive Fluid Dynamics 2 1 目的 本 G-COE で対象とする大規模複雑力学系システムを取り扱うにあたって, 非線形力学の基本的な知識と応用展開力は不可欠である. そこで,
The Robustness of the Multivariate EWMA Control Chart
 The Robustness of the Multivariate EWMA Control Chart Zachary G. Stoumbos, Rutgers University, and Joe H. Sullivan, Mississippi State University Joe H. Sullivan, MSU, MS 39762 Key Words: Elliptically symmetric,
ApTutorGroup. SAT II Chemistry Guides: Test Basics Scoring, Timing, Number of Questions Points Minutes Questions (Multiple Choice)
") SAT II Chemistry Guides: Test Basics Scoring, Timing, Number of Questions Points Minutes Questions 200-800 60 85 (Multiple Choice) PART A ----------------------------------------------------------------
SAT II Chemistry Guides: Test Basics Scoring, Timing, Number of Questions Points Minutes Questions 200-800 60 85 (Multiple Choice) PART A ----------------------------------------------------------------