Summarizing Measured Data
|
|
|
- Noah Harris
- 5 years ago
- Views:
Transcription
1 Summarizing Measured Data 12-1
2 Overview Basic Probability and Statistics Concepts: CDF, PDF, PMF, Mean, Variance, CoV, Normal Distribution Summarizing Data by a Single Number: Mean, Median, and Mode, Arithmetic, Geometric, Harmonic Means Mean of A Ratio Summarizing Variability: Range, Variance, percentiles, Quartiles Determining Distribution of Data: Quantile-Quantile plots 12-2
3 Part III: Probability Theory and Statistics 1. How to report the performance as a single number? Is specifying the mean the correct way? 2. How to report the variability of measured quantities? What are the alternatives to variance and when are they appropriate? 3. How to interpret the variability? How much confidence can you put on data with a large variability? 4. How many measurements are required to get a desired level of statistical confidence? 5. How to summarize the results of several different workloads on a single computer system? 6. How to compare two or more computer systems using several different workloads? Is comparing the mean sufficient? 7. What model best describes the relationship between two variables? Also, how good is the model? 12-3
4 Basic Probability and Statistics Concepts Independent Events: Two events are called independent if the occurrence of one event does not in any way affect the probability of the other event. Random Variable: A variable is called a random variable if it takes one of a specified set of values with a specified probability. 12-4
5 CDF, PDF, and PMF Cumulative Distribution Function: Probability Density Function: 1 F(x) f(x) 0 x 12-5 x
6 CDF, PDF, and PMF (Cont) Given a pdf f(x): Probability Mass Function: For discrete random variables: f(x i) x i 12-6
7 Mean, Variance, CoV Mean or Expected Value: Variance: The expected value of the square of distance between x and its mean Coefficient of Variation: 12-7
8 Covariance: Covariance and Correlation For independent variables, the covariance is zero: Although independence always implies zero covariance, the reverse is not true. Correlation Coefficient: normalized value of covariance The correlation always lies between -1 and
9 Mean and Variance of Sums If are k random variables and if are k arbitrary constants (called weights), then: For independent variables: 12-9
10 Quantiles,, Median, and Mode Quantile: The x value at which the CDF takes a value α is called the α-quantile or 100α-percentile. It is denoted by x α : Median: The 50-percentile or (0.5-quantile) of a random variable is called its median. Mode: The most likely value, that is, x i that has the highest probability p i, or the x at which pdf is maximum, is called mode of x. F(x) x f(x) x
11 Normal Distribution Normal Distribution: The sum of a large number of independent observations from any distribution has a normal distribution. A normal variate is denoted at N(μ,σ). Unit Normal: A normal distribution with zero mean and unit variance. Also called standard normal distribution and is denoted as N(0,1)
12 Normal Quantiles An α-quantile of a unit normal variate z N(0,1) is denoted by z α. If a random variable x has a N(μ, σ) distribution, then (x-μ)/σ has a N(0,1) distribution. or 12-12
13 Why Normal? There are two main reasons for the popularity of the normal distribution: 1. The sum of n independent normal variates is a normal variate. If, then x= i=1n a i x i has a normal distribution with mean μ= i=1n a i μ i and variance σ 2 = i=1n a i2 σ i2. 2. The sum of a large number of independent observations from any distribution tends to have a normal distribution. This result, which is called central limit theorem, is true for observations from all distributions => Experimental errors caused by many factors are normal
14 Summarizing Data by a Single Number Indices of central tendencies: Mean, Median, Mode Sample Mean is obtained by taking the sum of all observations and dividing this sum by the number of observations in the sample. Sample Median is obtained by sorting the observations in an increasing order and taking the observation that is in the middle of the series. If the number of observations is even, the mean of the middle two values is used as a median. Sample Mode is obtained by plotting a histogram and specifying the midpoint of the bucket where the histogram peaks. For categorical variables, mode is given by the category that occurs most frequently. Mean and median always exist and are unique. Mode, on the other hand, may not exist
15 Mean, Median, and Mode: Relationships 12-15
16 Selecting Mean, Median, and Mode 12-16
17 Indices of Central Tendencies: Examples Most used resource in a system: Resources are categorical and hence mode must be used. Interarrival time: Total time is of interest and so mean is the proper choice. Load on a Computer: Median is preferable due to a highly skewed distribution. Average Configuration: Medians of number devices, memory sizes, number of processors are generally used to specify the configuration due to the skewness of the distribution
18 Common Misuses of Means Using mean of significantly different values: ( )/2 = 505 Using mean without regard to the skewness of distribution
19 Misuses of Means (cont) Multiplying means to get the mean of a product Example: On a timesharing system, Average number of users is 23 Average number of sub-processes per user is 2 What is the average number of sub-processes? Is it 46? No! The number of sub-processes a user spawns depends upon how much load there is on the system. Taking a mean of a ratio with different bases. Already discussed in Chapter 11 on ratio games and is discussed further later 12-19
20 Geometric Mean Geometric mean is used if the product of the observations is a quantity of interest
21 Geometric Mean: Example The performance improvements in 7 layers: 12-21
22 Examples of Multiplicative Metrics Cache hit ratios over several levels of caches Cache miss ratios Percentage performance improvement between successive versions Average error rate per hop on a multi-hop path in a network
23 Geometric Mean of Ratios The geometric mean of a ratio is the ratio of the geometric means of the numerator and denominator => the choice of the base does not change the conclusion. It is because of this property that sometimes geometric mean is recommended for ratios. However, if the geometric mean of the numerator or denominator do not have any physical meaning, the geometric mean of their ratio is meaningless as well
24 Harmonic Mean Used whenever an arithmetic mean can be justified for 1/x i E.g., Elapsed time of a benchmark on a processor In the i th repetition, the benchmark takes t i seconds. Now suppose the benchmark has m million instructions, MIPS x i computed from the i th repetition is: t i 's should be summarized using arithmetic mean since the sum of t_i has a physical meaning => x i 's should be summarized using harmonic mean since the sum of 1/x i 's has a physical meaning
25 Harmonic Mean (Cont) The average MIPS rate for the processor is: However, if x i 's represent the MIPS rate for n different benchmarks so that i th benchmark has m i million instructions, then harmonic mean of n ratios m i /t i cannot be used since the sum of the t i /m i does not have any physical meaning. Instead, as shown later, the quantity m i / t i is a preferred average MIPS rate
26 Weighted Harmonic Mean The weighted harmonic mean is defined as follows: where, w i 's are weights which add up to one: All weights equal => Harmonic, I.e., w i =1/n. In case of MIPS rate, if the weights are proportional to the size of the benchmark: Weighted harmonic mean would be: 12-26
27 Mean of A Ratio 1. If the sum of numerators and the sum of denominators, both have a physical meaning, the average of the ratio is the ratio of the averages. For example, if x i =a i /b i, the average ratio is given by: 12-27
28 CPU utilization Mean of a Ratio: Example 12-28
29 Example (Cont) Ratios cannot always be summarized by a geometric mean. A geometric mean of utilizations is useless
30 Mean of a Ratio: Special Cases a. If the denominator is a constant and the sum of numerator has a physical meaning, the arithmetic mean of the ratios can be used. That is, if b i =b for all i's, then: Example: mean resource utilization
31 Mean of Ratio (Cont) b. If the sum of the denominators has a physical meaning and the numerators are constant then a harmonic mean of the ratio should be used to summarize them. That is, if a i =a for all i's, then: Example: MIPS using the same benchmark 12-31
32 Mean of Ratios (Cont) 2. If the numerator and the denominator are expected to follow a multiplicative property such that a i =c b i, where c is approximately a constant that is being estimated, then c can be estimated by the geometric mean of a i /b i. Example: Program Optimizer: Where, b i and a i are the sizes before and after the program optimization and c is the effect of the optimization which is expected to be independent of the code size. or = arithmetic mean of => c geometric mean of b i /a i 12-32
33 Program Optimizer Static Size Data 12-33
34 Summarizing Variability Then there is the man who drowned crossing a stream with an average depth of six inches. - W. I. E. Gates 12-34
35 Indices of Dispersion 1. Range: Minimum and maximum of the values observed 2. Variance or standard deviation and 90- percentiles 4. Semi inter-quantile range 5. Mean absolute deviation 12-35
36 Range = Max-Min Range Larger range => higher variability In most cases, range is not very useful. The minimum often comes out to be zero and the maximum comes out to be an ``outlier'' far from typical values. Unless the variable is bounded, the maximum goes on increasing with the number of observations, the minimum goes on decreasing with the number of observations, and there is no ``stable'' point that gives a good indication of the actual range. Range is useful if, and only if, there is a reason to believe that the variable is bounded
37 Variance The divisor for s 2 is n-1 and not n. This is because only n-1 of the n differences are independent. Given n-1 differences, n th difference can be computed since the sum of all n differences must be zero. The number of independent terms in a sum is also called its degrees of freedom
38 Variance (Cont) Variance is expressed in units which are square of the units of the observations. => It is preferable to use standard deviation. Ratio of standard deviation to the mean, or the coefficient of variation (COV), is even better because it takes the scale of measurement (unit of measurement) out of variability consideration
39 Percentiles Specifying the 5-percentile and the 95-percentile of a variable has the same impact as specifying its minimum and maximum. It can be done for any variable, even for variables without bounds. When expressed as a fraction between 0 and 1 (instead of a percent), the percentiles are also called quantiles. => 0.9-quantile is the same as 90-percentile. Fractile= quantile. The percentiles at multiples of 10% are called deciles. Thus, the first decile is 10-percentile, the second decile is 20- percentile, and so on
40 Quartiles Quartiles divide the data into four parts at 25%, 50%, and 75%. => 25% of the observations are less than or equal to the first quartile Q 1, 50% of the observations are less than or equal to the second quartile Q 2, and 75% are less than the third quartile Q 3. Notice that the second quartile Q 2 is also the median. The α-quantiles can be estimated by sorting the observations and taking the [(n-1)α+1]th element in the ordered set. Here, [.] is used to denote rounding to the nearest integer. For quantities exactly half way between two integers use the lower integer
41 Semi Inter-Quartile Range Inter-quartile range = Q_3- Q_1 Semi inter-quartile range (SIQR) 12-41
42 Mean Absolute Deviation No multiplication or square root is required 12-42
43 Comparison of Variation Measures Range is affected considerably by outliers. Sample variance is also affected by outliers but the affect is less Mean absolute deviation is next in resistance to outliers. Semi inter-quantile range is very resistant to outliers. If the distribution is highly skewed, outliers are highly likely and SIQR is preferred over standard deviation In general, SIQR is used as an index of dispersion whenever median is used as an index of central tendency. For qualitative (categorical) data, the dispersion can be specified by giving the number of most frequent categories that comprise the given percentile, for instance, top 90%
44 Measures of Variation: Example In an experiment, which was repeated 32 times, the measured CPU time was found to be {3.1, 4.2, 2.8, 5.1, 2.8, 4.4, 5.6, 3.9, 3.9, 2.7, 4.1, 3.6, 3.1, 4.5, 3.8, 2.9, 3.4, 3.3, 2.8, 4.5, 4.9, 5.3, 1.9, 3.7, 3.2, 4.1, 5.1, 3.2, 3.9, 4.8, 5.9, 4.2}. The sorted set is {1.9, 2.7, 2.8, 2.8, 2.8, 2.9, 3.1, 3.1, 3.2, 3.2, 3.3, 3.4, 3.6, 3.7, 3.8, 3.9, 3.9, 3.9, 4.1, 4.1, 4.2, 4.2, 4.4, 4.5, 4.5, 4.8, 4.9, 5.1, 5.1, 5.3, 5.6, 5.9}. 10-percentile = [ 1+(31)(0.10) = 4th element = percentile = [ 1+(31)(0.90)] = 29th element = 5.1 First quartile Q 1 = [1+(31)(0.25)] = 9th element = 3.2 Median Q 2 = [ 1+(31)(0.50)] = 16th element = 3.9 Third quartile Q 1 = [ 1+(31)(0.75)] = 24th element =


45 Selecting the Index of Dispersion 12-45
46 Selecting the Index of Dispersion (Cont) The decision rules given above are not hard and fast. Network designed for average traffic is grossly under-designed. The network load is highly skewed => Networks are designed to carry 95 to 99-percentile of the observed load levels =>Dispersion of the load should be specified via range or percentiles. Power supplies are similarly designed to sustain peak demand rather than average demand. Finding a percentile requires several passes through the data, and therefore, the observations have to be stored. Heuristic algorithms, e.g., P 2 allows dynamic calculation of percentiles as the observations are generated. See Box 12.1 in the book for a summary of formulas for various indices of central tendencies and dispersion 12-46
47 Determining Distribution of Data The simplest way to determine the distribution is to plot a histogram Count observations that fall into each cell or bucket The key problem is determining the cell size. Small cells =>large variation in the number of observations per cell Large cells => details of the distribution are completely lost. It is possible to reach very different conclusions about the distribution shape One guideline: if any cell has less than five observations, the cell size should be increased or a variable cell histogram should be used
48 Quantile-Quantile plots y (i) is the observed q i th quantile x i = theoretical q i th quantile (x i, y (i) ) plot should be a straight line To determine the q i th quantile x i, need to invert the cumulative distribution function. or Table 28.1 lists the inverse of CDF for a number of distributions
49 Quantile-Quantile plots (Cont) Approximation for normal distribution N(0,1) For N(μ, σ), the x i values computed above are scaled to μ+σ x i before plotting
50 Quantile-Quantile Plots: Example The difference between the values measured on a system and those predicted by a model is called modeling error. The modeling error for eight predictions of a model were found to be -0.04, -0.19, 0.14, -0.09, -0.14, 0.19, 0.04, and
51 Quantile-Quantile Plot: Example (Cont) 12-51

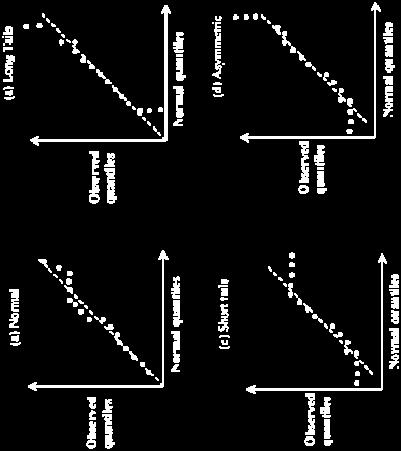
52 Interpretation of Quantile-Quantile Data 12-52
53 Summary Sum of a large number of random variates is normally distributed. Indices of Central Tendencies: Mean, Median, Mode, Arithmetic, Geometric, Harmonic means Indices of Dispersion: Range, Variance, percentiles, Quartiles, SIQR Determining Distribution of Data: Quantile-Quantile plots 12-53
54 Read chapter 12 Homework Submit answers to Exercises 12.7 and
55 Exercise 12.7 The execution times of queries on a database is normally distributed with a mean of 5 seconds and a standard deviation of 1 second. Determine the following: a. What is the probability of the execution time being more than 8 seconds. b. What is the probability of the execution time being less than 6 seconds. c. What percent of responses will take between 4 and 7 seconds? d. What is the 95-percentile execution time? 12-61
56 Exercise Plot a normal quantile-quantile plot for the following sample of errors: Are the errors normally distributed? 12-69
Summarizing Measured Data
 Performance Evaluation: Summarizing Measured Data Hongwei Zhang http://www.cs.wayne.edu/~hzhang The object of statistics is to discover methods of condensing information concerning large groups of allied
SUMMARIZING MEASURED DATA. Gaia Maselli
 SUMMARIZING MEASURED DATA Gaia Maselli maselli@di.uniroma1.it Computer Network Performance 2 Overview Basic concepts Summarizing measured data Summarizing data by a single number Summarizing variability
Summarizing Measured Data
 Summarizing Measured Data Dr. John Mellor-Crummey Department of Computer Science Rice University johnmc@cs.rice.edu COMP 528 Lecture 7 3 February 2005 Goals for Today Finish discussion of Normal Distribution
Performance Metrics for Computer Systems. CASS 2018 Lavanya Ramapantulu
 Performance Metrics for Computer Systems CASS 2018 Lavanya Ramapantulu Eight Great Ideas in Computer Architecture Design for Moore s Law Use abstraction to simplify design Make the common case fast Performance
CS 147: Computer Systems Performance Analysis
 CS 147: Computer Systems Performance Analysis Summarizing Variability and Determining Distributions CS 147: Computer Systems Performance Analysis Summarizing Variability and Determining Distributions 1
Last Lecture. Distinguish Populations from Samples. Knowing different Sampling Techniques. Distinguish Parameters from Statistics
 Last Lecture Distinguish Populations from Samples Importance of identifying a population and well chosen sample Knowing different Sampling Techniques Distinguish Parameters from Statistics Knowing different
Introduction to statistics
 Introduction to statistics Literature Raj Jain: The Art of Computer Systems Performance Analysis, John Wiley Schickinger, Steger: Diskrete Strukturen Band 2, Springer David Lilja: Measuring Computer Performance:
Descriptive Data Summarization
 Descriptive Data Summarization Descriptive data summarization gives the general characteristics of the data and identify the presence of noise or outliers, which is useful for successful data cleaning
Unit 2. Describing Data: Numerical
 Unit 2 Describing Data: Numerical Describing Data Numerically Describing Data Numerically Central Tendency Arithmetic Mean Median Mode Variation Range Interquartile Range Variance Standard Deviation Coefficient
1. Exploratory Data Analysis
 1. Exploratory Data Analysis 1.1 Methods of Displaying Data A visual display aids understanding and can highlight features which may be worth exploring more formally. Displays should have impact and be
Summary statistics. G.S. Questa, L. Trapani. MSc Induction - Summary statistics 1
 Summary statistics 1. Visualize data 2. Mean, median, mode and percentiles, variance, standard deviation 3. Frequency distribution. Skewness 4. Covariance and correlation 5. Autocorrelation MSc Induction
Chapter 3. Data Description
 Chapter 3. Data Description Graphical Methods Pie chart It is used to display the percentage of the total number of measurements falling into each of the categories of the variable by partition a circle.
Learning Objectives for Stat 225
 Learning Objectives for Stat 225 08/20/12 Introduction to Probability: Get some general ideas about probability, and learn how to use sample space to compute the probability of a specific event. Set Theory:
STP 420 INTRODUCTION TO APPLIED STATISTICS NOTES
 INTRODUCTION TO APPLIED STATISTICS NOTES PART - DATA CHAPTER LOOKING AT DATA - DISTRIBUTIONS Individuals objects described by a set of data (people, animals, things) - all the data for one individual make
P8130: Biostatistical Methods I
 P8130: Biostatistical Methods I Lecture 2: Descriptive Statistics Cody Chiuzan, PhD Department of Biostatistics Mailman School of Public Health (MSPH) Lecture 1: Recap Intro to Biostatistics Types of Data
Objective A: Mean, Median and Mode Three measures of central of tendency: the mean, the median, and the mode.
 Chapter 3 Numerically Summarizing Data Chapter 3.1 Measures of Central Tendency Objective A: Mean, Median and Mode Three measures of central of tendency: the mean, the median, and the mode. A1. Mean The
QUANTITATIVE DATA. UNIVARIATE DATA data for one variable
 QUANTITATIVE DATA Recall that quantitative (numeric) data values are numbers where data take numerical values for which it is sensible to find averages, such as height, hourly pay, and pulse rates. UNIVARIATE
CS 5014: Research Methods in Computer Science. Statistics: The Basic Idea. Statistics Questions (1) Statistics Questions (2) Clifford A.
 Statistics Questions (2) Clifford A.") Department of Computer Science Virginia Tech Blacksburg, Virginia Copyright c 2015 by Clifford A. Shaffer Computer Science Title page Computer Science Clifford A. Shaffer Fall 2015 Clifford A. Shaffer
Department of Computer Science Virginia Tech Blacksburg, Virginia Copyright c 2015 by Clifford A. Shaffer Computer Science Title page Computer Science Clifford A. Shaffer Fall 2015 Clifford A. Shaffer
CS 700: Quantitative Methods & Experimental Design in Computer Science
 CS 700: Quantitative Methods & Experimental Design in Computer Science Sanjeev Setia Dept of Computer Science George Mason University Logistics Grade: 35% project, 25% Homework assignments 20% midterm,
Network Simulation Chapter 5: Traffic Modeling. Chapter Overview
 Network Simulation Chapter 5: Traffic Modeling Prof. Dr. Jürgen Jasperneite 1 Chapter Overview 1. Basic Simulation Modeling 2. OPNET IT Guru - A Tool for Discrete Event Simulation 3. Review of Basic Probabilities
Chapter 5. Statistical Models in Simulations 5.1. Prof. Dr. Mesut Güneş Ch. 5 Statistical Models in Simulations
 Chapter 5 Statistical Models in Simulations 5.1 Contents Basic Probability Theory Concepts Discrete Distributions Continuous Distributions Poisson Process Empirical Distributions Useful Statistical Models
Tastitsticsss? What s that? Principles of Biostatistics and Informatics. Variables, outcomes. Tastitsticsss? What s that?
 Tastitsticsss? What s that? Statistics describes random mass phanomenons. Principles of Biostatistics and Informatics nd Lecture: Descriptive Statistics 3 th September Dániel VERES Data Collecting (Sampling)
Review for Exam #1. Chapter 1. The Nature of Data. Definitions. Population. Sample. Quantitative data. Qualitative (attribute) data
 data") Review for Exam #1 1 Chapter 1 Population the complete collection of elements (scores, people, measurements, etc.) to be studied Sample a subcollection of elements drawn from a population 11 The Nature
Review for Exam #1 1 Chapter 1 Population the complete collection of elements (scores, people, measurements, etc.) to be studied Sample a subcollection of elements drawn from a population 11 The Nature
ECLT 5810 Data Preprocessing. Prof. Wai Lam
 ECLT 5810 Data Preprocessing Prof. Wai Lam Why Data Preprocessing? Data in the real world is imperfect incomplete: lacking attribute values, lacking certain attributes of interest, or containing only aggregate
2/2/2015 GEOGRAPHY 204: STATISTICAL PROBLEM SOLVING IN GEOGRAPHY MEASURES OF CENTRAL TENDENCY CHAPTER 3: DESCRIPTIVE STATISTICS AND GRAPHICS
 Spring 2015: Lembo GEOGRAPHY 204: STATISTICAL PROBLEM SOLVING IN GEOGRAPHY CHAPTER 3: DESCRIPTIVE STATISTICS AND GRAPHICS Descriptive statistics concise and easily understood summary of data set characteristics
Lecture Slides. Elementary Statistics Tenth Edition. by Mario F. Triola. and the Triola Statistics Series. Slide 1
 Lecture Slides Elementary Statistics Tenth Edition and the Triola Statistics Series by Mario F. Triola Slide 1 Chapter 3 Statistics for Describing, Exploring, and Comparing Data 3-1 Overview 3-2 Measures
Ø Set of mutually exclusive categories. Ø Classify or categorize subject. Ø No meaningful order to categorization.
 Statistical Tools in Evaluation HPS 41 Dr. Joe G. Schmalfeldt Types of Scores Continuous Scores scores with a potentially infinite number of values. Discrete Scores scores limited to a specific number
Two Factor Full Factorial Design with Replications
 Two Factor Full Factorial Design with Replications Raj Jain Washington University in Saint Louis Saint Louis, MO 63130 Jain@cse.wustl.edu These slides are available on-line at: http://www.cse.wustl.edu/~jain/cse567-08/
Chapter 6 The Standard Deviation as a Ruler and the Normal Model
 Chapter 6 The Standard Deviation as a Ruler and the Normal Model Overview Key Concepts Understand how adding (subtracting) a constant or multiplying (dividing) by a constant changes the center and/or spread
Quantitative Tools for Research
 Quantitative Tools for Research KASHIF QADRI Descriptive Analysis Lecture Week 4 1 Overview Measurement of Central Tendency / Location Mean, Median & Mode Quantiles (Quartiles, Deciles, Percentiles) Measurement
EEC 686/785 Modeling & Performance Evaluation of Computer Systems. Lecture 11
 EEC 686/785 Modeling & Performance Evaluation of Computer Systems Lecture Department of Electrical and Computer Engineering Cleveland State University wenbing@ieee.org (based on Dr. Raj Jain s lecture
ADMS2320.com. We Make Stats Easy. Chapter 4. ADMS2320.com Tutorials Past Tests. Tutorial Length 1 Hour 45 Minutes
 We Make Stats Easy. Chapter 4 Tutorial Length 1 Hour 45 Minutes Tutorials Past Tests Chapter 4 Page 1 Chapter 4 Note The following topics will be covered in this chapter: Measures of central location Measures
Elementary Statistics
 Elementary Statistics Q: What is data? Q: What does the data look like? Q: What conclusions can we draw from the data? Q: Where is the middle of the data? Q: Why is the spread of the data important? Q:
Glossary. The ISI glossary of statistical terms provides definitions in a number of different languages:
 Glossary The ISI glossary of statistical terms provides definitions in a number of different languages: http://isi.cbs.nl/glossary/index.htm Adjusted r 2 Adjusted R squared measures the proportion of the
Preliminary Statistics course. Lecture 1: Descriptive Statistics
 Preliminary Statistics course Lecture 1: Descriptive Statistics Rory Macqueen (rm43@soas.ac.uk), September 2015 Organisational Sessions: 16-21 Sep. 10.00-13.00, V111 22-23 Sep. 15.00-18.00, V111 24 Sep.
MgtOp 215 Chapter 3 Dr. Ahn
 MgtOp 215 Chapter 3 Dr. Ahn Measures of central tendency (center, location): measures the middle point of a distribution or data; these include mean and median. Measures of dispersion (variability, spread):
F78SC2 Notes 2 RJRC. If the interest rate is 5%, we substitute x = 0.05 in the formula. This gives
 F78SC2 Notes 2 RJRC Algebra It is useful to use letters to represent numbers. We can use the rules of arithmetic to manipulate the formula and just substitute in the numbers at the end. Example: 100 invested
Describing distributions with numbers
 Describing distributions with numbers A large number or numerical methods are available for describing quantitative data sets. Most of these methods measure one of two data characteristics: The central
Describing distributions with numbers
 Describing distributions with numbers A large number or numerical methods are available for describing quantitative data sets. Most of these methods measure one of two data characteristics: The central
Lecture 2 and Lecture 3
 Lecture 2 and Lecture 3 1 Lecture 2 and Lecture 3 We can describe distributions using 3 characteristics: shape, center and spread. These characteristics have been discussed since the foundation of statistics.
EEC 686/785 Modeling & Performance Evaluation of Computer Systems. Lecture 19
 EEC 686/785 Modeling & Performance Evaluation of Computer Systems Lecture 19 Department of Electrical and Computer Engineering Cleveland State University wenbing@ieee.org (based on Dr. Raj Jain s lecture
MATH4427 Notebook 4 Fall Semester 2017/2018
 MATH4427 Notebook 4 Fall Semester 2017/2018 prepared by Professor Jenny Baglivo c Copyright 2009-2018 by Jenny A. Baglivo. All Rights Reserved. 4 MATH4427 Notebook 4 3 4.1 K th Order Statistics and Their
Midrange: mean of highest and lowest scores. easy to compute, rough estimate, rarely used
 Measures of Central Tendency Mode: most frequent score. best average for nominal data sometimes none or multiple modes in a sample bimodal or multimodal distributions indicate several groups included in
MEASURES OF LOCATION AND SPREAD
 MEASURES OF LOCATION AND SPREAD Frequency distributions and other methods of data summarization and presentation explained in the previous lectures provide a fairly detailed description of the data and
Instrumentation (cont.) Statistics vs. Parameters. Descriptive Statistics. Types of Numerical Data
 Statistics vs. Parameters. Descriptive Statistics. Types of Numerical Data") Norm-Referenced vs. Criterion- Referenced Instruments Instrumentation (cont.) October 1, 2007 Note: Measurement Plan Due Next Week All derived scores give meaning to individual scores by comparing them
Norm-Referenced vs. Criterion- Referenced Instruments Instrumentation (cont.) October 1, 2007 Note: Measurement Plan Due Next Week All derived scores give meaning to individual scores by comparing them
Outline. Simulation of a Single-Server Queueing System. EEC 686/785 Modeling & Performance Evaluation of Computer Systems.
 EEC 686/785 Modeling & Performance Evaluation of Computer Systems Lecture 19 Outline Simulation of a Single-Server Queueing System Review of midterm # Department of Electrical and Computer Engineering
Statistics for Managers using Microsoft Excel 6 th Edition
 Statistics for Managers using Microsoft Excel 6 th Edition Chapter 3 Numerical Descriptive Measures 3-1 Learning Objectives In this chapter, you learn: To describe the properties of central tendency, variation,
Module 3. Function of a Random Variable and its distribution
 Module 3 Function of a Random Variable and its distribution 1. Function of a Random Variable Let Ω, F, be a probability space and let be random variable defined on Ω, F,. Further let h: R R be a given
Expectation, Variance and Standard Deviation for Continuous Random Variables Class 6, Jeremy Orloff and Jonathan Bloom
 Expectation, Variance and Standard Deviation for Continuous Random Variables Class 6, 8.5 Jeremy Orloff and Jonathan Bloom Learning Goals. Be able to compute and interpret expectation, variance, and standard
Class 11 Maths Chapter 15. Statistics
 1 P a g e Class 11 Maths Chapter 15. Statistics Statistics is the Science of collection, organization, presentation, analysis and interpretation of the numerical data. Useful Terms 1. Limit of the Class
Chapter 2 Descriptive Statistics
 Chapter 2 Descriptive Statistics Lecture 1: Measures of Central Tendency and Dispersion Donald E. Mercante, PhD Biostatistics May 2010 Biostatistics (LSUHSC) Chapter 2 05/10 1 / 34 Lecture 1: Descriptive
College Mathematics
 Wisconsin Indianhead Technical College 10804107 College Mathematics Course Outcome Summary Course Information Description Instructional Level Total Credits 3.00 Total Hours 48.00 This course is designed
Chapter 1:Descriptive statistics
 Slide 1.1 Chapter 1:Descriptive statistics Descriptive statistics summarises a mass of information. We may use graphical and/or numerical methods Examples of the former are the bar chart and XY chart,
IV. The Normal Distribution
 IV. The Normal Distribution The normal distribution (a.k.a., a the Gaussian distribution or bell curve ) is the by far the best known random distribution. It s discovery has had such a far-reaching impact
Chapter 4: Continuous Random Variables and Probability Distributions
 Chapter 4: and Probability Distributions Walid Sharabati Purdue University February 14, 2014 Professor Sharabati (Purdue University) Spring 2014 (Slide 1 of 37) Chapter Overview Continuous random variables
Measures of Location
 Chapter 7 Measures of Location Definition of Measures of Location (page 219) A measure of location provides information on the percentage of observations in the collection whose values are less than or
Evaluate algebraic expressions for given values of the variables.
 Algebra I Unit Lesson Title Lesson Objectives 1 FOUNDATIONS OF ALGEBRA Variables and Expressions Exponents and Order of Operations Identify a variable expression and its components: variable, coefficient,
CIVL 7012/8012. Collection and Analysis of Information
 CIVL 7012/8012 Collection and Analysis of Information Uncertainty in Engineering Statistics deals with the collection and analysis of data to solve real-world problems. Uncertainty is inherent in all real
Continuous Distributions
 Chapter 3 Continuous Distributions 3.1 Continuous-Type Data In Chapter 2, we discuss random variables whose space S contains a countable number of outcomes (i.e. of discrete type). In Chapter 3, we study
Chapter 3 Data Description
 Chapter 3 Data Description Section 3.1: Measures of Central Tendency Section 3.2: Measures of Variation Section 3.3: Measures of Position Section 3.1: Measures of Central Tendency Definition of Average
3.1 Measure of Center
 3.1 Measure of Center Calculate the mean for a given data set Find the median, and describe why the median is sometimes preferable to the mean Find the mode of a data set Describe how skewness affects
REVIEW: Midterm Exam. Spring 2012
 REVIEW: Midterm Exam Spring 2012 Introduction Important Definitions: - Data - Statistics - A Population - A census - A sample Types of Data Parameter (Describing a characteristic of the Population) Statistic
Chapter Four. Numerical Descriptive Techniques. Range, Standard Deviation, Variance, Coefficient of Variation
 Chapter Four Numerical Descriptive Techniques 4.1 Numerical Descriptive Techniques Measures of Central Location Mean, Median, Mode Measures of Variability Range, Standard Deviation, Variance, Coefficient
Ø Set of mutually exclusive categories. Ø Classify or categorize subject. Ø No meaningful order to categorization.
 Statistical Tools in Evaluation HPS 41 Fall 213 Dr. Joe G. Schmalfeldt Types of Scores Continuous Scores scores with a potentially infinite number of values. Discrete Scores scores limited to a specific
After completing this chapter, you should be able to:
 Chapter 2 Descriptive Statistics Chapter Goals After completing this chapter, you should be able to: Compute and interpret the mean, median, and mode for a set of data Find the range, variance, standard
Statistical Concepts. Constructing a Trend Plot
 Module 1: Review of Basic Statistical Concepts 1.2 Plotting Data, Measures of Central Tendency and Dispersion, and Correlation Constructing a Trend Plot A trend plot graphs the data against a variable
additionalmathematicsstatisticsadditi onalmathematicsstatisticsadditionalm athematicsstatisticsadditionalmathem aticsstatisticsadditionalmathematicsst
 additionalmathematicsstatisticsadditi onalmathematicsstatisticsadditionalm athematicsstatisticsadditionalmathem aticsstatisticsadditionalmathematicsst STATISTICS atisticsadditionalmathematicsstatistic
II. The Normal Distribution
 II. The Normal Distribution The normal distribution (a.k.a., a the Gaussian distribution or bell curve ) is the by far the best known random distribution. It s discovery has had such a far-reaching impact
IAM 530 ELEMENTS OF PROBABILITY AND STATISTICS LECTURE 3-RANDOM VARIABLES
 IAM 530 ELEMENTS OF PROBABILITY AND STATISTICS LECTURE 3-RANDOM VARIABLES VARIABLE Studying the behavior of random variables, and more importantly functions of random variables is essential for both the
Algebra I. Standard Processes or Content Strand CLE Course Level Expectation SPI State Performance Indicator Check for Understanding
 Algebra I 111 Standard Processes or Content Strand CLE Course Level Expectation SPI State Performance Indicator Check for Understanding Standard 1 Mathematical Processes CLE 3102.1.1 Use mathematical language,
Rigorous Evaluation R.I.T. Analysis and Reporting. Structure is from A Practical Guide to Usability Testing by J. Dumas, J. Redish
 Rigorous Evaluation Analysis and Reporting Structure is from A Practical Guide to Usability Testing by J. Dumas, J. Redish S. Ludi/R. Kuehl p. 1 Summarize and Analyze Test Data Qualitative data - comments,
Σ x i. Sigma Notation
 Sigma Notation The mathematical notation that is used most often in the formulation of statistics is the summation notation The uppercase Greek letter Σ (sigma) is used as shorthand, as a way to indicate
Chapter 11. Output Analysis for a Single Model Prof. Dr. Mesut Güneş Ch. 11 Output Analysis for a Single Model
 Chapter Output Analysis for a Single Model. Contents Types of Simulation Stochastic Nature of Output Data Measures of Performance Output Analysis for Terminating Simulations Output Analysis for Steady-state
Lecture 2. Descriptive Statistics: Measures of Center
 Lecture 2. Descriptive Statistics: Measures of Center Descriptive Statistics summarize or describe the important characteristics of a known set of data Inferential Statistics use sample data to make inferences
Measures of Central Tendency and their dispersion and applications. Acknowledgement: Dr Muslima Ejaz
 Measures of Central Tendency and their dispersion and applications Acknowledgement: Dr Muslima Ejaz LEARNING OBJECTIVES: Compute and distinguish between the uses of measures of central tendency: mean,
in the company. Hence, we need to collect a sample which is representative of the entire population. In order for the sample to faithfully represent t
 10.001: Data Visualization and Elementary Statistical Analysis R. Sureshkumar January 15, 1997 Statistics deals with the collection and the analysis of data in the presence of variability. Variability
STATISTICS 1 REVISION NOTES
 STATISTICS 1 REVISION NOTES Statistical Model Representing and summarising Sample Data Key words: Quantitative Data This is data in NUMERICAL FORM such as shoe size, height etc. Qualitative Data This is
Foundations of Algebra/Algebra/Math I Curriculum Map
 *Standards N-Q.1, N-Q.2, N-Q.3 are not listed. These standards represent number sense and should be integrated throughout the units. *For each specific unit, learning targets are coded as F for Foundations
Measures of Central Tendency
 Measures of Central Tendency Summary Measures Summary Measures Central Tendency Mean Median Mode Quartile Range Variance Variation Coefficient of Variation Standard Deviation Measures of Central Tendency
Introduction to Statistics
 Introduction to Statistics By A.V. Vedpuriswar October 2, 2016 Introduction The word Statistics is derived from the Italian word stato, which means state. Statista refers to a person involved with the
Dr. Maddah ENMG 617 EM Statistics 10/15/12. Nonparametric Statistics (2) (Goodness of fit tests)
 (Goodness of fit tests)") Dr. Maddah ENMG 617 EM Statistics 10/15/12 Nonparametric Statistics (2) (Goodness of fit tests) Introduction Probability models used in decision making (Operations Research) and other fields require fitting
Dr. Maddah ENMG 617 EM Statistics 10/15/12 Nonparametric Statistics (2) (Goodness of fit tests) Introduction Probability models used in decision making (Operations Research) and other fields require fitting
Essentials of Statistics and Probability
 May 22, 2007 Department of Statistics, NC State University dbsharma@ncsu.edu SAMSI Undergrad Workshop Overview Practical Statistical Thinking Introduction Data and Distributions Variables and Distributions
1 Measures of the Center of a Distribution
 1 Measures of the Center of a Distribution Qualitative descriptions of the shape of a distribution are important and useful. But we will often desire the precision of numerical summaries as well. Two aspects
Meelis Kull Autumn Meelis Kull - Autumn MTAT Data Mining - Lecture 03
 Meelis Kull meelis.kull@ut.ee Autumn 2017 1 Demo: Data science mini-project CRISP-DM: cross-industrial standard process for data mining Data understanding: Types of data Data understanding: First look
How Measurement Error Affects the Four Ways We Use Data
 Measurement error is generally considered to be a bad thing, and yet there is very little written about how measurement error affects the way we use our measurements. This column will consider these effects
Chapter 2. Mean and Standard Deviation
 Chapter 2. Mean and Standard Deviation The median is known as a measure of location; that is, it tells us where the data are. As stated in, we do not need to know all the exact values to calculate the
Statistics I Chapter 2: Univariate data analysis
 Statistics I Chapter 2: Univariate data analysis Chapter 2: Univariate data analysis Contents Graphical displays for categorical data (barchart, piechart) Graphical displays for numerical data data (histogram,
MIDTERM EXAMINATION (Spring 2011) STA301- Statistics and Probability
 STA301- Statistics and Probability") STA301- Statistics and Probability Solved MCQS From Midterm Papers March 19,2012 MC100401285 Moaaz.pk@gmail.com Mc100401285@gmail.com PSMD01 MIDTERM EXAMINATION (Spring 2011) STA301- Statistics and Probability
STA301- Statistics and Probability Solved MCQS From Midterm Papers March 19,2012 MC100401285 Moaaz.pk@gmail.com Mc100401285@gmail.com PSMD01 MIDTERM EXAMINATION (Spring 2011) STA301- Statistics and Probability
Measurement And Uncertainty
 Measurement And Uncertainty Based on Guidelines for Evaluating and Expressing the Uncertainty of NIST Measurement Results, NIST Technical Note 1297, 1994 Edition PHYS 407 1 Measurement approximates or
Frequency Distribution Cross-Tabulation
 Frequency Distribution Cross-Tabulation 1) Overview 2) Frequency Distribution 3) Statistics Associated with Frequency Distribution i. Measures of Location ii. Measures of Variability iii. Measures of Shape
Math 120 Introduction to Statistics Mr. Toner s Lecture Notes 3.1 Measures of Central Tendency
 Math 1 Introduction to Statistics Mr. Toner s Lecture Notes 3.1 Measures of Central Tendency The word average: is very ambiguous and can actually refer to the mean, median, mode or midrange. Notation:
Continuous random variables
 Continuous random variables A continuous random variable X takes all values in an interval of numbers. The probability distribution of X is described by a density curve. The total area under a density
Arithmetic Testing OnLine (ATOL) SM Assessment Framework
 SM Assessment Framework") Arithmetic Testing OnLine (ATOL) SM Assessment Framework Overview Assessment Objectives (AOs) are used to describe the arithmetic knowledge and skills that should be mastered by the end of each year in
Arithmetic Testing OnLine (ATOL) SM Assessment Framework Overview Assessment Objectives (AOs) are used to describe the arithmetic knowledge and skills that should be mastered by the end of each year in
STAT 200 Chapter 1 Looking at Data - Distributions
 STAT 200 Chapter 1 Looking at Data - Distributions What is Statistics? Statistics is a science that involves the design of studies, data collection, summarizing and analyzing the data, interpreting the
DETAILED CONTENTS PART I INTRODUCTION AND DESCRIPTIVE STATISTICS. 1. Introduction to Statistics
 DETAILED CONTENTS About the Author Preface to the Instructor To the Student How to Use SPSS With This Book PART I INTRODUCTION AND DESCRIPTIVE STATISTICS 1. Introduction to Statistics 1.1 Descriptive and
Chapter 1. Looking at Data
 Chapter 1 Looking at Data Types of variables Looking at Data Be sure that each variable really does measure what you want it to. A poor choice of variables can lead to misleading conclusions!! For example,
Math 14 Lecture Notes Ch Percentile
 .3 Measures of the Location of the Data Percentile g A measure of position, the percentile, p, is an integer (1 p 99) such that the p th percentile is the position of a data value where p% of the data
Higher Secondary - First year STATISTICS Practical Book
 Higher Secondary - First year STATISTICS Practical Book th_statistics_practicals.indd 07-09-08 8:00:9 Introduction Statistical tools are important for us in daily life. They are used in the analysis of
ST Presenting & Summarising Data Descriptive Statistics. Frequency Distribution, Histogram & Bar Chart
 ST2001 2. Presenting & Summarising Data Descriptive Statistics Frequency Distribution, Histogram & Bar Chart Summary of Previous Lecture u A study often involves taking a sample from a population that
1. AN INTRODUCTION TO DESCRIPTIVE STATISTICS. No great deed, private or public, has ever been undertaken in a bliss of certainty.
 CIVL 3103 Approximation and Uncertainty J.W. Hurley, R.W. Meier 1. AN INTRODUCTION TO DESCRIPTIVE STATISTICS No great deed, private or public, has ever been undertaken in a bliss of certainty. - Leon Wieseltier