CIVL 7012/8012. Collection and Analysis of Information
|
|
|
- Toby Mitchell
- 5 years ago
- Views:
Transcription
1 CIVL 7012/8012 Collection and Analysis of Information
2 Uncertainty in Engineering Statistics deals with the collection and analysis of data to solve real-world problems. Uncertainty is inherent in all real world problems. Two types of experiments: Designed experiments Observational studies Two types of data: Continuous Categorical Statistical methods are needed for describing information and forming the bases for design and decision making under uncertainty.

3
4 Variability Variability results from three sources: Process Measurement Sampling We must take care to select representative samples. Well designed data collection and proper analysis techniques are essential for finding causes of variability and improving quality/productivity. *Avoid over-controlling processes.
5 Variability
6 Variability
7 Measurements Collected Over Time

8 Measurements Collected Over Time

9 Measurements Collected Over Time
10 Data Collection/Analysis Best Practices Proper design of experiments: Plan BEFORE implementation Avoid confounding factors Blocking and randomization Relevant data Stratification Statistical significance Display data with clarity, efficiency
11 Types of data Cross-sectional data (a) Time series data (b) Pooled cross-sectional data (a+b) Panel data 11
12 Types of Data Cross Sectional Cross-sectional data is a random sample Each observation is a new individual, firm, etc. with information at the same point in time (no temporal variation) Example-1: census survey (every 10 years) Example-2: National household travel survey (every five years) Example-3: Commodity flow survey (every five years) If the data is not a random sample, we have a sampleselection 12 problem
13 Example: cross-sectional data Zone Peak Hr Trips Attracted(Y) Total (X 1 ) Manufacturing (X 2 ) Retail & Services (X 3 ) Other (X 4 ) 1 9,500 9,220 6,600 2, ,200 2, , ,960 3,850 2, , ,100 2,250 1,
14 Price Per Dozen (cents) in 1990 Cross-sectional data (cautions) Eggs Produced in 1990 (millions) Heterogeneity Size and scale effect must be taken into consideration otherwise model building will be erroneous Not to mix apples with oranges 14
15 Trips Attracted Cross-sectional data (cautions) -2 10,000 9,000 8,000 7,000 6,000 5,000 4,000 3,000 2,000 1, ,000 2,000 3,000 4,000 5,000 6,000 7,000 8,000 9,000 10,000 Total Employment 15
16 Types of Data Time Series Time series data has a separate observation for each time period e.g. annual traffic volume on a corridor, census observations over multiple decades Time periods to consider Daily, Weekly, Monthly, Quarterly, Annually, Quinquennially (every five years), Decennially (every 10 years) Since not a random sample, different problems to consider Trends and seasonality will be important Stationary issue Loosely speaking a time series is stationary if its mean and standard deviation does not vary systematically over time 16
17 Stationary time series-example Stationarity Seasonality Trend effects We will explore more in time series lectures 17

18 Types of Data-pooled data Data elements consists of both cross-sectional and time series features Random samples over time are different (the same observations in sample may not remain same) 18
19 Types of Data Panel A panel datasets consists of a time series for each crosssectional member of the dataset. Can pool random cross sections and treat similar to a normal cross section. Will just need to account for time differences. Can follow the same random individual observations over time known as panel data or longitudinal data Also known as longitudinal and micropanel data 19
20 Panel data - example Zone Peak Hr Trips Attracted(Y) Total Employment Manufacturing (X 1 ) (X 2 ) Retail & Services (X 3 ) Other (X 4 )
21 Measurement scale of variables Ratio scale Interval scale Ordinal scale Nominal scale 21
22 Ratio scale Measurements made with ratio scale can be added, subtracted, multiplied and divided. For a variable X taking two values, X1 and X2, the ratio X1/X2 and X1-X2 are meaningful quantities Also there is a natural ordering (ascending and descending) of the values along scale (X1 <= X2) Most of the variables belong to this category Example: Height, weight, speed, distance, etc. 22
23 Interval scale In interval scale the difference is meaningful but it does not satisfy the ratio property. Example: A 50 mph speed limit is higher than 40mph but lower than 6o mph. The difference is meaningful (equal intervals) Interval scales normally have a minimum and maximum point. 23
24 Ordinal scale A variable is ordinal if it only satisfies the natural ordering. Ordinal scales classify subjects and rank them in terms of how they possesses characteristics of interest Example Grading system A, B, C grades Income class Upper, middle, and lower Ordering exists but not the differences and ratios 24
25 Nominal scale Variables in this category does not have any of the features of ratio scale Ratio Difference Natural ordering Variables such as Gender (male, female); Facility type (freeway, arterial) Also called as categorical variables 25
26 Descriptive Statistics Descriptive vs. Inferential Statistics DEFINITIONS Population all members of a class or category of interest Parameter a summary measure of the population (e.g. average) Sample a portion or subset of the population collected as data Observation an individual member of the sample (i.e., a data point) Statistic a summary measure of the observations in a sample
27 Populations and Samples Population Sample Parameters Inference Statistics
28 Summary Statistics Measures of Central Tendency Arithmetic mean Median Mode Measures of Dispersion Variance Standard deviation Coefficient of variation (COV)
29 Measures of Central Tendency The sample mean is given by: n xi i x 6.22 n 9 The sample median is given by:
30 Measures of Central Tendency The mode of the sample is the value that occurs most frequently Bimodal
31 Measures of Dispersion The most common measure of dispersion is the sample variance: s 2 n i 1 x i n 1 x 2 The sample standard deviation is the square root of sample variance: s s 2
32 Measures of Dispersion Coefficient of variation (CV): This is a good way to compare measures of dispersion between different samples whose values don t necessarily have the same magnitude (or, for that matter, the same units!).
33 Data Summary
34
35 Frequency Distribution Vehicle Speeds on Central Avenue Speeds (mph) Vehicles Counted Class Intervals Class Frequencies TOTAL 50 A frequency distribution is a tabular summary of sample data organized into categories or classes
36 Frequency Histogram Speeds (mph) A histogram is a graphical representation of a frequency distribution. Each class includes those observations who s value is greater than the lower bound and less than or equal to the upper bound of the class.
37 Frequency Frequency Histogram Range Speeds (mph) Speeds (mph)

38 Symmetry and Skewness
39 Relative Frequency Distribution Vehicle Speeds on Poplar Avenue Speeds (kph) Vehicles Counted Pecentage of Sample TOTAL
40 Relative Frequency Relative Frequency Histogram 30% 20% 10% 0% Speeds (mph)
41 Cumulative Frequency Distributions Vehicle Speeds on Poplar Avenue Speeds (mph) Vehicles Counted Percentage of Sample Cumulative Percentage TOTAL
42 Cumulative Frequency Cumulative Frequency Diagram 100% 75% 50% 25% 0% Speeds (mph) A good rule of thumb is that the number of classes should be approximately equal to the square root of the number of observations.
43 Cumulative Frequency Distributions 100% Cumulative Frequency 75% 50% 25% 50% of all vehicles on Central are traveling at 55 mph or less. 0% Speeds (mph)
44 Boxplots A boxplot is a graphic that presents the median, the first and third quartiles, and any outliers present in the sample. The interquartile range (IQR) is the difference between the third and first quartile. This is the distance needed to span the middle half of the data.
45 Boxplots Steps in the Construction of a Boxplot: Compute the median and the first and third quartiles of the sample. Indicate these with horizontal lines. Draw vertical lines to complete the box. Find the largest sample value that is no more than 1.5 IQR above the third quartile, and the smallest sample value that is not more than 1.5 IQR below the first quartile. Extend vertical lines (whiskers) from the quartile lines to these points. Points more than 1.5 IQR above the third quartile, or more than 1.5 IQR below the first quartile are designated as outliers. Plot each outlier individually.
46 Boxplots
47 Boxplots Example duration
48 Boxplots - Example Notice there are no outliers in these data. Looking at the four pieces of the boxplot, we can tell that the sample values are comparatively densely packed between the median and the third quartile. The lower whisker is a bit longer than the upper one, indicating that the data has a slightly longer lower tail than an upper tail. The distance between the first quartile and the median is greater than the distance between the median and the third quartile. This boxplot suggests that the data are skewed to the left.
49 Stem and Leaf Plot Statistics: The branch of mathematics that deals with collecting, organizing, and analyzing or interpreting data. Data: Numerical facts or numerical information. Stem-and-Leaf Plots: A convenient method to display every piece of data by showing the digits of each number.
50 Stem and Leaf Plot In a stem-and leaf plot, the greatest common place value of the data is used to form stems. The numbers in the next greatest place-value position are then used to form the leaves.
51 Stem and Leaf Plot Leaf: The last digit on the right of the number. Stem: The digit or digits that remain when the leaf is dropped. Look at the number 284 The leaf is the last digit formed: the number 4. The stem is the remaining digits when the leaf is dropped: the number 28. The stem with the leaf forms the number 284. Stem 28 4 Leaf = 284
52 Stem and Leaf Plot Here are the scores from two periods of math class. Students took the same test. Period 1: Period 2:


53 Pi-chart US GDP by Function US Interstate Pavement roughness

54 Excel Tools

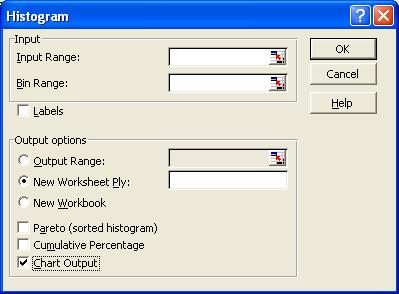
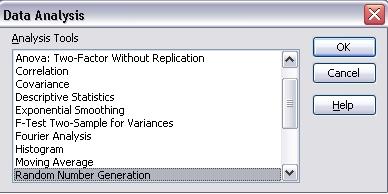
55 Analysis Toolpack in Excel
56 Grouped Data-Mean
57 Grouped Data-Mean Example: The following table gives the frequency distribution of the number of orders received each day during the past 50 days in a manufacturing company. Calculate the mean. Number of order Solution: X is the midpoint of the class. It is adding the class Number of f x fx order n = 50 = 832 f n = 50 limits and divide by 2. fx 832 x = = = n 50
58 Grouped Data-Median Step 1: Construct the cumulative frequency distribution. Step 2: Decide the class that contain the median. Class Median is the first class with the value of cumulative frequency equal at least n/2. Step 3: Find the median by using the following formula: Where: n = the total frequency F = the cumulative frequency before class median = the frequency of the class median f m i = the class width L m = the lower boundary of the class median
59 Example: Based on the grouped data below, find the median: Solution: Time to travel to work Frequency st Step: Construct the cumulative frequency distribution Time to travel to work Frequency Cumulative Frequency n So, F = 22, f m = 12, class median is the 3 rd class L m = 20.5 and i = 10
60 Therefore, Thus, 25 persons take less than 24 minutes to travel to work and another 25 persons take more than 24 minutes to travel to work.
61 Quartiles Using the same method of calculation as in the Median, we can get Q 1 and Q 3 equation as follows: Example: Based on the grouped data below, find the Interquartile Range Time to travel to work Frequency
62 Solution: 1 st Step: Construct the cumulative frequency distribution Time to travel to work Frequency Cumulative Frequency nd Step: Determine the Q 1 and Q 3
63
64 Mode-Grouped Data Mode is the value that has the highest frequency in a data set. For grouped data, class mode (or, modal class) is the class with the highest frequency. To find mode for grouped data, use the following formula:
65 Calculation of Grouped Data - Mode Example: Based on the grouped data below, find the mode Time to travel to work Frequency Solution: Based on the table,
66 Variance and SD Grouped Data
67 Example: Find the variance and standard deviation for the following data: Variance and SD Grouped Data No. of order f Total n = 50 Solution: No. of order f x fx fx Total n =
68 Variance and SD Grouped Data Thus, the standard deviation of the number of orders received at the office of this mail-order company during the past 50 days is 2.75.
Lecture-1: Introduction to Econometrics
 Lecture-1: Introduction to Econometrics 1 Definition Econometrics may be defined as 2 the science in which the tools of economic theory, mathematics and statistical inference is applied to the analysis
What is Statistics? Statistics is the science of understanding data and of making decisions in the face of variability and uncertainty.
 What is Statistics? Statistics is the science of understanding data and of making decisions in the face of variability and uncertainty. Statistics is a field of study concerned with the data collection,
Introduction to Statistics
 Introduction to Statistics Data and Statistics Data consists of information coming from observations, counts, measurements, or responses. Statistics is the science of collecting, organizing, analyzing,
STAT 200 Chapter 1 Looking at Data - Distributions
 STAT 200 Chapter 1 Looking at Data - Distributions What is Statistics? Statistics is a science that involves the design of studies, data collection, summarizing and analyzing the data, interpreting the
1-1. Chapter 1. Sampling and Descriptive Statistics by The McGraw-Hill Companies, Inc. All rights reserved.
 1-1 Chapter 1 Sampling and Descriptive Statistics 1-2 Why Statistics? Deal with uncertainty in repeated scientific measurements Draw conclusions from data Design valid experiments and draw reliable conclusions
Lecture 1: Descriptive Statistics
 Lecture 1: Descriptive Statistics MSU-STT-351-Sum 15 (P. Vellaisamy: MSU-STT-351-Sum 15) Probability & Statistics for Engineers 1 / 56 Contents 1 Introduction 2 Branches of Statistics Descriptive Statistics
Descriptive Statistics-I. Dr Mahmoud Alhussami
 Descriptive Statistics-I Dr Mahmoud Alhussami Biostatistics What is the biostatistics? A branch of applied math. that deals with collecting, organizing and interpreting data using well-defined procedures.
1. AN INTRODUCTION TO DESCRIPTIVE STATISTICS. No great deed, private or public, has ever been undertaken in a bliss of certainty.
 CIVL 3103 Approximation and Uncertainty J.W. Hurley, R.W. Meier 1. AN INTRODUCTION TO DESCRIPTIVE STATISTICS No great deed, private or public, has ever been undertaken in a bliss of certainty. - Leon Wieseltier
Descriptive Statistics
 Descriptive Statistics CHAPTER OUTLINE 6-1 Numerical Summaries of Data 6- Stem-and-Leaf Diagrams 6-3 Frequency Distributions and Histograms 6-4 Box Plots 6-5 Time Sequence Plots 6-6 Probability Plots Chapter
Last Lecture. Distinguish Populations from Samples. Knowing different Sampling Techniques. Distinguish Parameters from Statistics
 Last Lecture Distinguish Populations from Samples Importance of identifying a population and well chosen sample Knowing different Sampling Techniques Distinguish Parameters from Statistics Knowing different
Elementary Statistics
 Elementary Statistics Q: What is data? Q: What does the data look like? Q: What conclusions can we draw from the data? Q: Where is the middle of the data? Q: Why is the spread of the data important? Q:
A is one of the categories into which qualitative data can be classified.
 Chapter 2 Methods for Describing Sets of Data 2.1 Describing qualitative data Recall qualitative data: non-numerical or categorical data Basic definitions: A is one of the categories into which qualitative
Chapter 1. Looking at Data
 Chapter 1 Looking at Data Types of variables Looking at Data Be sure that each variable really does measure what you want it to. A poor choice of variables can lead to misleading conclusions!! For example,
STP 420 INTRODUCTION TO APPLIED STATISTICS NOTES
 INTRODUCTION TO APPLIED STATISTICS NOTES PART - DATA CHAPTER LOOKING AT DATA - DISTRIBUTIONS Individuals objects described by a set of data (people, animals, things) - all the data for one individual make
Chapter 1:Descriptive statistics
 Slide 1.1 Chapter 1:Descriptive statistics Descriptive statistics summarises a mass of information. We may use graphical and/or numerical methods Examples of the former are the bar chart and XY chart,
Chapter 3. Data Description
 Chapter 3. Data Description Graphical Methods Pie chart It is used to display the percentage of the total number of measurements falling into each of the categories of the variable by partition a circle.
Unit Two Descriptive Biostatistics. Dr Mahmoud Alhussami
 Unit Two Descriptive Biostatistics Dr Mahmoud Alhussami Descriptive Biostatistics The best way to work with data is to summarize and organize them. Numbers that have not been summarized and organized are
Preliminary Statistics course. Lecture 1: Descriptive Statistics
 Preliminary Statistics course Lecture 1: Descriptive Statistics Rory Macqueen (rm43@soas.ac.uk), September 2015 Organisational Sessions: 16-21 Sep. 10.00-13.00, V111 22-23 Sep. 15.00-18.00, V111 24 Sep.
Determining the Spread of a Distribution
 Determining the Spread of a Distribution 1.3-1.5 Cathy Poliak, Ph.D. cathy@math.uh.edu Department of Mathematics University of Houston Lecture 3-2311 Lecture 3-2311 1 / 58 Outline 1 Describing Quantitative
Determining the Spread of a Distribution
 Determining the Spread of a Distribution 1.3-1.5 Cathy Poliak, Ph.D. cathy@math.uh.edu Department of Mathematics University of Houston Lecture 3-2311 Lecture 3-2311 1 / 58 Outline 1 Describing Quantitative
TOPIC: Descriptive Statistics Single Variable
 TOPIC: Descriptive Statistics Single Variable I. Numerical data summary measurements A. Measures of Location. Measures of central tendency Mean; Median; Mode. Quantiles - measures of noncentral tendency
F78SC2 Notes 2 RJRC. If the interest rate is 5%, we substitute x = 0.05 in the formula. This gives
 F78SC2 Notes 2 RJRC Algebra It is useful to use letters to represent numbers. We can use the rules of arithmetic to manipulate the formula and just substitute in the numbers at the end. Example: 100 invested
Unit 2. Describing Data: Numerical
 Unit 2 Describing Data: Numerical Describing Data Numerically Describing Data Numerically Central Tendency Arithmetic Mean Median Mode Variation Range Interquartile Range Variance Standard Deviation Coefficient
Describing distributions with numbers
 Describing distributions with numbers A large number or numerical methods are available for describing quantitative data sets. Most of these methods measure one of two data characteristics: The central
Glossary. The ISI glossary of statistical terms provides definitions in a number of different languages:
 Glossary The ISI glossary of statistical terms provides definitions in a number of different languages: http://isi.cbs.nl/glossary/index.htm Adjusted r 2 Adjusted R squared measures the proportion of the
Lecture Slides. Elementary Statistics Twelfth Edition. by Mario F. Triola. and the Triola Statistics Series. Section 3.1- #
 Lecture Slides Elementary Statistics Twelfth Edition and the Triola Statistics Series by Mario F. Triola Chapter 3 Statistics for Describing, Exploring, and Comparing Data 3-1 Review and Preview 3-2 Measures
Chapter2 Description of samples and populations. 2.1 Introduction.
 Chapter2 Description of samples and populations. 2.1 Introduction. Statistics=science of analyzing data. Information collected (data) is gathered in terms of variables (characteristics of a subject that
Tastitsticsss? What s that? Principles of Biostatistics and Informatics. Variables, outcomes. Tastitsticsss? What s that?
 Tastitsticsss? What s that? Statistics describes random mass phanomenons. Principles of Biostatistics and Informatics nd Lecture: Descriptive Statistics 3 th September Dániel VERES Data Collecting (Sampling)
AP Final Review II Exploring Data (20% 30%)
") AP Final Review II Exploring Data (20% 30%) Quantitative vs Categorical Variables Quantitative variables are numerical values for which arithmetic operations such as means make sense. It is usually a measure
AP Final Review II Exploring Data (20% 30%) Quantitative vs Categorical Variables Quantitative variables are numerical values for which arithmetic operations such as means make sense. It is usually a measure
After completing this chapter, you should be able to:
 Chapter 2 Descriptive Statistics Chapter Goals After completing this chapter, you should be able to: Compute and interpret the mean, median, and mode for a set of data Find the range, variance, standard
Describing distributions with numbers
 Describing distributions with numbers A large number or numerical methods are available for describing quantitative data sets. Most of these methods measure one of two data characteristics: The central
Statistics in medicine
 Statistics in medicine Lecture 1- part 1: Describing variation, and graphical presentation Outline Sources of variation Types of variables Fatma Shebl, MD, MS, MPH, PhD Assistant Professor Chronic Disease
Performance of fourth-grade students on an agility test
 Starter Ch. 5 2005 #1a CW Ch. 4: Regression L1 L2 87 88 84 86 83 73 81 67 78 83 65 80 50 78 78? 93? 86? Create a scatterplot Find the equation of the regression line Predict the scores Chapter 5: Understanding
SESSION 5 Descriptive Statistics
 SESSION 5 Descriptive Statistics Descriptive statistics are used to describe the basic features of the data in a study. They provide simple summaries about the sample and the measures. Together with simple
P8130: Biostatistical Methods I
 P8130: Biostatistical Methods I Lecture 2: Descriptive Statistics Cody Chiuzan, PhD Department of Biostatistics Mailman School of Public Health (MSPH) Lecture 1: Recap Intro to Biostatistics Types of Data
Ø Set of mutually exclusive categories. Ø Classify or categorize subject. Ø No meaningful order to categorization.
 Statistical Tools in Evaluation HPS 41 Fall 213 Dr. Joe G. Schmalfeldt Types of Scores Continuous Scores scores with a potentially infinite number of values. Discrete Scores scores limited to a specific
Chapter 2: Tools for Exploring Univariate Data
 Stats 11 (Fall 2004) Lecture Note Introduction to Statistical Methods for Business and Economics Instructor: Hongquan Xu Chapter 2: Tools for Exploring Univariate Data Section 2.1: Introduction What is
additionalmathematicsstatisticsadditi onalmathematicsstatisticsadditionalm athematicsstatisticsadditionalmathem aticsstatisticsadditionalmathematicsst
 additionalmathematicsstatisticsadditi onalmathematicsstatisticsadditionalm athematicsstatisticsadditionalmathem aticsstatisticsadditionalmathematicsst STATISTICS atisticsadditionalmathematicsstatistic
CHAPTER 2: Describing Distributions with Numbers
 CHAPTER 2: Describing Distributions with Numbers The Basic Practice of Statistics 6 th Edition Moore / Notz / Fligner Lecture PowerPoint Slides Chapter 2 Concepts 2 Measuring Center: Mean and Median Measuring
Chapter 4. Displaying and Summarizing. Quantitative Data
 STAT 141 Introduction to Statistics Chapter 4 Displaying and Summarizing Quantitative Data Bin Zou (bzou@ualberta.ca) STAT 141 University of Alberta Winter 2015 1 / 31 4.1 Histograms 1 We divide the range
Review for Exam #1. Chapter 1. The Nature of Data. Definitions. Population. Sample. Quantitative data. Qualitative (attribute) data
 data") Review for Exam #1 1 Chapter 1 Population the complete collection of elements (scores, people, measurements, etc.) to be studied Sample a subcollection of elements drawn from a population 11 The Nature
Review for Exam #1 1 Chapter 1 Population the complete collection of elements (scores, people, measurements, etc.) to be studied Sample a subcollection of elements drawn from a population 11 The Nature
What is statistics? Statistics is the science of: Collecting information. Organizing and summarizing the information collected
 What is statistics? Statistics is the science of: Collecting information Organizing and summarizing the information collected Analyzing the information collected in order to draw conclusions Two types
Chapter 1: Exploring Data
 Chapter 1: Exploring Data Section 1.3 with Numbers The Practice of Statistics, 4 th edition - For AP* STARNES, YATES, MOORE Chapter 1 Exploring Data Introduction: Data Analysis: Making Sense of Data 1.1
Lecture Notes for BUSINESS STATISTICS - BMGT 571. Chapters 1 through 6. Professor Ahmadi, Ph.D. Department of Management
 Lecture Notes for BUSINESS STATISTICS - BMGT 571 Chapters 1 through 6 Professor Ahmadi, Ph.D. Department of Management Revised May 005 Glossary of Terms: Statistics Chapter 1 Data Data Set Elements Variable
Chapter 2: Descriptive Analysis and Presentation of Single- Variable Data
 Chapter 2: Descriptive Analysis and Presentation of Single- Variable Data Mean 26.86667 Standard Error 2.816392 Median 25 Mode 20 Standard Deviation 10.90784 Sample Variance 118.981 Kurtosis -0.61717 Skewness
Lecture Slides. Elementary Statistics Tenth Edition. by Mario F. Triola. and the Triola Statistics Series. Slide 1
 Lecture Slides Elementary Statistics Tenth Edition and the Triola Statistics Series by Mario F. Triola Slide 1 Chapter 3 Statistics for Describing, Exploring, and Comparing Data 3-1 Overview 3-2 Measures
Further Mathematics 2018 CORE: Data analysis Chapter 2 Summarising numerical data
 Chapter 2: Summarising numerical data Further Mathematics 2018 CORE: Data analysis Chapter 2 Summarising numerical data Extract from Study Design Key knowledge Types of data: categorical (nominal and ordinal)
MATH 1150 Chapter 2 Notation and Terminology
 MATH 1150 Chapter 2 Notation and Terminology Categorical Data The following is a dataset for 30 randomly selected adults in the U.S., showing the values of two categorical variables: whether or not the
Example 2. Given the data below, complete the chart:
 Statistics 2035 Quiz 1 Solutions Example 1. 2 64 150 150 2 128 150 2 256 150 8 8 Example 2. Given the data below, complete the chart: 52.4, 68.1, 66.5, 75.0, 60.5, 78.8, 63.5, 48.9, 81.3 n=9 The data is
Lecture 6: Chapter 4, Section 2 Quantitative Variables (Displays, Begin Summaries)
") Lecture 6: Chapter 4, Section 2 Quantitative Variables (Displays, Begin Summaries) Summarize with Shape, Center, Spread Displays: Stemplots, Histograms Five Number Summary, Outliers, Boxplots Cengage Learning
Lecture 6: Chapter 4, Section 2 Quantitative Variables (Displays, Begin Summaries) Summarize with Shape, Center, Spread Displays: Stemplots, Histograms Five Number Summary, Outliers, Boxplots Cengage Learning
Lecture 1: Description of Data. Readings: Sections 1.2,
 Lecture 1: Description of Data Readings: Sections 1.,.1-.3 1 Variable Example 1 a. Write two complete and grammatically correct sentences, explaining your primary reason for taking this course and then
Lecture 2 and Lecture 3
 Lecture 2 and Lecture 3 1 Lecture 2 and Lecture 3 We can describe distributions using 3 characteristics: shape, center and spread. These characteristics have been discussed since the foundation of statistics.
CHAPTER 1. Introduction
 CHAPTER 1 Introduction Engineers and scientists are constantly exposed to collections of facts, or data. The discipline of statistics provides methods for organizing and summarizing data, and for drawing
Types of Information. Topic 2 - Descriptive Statistics. Examples. Sample and Sample Size. Background Reading. Variables classified as STAT 511
 Topic 2 - Descriptive Statistics STAT 511 Professor Bruce Craig Types of Information Variables classified as Categorical (qualitative) - variable classifies individual into one of several groups or categories
Perhaps the most important measure of location is the mean (average). Sample mean: where n = sample size. Arrange the values from smallest to largest:
. Sample mean: where n = sample size. Arrange the values from smallest to largest:") 1 Chapter 3 - Descriptive stats: Numerical measures 3.1 Measures of Location Mean Perhaps the most important measure of location is the mean (average). Sample mean: where n = sample size Example: The number
1 Chapter 3 - Descriptive stats: Numerical measures 3.1 Measures of Location Mean Perhaps the most important measure of location is the mean (average). Sample mean: where n = sample size Example: The number
ST Presenting & Summarising Data Descriptive Statistics. Frequency Distribution, Histogram & Bar Chart
 ST2001 2. Presenting & Summarising Data Descriptive Statistics Frequency Distribution, Histogram & Bar Chart Summary of Previous Lecture u A study often involves taking a sample from a population that
LC OL - Statistics. Types of Data
 LC OL - Statistics Types of Data Question 1 Characterise each of the following variables as numerical or categorical. In each case, list any three possible values for the variable. (i) Eye colours in a
Statistics for Managers using Microsoft Excel 6 th Edition
 Statistics for Managers using Microsoft Excel 6 th Edition Chapter 3 Numerical Descriptive Measures 3-1 Learning Objectives In this chapter, you learn: To describe the properties of central tendency, variation,
Glossary for the Triola Statistics Series
 Glossary for the Triola Statistics Series Absolute deviation The measure of variation equal to the sum of the deviations of each value from the mean, divided by the number of values Acceptance sampling
Descriptive Statistics Example
 Descriptive tatistics Example A manufacturer is investigating the operating life of laptop computer batteries. The following data are available. Life (min.) Life (min.) Life (min.) Life (min.) 130 145
STT 315 This lecture is based on Chapter 2 of the textbook.
 STT 315 This lecture is based on Chapter 2 of the textbook. Acknowledgement: Author is thankful to Dr. Ashok Sinha, Dr. Jennifer Kaplan and Dr. Parthanil Roy for allowing him to use/edit some of their
Probabilities and Statistics Probabilities and Statistics Probabilities and Statistics
 - Lecture 8 Olariu E. Florentin April, 2018 Table of contents 1 Introduction Vocabulary 2 Descriptive Variables Graphical representations Measures of the Central Tendency The Mean The Median The Mode Comparing
Measures of Central Tendency and their dispersion and applications. Acknowledgement: Dr Muslima Ejaz
 Measures of Central Tendency and their dispersion and applications Acknowledgement: Dr Muslima Ejaz LEARNING OBJECTIVES: Compute and distinguish between the uses of measures of central tendency: mean,
Ø Set of mutually exclusive categories. Ø Classify or categorize subject. Ø No meaningful order to categorization.
 Statistical Tools in Evaluation HPS 41 Dr. Joe G. Schmalfeldt Types of Scores Continuous Scores scores with a potentially infinite number of values. Discrete Scores scores limited to a specific number
Chapter 5: Exploring Data: Distributions Lesson Plan
 Lesson Plan Exploring Data Displaying Distributions: Histograms Interpreting Histograms Displaying Distributions: Stemplots Describing Center: Mean and Median Describing Variability: The Quartiles The
1. Exploratory Data Analysis
 1. Exploratory Data Analysis 1.1 Methods of Displaying Data A visual display aids understanding and can highlight features which may be worth exploring more formally. Displays should have impact and be
QUANTITATIVE DATA. UNIVARIATE DATA data for one variable
 QUANTITATIVE DATA Recall that quantitative (numeric) data values are numbers where data take numerical values for which it is sensible to find averages, such as height, hourly pay, and pulse rates. UNIVARIATE
Higher Secondary - First year STATISTICS Practical Book
 Higher Secondary - First year STATISTICS Practical Book th_statistics_practicals.indd 07-09-08 8:00:9 Introduction Statistical tools are important for us in daily life. They are used in the analysis of
Units. Exploratory Data Analysis. Variables. Student Data
 Units Exploratory Data Analysis Bret Larget Departments of Botany and of Statistics University of Wisconsin Madison Statistics 371 13th September 2005 A unit is an object that can be measured, such as
MATH 2560 C F03 Elementary Statistics I Lecture 1: Displaying Distributions with Graphs. Outline.
 MATH 2560 C F03 Elementary Statistics I Lecture 1: Displaying Distributions with Graphs. Outline. data; variables: categorical & quantitative; distributions; bar graphs & pie charts: What Is Statistics?
1.3: Describing Quantitative Data with Numbers
 1.3: Describing Quantitative Data with Numbers Section 1.3 Describing Quantitative Data with Numbers After this section, you should be able to MEASURE center with the mean and median MEASURE spread with
BIOL 51A - Biostatistics 1 1. Lecture 1: Intro to Biostatistics. Smoking: hazardous? FEV (l) Smoke
 Smoke") BIOL 51A - Biostatistics 1 1 Lecture 1: Intro to Biostatistics Smoking: hazardous? FEV (l) 1 2 3 4 5 No Yes Smoke BIOL 51A - Biostatistics 1 2 Box Plot a.k.a box-and-whisker diagram or candlestick chart
BIOL 51A - Biostatistics 1 1 Lecture 1: Intro to Biostatistics Smoking: hazardous? FEV (l) 1 2 3 4 5 No Yes Smoke BIOL 51A - Biostatistics 1 2 Box Plot a.k.a box-and-whisker diagram or candlestick chart
Statistics I Chapter 2: Univariate data analysis
 Statistics I Chapter 2: Univariate data analysis Chapter 2: Univariate data analysis Contents Graphical displays for categorical data (barchart, piechart) Graphical displays for numerical data data (histogram,
BNG 495 Capstone Design. Descriptive Statistics
 BNG 495 Capstone Design Descriptive Statistics Overview The overall goal of this short course in statistics is to provide an introduction to descriptive and inferential statistical methods, with a focus
Resistant Measure - A statistic that is not affected very much by extreme observations.
 Chapter 1.3 Lecture Notes & Examples Section 1.3 Describing Quantitative Data with Numbers (pp. 50-74) 1.3.1 Measuring Center: The Mean Mean - The arithmetic average. To find the mean (pronounced x bar)
Chapter 2 Descriptive Statistics
 Chapter 2 Descriptive Statistics Lecture 1: Measures of Central Tendency and Dispersion Donald E. Mercante, PhD Biostatistics May 2010 Biostatistics (LSUHSC) Chapter 2 05/10 1 / 34 Lecture 1: Descriptive
Histograms allow a visual interpretation
 Chapter 4: Displaying and Summarizing i Quantitative Data s allow a visual interpretation of quantitative (numerical) data by indicating the number of data points that lie within a range of values, called
OCR Maths S1. Topic Questions from Papers. Representation of Data
 OCR Maths S1 Topic Questions from Papers Representation of Data PhysicsAndMathsTutor.com 12 The back-to-back stem-and-leaf diagram below shows the number of hours of television watched per week by each
Descriptive Data Summarization
 Descriptive Data Summarization Descriptive data summarization gives the general characteristics of the data and identify the presence of noise or outliers, which is useful for successful data cleaning
DEPARTMENT OF QUANTITATIVE METHODS & INFORMATION SYSTEMS QM 120. Spring 2008
 DEPARTMENT OF QUANTITATIVE METHODS & INFORMATION SYSTEMS Introduction to Business Statistics QM 120 Chapter 3 Spring 2008 Measures of central tendency for ungrouped data 2 Graphs are very helpful to describe
MATH 117 Statistical Methods for Management I Chapter Three
 Jubail University College MATH 117 Statistical Methods for Management I Chapter Three This chapter covers the following topics: I. Measures of Center Tendency. 1. Mean for Ungrouped Data (Raw Data) 2.
Lecture 3B: Chapter 4, Section 2 Quantitative Variables (Displays, Begin Summaries)
") Lecture 3B: Chapter 4, Section 2 Quantitative Variables (Displays, Begin Summaries) Summarize with Shape, Center, Spread Displays: Stemplots, Histograms Five Number Summary, Outliers, Boxplots Mean vs.
Lecture 3B: Chapter 4, Section 2 Quantitative Variables (Displays, Begin Summaries) Summarize with Shape, Center, Spread Displays: Stemplots, Histograms Five Number Summary, Outliers, Boxplots Mean vs.
Describing Distributions with Numbers
 Describing Distributions with Numbers Using graphs, we could determine the center, spread, and shape of the distribution of a quantitative variable. We can also use numbers (called summary statistics)
Determining the Spread of a Distribution Variance & Standard Deviation
 Determining the Spread of a Distribution Variance & Standard Deviation 1.3 Cathy Poliak, Ph.D. cathy@math.uh.edu Department of Mathematics University of Houston Lecture 3 Lecture 3 1 / 32 Outline 1 Describing
Class 11 Maths Chapter 15. Statistics
 1 P a g e Class 11 Maths Chapter 15. Statistics Statistics is the Science of collection, organization, presentation, analysis and interpretation of the numerical data. Useful Terms 1. Limit of the Class
Statistics I Chapter 2: Univariate data analysis
 Statistics I Chapter 2: Univariate data analysis Chapter 2: Univariate data analysis Contents Graphical displays for categorical data (barchart, piechart) Graphical displays for numerical data data (histogram,
Lecture 2. Quantitative variables. There are three main graphical methods for describing, summarizing, and detecting patterns in quantitative data:
 Lecture 2 Quantitative variables There are three main graphical methods for describing, summarizing, and detecting patterns in quantitative data: Stemplot (stem-and-leaf plot) Histogram Dot plot Stemplots
Statistics and parameters
 Statistics and parameters Tables, histograms and other charts are used to summarize large amounts of data. Often, an even more extreme summary is desirable. Statistics and parameters are numbers that characterize
2/2/2015 GEOGRAPHY 204: STATISTICAL PROBLEM SOLVING IN GEOGRAPHY MEASURES OF CENTRAL TENDENCY CHAPTER 3: DESCRIPTIVE STATISTICS AND GRAPHICS
 Spring 2015: Lembo GEOGRAPHY 204: STATISTICAL PROBLEM SOLVING IN GEOGRAPHY CHAPTER 3: DESCRIPTIVE STATISTICS AND GRAPHICS Descriptive statistics concise and easily understood summary of data set characteristics
3.1 Measures of Central Tendency: Mode, Median and Mean. Average a single number that is used to describe the entire sample or population
 . Measures of Central Tendency: Mode, Median and Mean Average a single number that is used to describe the entire sample or population. Mode a. Easiest to compute, but not too stable i. Changing just one
Z score indicates how far a raw score deviates from the sample mean in SD units. score Mean % Lower Bound
 1 EDUR 8131 Chat 3 Notes 2 Normal Distribution and Standard Scores Questions Standard Scores: Z score Z = (X M) / SD Z = deviation score divided by standard deviation Z score indicates how far a raw score
REVIEW: Midterm Exam. Spring 2012
 REVIEW: Midterm Exam Spring 2012 Introduction Important Definitions: - Data - Statistics - A Population - A census - A sample Types of Data Parameter (Describing a characteristic of the Population) Statistic
CHAPTER 5: EXPLORING DATA DISTRIBUTIONS. Individuals are the objects described by a set of data. These individuals may be people, animals or things.
 (c) Epstein 2013 Chapter 5: Exploring Data Distributions Page 1 CHAPTER 5: EXPLORING DATA DISTRIBUTIONS 5.1 Creating Histograms Individuals are the objects described by a set of data. These individuals
Data Analysis and Statistical Methods Statistics 651
 Data Analysis and Statistical Methods Statistics 651 http://www.stat.tamu.edu/~suhasini/teaching.html Boxplots and standard deviations Suhasini Subba Rao Review of previous lecture In the previous lecture
Descriptive Univariate Statistics and Bivariate Correlation
 ESC 100 Exploring Engineering Descriptive Univariate Statistics and Bivariate Correlation Instructor: Sudhir Khetan, Ph.D. Wednesday/Friday, October 17/19, 2012 The Central Dogma of Statistics used to
Stat 101 Exam 1 Important Formulas and Concepts 1
 1 Chapter 1 1.1 Definitions Stat 101 Exam 1 Important Formulas and Concepts 1 1. Data Any collection of numbers, characters, images, or other items that provide information about something. 2. Categorical/Qualitative
Chapter 2 Solutions Page 15 of 28
 Chapter Solutions Page 15 of 8.50 a. The median is 55. The mean is about 105. b. The median is a more representative average" than the median here. Notice in the stem-and-leaf plot on p.3 of the text that
Chapter 2 Class Notes Sample & Population Descriptions Classifying variables
 Chapter 2 Class Notes Sample & Population Descriptions Classifying variables Random Variables (RVs) are discrete quantitative continuous nominal qualitative ordinal Notation and Definitions: a Sample is
Introduction. ECN 102: Analysis of Economic Data Winter, J. Parman (UC-Davis) Analysis of Economic Data, Winter 2011 January 4, / 51
 Analysis of Economic Data, Winter 2011 January 4, / 51") Introduction ECN 102: Analysis of Economic Data Winter, 2011 J. Parman (UC-Davis) Analysis of Economic Data, Winter 2011 January 4, 2011 1 / 51 Contact Information Instructor: John Parman Email: jmparman@ucdavis.edu
Introduction ECN 102: Analysis of Economic Data Winter, 2011 J. Parman (UC-Davis) Analysis of Economic Data, Winter 2011 January 4, 2011 1 / 51 Contact Information Instructor: John Parman Email: jmparman@ucdavis.edu
Overview of Dispersion. Standard. Deviation
 15.30 STATISTICS UNIT II: DISPERSION After reading this chapter, students will be able to understand: LEARNING OBJECTIVES To understand different measures of Dispersion i.e Range, Quartile Deviation, Mean