Frequency Distribution Cross-Tabulation
|
|
|
- Gabriel Sullivan
- 6 years ago
- Views:
Transcription
1 Frequency Distribution Cross-Tabulation 1) Overview 2) Frequency Distribution 3) Statistics Associated with Frequency Distribution i. Measures of Location ii. Measures of Variability iii. Measures of Shape 4) Introduction to Hypothesis Testing 5) A General Procedure for Hypothesis Testing 6) Cross-Tabulations 7) Statistics Associated with Cross-Tabulation

2 Respondent Sex Familiarity Internet Attitude Toward Usage of Internet Number Usage Internet Technology Shopping Banking Examining Summary Statistics for Individual Variables
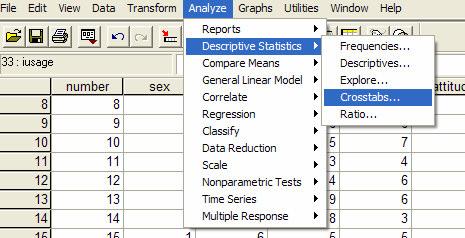
3 Different summary measures are appropriate for different types of data, depending on the level of measurement: Nominal (categorical data where there is no inherent order to the categories) Ordinal (categorical data where there is a meaningful order of categories, but there isn't a measurable distance between categories) Scale (data measured on an interval or ratio scale) For categorical data From the menus choose: Analyse Descriptive Statistics Frequencies For Scale Variables Analyise Descriptive Statistics Explore


4 In a frequency distribution, one variable is considered at a time. A frequency distribution for a variable produces a table of frequency counts, percentages, and cumulative percentages for all the values associated with that variable.
5 !
6 Familiarity N Median Mode Percentiles Statistics Valid Missing ,00 6 3,00 5,00 6,00 Familiarity Valid Missing Total Very Familiar Total 9 Frequency Percent Valid Percent 2 6,7 6,9 6,9 6 20,0 20,7 27,6 6 20,0 20,7 48,3 3 10,0 10,3 58,6 8 26,7 27,6 86,2 4 13,3 13,8 100, ,7 100,0 1 3, ,0 Cumulative Percent Valid Light Users Heavy Users Total Internet Usage Group Cumulative Frequency Percent Valid Percent Percent 15 50,0 50,0 50, ,0 50,0 100, ,0 100,0 Internet Usage Group Light Users Heavy Users
7 The mean, or average value, is the most commonly used measure of central tendency. The mode is the value that occurs most frequently. It represents the highest peak of the distribution. The mode is a good measure of location when the variable is inherently categorical or has otherwise been grouped into categories. The median of a sample is the middle value when the data are arranged in ascending or descending order. If the number of data points is even, the median is usually estimated as the midpoint between the two middle values by adding the two middle values and dividing their sum by 2. The median is the 50th percentile.
8 " The range measures the spread of the data. It is simply the difference between the largest and smallest values in the sample. Range = X largest X smallest. The interquartile range is the difference between the 75th and 25th percentile. For a set of data points arranged in order of magnitude, the p th percentile is the value that has p% of the data points below it and (100 - p)% above it. " The variance is the mean squared deviation from the mean. The variance can never be negative. The standard deviation is the square root of the variance. Σ The coefficient of variation is the ratio of the standard deviation to the mean expressed as a percentage, and is a unitless measure of relative variability.
9 # Skewness. The tendency of the deviations from the mean to be larger in one direction than in the other. It can be thought of as the tendency for one tail of the distribution to be heavier than the other. Kurtosis is a measure of the relative peakedness or flatness of the curve defined by the frequency distribution. The kurtosis of a normal distribution is zero. If the kurtosis is positive, then the distribution is more peaked than a normal distribution. A negative value means that the distribution is flatter than a normal distribution. $!"!"
10 %! " #
11 &'( While a frequency distribution describes one variable at a time, a cross-tabulation describes two or more variables simultaneously. Cross-tabulation results in tables that reflect the joint distribution of two or more variables with a limited number of categories or distinct values, e.g., Table )!"
12 ( "&' ( Since two variables have been cross classified, percentages could be computed either columnwise, based on column totals, or rowwise, based on row totals. The general rule is to compute the percentages in the direction of the independent variable, across the dependent variable. ) ##$#% &&$'% &&$'% ##$#%!" % %
%( - - ' 1- - 0 - -")
13 ) #$% & '%( )* +,-,-,-,-,-,- * &.(/ ( 0 0(% $ )%( - - ' / 3
14 + #,-#, 4563* 7 5 0%% 20%% / ( +*7 7% '( /3
 associated with it. That is, df = (r - 1) x (c -1).")
15 ,'. / 5 9 : ; '% / & ' To determine whether a systematic association exists, the probability of obtaining a value of chisquare as large or larger than the one calculated from the cross-tabulation is estimated. An important characteristic of the chi-square statistic is the number of degrees of freedom (df) associated with it. That is, df = (r - 1) x (c -1). The null hypothesis (H 0 ) of no association between the two variables will be rejected only when the calculated value of the test statistic is greater than the critical value of the chi-square distribution with the appropriate degrees of freedom.
 0 = χ")
16 & ' 2:< ) :<) 0 = χ
17 Nominal Data φ The phi coefficient ( ) is used as a measure of the strength of association in the special case of a table with two rows and two columns (a 2 x 2 table). The phi coefficient is proportional to the square root of the chi-square statistic χ φ The value ranges between: 0 (indicating no association between the row and column variables and values) And 1 (indicating a high degree of association between the variables) The maximum value possible depends on the number of rows and columns in a table
18 The contingency coefficient (C) can be used to assess the strength of association in a table of any size. χ χ $ The contingency coefficient varies between 0 and 1. The maximum value of the contingency coefficient depends on the size of the table (number of rows and number of columns). For this reason, it should be used only to compare tables of the same size. Cramer's V is a modified version of the phi correlation coefficient, φ, and is ranges between 0 and 1. or φ % & χ % &
19 & Asymmetric lambda measures the percentage improvement in predicting the value of the dependent variable, given the value of the independent variable. Lambda also varies between 0 and 1. A value of 0 means no improvement in prediction. A value of 1 indicates that the prediction can be made without error. This happens when each independent variable category is associated with a single category of the dependent variable. Asymmetric lambda is computed for each of the variables (treating it as the dependent variable). A symmetric lambda is also computed, which is a kind of average of the two asymmetric values. The symmetric lambda does not make an assumption about which variable is dependent. It measures the overall improvement when prediction is done in both directions. Internet Banking * Sex Crosstabulation Count Internet Banking Total Yes No Sex Male Female Total Symmetric Measures Nominal by Nominal N of Valid Cases Phi Cramer's V a. Not assuming the null hypothesis. Value Approx. Sig.,509,005,509, b. Using the asymptotic standard error assuming the null hypothesis.
20 Ordinal Data Kendall s Tau b is the most appropriate with square tables in which the number of rows and the number of columns are equal Its value varies between +1 and -1 The sign of the coefficient indicates the direction of the relationship and its absolute value indicates the strength, with larger absolute values indicating stronger relashionships For a rectangular table in which the number of rows is different than the number of columns, Kendall s tau c should be used
21 Gamma A symmetric measure of association between two ordinal variables that ranges between -1 and 1. Values close to an absolute 1 indicate a strong relationship between the two variables Values close to zero indicate little or no relationship Gamma generally has a higher numerical value than tau b or tau c. Somers d A measure of association between two ordinal variables that ranges from -1 to 1 Somer s d is an asymmetric extension of Gamma (but a symmetric version of this statistic is also calculated) Internet Usage Group * Familiarity Crosstabulation Count Internet Usage Group Total Light Users Heavy Users Familiarity Very Familiar Total Ordinal by Ordinal N of Valid Cases Gamma a. Not assuming the null hypothesis. Symmetric Measures Asymp. Value Std. Error a Approx. T b Approx. Sig.,768,142 4,617, b. Using the asymptotic standard error assuming the null hypothesis.
22 &'( * While conducting cross-tabulation analysis in practice, it is useful to proceed along the following steps. 1. Test the null hypothesis that there is no association between the variables using the chi-square statistic. If you fail to reject the null hypothesis, then there is no relationship. 2. If H 0 is rejected, then determine the strength of the association using an appropriate statistic (phi-coefficient, contingency coefficient, Cramer's V, lambda coefficient, or other statistics), as discussed earlier. 3. If H 0 is rejected, interpret the pattern of the relationship by computing the percentages in the direction of the independent variable, across the dependent variable. 4. If the variables are treated as ordinal rather than nominal, use tau b, tau c, or Gamma as the test statistic. If H 0 is rejected, then determine the strength of the association using the magnitude, and the direction of the relationship using the sign of the test statistic.
Chapter Fifteen. Frequency Distribution, Cross-Tabulation, and Hypothesis Testing
 Chapter Fifteen Frequency Distribution, Cross-Tabulation, and Hypothesis Testing Copyright 2010 Pearson Education, Inc. publishing as Prentice Hall 15-1 Internet Usage Data Table 15.1 Respondent Sex Familiarity
Chi-Square. Heibatollah Baghi, and Mastee Badii
 1 Chi-Square Heibatollah Baghi, and Mastee Badii Different Scales, Different Measures of Association Scale of Both Variables Nominal Scale Measures of Association Pearson Chi-Square: χ 2 Ordinal Scale
Ø Set of mutually exclusive categories. Ø Classify or categorize subject. Ø No meaningful order to categorization.
 Statistical Tools in Evaluation HPS 41 Dr. Joe G. Schmalfeldt Types of Scores Continuous Scores scores with a potentially infinite number of values. Discrete Scores scores limited to a specific number
Ø Set of mutually exclusive categories. Ø Classify or categorize subject. Ø No meaningful order to categorization.
 Statistical Tools in Evaluation HPS 41 Fall 213 Dr. Joe G. Schmalfeldt Types of Scores Continuous Scores scores with a potentially infinite number of values. Discrete Scores scores limited to a specific
Entering and recoding variables
 Entering and recoding variables To enter: You create a New data file Define the variables on Variable View Enter the values on Data View To create the dichotomies: Transform -> Recode into Different Variable
Retrieve and Open the Data
 Retrieve and Open the Data 1. To download the data, click on the link on the class website for the SPSS syntax file for lab 1. 2. Open the file that you downloaded. 3. In the SPSS Syntax Editor, click
Parametric versus Nonparametric Statistics-when to use them and which is more powerful? Dr Mahmoud Alhussami
 Parametric versus Nonparametric Statistics-when to use them and which is more powerful? Dr Mahmoud Alhussami Parametric Assumptions The observations must be independent. Dependent variable should be continuous
Research Methodology: Tools
 MSc Business Administration Research Methodology: Tools Applied Data Analysis (with SPSS) Lecture 05: Contingency Analysis March 2014 Prof. Dr. Jürg Schwarz Lic. phil. Heidi Bruderer Enzler Contents Slide
Relate Attributes and Counts
 Relate Attributes and Counts This procedure is designed to summarize data that classifies observations according to two categorical factors. The data may consist of either: 1. Two Attribute variables.
ESP 178 Applied Research Methods. 2/23: Quantitative Analysis
 ESP 178 Applied Research Methods 2/23: Quantitative Analysis Data Preparation Data coding create codebook that defines each variable, its response scale, how it was coded Data entry for mail surveys and
Chapter 10. Chapter 10. Multinomial Experiments and. Multinomial Experiments and Contingency Tables. Contingency Tables.
 Chapter 10 Multinomial Experiments and Contingency Tables 1 Chapter 10 Multinomial Experiments and Contingency Tables 10-1 1 Overview 10-2 2 Multinomial Experiments: of-fitfit 10-3 3 Contingency Tables:
Last Lecture. Distinguish Populations from Samples. Knowing different Sampling Techniques. Distinguish Parameters from Statistics
 Last Lecture Distinguish Populations from Samples Importance of identifying a population and well chosen sample Knowing different Sampling Techniques Distinguish Parameters from Statistics Knowing different
Introduction to Statistics
 Introduction to Statistics By A.V. Vedpuriswar October 2, 2016 Introduction The word Statistics is derived from the Italian word stato, which means state. Statista refers to a person involved with the
Glossary. The ISI glossary of statistical terms provides definitions in a number of different languages:
 Glossary The ISI glossary of statistical terms provides definitions in a number of different languages: http://isi.cbs.nl/glossary/index.htm Adjusted r 2 Adjusted R squared measures the proportion of the
The goodness-of-fit test Having discussed how to make comparisons between two proportions, we now consider comparisons of multiple proportions.
 The goodness-of-fit test Having discussed how to make comparisons between two proportions, we now consider comparisons of multiple proportions. A common problem of this type is concerned with determining
Textbook Examples of. SPSS Procedure
 Textbook s of IBM SPSS Procedures Each SPSS procedure listed below has its own section in the textbook. These sections include a purpose statement that describes the statistical test, identification of
Statistics for Managers Using Microsoft Excel
 Statistics for Managers Using Microsoft Excel 7 th Edition Chapter 1 Chi-Square Tests and Nonparametric Tests Statistics for Managers Using Microsoft Excel 7e Copyright 014 Pearson Education, Inc. Chap
HYPOTHESIS TESTING: THE CHI-SQUARE STATISTIC
 1 HYPOTHESIS TESTING: THE CHI-SQUARE STATISTIC 7 steps of Hypothesis Testing 1. State the hypotheses 2. Identify level of significant 3. Identify the critical values 4. Calculate test statistics 5. Compare
11-2 Multinomial Experiment
 Chapter 11 Multinomial Experiments and Contingency Tables 1 Chapter 11 Multinomial Experiments and Contingency Tables 11-11 Overview 11-2 Multinomial Experiments: Goodness-of-fitfit 11-3 Contingency Tables:
CHAPTER 17 CHI-SQUARE AND OTHER NONPARAMETRIC TESTS FROM: PAGANO, R. R. (2007)
") FROM: PAGANO, R. R. (007) I. INTRODUCTION: DISTINCTION BETWEEN PARAMETRIC AND NON-PARAMETRIC TESTS Statistical inference tests are often classified as to whether they are parametric or nonparametric Parameter
FROM: PAGANO, R. R. (007) I. INTRODUCTION: DISTINCTION BETWEEN PARAMETRIC AND NON-PARAMETRIC TESTS Statistical inference tests are often classified as to whether they are parametric or nonparametric Parameter
Introduction to Statistical Data Analysis Lecture 7: The Chi-Square Distribution
 Introduction to Statistical Data Analysis Lecture 7: The Chi-Square Distribution James V. Lambers Department of Mathematics The University of Southern Mississippi James V. Lambers Statistical Data Analysis
What is Statistics? Statistics is the science of understanding data and of making decisions in the face of variability and uncertainty.
 What is Statistics? Statistics is the science of understanding data and of making decisions in the face of variability and uncertainty. Statistics is a field of study concerned with the data collection,
Basic Business Statistics, 10/e
 Chapter 1 1-1 Basic Business Statistics 11 th Edition Chapter 1 Chi-Square Tests and Nonparametric Tests Basic Business Statistics, 11e 009 Prentice-Hall, Inc. Chap 1-1 Learning Objectives In this chapter,
13.1 Categorical Data and the Multinomial Experiment
 Chapter 13 Categorical Data Analysis 13.1 Categorical Data and the Multinomial Experiment Recall Variable: (numerical) variable (i.e. # of students, temperature, height,). (non-numerical, categorical)
Means or "expected" counts: j = 1 j = 2 i = 1 m11 m12 i = 2 m21 m22 True proportions: The odds that a sampled unit is in category 1 for variable 1 giv
 Measures of Association References: ffl ffl ffl Summarize strength of associations Quantify relative risk Types of measures odds ratio correlation Pearson statistic ediction concordance/discordance Goodman,
Statistical Analysis for QBIC Genetics Adapted by Ellen G. Dow 2017
 Statistical Analysis for QBIC Genetics Adapted by Ellen G. Dow 2017 I. χ 2 or chi-square test Objectives: Compare how close an experimentally derived value agrees with an expected value. One method to
Understand the difference between symmetric and asymmetric measures
 Chapter 9 Measures of Strength of a Relationship Learning Objectives Understand the strength of association between two variables Explain an association from a table of joint frequencies Understand a proportional
SPSS LAB FILE 1
 SPSS LAB FILE www.mcdtu.wordpress.com 1 www.mcdtu.wordpress.com 2 www.mcdtu.wordpress.com 3 OBJECTIVE 1: Transporation of Data Set to SPSS Editor INPUTS: Files: group1.xlsx, group1.txt PROCEDURE FOLLOWED:
Testing Independence
 Testing Independence Dipankar Bandyopadhyay Department of Biostatistics, Virginia Commonwealth University BIOS 625: Categorical Data & GLM 1/50 Testing Independence Previously, we looked at RR = OR = 1
Overview. INFOWO Statistics lecture S1: Descriptive statistics. Detailed Overview of the Statistics track. Definition
 Overview INFOWO Statistics lecture S1: Descriptive statistics Peter de Waal Introduction to statistics Descriptive statistics Department of Information and Computing Sciences Faculty of Science, Universiteit
Readings Howitt & Cramer (2014) Overview
 Overview") Readings Howitt & Cramer (4) Ch 7: Relationships between two or more variables: Diagrams and tables Ch 8: Correlation coefficients: Pearson correlation and Spearman s rho Ch : Statistical significance
Readings Howitt & Cramer (4) Ch 7: Relationships between two or more variables: Diagrams and tables Ch 8: Correlation coefficients: Pearson correlation and Spearman s rho Ch : Statistical significance
Psych Jan. 5, 2005
 Psych 124 1 Wee 1: Introductory Notes on Variables and Probability Distributions (1/5/05) (Reading: Aron & Aron, Chaps. 1, 14, and this Handout.) All handouts are available outside Mija s office. Lecture
Contingency Tables. Safety equipment in use Fatal Non-fatal Total. None 1, , ,128 Seat belt , ,878
 Contingency Tables I. Definition & Examples. A) Contingency tables are tables where we are looking at two (or more - but we won t cover three or more way tables, it s way too complicated) factors, each
Readings Howitt & Cramer (2014)
") Readings Howitt & Cramer (014) Ch 7: Relationships between two or more variables: Diagrams and tables Ch 8: Correlation coefficients: Pearson correlation and Spearman s rho Ch 11: Statistical significance
Readings Howitt & Cramer (014) Ch 7: Relationships between two or more variables: Diagrams and tables Ch 8: Correlation coefficients: Pearson correlation and Spearman s rho Ch 11: Statistical significance
Introduction to Statistics with GraphPad Prism 7
 Introduction to Statistics with GraphPad Prism 7 Outline of the course Power analysis with G*Power Basic structure of a GraphPad Prism project Analysis of qualitative data Chi-square test Analysis of quantitative
10: Crosstabs & Independent Proportions
 10: Crosstabs & Independent Proportions p. 10.1 P Background < Two independent groups < Binary outcome < Compare binomial proportions P Illustrative example ( oswege.sav ) < Food poisoning following church
Tastitsticsss? What s that? Principles of Biostatistics and Informatics. Variables, outcomes. Tastitsticsss? What s that?
 Tastitsticsss? What s that? Statistics describes random mass phanomenons. Principles of Biostatistics and Informatics nd Lecture: Descriptive Statistics 3 th September Dániel VERES Data Collecting (Sampling)
Lecture 9. Selected material from: Ch. 12 The analysis of categorical data and goodness of fit tests
 Lecture 9 Selected material from: Ch. 12 The analysis of categorical data and goodness of fit tests Univariate categorical data Univariate categorical data are best summarized in a one way frequency table.
ST3241 Categorical Data Analysis I Two-way Contingency Tables. 2 2 Tables, Relative Risks and Odds Ratios
 ST3241 Categorical Data Analysis I Two-way Contingency Tables 2 2 Tables, Relative Risks and Odds Ratios 1 What Is A Contingency Table (p.16) Suppose X and Y are two categorical variables X has I categories
Discrete Multivariate Statistics
 Discrete Multivariate Statistics Univariate Discrete Random variables Let X be a discrete random variable which, in this module, will be assumed to take a finite number of t different values which are
A is one of the categories into which qualitative data can be classified.
 Chapter 2 Methods for Describing Sets of Data 2.1 Describing qualitative data Recall qualitative data: non-numerical or categorical data Basic definitions: A is one of the categories into which qualitative
The entire data set consists of n = 32 widgets, 8 of which were made from each of q = 4 different materials.
 One-Way ANOVA Summary The One-Way ANOVA procedure is designed to construct a statistical model describing the impact of a single categorical factor X on a dependent variable Y. Tests are run to determine
Preliminary Statistics course. Lecture 1: Descriptive Statistics
 Preliminary Statistics course Lecture 1: Descriptive Statistics Rory Macqueen (rm43@soas.ac.uk), September 2015 Organisational Sessions: 16-21 Sep. 10.00-13.00, V111 22-23 Sep. 15.00-18.00, V111 24 Sep.
Tables Table A Table B Table C Table D Table E 675
 BMTables.indd Page 675 11/15/11 4:25:16 PM user-s163 Tables Table A Standard Normal Probabilities Table B Random Digits Table C t Distribution Critical Values Table D Chi-square Distribution Critical Values
NON-PARAMETRIC STATISTICS * (http://www.statsoft.com)
") NON-PARAMETRIC STATISTICS * (http://www.statsoft.com) 1. GENERAL PURPOSE 1.1 Brief review of the idea of significance testing To understand the idea of non-parametric statistics (the term non-parametric
NON-PARAMETRIC STATISTICS * (http://www.statsoft.com) 1. GENERAL PURPOSE 1.1 Brief review of the idea of significance testing To understand the idea of non-parametric statistics (the term non-parametric
The Empirical Rule, z-scores, and the Rare Event Approach
 Overview The Empirical Rule, z-scores, and the Rare Event Approach Look at Chebyshev s Rule and the Empirical Rule Explore some applications of the Empirical Rule How to calculate and use z-scores Introducing
Part 1.) We know that the probability of any specific x only given p ij = p i p j is just multinomial(n, p) where p k1 k 2
 We know that the probability of any specific x only given p ij = p i p j is just multinomial(n, p) where p k1 k 2") Problem.) I will break this into two parts: () Proving w (m) = p( x (m) X i = x i, X j = x j, p ij = p i p j ). In other words, the probability of a specific table in T x given the row and column counts
Problem.) I will break this into two parts: () Proving w (m) = p( x (m) X i = x i, X j = x j, p ij = p i p j ). In other words, the probability of a specific table in T x given the row and column counts
Categorical Data Analysis. The data are often just counts of how many things each category has.
 Categorical Data Analysis So far we ve been looking at continuous data arranged into one or two groups, where each group has more than one observation. E.g., a series of measurements on one or two things.
THE ROYAL STATISTICAL SOCIETY HIGHER CERTIFICATE
 THE ROYAL STATISTICAL SOCIETY 004 EXAMINATIONS SOLUTIONS HIGHER CERTIFICATE PAPER II STATISTICAL METHODS The Society provides these solutions to assist candidates preparing for the examinations in future
CIVL 7012/8012. Collection and Analysis of Information
 CIVL 7012/8012 Collection and Analysis of Information Uncertainty in Engineering Statistics deals with the collection and analysis of data to solve real-world problems. Uncertainty is inherent in all real
We know from STAT.1030 that the relevant test statistic for equality of proportions is:
 2. Chi 2 -tests for equality of proportions Introduction: Two Samples Consider comparing the sample proportions p 1 and p 2 in independent random samples of size n 1 and n 2 out of two populations which
Review for Exam #1. Chapter 1. The Nature of Data. Definitions. Population. Sample. Quantitative data. Qualitative (attribute) data
 data") Review for Exam #1 1 Chapter 1 Population the complete collection of elements (scores, people, measurements, etc.) to be studied Sample a subcollection of elements drawn from a population 11 The Nature
Review for Exam #1 1 Chapter 1 Population the complete collection of elements (scores, people, measurements, etc.) to be studied Sample a subcollection of elements drawn from a population 11 The Nature
Statistical Modeling and Analysis of Scientific Inquiry: The Basics of Hypothesis Testing
 Statistical Modeling and Analysis of Scientific Inquiry: The Basics of Hypothesis Testing So, What is Statistics? Theory and techniques for learning from data How to collect How to analyze How to interpret
Psych 230. Psychological Measurement and Statistics
 Psych 230 Psychological Measurement and Statistics Pedro Wolf December 9, 2009 This Time. Non-Parametric statistics Chi-Square test One-way Two-way Statistical Testing 1. Decide which test to use 2. State
Example 2. Given the data below, complete the chart:
 Statistics 2035 Quiz 1 Solutions Example 1. 2 64 150 150 2 128 150 2 256 150 8 8 Example 2. Given the data below, complete the chart: 52.4, 68.1, 66.5, 75.0, 60.5, 78.8, 63.5, 48.9, 81.3 n=9 The data is
Describing distributions with numbers
 Describing distributions with numbers A large number or numerical methods are available for describing quantitative data sets. Most of these methods measure one of two data characteristics: The central
DETAILED CONTENTS PART I INTRODUCTION AND DESCRIPTIVE STATISTICS. 1. Introduction to Statistics
 DETAILED CONTENTS About the Author Preface to the Instructor To the Student How to Use SPSS With This Book PART I INTRODUCTION AND DESCRIPTIVE STATISTICS 1. Introduction to Statistics 1.1 Descriptive and
Assoc.Prof.Dr. Wolfgang Feilmayr Multivariate Methods in Regional Science: Regression and Correlation Analysis REGRESSION ANALYSIS
 REGRESSION ANALYSIS Regression Analysis can be broadly defined as the analysis of statistical relationships between one dependent and one or more independent variables. Although the terms dependent and
Model Estimation Example
 Ronald H. Heck 1 EDEP 606: Multivariate Methods (S2013) April 7, 2013 Model Estimation Example As we have moved through the course this semester, we have encountered the concept of model estimation. Discussions
Nominal Data. Parametric Statistics. Nonparametric Statistics. Parametric vs Nonparametric Tests. Greg C Elvers
 Nominal Data Greg C Elvers 1 Parametric Statistics The inferential statistics that we have discussed, such as t and ANOVA, are parametric statistics A parametric statistic is a statistic that makes certain
Z score indicates how far a raw score deviates from the sample mean in SD units. score Mean % Lower Bound
 1 EDUR 8131 Chat 3 Notes 2 Normal Distribution and Standard Scores Questions Standard Scores: Z score Z = (X M) / SD Z = deviation score divided by standard deviation Z score indicates how far a raw score
CIVL /8904 T R A F F I C F L O W T H E O R Y L E C T U R E - 8
 CIVL - 7904/8904 T R A F F I C F L O W T H E O R Y L E C T U R E - 8 Chi-square Test How to determine the interval from a continuous distribution I = Range 1 + 3.322(logN) I-> Range of the class interval
Scales of Measuement Dr. Sudip Chaudhuri
 Scales of Measuement Dr. Sudip Chaudhuri M. Sc., M. Tech., Ph.D., M. Ed. Assistant Professor, G.C.B.T. College, Habra, India, Honorary Researcher, Saha Institute of Nuclear Physics, Life Member, Indian
Describing distributions with numbers
 Describing distributions with numbers A large number or numerical methods are available for describing quantitative data sets. Most of these methods measure one of two data characteristics: The central
Identify the scale of measurement most appropriate for each of the following variables. (Use A = nominal, B = ordinal, C = interval, D = ratio.
 Answers to Items from Problem Set 1 Item 1 Identify the scale of measurement most appropriate for each of the following variables. (Use A = nominal, B = ordinal, C = interval, D = ratio.) a. response latency
FREQUENCY DISTRIBUTIONS AND PERCENTILES
 FREQUENCY DISTRIBUTIONS AND PERCENTILES New Statistical Notation Frequency (f): the number of times a score occurs N: sample size Simple Frequency Distributions Raw Scores The scores that we have directly
MATH 117 Statistical Methods for Management I Chapter Three
 Jubail University College MATH 117 Statistical Methods for Management I Chapter Three This chapter covers the following topics: I. Measures of Center Tendency. 1. Mean for Ungrouped Data (Raw Data) 2.
Passing-Bablok Regression for Method Comparison
 Chapter 313 Passing-Bablok Regression for Method Comparison Introduction Passing-Bablok regression for method comparison is a robust, nonparametric method for fitting a straight line to two-dimensional
Unit 2. Describing Data: Numerical
 Unit 2 Describing Data: Numerical Describing Data Numerically Describing Data Numerically Central Tendency Arithmetic Mean Median Mode Variation Range Interquartile Range Variance Standard Deviation Coefficient
Chi square test of independence
 Chi square test of independence Eyeball differences between percentages: large enough to be important Better: Are they statistically significant? Statistical significance: are observed differences significantly
Glossary for the Triola Statistics Series
 Glossary for the Triola Statistics Series Absolute deviation The measure of variation equal to the sum of the deviations of each value from the mean, divided by the number of values Acceptance sampling
Review of Statistics 101
 Review of Statistics 101 We review some important themes from the course 1. Introduction Statistics- Set of methods for collecting/analyzing data (the art and science of learning from data). Provides methods
Lecture 8: Summary Measures
 Lecture 8: Summary Measures Dipankar Bandyopadhyay, Ph.D. BMTRY 711: Analysis of Categorical Data Spring 2011 Division of Biostatistics and Epidemiology Medical University of South Carolina Lecture 8:
The Difference in Proportions Test
 Overview The Difference in Proportions Test Dr Tom Ilvento Department of Food and Resource Economics A Difference of Proportions test is based on large sample only Same strategy as for the mean We calculate
STATISTICS ANCILLARY SYLLABUS. (W.E.F. the session ) Semester Paper Code Marks Credits Topic
 Semester Paper Code Marks Credits Topic") STATISTICS ANCILLARY SYLLABUS (W.E.F. the session 2014-15) Semester Paper Code Marks Credits Topic 1 ST21012T 70 4 Descriptive Statistics 1 & Probability Theory 1 ST21012P 30 1 Practical- Using Minitab
STATISTICS ANCILLARY SYLLABUS (W.E.F. the session 2014-15) Semester Paper Code Marks Credits Topic 1 ST21012T 70 4 Descriptive Statistics 1 & Probability Theory 1 ST21012P 30 1 Practical- Using Minitab
Chi square test of independence
 Chi square test of independence We can eyeball differences between percentages to determine whether they seem large enough to be important Better: Are differences in percentages statistically significant?
LOOKING FOR RELATIONSHIPS
 LOOKING FOR RELATIONSHIPS One of most common types of investigation we do is to look for relationships between variables. Variables may be nominal (categorical), for example looking at the effect of an
Department of Economics. Business Statistics. Chapter 12 Chi-square test of independence & Analysis of Variance ECON 509. Dr.
 Department of Economics Business Statistics Chapter 1 Chi-square test of independence & Analysis of Variance ECON 509 Dr. Mohammad Zainal Chapter Goals After completing this chapter, you should be able
BIOS 6222: Biostatistics II. Outline. Course Presentation. Course Presentation. Review of Basic Concepts. Why Nonparametrics.
 BIOS 6222: Biostatistics II Instructors: Qingzhao Yu Don Mercante Cruz Velasco 1 Outline Course Presentation Review of Basic Concepts Why Nonparametrics The sign test 2 Course Presentation Contents Justification
2/2/2015 GEOGRAPHY 204: STATISTICAL PROBLEM SOLVING IN GEOGRAPHY MEASURES OF CENTRAL TENDENCY CHAPTER 3: DESCRIPTIVE STATISTICS AND GRAPHICS
 Spring 2015: Lembo GEOGRAPHY 204: STATISTICAL PROBLEM SOLVING IN GEOGRAPHY CHAPTER 3: DESCRIPTIVE STATISTICS AND GRAPHICS Descriptive statistics concise and easily understood summary of data set characteristics
Contingency Tables. Contingency tables are used when we want to looking at two (or more) factors. Each factor might have two more or levels.
 factors. Each factor might have two more or levels.") Contingency Tables Definition & Examples. Contingency tables are used when we want to looking at two (or more) factors. Each factor might have two more or levels. (Using more than two factors gets complicated,
Contingency Tables Definition & Examples. Contingency tables are used when we want to looking at two (or more) factors. Each factor might have two more or levels. (Using more than two factors gets complicated,
Chapter 26: Comparing Counts (Chi Square)
") Chapter 6: Comparing Counts (Chi Square) We ve seen that you can turn a qualitative variable into a quantitative one (by counting the number of successes and failures), but that s a compromise it forces
Chapter 6: Comparing Counts (Chi Square) We ve seen that you can turn a qualitative variable into a quantitative one (by counting the number of successes and failures), but that s a compromise it forces
Basics of Experimental Design. Review of Statistics. Basic Study. Experimental Design. When an Experiment is Not Possible. Studying Relations
 Basics of Experimental Design Review of Statistics And Experimental Design Scientists study relation between variables In the context of experiments these variables are called independent and dependent
Solutions exercises of Chapter 7
 Solutions exercises of Chapter 7 Exercise 1 a. These are paired samples: each pair of half plates will have about the same level of corrosion, so the result of polishing by the two brands of polish are
1.0 Continuous Distributions. 5.0 Shapes of Distributions. 6.0 The Normal Curve. 7.0 Discrete Distributions. 8.0 Tolerances. 11.
 Chapter 4 Statistics 45 CHAPTER 4 BASIC QUALITY CONCEPTS 1.0 Continuous Distributions.0 Measures of Central Tendency 3.0 Measures of Spread or Dispersion 4.0 Histograms and Frequency Distributions 5.0
Review of Multiple Regression
 Ronald H. Heck 1 Let s begin with a little review of multiple regression this week. Linear models [e.g., correlation, t-tests, analysis of variance (ANOVA), multiple regression, path analysis, multivariate
Chapter 8 Student Lecture Notes 8-1. Department of Economics. Business Statistics. Chapter 12 Chi-square test of independence & Analysis of Variance
 Chapter 8 Student Lecture Notes 8-1 Department of Economics Business Statistics Chapter 1 Chi-square test of independence & Analysis of Variance ECON 509 Dr. Mohammad Zainal Chapter Goals After completing
SPSS and its usage 2073/06/07 06/12. Dr. Bijay Lal Pradhan Dr Bijay Lal Pradhan
 SPSS and its usage 2073/06/07 06/12 Dr. Bijay Lal Pradhan bijayprad@gmail.com http://bijaylalpradhan.com.np Ground Rule Mobile Penalty System Involvement Object of session I Define Statistics and SPSS
Chapter 7 Comparison of two independent samples
 Chapter 7 Comparison of two independent samples 7.1 Introduction Population 1 µ σ 1 1 N 1 Sample 1 y s 1 1 n 1 Population µ σ N Sample y s n 1, : population means 1, : population standard deviations N
4/6/16. Non-parametric Test. Overview. Stephen Opiyo. Distinguish Parametric and Nonparametric Test Procedures
 Non-parametric Test Stephen Opiyo Overview Distinguish Parametric and Nonparametric Test Procedures Explain commonly used Nonparametric Test Procedures Perform Hypothesis Tests Using Nonparametric Procedures
Dover- Sherborn High School Mathematics Curriculum Probability and Statistics
 Mathematics Curriculum A. DESCRIPTION This is a full year courses designed to introduce students to the basic elements of statistics and probability. Emphasis is placed on understanding terminology and
Statistics in medicine
 Statistics in medicine Lecture 1- part 1: Describing variation, and graphical presentation Outline Sources of variation Types of variables Fatma Shebl, MD, MS, MPH, PhD Assistant Professor Chronic Disease
Lecture 41 Sections Mon, Apr 7, 2008
 Lecture 41 Sections 14.1-14.3 Hampden-Sydney College Mon, Apr 7, 2008 Outline 1 2 3 4 5 one-proportion test that we just studied allows us to test a hypothesis concerning one proportion, or two categories,
MATH 10 INTRODUCTORY STATISTICS
 MATH 10 INTRODUCTORY STATISTICS Tommy Khoo Your friendly neighbourhood graduate student. Week 1 Chapter 1 Introduction What is Statistics? Why do you need to know Statistics? Technical lingo and concepts:
T-Test QUESTION T-TEST GROUPS = sex(1 2) /MISSING = ANALYSIS /VARIABLES = quiz1 quiz2 quiz3 quiz4 quiz5 final total /CRITERIA = CI(.95).
 /MISSING = ANALYSIS /VARIABLES = quiz1 quiz2 quiz3 quiz4 quiz5 final total /CRITERIA = CI(.95).") QUESTION 11.1 GROUPS = sex(1 2) /MISSING = ANALYSIS /VARIABLES = quiz2 quiz3 quiz4 quiz5 final total /CRITERIA = CI(.95). Group Statistics quiz2 quiz3 quiz4 quiz5 final total sex N Mean Std. Deviation
QUESTION 11.1 GROUPS = sex(1 2) /MISSING = ANALYSIS /VARIABLES = quiz2 quiz3 quiz4 quiz5 final total /CRITERIA = CI(.95). Group Statistics quiz2 quiz3 quiz4 quiz5 final total sex N Mean Std. Deviation
Objective A: Mean, Median and Mode Three measures of central of tendency: the mean, the median, and the mode.
 Chapter 3 Numerically Summarizing Data Chapter 3.1 Measures of Central Tendency Objective A: Mean, Median and Mode Three measures of central of tendency: the mean, the median, and the mode. A1. Mean The
Hypothesis Testing hypothesis testing approach
 Hypothesis Testing In this case, we d be trying to form an inference about that neighborhood: Do people there shop more often those people who are members of the larger population To ascertain this, we
DATA ANALYSIS. Faculty of Civil Engineering
 DATA ANALYSIS Faculty of Civil Engineering DATA DATA - Introduction Data is a collection of facts, such as numbers, words, measurements, observations or even just descriptions of things. Qualitative data
Small n, σ known or unknown, underlying nongaussian
 READY GUIDE Summary Tables SUMMARY-1: Methods to compute some confidence intervals Parameter of Interest Conditions 95% CI Proportion (π) Large n, p 0 and p 1 Equation 12.11 Small n, any p Figure 12-4
Contents. Acknowledgments. xix
 Table of Preface Acknowledgments page xv xix 1 Introduction 1 The Role of the Computer in Data Analysis 1 Statistics: Descriptive and Inferential 2 Variables and Constants 3 The Measurement of Variables