Supporting Statistical Hypothesis Testing Over Graphs
|
|
|
- Shannon Terry
- 5 years ago
- Views:
Transcription

1 Supporting Statistical Hypothesis Testing Over Graphs Jennifer Neville Departments of Computer Science and Statistics Purdue University (joint work with Tina Eliassi-Rad, Brian Gallagher, Sergey Kirshner, Sebastian Moreno, SVN Vishwananthan, Tao Wang)

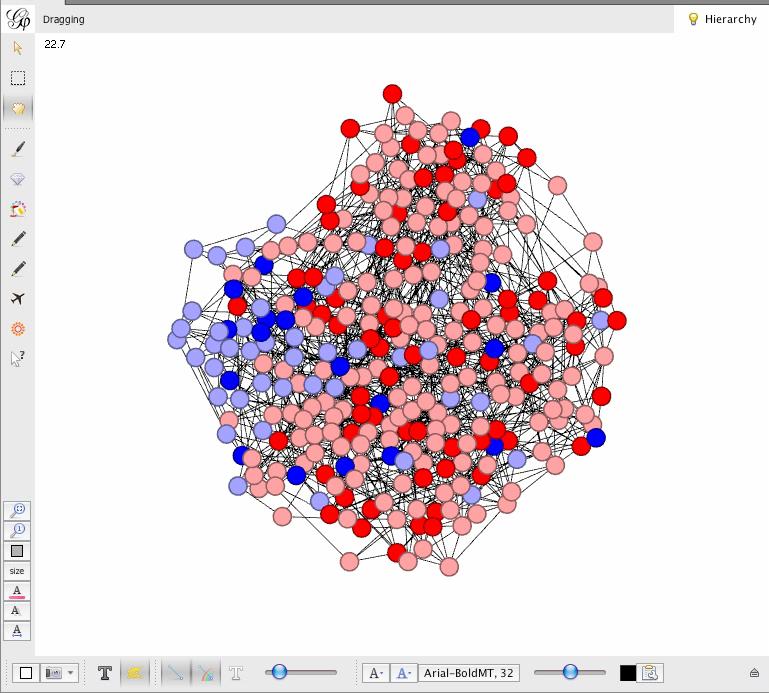
2 Social network prediction and mining Nodes: Facebook users Edges: Articulated friendships Example task: Predict user preferences based on friendships (e.g., political views)
 Fraud detection (Cortes et al. 01, Neville & Jensen 05) Marketing (Domingos et al. 01, Hill et al.")
3 Exploiting network relationships can improve classification Network autocorrelation (correlation of attributes across linked pairs) is ubiquitous: Citation analysis (Taskar et al. 01, Neville & Jensen 03) Fraud detection (Cortes et al. 01, Neville & Jensen 05) Marketing (Domingos et al. 01, Hill et al. 06) Statistical relational models improve accuracy by jointly classifying related instances
4 Network prediction models < X,Y i =1> < X,Y j =0> Goal: Estimate joint distribution P (Y {X} n,g)... or conditional distribution P (Y i X i, X R, Y R )
5 Network autocorrelation interacts with graph structure to impact accuracy of predictive models
6
7
 Y X1 X2 Score: 77% Test set Apply model to test set Evaluate by comparing predicted labels f(x) to true")
8 Typical evaluation framework for ML methods Y X1 X2 Y X1 X2 Training set Learn model from training set Dataset Y X1 X2 F(X) Y X1 X2 Score: 77% Test set Apply model to test set Evaluate by comparing predicted labels f(x) to true labels y
9 Training sets Learned models M0 Test sets Dataset M M8... Average error M9
10 Comparison of algorithm performance Sampling How to partition or sample available data into training and test sets? k-fold cross-validation is often used Significance test Is the observed difference in performance significantly greater than what would be expected by random chance? Null hypothesis (H0): Algorithm performance rates are drawn from the same distribution Two-sample t-test is often used Algorithm A Algorithm B
11 Implicit assumption of structured ML Domain consists of a population of independent graph samples Increase in data corresponds to acquiring more graphs When the graphs are independent, we can use straightforward statistical hypothesis tests


12 ... but statistical learning algorithms are often applied to a single network In this case, an increase in dataset size corresponds networks! Social networks! to acquiring a larger Scientific sample networks! from the network... this changes the statistical foundation for analysis and learning Gene/protein networks! World wide web! Organizational networks!

13 How do we sample a single network when evaluating ML algorithms? Test set Training set Training set Training set Common approach Use repeated random sampling to create multiple sets of labeled/ unlabeled nodes
14 How does simple random sampling affect classifier evaluation?
15 Evaluation of paired t-test on network data Type I error: Incorrectly conclude that algorithms are different when they are not Type I Error Rate Observed Type I error Up to 40% of the time algorithms will appear to be different when they are not! Expected Type I error Proportion Labeled J. Neville, B. Gallagher, and T. Eliassi-Rad. Evaluating Statistical Tests for Within-Network Classifiers of Relational Data. In Proceedings of the 9th IEEE International Conference on Data Mining, 2009.
16 Network characteristics that lead to bias Test sets are dependent when network is resampled As the size of the test set increases, the overlap between test sets increases Network instances are dependent Dependencies among instances leads to correlated errors Correlated error increases the variance of algorithm performance Error correlation Real Data Autocorrelation
17 We can analytically evaluate the misestimation of variance and use it to adjust the significance test...
18 Analytical correction reduces Type I error Type I Error Rate RS NCV RS C NCV C Random resampling Random resampling with correction Proportion Labeled T. Wang, J. Neville, B. Gallagher, and T. Eliassi-Rad. Correcting Bias in Statistical Tests for Network Classifier Evaluation. In Proceedings of the 21st European Conference on Machine Learning, 2011.
19 But autocorrelation+structure performance... what about variation in network structure?

20 Training sets Learned models Test sets M0 Network dataset M M8... Average error M9
21 How to generate network samples for statistical hypothesis testing? Sample subnetworks with similar structure Without replacement: N. Ahmed, J. Neville, and R. Kompella Network sampling via edge-based node selection with graph induction. Technical Report , CS Dept, Purdue University. With replacement: H. Eldardiry and J. Neville. A Resampling Technique for Relational Data Graphs. In Proceedings of the 2nd SNA Workshop, 14th ACM SIGKDD Conference on Knowledge Discovery and Data Mining, Randomize observed network T. LaFond and J. Neville. Randomization tests for distinguishing social influence and homophily effects. In Proceedings of the International World Wide Web Conference (WWW), Generate sample networks from probabilistic model S. Moreno, S. Kirshner, J. Neville, and S.V.N. Vishwanathan. Tied Kronecker Product Graph Models to Capture Variance in Network Populations. In Proceedings of the 48th Annual Allerton Conference on Communications, Control and Computing, 2010.
22 To support hypothesis testing, we need to accurately characterize the variability in graph populations... What is the natural variability of graph structure in real-world domains?
23 Purdue Facebook populations Public wall graph Temporal samples, with 1024 nodes & 60 days of posts
24 AddHealth populations Middle and high school social networks 25 networks with nodes
25 Can current graph models capture the variance we observe in real-world domains?


26 Kronecker product graph model (Leskovec & Faloutsos 07) Starting from initiator matrix of nxn Bernoulli parameters... A matrix of size n k is constructed using Kronecker multiplication... Then a network is generated by sampling from the Bernoulli rv in each cell Assuming Bernoulli rvs, the MLE for Θ can be learned from an observed network e.g. Θ = Θ 0.5Θ Θ Θ = = Θ 0.2Θ
27 Exponential random graph model (ERGM) (Frank & Strauss 86) Represents the joint probability over network structures with a log-linear model: Where f(g) is a set of graph features and θ is a vector of weights for the set of features Features count the occurrences of local subgraphs such as k-triangles or k- stars: Triangle 2-Triangle 2-star 3-star
28 Variation of generated graphs: Facebook Original population KPGM ERGM Degree Hop plot Clustering
29 Variation of generated graphs: AddHealth Both models produce surprisingly little variance Degree in their generated graphs Hop plot S. Moreno and J. Neville. An Investigation of the Distributional Characteristics of Generative Graph Models. In Proceedings of the 1st Workshop on Information in Networks, Clustering
30 Let s reconsider the KPGM generation process... as a hierarchy of Bernoulli trials
31 KPGM generation process 1st level Kronecker colors=parameter values, cells=independent parameters
32 KPGM generation process 1st level Kronecker colors=parameter values, cells=independent parameters 2nd level Kronecker
33 KPGM generation process 1st level Kronecker colors=parameter values, cells=independent parameters 2nd level Kronecker 3rd level Kronecker
34 KPGM generation process 1st level Kronecker colors=parameter values, cells=independent parameters 2nd level Kronecker 3rd level Kronecker Graph generation= product of trial results from each level
35 KPGM generation process
36 Low variance is due to large number of independent Bernoulli trials... but we know that dependencies can increase variance, so what if trials are dependent instead?
37 Tied KPGM generation 1st level Kronecker colors=parameter values, cells=independent parameters
38 Tied KPGM generation 1st level Kronecker colors=parameter values, cells=independent parameters 2nd level Kronecker
39 Tied KPGM generation 1st level Kronecker colors=parameter values, cells=independent parameters 2nd level Kronecker 3rd level Kronecker
40 Tied KPGM generation Graph generation= product of trial results from each level
41 KPGM vs. tied KPGM Tied KPGMs exhibit more clustering, probably too much...
42 Mix KPGMs with tkpgms to incorporate dependencies for a portion of the hierarchy
43 Mixed KPGMs S. Moreno, S. Kirshner, J. Neville, and S.V.N. Vishwanathan. Tied Kronecker Product Graph Models to Capture Variance in Network Populations. In Proceedings of the 48th Annual Allerton Conference on Communications, Control and Computing, 2010.
44 Comparison of three models
45 How does parameter tying affect variance?
46 Variation with different mixing proportions 300 graphs with parameters: = Number of levels that are not tied Number of levels that are not tied Number of levels that are not tied Number of levels that are not tied
47 Learning mkpgm models Extending the KPGM parameter estimation algorithm for mkpgms If the mixing level is known, then we can alternate between sampling a permutation and estimating the parameters of the KPGM and tkpgm But, MLE estimation only works well when starting from very close to the true permutation, which is unknown in practice Heuristic approach for mkpgm parameter estimation Note the fractal structure of the mkpgm implies that some subgraphs are generated directly from an (equivalent) KPGM at a local scale We use snowball sampling to identify subgraphs that were likely to have been generated in the same block in the mkpgm model Then we estimate parameters locally within these sampled subgraphs, and combine the set of estimated parameters in a ensemble approach to estimate the overall mkpgm parameters
48 Experimental results: synthetic data mkpgm estimation method is able to recover the correct parameters in synthetic data experiments
49 Experimental results: Facebook data On real data, the estimated mkpgms exhibit more variance, and more accurately capture clustering
50 Towards a statistical hypothesis testing framework for anomaly detection
51 Anomaly detection with mkpgms Approach Learn mkpgm model from representative network Use learned mkpgm to generate empirical sampling distribution of likelihood, for networks drawn from the same population Compute likelihood of new observed network and flag as anomaly those that are very unlikely given sampling distribution above
52 Initial results: Facebook Likelihood based approach is able to distinguish random networks with same density
53 Open questions How to conduct accurate hypothesis tests? Dependencies and heterogeneous structure impact variance estimates and make it difficult to quantify effective sample size and assess significance of differences Thus, we need empirical sampling distribution of network structure... How to accurately model graph populations? There are many generative graph models but evaluation focuses mainly on matching the properties of a single observed network... What is the population? A single large, evolving graph process? or a collection of graphs with similar size/structure? How to evaluate the representativeness of a sample network?
54 Conclusion Relational dependencies can significantly improve predictions through the use of collective inference models......but current methods make assumptions about data and model characteristics that are often not appropriate Link information is heterogeneous, not uniform/stationary Label and attribute information is sparse, not fully labeled Data comprises a single network, not a population of networks In order to best exploit the relational information for prediction, we need to consider graph/data structure carefully and understand its impact on predictive modeling of attributes
55 Questions?
Tied Kronecker Product Graph Models to Capture Variance in Network Populations
 Tied Kronecker Product Graph Models to Capture Variance in Network Populations Sebastian Moreno, Sergey Kirshner +, Jennifer Neville +, SVN Vishwanathan + Department of Computer Science, + Department of
Lifted and Constrained Sampling of Attributed Graphs with Generative Network Models
 Lifted and Constrained Sampling of Attributed Graphs with Generative Network Models Jennifer Neville Departments of Computer Science and Statistics Purdue University (joint work with Pablo Robles Granda,
How to exploit network properties to improve learning in relational domains
 How to exploit network properties to improve learning in relational domains Jennifer Neville Departments of Computer Science and Statistics Purdue University!!!! (joint work with Brian Gallagher, Timothy
A Shrinkage Approach for Modeling Non-Stationary Relational Autocorrelation
 A Shrinkage Approach for Modeling Non-Stationary Relational Autocorrelation Pelin Angin Department of Computer Science Purdue University pangin@cs.purdue.edu Jennifer Neville Department of Computer Science
Using Bayesian Network Representations for Effective Sampling from Generative Network Models
 Using Bayesian Network Representations for Effective Sampling from Generative Network Models Pablo Robles-Granda and Sebastian Moreno and Jennifer Neville Computer Science Department Purdue University
Using Bayesian Network Representations for Effective Sampling from Generative Network Models
 Using Bayesian Network Representations for Effective Sampling from Generative Network Models Pablo Robles-Granda and Sebastian Moreno and Jennifer Neville Computer Science Department Purdue University
Semi-supervised learning for node classification in networks
 Semi-supervised learning for node classification in networks Jennifer Neville Departments of Computer Science and Statistics Purdue University (joint work with Paul Bennett, John Moore, and Joel Pfeiffer)
Sampling of Attributed Networks from Hierarchical Generative Models
 Sampling of Attributed Networks from Hierarchical Generative Models Pablo Robles Purdue University West Lafayette, IN USA problesg@purdue.edu Sebastian Moreno Universidad Adolfo Ibañez Viña del Mar, Chile
Quilting Stochastic Kronecker Graphs to Generate Multiplicative Attribute Graphs
 Quilting Stochastic Kronecker Graphs to Generate Multiplicative Attribute Graphs Hyokun Yun (work with S.V.N. Vishwanathan) Department of Statistics Purdue Machine Learning Seminar November 9, 2011 Overview
Collective classification in large scale networks. Jennifer Neville Departments of Computer Science and Statistics Purdue University
 Collective classification in large scale networks Jennifer Neville Departments of Computer Science and Statistics Purdue University The data mining process Network Datadata Knowledge Selection Interpretation
Quilting Stochastic Kronecker Product Graphs to Generate Multiplicative Attribute Graphs
 Quilting Stochastic Kronecker Product Graphs to Generate Multiplicative Attribute Graphs Hyokun Yun Department of Statistics Purdue University SV N Vishwanathan Departments of Statistics and Computer Science
RaRE: Social Rank Regulated Large-scale Network Embedding
 RaRE: Social Rank Regulated Large-scale Network Embedding Authors: Yupeng Gu 1, Yizhou Sun 1, Yanen Li 2, Yang Yang 3 04/26/2018 The Web Conference, 2018 1 University of California, Los Angeles 2 Snapchat
Jure Leskovec Joint work with Jaewon Yang, Julian McAuley
 Jure Leskovec (@jure) Joint work with Jaewon Yang, Julian McAuley Given a network, find communities! Sets of nodes with common function, role or property 2 3 Q: How and why do communities form? A: Strength
Link Prediction. Eman Badr Mohammed Saquib Akmal Khan
 Link Prediction Eman Badr Mohammed Saquib Akmal Khan 11-06-2013 Link Prediction Which pair of nodes should be connected? Applications Facebook friend suggestion Recommendation systems Monitoring and controlling
Overlapping Communities
 Overlapping Communities Davide Mottin HassoPlattner Institute Graph Mining course Winter Semester 2017 Acknowledgements Most of this lecture is taken from: http://web.stanford.edu/class/cs224w/slides GRAPH
How do we compare the relative performance among competing models?
 How do we compare the relative performance among competing models? 1 Comparing Data Mining Methods Frequent problem: we want to know which of the two learning techniques is better How to reliably say Model
Hybrid Models for Text and Graphs. 10/23/2012 Analysis of Social Media
 Hybrid Models for Text and Graphs 10/23/2012 Analysis of Social Media Newswire Text Formal Primary purpose: Inform typical reader about recent events Broad audience: Explicitly establish shared context
Parameter estimators of sparse random intersection graphs with thinned communities
 Parameter estimators of sparse random intersection graphs with thinned communities Lasse Leskelä Aalto University Johan van Leeuwaarden Eindhoven University of Technology Joona Karjalainen Aalto University
Consistency Under Sampling of Exponential Random Graph Models
 Consistency Under Sampling of Exponential Random Graph Models Cosma Shalizi and Alessandro Rinaldo Summary by: Elly Kaizar Remember ERGMs (Exponential Random Graph Models) Exponential family models Sufficient
Data Mining. CS57300 Purdue University. Bruno Ribeiro. February 8, 2018
 Data Mining CS57300 Purdue University Bruno Ribeiro February 8, 2018 Decision trees Why Trees? interpretable/intuitive, popular in medical applications because they mimic the way a doctor thinks model
Estimating the accuracy of a hypothesis Setting. Assume a binary classification setting
 Estimating the accuracy of a hypothesis Setting Assume a binary classification setting Assume input/output pairs (x, y) are sampled from an unknown probability distribution D = p(x, y) Train a binary classifier
Controlling for confounding network properties in hypothesis testing and anomaly detection
 Purdue University Purdue e-pubs Open Access Dissertations Theses and Dissertations 8-2016 Controlling for confounding network properties in hypothesis testing and anomaly detection Timothy La Fond Purdue
arxiv: v1 [cs.si] 13 Nov 2014
![arxiv: v1 [cs.si] 13 Nov 2014](/thumbs/88/117271633.jpg "arxiv: v1 [cs.si] 13 Nov 2014") Anomaly Detection in Dynamic Networks of Varying Size Timothy La Fond 1, Jennifer Neville 1, Brian Gallagher 2 1 Purdue University, 2 Lawrence Livermore National Laboratory {tlafond,neville}@purdue.edu,
Anomaly Detection in Dynamic Networks of Varying Size Timothy La Fond 1, Jennifer Neville 1, Brian Gallagher 2 1 Purdue University, 2 Lawrence Livermore National Laboratory {tlafond,neville}@purdue.edu,
Performance Evaluation and Comparison
 Outline Hong Chang Institute of Computing Technology, Chinese Academy of Sciences Machine Learning Methods (Fall 2012) Outline Outline I 1 Introduction 2 Cross Validation and Resampling 3 Interval Estimation
Networks as vectors of their motif frequencies and 2-norm distance as a measure of similarity
 Networks as vectors of their motif frequencies and 2-norm distance as a measure of similarity CS322 Project Writeup Semih Salihoglu Stanford University 353 Serra Street Stanford, CA semih@stanford.edu
Data Mining Techniques
 Data Mining Techniques CS 622 - Section 2 - Spring 27 Pre-final Review Jan-Willem van de Meent Feedback Feedback https://goo.gl/er7eo8 (also posted on Piazza) Also, please fill out your TRACE evaluations!
Graph Detection and Estimation Theory
 Introduction Detection Estimation Graph Detection and Estimation Theory (and algorithms, and applications) Patrick J. Wolfe Statistics and Information Sciences Laboratory (SISL) School of Engineering and
Class Prior Estimation from Positive and Unlabeled Data
 IEICE Transactions on Information and Systems, vol.e97-d, no.5, pp.1358 1362, 2014. 1 Class Prior Estimation from Positive and Unlabeled Data Marthinus Christoffel du Plessis Tokyo Institute of Technology,
Node similarity and classification
 Node similarity and classification Davide Mottin, Anton Tsitsulin HassoPlattner Institute Graph Mining course Winter Semester 2017 Acknowledgements Some part of this lecture is taken from: http://web.eecs.umich.edu/~dkoutra/tut/icdm14.html
CS224W: Social and Information Network Analysis
 CS224W: Social and Information Network Analysis Reaction Paper Adithya Rao, Gautam Kumar Parai, Sandeep Sripada Keywords: Self-similar networks, fractality, scale invariance, modularity, Kronecker graphs.
Prof. Dr. Ralf Möller Dr. Özgür L. Özçep Universität zu Lübeck Institut für Informationssysteme. Tanya Braun (Exercises)
") Prof. Dr. Ralf Möller Dr. Özgür L. Özçep Universität zu Lübeck Institut für Informationssysteme Tanya Braun (Exercises) Slides taken from the presentation (subset only) Learning Statistical Models From
Prof. Dr. Ralf Möller Dr. Özgür L. Özçep Universität zu Lübeck Institut für Informationssysteme Tanya Braun (Exercises) Slides taken from the presentation (subset only) Learning Statistical Models From
Learning Task Grouping and Overlap in Multi-Task Learning
 Learning Task Grouping and Overlap in Multi-Task Learning Abhishek Kumar Hal Daumé III Department of Computer Science University of Mayland, College Park 20 May 2013 Proceedings of the 29 th International
A graph contains a set of nodes (vertices) connected by links (edges or arcs)
 connected by links (edges or arcs)") BOLTZMANN MACHINES Generative Models Graphical Models A graph contains a set of nodes (vertices) connected by links (edges or arcs) In a probabilistic graphical model, each node represents a random variable,
BOLTZMANN MACHINES Generative Models Graphical Models A graph contains a set of nodes (vertices) connected by links (edges or arcs) In a probabilistic graphical model, each node represents a random variable,
Content-based Recommendation
 Content-based Recommendation Suthee Chaidaroon June 13, 2016 Contents 1 Introduction 1 1.1 Matrix Factorization......................... 2 2 slda 2 2.1 Model................................. 3 3 flda 3
Empirical Risk Minimization, Model Selection, and Model Assessment
 Empirical Risk Minimization, Model Selection, and Model Assessment CS6780 Advanced Machine Learning Spring 2015 Thorsten Joachims Cornell University Reading: Murphy 5.7-5.7.2.4, 6.5-6.5.3.1 Dietterich,
Parametric Models. Dr. Shuang LIANG. School of Software Engineering TongJi University Fall, 2012
 Parametric Models Dr. Shuang LIANG School of Software Engineering TongJi University Fall, 2012 Today s Topics Maximum Likelihood Estimation Bayesian Density Estimation Today s Topics Maximum Likelihood
ML in Practice: CMSC 422 Slides adapted from Prof. CARPUAT and Prof. Roth
 ML in Practice: CMSC 422 Slides adapted from Prof. CARPUAT and Prof. Roth N-fold cross validation Instead of a single test-training split: train test Split data into N equal-sized parts Train and test
Algorithm-Independent Learning Issues
 Algorithm-Independent Learning Issues Selim Aksoy Department of Computer Engineering Bilkent University saksoy@cs.bilkent.edu.tr CS 551, Spring 2007 c 2007, Selim Aksoy Introduction We have seen many learning
Naïve Bayes classification
 Naïve Bayes classification 1 Probability theory Random variable: a variable whose possible values are numerical outcomes of a random phenomenon. Examples: A person s height, the outcome of a coin toss
10-810: Advanced Algorithms and Models for Computational Biology. Optimal leaf ordering and classification
 10-810: Advanced Algorithms and Models for Computational Biology Optimal leaf ordering and classification Hierarchical clustering As we mentioned, its one of the most popular methods for clustering gene
Scalable and exact sampling method for probabilistic generative graph models
 Data Min Knowl Disc https://doi.org/10.1007/s10618-018-0566-x Scalable and exact sampling method for probabilistic generative graph models Sebastian Moreno 1 Joseph J. Pfeiffer III 2 Jennifer Neville 3
Unsupervised Learning with Permuted Data
 Unsupervised Learning with Permuted Data Sergey Kirshner skirshne@ics.uci.edu Sridevi Parise sparise@ics.uci.edu Padhraic Smyth smyth@ics.uci.edu School of Information and Computer Science, University
Chapter ML:II (continued)
") Chapter ML:II (continued) II. Machine Learning Basics Regression Concept Learning: Search in Hypothesis Space Concept Learning: Search in Version Space Measuring Performance ML:II-96 Basics STEIN/LETTMANN
Chapter ML:II (continued) II. Machine Learning Basics Regression Concept Learning: Search in Hypothesis Space Concept Learning: Search in Version Space Measuring Performance ML:II-96 Basics STEIN/LETTMANN
Measuring Social Influence Without Bias
 Measuring Social Influence Without Bias Annie Franco Bobbie NJ Macdonald December 9, 2015 The Problem CS224W: Final Paper How well can statistical models disentangle the effects of social influence from
Randomization Tests for Distinguishing Social Influence and Homophily Effects
 andomization Tests for Distinguishing Social Influence and Homophily Effects Timothy La Fond and Jennifer Neville Computer Science Department Purdue University West Lafayette, IN 47907 [tlafond neville]@cs.purdue.edu
Click Prediction and Preference Ranking of RSS Feeds
 Click Prediction and Preference Ranking of RSS Feeds 1 Introduction December 11, 2009 Steven Wu RSS (Really Simple Syndication) is a family of data formats used to publish frequently updated works. RSS
Logic and machine learning review. CS 540 Yingyu Liang
 Logic and machine learning review CS 540 Yingyu Liang Propositional logic Logic If the rules of the world are presented formally, then a decision maker can use logical reasoning to make rational decisions.
Modeling of Growing Networks with Directional Attachment and Communities
 Modeling of Growing Networks with Directional Attachment and Communities Masahiro KIMURA, Kazumi SAITO, Naonori UEDA NTT Communication Science Laboratories 2-4 Hikaridai, Seika-cho, Kyoto 619-0237, Japan
Data Mining. Chapter 5. Credibility: Evaluating What s Been Learned
 Data Mining Chapter 5. Credibility: Evaluating What s Been Learned 1 Evaluating how different methods work Evaluation Large training set: no problem Quality data is scarce. Oil slicks: a skilled & labor-intensive
The Naïve Bayes Classifier. Machine Learning Fall 2017
 The Naïve Bayes Classifier Machine Learning Fall 2017 1 Today s lecture The naïve Bayes Classifier Learning the naïve Bayes Classifier Practical concerns 2 Today s lecture The naïve Bayes Classifier Learning
COMP9444: Neural Networks. Vapnik Chervonenkis Dimension, PAC Learning and Structural Risk Minimization
 : Neural Networks Vapnik Chervonenkis Dimension, PAC Learning and Structural Risk Minimization 11s2 VC-dimension and PAC-learning 1 How good a classifier does a learner produce? Training error is the precentage
Decision Trees. CS57300 Data Mining Fall Instructor: Bruno Ribeiro
 Decision Trees CS57300 Data Mining Fall 2016 Instructor: Bruno Ribeiro Goal } Classification without Models Well, partially without a model } Today: Decision Trees 2015 Bruno Ribeiro 2 3 Why Trees? } interpretable/intuitive,
Machine Learning. Ensemble Methods. Manfred Huber
 Machine Learning Ensemble Methods Manfred Huber 2015 1 Bias, Variance, Noise Classification errors have different sources Choice of hypothesis space and algorithm Training set Noise in the data The expected
MINIMUM EXPECTED RISK PROBABILITY ESTIMATES FOR NONPARAMETRIC NEIGHBORHOOD CLASSIFIERS. Maya Gupta, Luca Cazzanti, and Santosh Srivastava
 MINIMUM EXPECTED RISK PROBABILITY ESTIMATES FOR NONPARAMETRIC NEIGHBORHOOD CLASSIFIERS Maya Gupta, Luca Cazzanti, and Santosh Srivastava University of Washington Dept. of Electrical Engineering Seattle,
Topics in Natural Language Processing
 Topics in Natural Language Processing Shay Cohen Institute for Language, Cognition and Computation University of Edinburgh Lecture 9 Administrativia Next class will be a summary Please email me questions
Naïve Bayes classification. p ij 11/15/16. Probability theory. Probability theory. Probability theory. X P (X = x i )=1 i. Marginal Probability
=1 i. Marginal Probability") Probability theory Naïve Bayes classification Random variable: a variable whose possible values are numerical outcomes of a random phenomenon. s: A person s height, the outcome of a coin toss Distinguish
Probability theory Naïve Bayes classification Random variable: a variable whose possible values are numerical outcomes of a random phenomenon. s: A person s height, the outcome of a coin toss Distinguish
Applying Latent Dirichlet Allocation to Group Discovery in Large Graphs
 Lawrence Livermore National Laboratory Applying Latent Dirichlet Allocation to Group Discovery in Large Graphs Keith Henderson and Tina Eliassi-Rad keith@llnl.gov and eliassi@llnl.gov This work was performed
Machine Learning, Midterm Exam: Spring 2009 SOLUTION
 10-601 Machine Learning, Midterm Exam: Spring 2009 SOLUTION March 4, 2009 Please put your name at the top of the table below. If you need more room to work out your answer to a question, use the back of
Machine Learning
 Machine Learning 10-601 Tom M. Mitchell Machine Learning Department Carnegie Mellon University August 30, 2017 Today: Decision trees Overfitting The Big Picture Coming soon Probabilistic learning MLE,
Prediction of Citations for Academic Papers
 000 001 002 003 004 005 006 007 008 009 010 011 012 013 014 015 016 017 018 019 020 021 022 023 024 025 026 027 028 029 030 031 032 033 034 035 036 037 038 039 040 041 042 043 044 045 046 047 048 049 050
A New Space for Comparing Graphs
 A New Space for Comparing Graphs Anshumali Shrivastava and Ping Li Cornell University and Rutgers University August 18th 2014 Anshumali Shrivastava and Ping Li ASONAM 2014 August 18th 2014 1 / 38 Main
Resampling Methods CAPT David Ruth, USN
 Resampling Methods CAPT David Ruth, USN Mathematics Department, United States Naval Academy Science of Test Workshop 05 April 2017 Outline Overview of resampling methods Bootstrapping Cross-validation
When is undersampling effective in unbalanced classification tasks?
 When is undersampling effective in unbalanced classification tasks? Andrea Dal Pozzolo, Olivier Caelen, and Gianluca Bontempi 09/09/2015 ECML-PKDD 2015 Porto, Portugal 1/ 23 INTRODUCTION In several binary
Mining Newsgroups Using Networks Arising From Social Behavior by Rakesh Agrawal et al. Presented by Will Lee
 Mining Newsgroups Using Networks Arising From Social Behavior by Rakesh Agrawal et al. Presented by Will Lee wwlee1@uiuc.edu September 28, 2004 Motivation IR on newsgroups is challenging due to lack of
Groups of vertices and Core-periphery structure. By: Ralucca Gera, Applied math department, Naval Postgraduate School Monterey, CA, USA
 Groups of vertices and Core-periphery structure By: Ralucca Gera, Applied math department, Naval Postgraduate School Monterey, CA, USA Mostly observed real networks have: Why? Heavy tail (powerlaw most
Exploring the Patterns of Human Mobility Using Heterogeneous Traffic Trajectory Data
 Exploring the Patterns of Human Mobility Using Heterogeneous Traffic Trajectory Data Jinzhong Wang April 13, 2016 The UBD Group Mobile and Social Computing Laboratory School of Software, Dalian University
Least Squares Regression
 E0 70 Machine Learning Lecture 4 Jan 7, 03) Least Squares Regression Lecturer: Shivani Agarwal Disclaimer: These notes are a brief summary of the topics covered in the lecture. They are not a substitute
Bayesian Methods: Naïve Bayes
 Bayesian Methods: aïve Bayes icholas Ruozzi University of Texas at Dallas based on the slides of Vibhav Gogate Last Time Parameter learning Learning the parameter of a simple coin flipping model Prior
GraphRNN: A Deep Generative Model for Graphs (24 Feb 2018)
") GraphRNN: A Deep Generative Model for Graphs (24 Feb 2018) Jiaxuan You, Rex Ying, Xiang Ren, William L. Hamilton, Jure Leskovec Presented by: Jesse Bettencourt and Harris Chan March 9, 2018 University
GraphRNN: A Deep Generative Model for Graphs (24 Feb 2018) Jiaxuan You, Rex Ying, Xiang Ren, William L. Hamilton, Jure Leskovec Presented by: Jesse Bettencourt and Harris Chan March 9, 2018 University
Models, Data, Learning Problems
 Universität Potsdam Institut für Informatik Lehrstuhl Maschinelles Lernen Models, Data, Learning Problems Tobias Scheffer Overview Types of learning problems: Supervised Learning (Classification, Regression,
Introduction to Machine Learning
 Introduction to Machine Learning CS4731 Dr. Mihail Fall 2017 Slide content based on books by Bishop and Barber. https://www.microsoft.com/en-us/research/people/cmbishop/ http://web4.cs.ucl.ac.uk/staff/d.barber/pmwiki/pmwiki.php?n=brml.homepage
Sampling and Estimation in Network Graphs
 Sampling and Estimation in Network Graphs Gonzalo Mateos Dept. of ECE and Goergen Institute for Data Science University of Rochester gmateosb@ece.rochester.edu http://www.ece.rochester.edu/~gmateosb/ March
Least Squares Regression
 CIS 50: Machine Learning Spring 08: Lecture 4 Least Squares Regression Lecturer: Shivani Agarwal Disclaimer: These notes are designed to be a supplement to the lecture. They may or may not cover all the
Boosting. CAP5610: Machine Learning Instructor: Guo-Jun Qi
 Boosting CAP5610: Machine Learning Instructor: Guo-Jun Qi Weak classifiers Weak classifiers Decision stump one layer decision tree Naive Bayes A classifier without feature correlations Linear classifier
Loss Functions, Decision Theory, and Linear Models
 Loss Functions, Decision Theory, and Linear Models CMSC 678 UMBC January 31 st, 2018 Some slides adapted from Hamed Pirsiavash Logistics Recap Piazza (ask & answer questions): https://piazza.com/umbc/spring2018/cmsc678
Pointwise Exact Bootstrap Distributions of Cost Curves
 Pointwise Exact Bootstrap Distributions of Cost Curves Charles Dugas and David Gadoury University of Montréal 25th ICML Helsinki July 2008 Dugas, Gadoury (U Montréal) Cost curves July 8, 2008 1 / 24 Outline
Active Learning and Optimized Information Gathering
 Active Learning and Optimized Information Gathering Lecture 7 Learning Theory CS 101.2 Andreas Krause Announcements Project proposal: Due tomorrow 1/27 Homework 1: Due Thursday 1/29 Any time is ok. Office
A Decision Stump. Decision Trees, cont. Boosting. Machine Learning 10701/15781 Carlos Guestrin Carnegie Mellon University. October 1 st, 2007
 Decision Trees, cont. Boosting Machine Learning 10701/15781 Carlos Guestrin Carnegie Mellon University October 1 st, 2007 1 A Decision Stump 2 1 The final tree 3 Basic Decision Tree Building Summarized
Specification and estimation of exponential random graph models for social (and other) networks
 networks") Specification and estimation of exponential random graph models for social (and other) networks Tom A.B. Snijders University of Oxford March 23, 2009 c Tom A.B. Snijders (University of Oxford) Models for
Specification and estimation of exponential random graph models for social (and other) networks Tom A.B. Snijders University of Oxford March 23, 2009 c Tom A.B. Snijders (University of Oxford) Models for
Machine Learning Ensemble Learning I Hamid R. Rabiee Jafar Muhammadi, Alireza Ghasemi Spring /
 Machine Learning Ensemble Learning I Hamid R. Rabiee Jafar Muhammadi, Alireza Ghasemi Spring 2015 http://ce.sharif.edu/courses/93-94/2/ce717-1 / Agenda Combining Classifiers Empirical view Theoretical
11. Learning graphical models
 Learning graphical models 11-1 11. Learning graphical models Maximum likelihood Parameter learning Structural learning Learning partially observed graphical models Learning graphical models 11-2 statistical
Probability and Information Theory. Sargur N. Srihari
 Probability and Information Theory Sargur N. srihari@cedar.buffalo.edu 1 Topics in Probability and Information Theory Overview 1. Why Probability? 2. Random Variables 3. Probability Distributions 4. Marginal
CS-E4830 Kernel Methods in Machine Learning
 CS-E4830 Kernel Methods in Machine Learning Lecture 5: Multi-class and preference learning Juho Rousu 11. October, 2017 Juho Rousu 11. October, 2017 1 / 37 Agenda from now on: This week s theme: going
Learning in Probabilistic Graphs exploiting Language-Constrained Patterns
 Learning in Probabilistic Graphs exploiting Language-Constrained Patterns Claudio Taranto, Nicola Di Mauro, and Floriana Esposito Department of Computer Science, University of Bari "Aldo Moro" via E. Orabona,
Bayesian Learning. CSL603 - Fall 2017 Narayanan C Krishnan
 Bayesian Learning CSL603 - Fall 2017 Narayanan C Krishnan ckn@iitrpr.ac.in Outline Bayes Theorem MAP Learners Bayes optimal classifier Naïve Bayes classifier Example text classification Bayesian networks
CS534 Machine Learning - Spring Final Exam
 CS534 Machine Learning - Spring 2013 Final Exam Name: You have 110 minutes. There are 6 questions (8 pages including cover page). If you get stuck on one question, move on to others and come back to the
A Bayesian Approach to Concept Drift
 A Bayesian Approach to Concept Drift Stephen H. Bach Marcus A. Maloof Department of Computer Science Georgetown University Washington, DC 20007, USA {bach, maloof}@cs.georgetown.edu Abstract To cope with
Unified Modeling of User Activities on Social Networking Sites
 Unified Modeling of User Activities on Social Networking Sites Himabindu Lakkaraju IBM Research - India Manyata Embassy Business Park Bangalore, Karnataka - 5645 klakkara@in.ibm.com Angshu Rai IBM Research
Dynamic Data Modeling, Recognition, and Synthesis. Rui Zhao Thesis Defense Advisor: Professor Qiang Ji
 Dynamic Data Modeling, Recognition, and Synthesis Rui Zhao Thesis Defense Advisor: Professor Qiang Ji Contents Introduction Related Work Dynamic Data Modeling & Analysis Temporal localization Insufficient
Introduction to Machine Learning Fall 2017 Note 5. 1 Overview. 2 Metric
 CS 189 Introduction to Machine Learning Fall 2017 Note 5 1 Overview Recall from our previous note that for a fixed input x, our measurement Y is a noisy measurement of the true underlying response f x):
Data Mining Techniques
 Data Mining Techniques CS 6220 - Section 3 - Fall 2016 Lecture 12 Jan-Willem van de Meent (credit: Yijun Zhao, Percy Liang) DIMENSIONALITY REDUCTION Borrowing from: Percy Liang (Stanford) Linear Dimensionality
15-388/688 - Practical Data Science: Decision trees and interpretable models. J. Zico Kolter Carnegie Mellon University Spring 2018
 15-388/688 - Practical Data Science: Decision trees and interpretable models J. Zico Kolter Carnegie Mellon University Spring 2018 1 Outline Decision trees Training (classification) decision trees Interpreting
Gaussian Processes. Le Song. Machine Learning II: Advanced Topics CSE 8803ML, Spring 2012
 Gaussian Processes Le Song Machine Learning II: Advanced Topics CSE 8803ML, Spring 01 Pictorial view of embedding distribution Transform the entire distribution to expected features Feature space Feature
Overlapping Community Detection at Scale: A Nonnegative Matrix Factorization Approach
 Overlapping Community Detection at Scale: A Nonnegative Matrix Factorization Approach Author: Jaewon Yang, Jure Leskovec 1 1 Venue: WSDM 2013 Presenter: Yupeng Gu 1 Stanford University 1 Background Community
Conditional Marginalization for Exponential Random Graph Models
 Conditional Marginalization for Exponential Random Graph Models Tom A.B. Snijders January 21, 2010 To be published, Journal of Mathematical Sociology University of Oxford and University of Groningen; this
An Introduction to Exponential-Family Random Graph Models
 An Introduction to Exponential-Family Random Graph Models Luo Lu Feb.8, 2011 1 / 11 Types of complications in social network Single relationship data A single relationship observed on a set of nodes at
Introduction to Machine Learning
 Introduction to Machine Learning Brown University CSCI 1950-F, Spring 2012 Prof. Erik Sudderth Lecture 20: Expectation Maximization Algorithm EM for Mixture Models Many figures courtesy Kevin Murphy s
Probabilistic modeling. The slides are closely adapted from Subhransu Maji s slides
 Probabilistic modeling The slides are closely adapted from Subhransu Maji s slides Overview So far the models and algorithms you have learned about are relatively disconnected Probabilistic modeling framework
Undirected Graphical Models
 Outline Hong Chang Institute of Computing Technology, Chinese Academy of Sciences Machine Learning Methods (Fall 2012) Outline Outline I 1 Introduction 2 Properties Properties 3 Generative vs. Conditional
DM-Group Meeting. Subhodip Biswas 10/16/2014
 DM-Group Meeting Subhodip Biswas 10/16/2014 Papers to be discussed 1. Crowdsourcing Land Use Maps via Twitter Vanessa Frias-Martinez and Enrique Frias-Martinez in KDD 2014 2. Tracking Climate Change Opinions