Aerofoil profile modification effects for improved performance of a vertical axis wind turbine blade
|
|
|
- Blaise Clarke
- 5 years ago
- Views:
Transcription

1 Aerofoil profile modification effects for improved performance of a vertical axis wind turbine blade by Md. Farhad Ismail B.Sc., Bangladesh University of Engineering and Technology, 2012 Thesis Submitted in Partial Fulfillment of the Requirements for the Degree of Master of Applied Science in the School of Mechatronic Systems Engineering Faculty of Applied Science Md. Farhad Ismail 2014 SIMON FRASER UNIVERSITY Fall 2014
2 Approval Name: Degree: Title: Examining Committee: Md. Farhad Ismail Master of Applied Science Aerofoil profile modification effects for improved performance of a vertical axis wind turbine blade Chair: Dr. Gary Wang Professor Dr. Krishna Vijayaraghavan Senior Supervisor Assistant Professor Dr. Siamak Arzanpour Supervisor Associate Professor Dr. Jason Wang Internal Examiner Assistant Professor Date Defended/Approved: October 16, 2014 ii


3 Partial Copyright Licence iii
4 Abstract Due to the growing need of sustainable energy technologies, wind energy is gaining more popularity day by day. For micro power generation vertical axis wind turbine (VAWT) is preferred due to its simplicity and easy to install characteristics. This study investigates the effects of profile-modification on a NACA0015 aerofoil used in VAWTs. The profile-modifications being investigated consist of a combination of inward semicircular dimple and Gurney flap at the lower surface of the aerofoil. The study also uses a Response Surface Analysis (RSA) based fully automated optimization technique to maximize the average torque produced by the wind turbine blade. The data set used in the RSA optimization is generated using computational fluid dynamics (CFD) simulations. In order to ensure reliability, the model used in the CFD simulations is validated against previous experimental results. The optimized shape of the modified aerofoil is shown to improve in the aerodynamics of the wind turbine blade under both static and dynamic conditions. Keywords: NACA 0015 aerofoil; Vertical axis wind turbine (VAWT); Shape optimization; Response surface analysis (RSA); Dynamic condition. iv
5 Acknowledgements I would like to express my immense gratitude to my supervisor Dr. Krishna Vijayaraghavan for his guidance, careful support, constant encouragement and endless patience during the course of this research. His academic experience, professional attitude and positive personality have always inspired me. His confidence in me is also a great source of motivation during my research work. I would also like to thank Dr. Siamak Arzanpour and Dr. Jason Wang for kindly reviewing my thesis. I would like to extend my gratefulness to Dr. Gary Wang for his time and energy as my session defense chair. I would like to thank Professor Gary Wang as I have learned a lot of things from his optimization course. Over the last two years, I have benefited greatly from the support of my friends. Particularly, I would like to thank Mr. Masum, Mr. Ramin and Mr. Mehdi for their encouragement and support. I express my deepest gratitude to all of my family members who have always encouraged and supported me throughout my academic journey. More specifically, I owe a debt of gratitude to my parents who have sacrificed a lot and put aside their comforts for the sake of my better education. v
6 Table of Contents Approval... ii Partial Copyright Licence... iii Abstract... iv Acknowledgements... v Table of Contents... vi List of Tables... viii List of Figures... ix Nomenclature... xii Chapter 1. Introduction Literature Review Shape of wind turbine blades Aerofoil profile modification Design and Optimization Turbulence Flow modelling Summary Thesis Outline Chapter 2. Numerical model development Average torque CFD Modelling Technique and Governing equations Computational domain and boundary conditions Aerofoil geometry Mesh independency test and model validation Results and discussions Chapter 3. Optimization study Optimization method CFD and optimization Optimization procedure for this study Optimization results Chapter 4. Parametric study: Dynamic condition analysis Problem statement Numerical techniques and method of analysis Validation studies for the dynamic case Performance of NACA 0015 aerofoil under pitching oscillation Performance comparison between the standard NACA 0015 and the optimized aerofoil vi
7 Chapter 5. Conclusions and Future Work References vii
8 List of Tables Table 3.1 Response results of selected experimental data sets Table 3.2 ANOVA results Table 3.3 RSA Result Table 3.4 Optimized Value Table 4.1 Performance comparison between NACA 0015 and optimized aerofoil viii
9 List of Figures Figure 1.1. Figure 1.2. Wind turbine classifications: (a) horizontal axis [4] and (b) vertical axis [5] wind turbine Lift coefficient at different angle of attack for NACA 0012 aerofoil [9] Figure 1.3 Gurney flap on the trailing edge of the aerofoil Figure 1.4 Dimple on the surface of the aerofoil Figure 2.1. Force analysis of a vertical axis wind turbine Figure 2.2. Computational domain (wall function) starts with a distance y from the solid wall [24] Figure 2.3. Computational domain having the aerofoil Figure 2.4. Figure 2.5. Figure 2.6. Computational domain showing the boundary conditions (not in scale) NACA0015 having gurney flap with inward dimple on the lower surface near the trailing edge Complete mesh view- denser mesh at the circular pseudo sub domain near the aerofoil Figure 2.7. Boundary layer mesh near the aerofoil surface Figure 2.8. Simulation validation and mesh independency test Figure 2.9. Variation of lift coefficient at various angles of attack Figure Variation of drag coefficient at various angles of attack Figure Variation of Lift to drag ratio at various angles of attack Figure Streamlines (superimposed with velocity contour) for NACA 0015 at 7 0 angle of attack Figure Streamlines (superimposed with velocity contour) for NACA 0015 having inward dimple at 7 0 angle of attack Figure Streamlines (superimposed with velocity contour) for NACA 0015 having dimples and flaps at 7 0 angle of attack Figure 3.1. Flow chart of the optimization process Figure 3.2. Figure 3.3. Optimization (maximization) history for Genetic algorithm: force coefficient values at different iteration (generation) Optimization (maximization) history for Simulated Annealing algorithm: force coefficient values at different iterations Figure 3.4. Tangential Force Variation at different azimuthal angle Figure 3.5. Variation of lift coefficient at different azimuthal angle ix
10 Figure 3.6. Figure 3.7. Figure 3.8. Figure 4.1. Velocity contour superimposed with flow streamlines for NACA 0015 at various azimuthal angles Velocity contour superimposed with flow streamlines for the optimized aerofoil at various azimuthal angles Flow separation (superimposed with velocity contour) near the trailing edge for the (a) standard NACA 0015 and (b) optimized aerofoil at azimuthal angle, θ = Angle of attack as a function of azimuthal angle at different tip speed ratios Figure 4.2. Simple schematic of the aerofoil pitching motion Figure 4.3. Figure 4.4. Figure 4.5. Figure 4.6. Figure 4.7. Figure 4.8. Figure 4.9. Figure Sinusoidal free stream (inlet) velocity (a) Horizontal and (b) Vertical velocity field Comparison of lift coefficient between previously published experimental study [23], [59] and current numerical simulation at Re c = for oscillating motion: (a) sin (18.67t); (b) 15 0 sin (18.67t) Tangential Force Coefficient at different (a) revolution and (b) azimuthal Angle for the condition sin (18.67t) Tangential Force Coefficient at different (a) revolution and (b) Azimuthal Angle for the condition sin (41.89t) Tangential Force Coefficient at different (a) revolution and (b) azimuthal Angle for the condition sin (18.67t) Tangential Force Coefficient at different (a) revolution and (b) azimuthal Angle for the condition sin (41.89t) Streamlines around the aerofoil surface for the oscillating motion (a)-(e): sin (18.67t) and (f)-(g): sin (41.89t) Velocity contours (single blade) superimposed with the streamlines for for the oscillating motion sin (18.67t) at different angles of attack at Re c = : (a)-(c) NACA 0015 and (d)-(f) optimized aerofoil Figure Tangential force comparison (single blade) between NACA 0015 and optimized aerofoil at Re c = for oscillating motion: sin (18.67t) Figure Tangential force comparison (single blade) between NACA 0015 and optimized aerofoil at Re c = for oscillating motion: sin (18.67t) Figure Velocity contours (m/s) superimposed with the streamlines for the oscillating motion sin (18.67t) at Re c = : (a)-(b) NACA 0015 and (c)-(d) optimized aerofoil (double blade) x
11 Figure Tangential force comparison (double blade) between NACA 0015 and optimized aerofoil at Re c = for oscillating motion: sin (18.67t) Figure Tangential force comparison (single blade) between NACA 0015 and optimized aerofoil at Re c = for oscillating motion: sin (18.67t) Figure Tangential force comparison (double blade) between NACA 0015 and optimized aerofoil at Re c = for oscillating motion: sin (18.67t) xi
12 Nomenclature C C D C L C T f F D F L F T k Re c U U α θ ω Chord length (m) Drag force coefficient Lift force coefficient Tangential force coefficient Pitching frequency (Hz) Drag force (N) Lift force (N) Average tangential force (N) Reduced frequency Chord Reynolds number Wind Velocity (m/s) Free stream wind velocity (m/s) Local angle of attack, AOA (deg.) Azimuthal angle (deg.) Angular speed (rad/s) xii
![Chapter 1. Introduction It is estimated that there approximately 10 million megawatts power are at any one time available in the earth's atmosphere because of wind energy [1].](/docs-images/81/82862903/images/13-0.jpg "Energy extraction from wind energy is rapidly competitive to power production from other sources like coal [1]. Currently 0.")
13 Chapter 1. Introduction It is estimated that there approximately 10 million megawatts power are at any one time available in the earth's atmosphere because of wind energy [1]. Energy extraction from wind energy is rapidly competitive to power production from other sources like coal [1]. Currently 0.55% of the world electricity generation is produced by wind energy [1] and better wind turbine design can aid in the increased adoption of wind power. Wind turbines convert kinetic wind energy to electricity with the aid of a generator. Wind turbines are classified into horizontal axis wind turbine (HAWT) and the vertical axis wind turbine (VAWT) based on their axis of rotation (Figure 1.1). In the case of HAWTs, blades rotate around the axis which is parallel to the flow while VAWT rotates around the axis which is perpendicular to the flow direction. HAWT are better suited for large scale energy generation while VAWT are omni-directional and better suited for small-scale micro power generation [2]. VAWTs are quiet and easy to install as well as easy to manufacture, and can take wind from any direction [3]. (a) 1
![(b) Figure 1.1. Wind turbine classifications: (a) horizontal axis [4] and (b) vertical axis [5] wind turbine.](/docs-images/81/82862903/images/14-0.jpg "Due to the continuous rise of energy demand and limited amount of conventional energy sources, now-a-days focus has been given to extract more energy from environmentally friendly alternative energy")
14 (b) Figure 1.1. Wind turbine classifications: (a) horizontal axis [4] and (b) vertical axis [5] wind turbine. Due to the continuous rise of energy demand and limited amount of conventional energy sources, now-a-days focus has been given to extract more energy from environmentally friendly alternative energy sources, such as wind. For simple design and low installation cost VAWTs are gaining more popularity [3]. In the areas where wind flow patterns are very irregular and flow direction changes quickly in a frequent matter i.e. lower elevation or urban areas, VAWTs are better suited for installation. Thus the motivation of the present study is to maximize the performance of a VAWT blade for micro power generation. VAWTs are sub-classified into Darrieus rotor and Savonius rotor wind turbines [3]. Darrieus rotor wind turbines make use of the lift produced by the blades while Savonius rotor turbines produce power due to the drag created by the blades. In this study the focus has been given to improve the performance of Darrieus VAWTs. As VAWTs rotate about an axis perpendicular to the flow, the angle of attack (orientation of the blade relative to the wind flow) is not constant and the blades oscillate relative to the wind-direction. Hence the average torque should be used as the metric while comparing the performance of VAWTs. The calculation of this average torque is discussed in section 2.1. One of the most commonly used methods in VAWT research is the classical 2
15 Blade Element Momentum theory (BEM) introduced by Glauert (1926). The theory is basically based on the calculation of flow velocity through the VAWT by equating the upstream and downstream pressures on the blades with the rate of change of momentum of the fluid. The flow is assumed to be steady and incompressible Literature Review The efficiency of wind turbines is primarily dependent on the design of the profile of the turbine blade. Thus, aerofoil design, modification and performance optimization for wind turbine application are the active fields of research. To increase the performance of the available turbine blades, one approach is to apply active or passive flow control features on the aerofoil surface. Passive flow control techniques include installing vortex generators and gurney flaps (refer to section 1.1.2) to the trailing edge of blades [4, 5]. These types of flow control techniques or modifications provide increased lift coefficient which ultimately increases the tangential force. Due to fluid-structure interaction, laminar to turbulent transition of the boundary layer can occur nearly to the leading edge. To avoid the premature transition, aerofoils can be equipped with a blunt trailing edge [8]. Due to the complexity of the unsteady flow conditions of the VAWT blades, Computational Fluid Dynamics (CFD) becomes a popular way to analyze the aerodynamic performance. CFD technique was applied by various researchers to calculate the turbulent flow separation and wake generation around the VAWT blades. In CFD models, a physical flow field can be represented by applying the conservation of mass, momentum and energy equations (for compressible flows). The flow field is then divided (discretized) into specific number of cells which are called grids. Then the equations are solved at discrete grid points at each time step by applying various discretization schemes. By solving the governing equations at these discrete grid points, the flow field can be obtained around the VAWT blades. The solution can be used to obtain the values of specific interest (e.g. lift, drag, power, moment etc.) which is called post processing. VAWT blades normally use standard aerodynamic shaped wings (aerofoil) developed by the National Advisory Committee for Aeronautics (NACA). Figure 1.2 shows a typical performance of NACA 0012 aerofoil [9]. Angle of attack is the angle between the aerofoil and the wind direction. Beyond a certain AOA (i.e in the figure), 3
, during downstroke the aerofoil goes through the wake generated on its upstroke.")
16 the lift decreases. This condition is called the stall condition. When the aerofoil operates dynamically (for instance the case of VAWT blade), during downstroke the aerofoil goes through the wake generated on its upstroke. For this reason, stall conditions for steady state static conditions and dynamic conditions are different (refer to Chapter 4). Figure 1.2. Lift coefficient at different angle of attack for NACA 0012 aerofoil [9]. Sheldahl et al. [9] reported experimental investigations of the aerodynamic characteristics of NACA 0012, NACA 0015, NACA 0018 and NACA 0021 aerofoils for use in VAWT. Guerri [10] et al. numerically investigated the aerodynamic performance of a small VAWT blade [11]. The results showed that CFD methods gave a good prediction of VAWT blades aerodynamic performance. Ferreira et al. [12], [13] simulated the dynamic stall of VAWT blades by CFD techniques and used different types of turbulent models [11] to validate their experimental results i.e. Reynolds-averaged Navier Stokes (RANS) simulation, Large eddy simulation (LES) and Detached eddy simulation (DES) [14]. As RANS turbulence models need less computational resources and time, these models are very much popular for predicting the flow turbulence around the VAWT blades. RANS turbulence models can be classified into three parts [11] : Linear eddy viscosity models, Nonlinear eddy viscosity models and Reynolds stress model (RSM). Among them, linear eddy viscosity models are most commonly used for wind turbine research. Linear eddy viscosity models can again be divided into different parts: 4
17 Algebraic models, one-equation model and two equation model. But two most popular models are the One equation (e.g. Spalart-Allmaras model) and Two equations models (e.g. k-ε models, k-ω models). These models [11], [14] are modified for specific applications based on the low and high Reynolds number applications (refer to 2.1). For low Reynolds number applications (specifically for VAWT blade simulation) Spalart- Allmaras model, RNG k-ε model, Realizable k ε, Wilcox's k-ω model and SST k-ω models are commonly used [2], [3], [10], [12], [13], [15] [20]. Hamada et al. [21] applied RNG k-ε turbulence model to analyze the performance of VAWT blades. The results showed that the torque reached the minimum value at an azimuthal angle of 13 degree and the maximum value at 90 degree. Wang et al. [22] applied standard k-ω and SST k- ω models [11], [14] and tried to validate the results of Lee et al. [23] for wind turbine applications under deep dynamic stall conditions (refer to Chapter 4). The aerodynamic performance of wind turbine aerofoil under dynamic flow condition has been investigated by Gharali et al. [16] and Ahmadi et al. [15]. From their study it is seen that the tangential force value is much higher for the dynamic cases than that of the static case. Gharali et al. [16] have used SST k-ω and Realizable k ε turbulence models. But no researchers have found a proper turbulence model to predict the VAWT blade performance accurately. Thus VAWT blade simulations for low Reynolds number applications are still an active area of research. Finite element based package COMSOL Multiphysics [24] has provided another turbulence model termed as Revised k-ω turbulence model which is actually the modified version of the Standard k-ω turbulence model [14]. This model has not yet been tested for VAWT blade simulation under dynamic conditions. Thus, in this study this turbulence model is used to validate the experimental results for pitching oscillation cases (refer to Chapter 4). After getting reasonable accuracy to predict the flow parameters under light dynamic stall cases, further simulation has been carried out to analyze the performances of VAWT blades Shape of wind turbine blades VAWT blade shape is very essential to extract the maximum possible amount of energy from the wind. Cross sections of Darrieus VAWT blades normally use standard aerodynamic shaped wings (aerofoil) developed by the National Advisory Committee for Aeronautics (NACA). These aerofoils are developed specifically for high velocity flow 5
18 conditions applicable for aircrafts. These types of aerofoils have larger value of lift-todrag ratio, which is a key parameter for keeping the aircraft engine with minimum fuel consumption. But the lift-to-drag ratio has less meaning on VAWT blades (refer to section 2.1). Moreover, aircraft aerofoil experiences almost constant angle of attack. For the case of a VAWT blade the angle of attack changes frequently in a cyclic manner for which the direction of the forces acting on the aerofoil changes significantly (refer to section 4.1). All of these aerofoils face stall conditions after a certain value of angle of attack (AOA). In aerofoil aerodynamics, stall condition is the reduction in the lift force generated by the aerofoil as further increase of the angle of attacks. This happens when the critical AOA of the aerofoil is exceeded. This point is normally larger for the unsteady dynamic condition than the steady state static conditions [23]. For this reasons NACA aerofoils should be checked whether they are suited to use on VAWT blades. Various researchers have tested various shaped aerofoil for VAWT applications and among them NACA 0012 and NACA 0015 are most commonly used for this specific application [2], [22]. In the present study some modifications are made to the standard NACA 0015 aerofoil in hopes to increase the wind turbine performance Aerofoil profile modification Researchers working on aerofoil for non-vawt application have proposed two profile modifications that have been independently shown to enhance aerofoil aerodynamics. The first modification is a vertical flap known as Gurney flap (Figure 1.3). Gurney flap (GF) is named after the race car driver Dan Gurney [25]. He first used this type of modification to increase the downward force which ultimately increases the speed of the car significantly. GF is simply a short flat plate attached to the pressure side trailing edge of the aerofoil. Gurney flaps have been experimentally shown to improve the lift coefficient of the aerofoil [26]. Gurney flap of height 1.25% of chord length (C) increases the lift with only a small increase in drag coefficient [26]. The drag coefficient is known to rise rapidly for flap sizes larger than 2%-C. This phenomenon is explained in studies on NACA 0012 [27], NACA 0011 [28] and LA 203A [29] aerofoils which note that the Gurney flap increases the suction of the aerofoil upper surface and pressure on the lower surface which in turn result in increased lift. Similar trends in lift and drag coefficients have been observed in other aerofoil such as race car wings [30], [31]. 6
19 Gurney flap having different configurations has been investigated to improve the aerodynamics of aerofoil. Saw-toothed GF [7], [23], [27], [32] [34], [35], and/or perforated GF [36] can be the modifications which in turn improves the performance of aerofoil. Such configurations moved the separation point forward over the suction surface of the aerofoil with increasing the lift to drag ratio as compared to a regular GF of same shape. Wang et al. [33], [37] introduced a combination of the Gurney flap with trailing edge flap which increase the lift coupled with a decrease in lift-to-drag performance [38]. To understand the mechanism of such passive flow control techniques various experimental studies [28], [39] [41] have also been performed by many researchers. From these studies it has been seen that due to the presence of GF, a pair of counter-rotating vortices arise at downstream of the trailing edge which in turn decrease the adverse pressure gradient [25], [26], [33], [37]. Thus the flow separation delays over the suction or upper surface of the aerofoil. The vortices also increase the velocity of the fluid on the upper surface, which in turn increase the lift. Figure 1.3 Gurney flap on the trailing edge of the aerofoil. Dimples on the surface of the aerofoil, the second modification, can act as a vortex generator to improve the lift coefficient of aerofoil [42]. These dimples increase flow turbulence and reduce the wake and thereby reducing the drag coefficient. They help increase the overall lift at a higher angle of attack. From the literature review study it is seen that though some research works has been carried out using the outward dimple for improving the aerofoil performance [42] but to the best of author s knowledge no research work has been done using the inward dimple on the aerofoil surfaces. This has been shown to delay the angle of the stall. 7
20 Figure 1.4 Dimple on the surface of the aerofoil Design and Optimization Aerofoil aerodynamics can be classified as two groups: the design and the analysis problems. Analysis problems may also refer to as direct problems; the flow field details can be obtained when the aerofoil geometry is specified. For the design based problems which also may refer to as inverse problems, the aerofoil geometry can be generated by fixing the flow fields features, such as the pressure or velocity distributions on the aerofoil surfaces. The design approach occasionally yields impractical aerofoil geometry [41]. On the other hand, the analysis of the flows around specific aerofoil profile can always arrive at a meaningful result. Numerical optimization using gradientbased methods (GBMs) has been used in conjunction with flow analysis to design aerofoil profile [43]. However GBMs have some drawbacks [44]. The optimal point search often leads to a local minimum and the efficiency of the GBM based optimization process depends on the method adopted to compute the gradient of objective and constraint functions. Additionally gradient based evaluation sometimes becomes highly sensitive due to the presence of noises or existence of many local minima s in the objective/constraint functions. Fluid flow analysis can also be applied with response surface methods (RSM). Details on RSM can be found in [45]. RSM-based optimization shows a good number of advantages [44], [46]. RSM consists of generation of objective function by numerical simulations or experiments and the construction of a reliable response surface model through a regression analysis. The response surface is then optimized. The response surface is often assumed to be a second-order polynomial function which can smooth out the high-frequency noise of the original objective function and is expected to 8
21 approximate a solution near the global optimum [47]. This ultimately reduces computational time and cost. Due to these advantages, RSM based optimization has been widely applied to single- and multi-objective optimization problems [19], [20], [45], [47] [51] Turbulence Flow modelling The cyclic variation of the angle of attack of a vertical axis wind turbine blade is very similar to the flow around a pitching aerofoil. Flow behaviour around a pitching aerofoil has been investigated previously by various researchers for aviation applications such as McAlister et al. [52], McCroskey et al. [53], Piziali [54] and more recently Tsang et al. [55]. In fluid mechanics the Reynolds number can be defined as the ratio of the inertia and the viscous force. After a certain value of Reynolds number (i.e. Re >10 5 ) the flow becomes too unstable and non-uniform which can be defined as turbulent flow condition. Reynolds number value upto 10 6 can be defined as low Reynolds number turbulent flow where the viscous force has significant effects on the flow conditions. Sections 2.1 and 4.2 will give detail description of the turbulent flow cases. Following the experimental work on pitching aerofoils, a wide range of turbulence models were applied. Though the obtained numerical results could not capture the flow behaviour accurately but satisfactory results were obtained using the Shear Stress Transport (SST) k ω model of Menter [56], [57]. In this study, the revised k ω turbulence model [24], [58] has been considered for the unsteady light dynamic stall conditions for VAWT blade applications. This model has been considered to model the flow turbulence for the oscillating dynamic condition for the following reasons: Under dynamic conditions, the stall is delayed in comparison to the static conditions. In experimental studies, deep dynamic stall is observed to occur at a higher angle 20 0 compared to static stall which is observed at angle of attack 12 0 [35]. Under dynamic conditions, almost attached flow has been observed even at an angle of attack of The oscillating motion occurred at an angle of attack larger than the static stall and smaller than the dynamic stall cases is known as the light dynamic stall cases [59]. It is noted in previous literature that the flow parameters are too much sensitive to the oscillating frequency values for dynamic stall conditions [15], [22], [23], [60]. 9
22 Turbulence modeling under dynamic and pitching oscillation condition is still an active area of research and no current turbulence model can accurately captures the flow behaviour of an aerofoil under dynamic oscillation conditions [15], [22], [23], [60]. Thus, turbulence models specifically applicable for low Reynolds number cases i.e. RNG k-ε, Standard k- ω or SST k-ω, does not result in higher accuracy [15], [22], [23], [60]. Moreover, all of these models are too much sensitive to the input parameters [15], [22], [23], [60]. Recently, the standard k- ω turbulence model has been improved [24], [58] and is developed for low Reynolds number and specifically for light dynamic stall applications but has not been yet validated against the experimental results of pitching oscillation cases. Initial simulations (refer to Chapter 2 and Chapter 4) also revealed SST k-ω to require a huge amount of computation time than the revised k-ω models. It is because revised k ω turbulence model uses wall function which is computationally more efficient than the SST k ω model. Detail description of the turbulence models can be found in the Section 2.2 and Section Summary This study aims to provide a systematic approach to optimizing the blades used in VAWT by studying a NACA 0015 VAWT blade with both inward dimples and a Gurney flaps at the pressure side (lower) surface of the blade near the trailing edge. As the angle of attack of the blades in a VAWT changes continuously even when the windspeed and rotation speed remains constant (refer to Chapter 3), the study aims to maximize the effective torque rather than to maximize the lift coefficient at a single angle of attack. From the literature review study, it is found that most of the previous works used standard NACA aerofoils [2], [9], [10], [12], [13], [15], [17], [19], [21], [34], [60] [63], [64] to investigate the performance of a VAWT blade. In this study, some modifications of the regular NACA aerofoil have been tested and the performance of the modified aerofoils has been compared with the base NACA aerofoil (refer to Chapter 2). It is also found that the value of the forces exerted from the VAWT blades are very much sensitive to the dynamic oscillating conditions [23], [59] e.g. the values of the forces change significantly with the angular velocity, turbulent intensity, wind velocity, oscillating 10
23 amplitude etc. For this reason, the optimization study has been carried out under steady state static conditions (refer to Chapter 3) and then the optimized aerofoil has been tested under different dynamic oscillating conditions (refer to Chapter 4). Moreover, most of the previous VAWT optimization research used lift forces or lift to drag ratios as an objective (cost) function to maximize the aerodynamic performance [19], [20], [34]. The study will use a Response Surface Analysis (RSA) based optimization technique which involves evaluating the objective function (in this case calculating the average torque) at discrete points in the parameter space to generate a response surface. The optimal distribution of the evaluation points can be achieved using design of experiment (DOE) analysis [45], [47]. To ensure reliability, the CFD models used in this study are validated against the corresponding experimental results published in the literature. To the best of the author knowledge, the present study is the first attempt to investigate the simultaneous effects of Gurney flap and dimple configuration as well as to apply RSA based optimization method to maximize the aerodynamic performance of VAWT blade. Thus, the main objectives of this research can be summarized as: (a) To introduce new surface modification features i.e. Gurney flap and inward dimple at the trailing edge of the aerofoil. (b) To compare and improve the performance of VAWT blades with respect to the standard NACA 0015 aerofoil. (c) To find an optimized arrangement of this modification for maximum power generation under steady state condition. (d) To test (validate) the revised k ω turbulence model whether it can be applicable for VAWT applications under light dynamic stalls (refer to Chapter 4). 11
24 (e) To analyze the performance of the obtained optimized aerofoil profile under unsteady dynamic condition for single and double bladed wind turbine applications Thesis Outline Chapter 1 includes an introduction including a literature review study on wind turbines and related optimization research. The computational procedure and validation study are presented in Chapter 2. Results of the initial study of the surface modifications are also presented in this chapter. Chapter 3 describes the optimization study to maximize the wind turbine output power under steady state condition. Performance of the optimized aerofoil (single and double bladed case) under dynamic oscillating pitching condition is presented in Chapter 4. Conclusions and recommendations regarding future work are included in Chapter 5. 12
25 Chapter 2. Numerical model development This chapter describes the CFD modelling and validation approach employed in the optimization process. Many turbulence models are available for predicting the flow parameters at both low and high ( 10 6 ) Reynolds number flow. After completing the literature review study, it can be determined that a two-dimensional Reynolds-Averaged Navier-Stokes equations (RANS) based turbulent flow equations (refer to section 2.2) is the most promising approach to determine the performance of a VAWT blade under both steady-state and dynamic condition [2], [16], [22]. Detail documentation on turbulence modeling can be found in [11] and [24]. In a two-dimensional analysis, numerical modelling domain limits to a single cross-section of the VAWT blade which in turn minimizes the computational expense. Previous VAWT blade analyses have employed a similar approach in general. However, those are limited to validate the experimental results and to select the appropriate blade profile (aerofoil) [2], [12], [15] [17], [61], [63], [64]. Initially the profile modification effects and the optimization process (refer to Chapter 3) consist of the steady state simulations. Then, the model has been expanded to incorporate the effects of oscillating frequency and amplitude under dynamic condition Average torque Figure 2.1 shows the aerodynamic forces acted on a wind turbine aerofoil. The orientation of the blades relative to the true wind direction is known as the azimuthal angle (θ). As the VAWT rotates, the orientation of the blades relative to the true wind direction (azimuthal angle, θ), changes from 0 to As a result, the chordal/tangential velocity (V c ) and normal velocity (V n ) can be written as following [3] in terms of wind velocity (U) : 13
26 V c = U(λ + cos θ) (2.1) V n = U sin θ (2.2) Where, λ = ωω U is the tip speed ratio. In the absence of flow restrictors, the induced velocity can be assumed equal to the free-stream velocity, i.e. U = U. The effective wind velocity (W) and the angle of attack (α) are given as: W = V c 2 + V n 2 (2.3) α = ttt 1 V n V c (2.4) For aerofoils, the lift coefficients (C L ) and drag coefficients (C D ) are defined relative to the wind direction. The lift coefficients (C L ) and drag coefficients (C D ) represent the normalized lift and drag force respectively. Hence we define tangential force coefficient C T to represent the normalized tangential force as C T = C L sss α C D ccc α (2.5) and the tangential force per unit width is given by (2.6) F T = 1 2 C TρρW 2 Where, ρ is the density of air c is the chordal length This yields an average tangential force, 14
27 F T,aaa = 1 2π 0 2π F T(θ)dd (2.7) The chord Reynolds number can be defined as the following where µ is the viscosity; ρ is the density of the fluid. RR = ρu c µ (2.8) From this analysis, it is clear that tangential force is the main key parameter for the power produced by the vertical wind turbine blade. In this study, the average tangential force will be calculated using the above mentioned numerical integration technique. Figure 2.1. Force analysis of a vertical axis wind turbine CFD Modelling Technique and Governing equations In this study, all the CFD simulation has been performed using the finite element based commercially available software COMSOL Multiphysics [24]. CFD simulations are performed to obtain a better understanding of the velocity and pressure field experienced by the VAWT blade. CFD simulation includes using numerical techniques to solve the flow fields applying different boundary conditions. For the isothermal, incompressible flow field, the Navier-Stokes consists of the equations for 15
28 conservation of momentum and conservation of mass (continuity) [11]. Several models exist [65] to model the Reynolds stresses by predicting the turbulent eddy viscosity term to solve the Navier-Stokes equations for turbulent flow condition. Zero equation models calculate the turbulent eddy viscosity from flow variables i.e. the boundary layer velocity profile. These models do not include convection and diffusion of turbulent energy. This turbulence model is often used for simple flow geometries. A one-equation turbulence model is an improvement on the zero-equation model which solves a turbulent transport equation with a series of model constants to be tuned for the specific flow conditions. The Spalart-Allmaras model [66] is a one-equation model which works well on aerofoils because of its capability to predict the flow separation. The most commonly used models are two-equation models that include the k-ε [67], revised k-ω [57] and Shear-Stress Transport (SST) model [58]. The k-ε model can predict the turbulence flow field well in free-shear flows, but its predictions of eddy viscosity terms in boundary layer flows and near wall regions are less satisfactory [11], [24]. The k-ω turbulence model can predict the boundary layer flows well at adverse pressure gradient, but it is over sensitive in the highly separated flows. In order to overcome this limitation, a hybrid blend of the k-ε and k-ω models, known as the SST model was developed in literature. The model uses a blending function to switch from the k-ε to the k-ω model when it approaches a near-wall region. As SST model does not use any wall function, this model is computationally expensive than the standard and revised k-ω turbulence model (refer to Chapter 4). Wall-function simulations normally predict the mesh cells at a certain distance from the solid wall (Figure 2.2). Normally the value of y plus starts at about a distance of or larger depending on the Reynolds number [11], [24]. 16
29 Figure 2.2. Computational domain (wall function) starts with a distance y from the solid wall [24]. The Navier-stokes equations can be expressed as follow [24]: Continuity equation: + (ρρ) = 0 Momentum equation: ρ + ρ (u. )u =. [ pi + τ] Where, ρ is the density of the fluid, u is the velocity vector, p is pressure, τ is the viscous stress tensor. The above equations can be solved for specific boundary and initial conditions. For the turbulent flow conditions, the flow parameters fluctuate too much and so to obtain the 17
30 mean flow parameters an ensemble of solutions is averaged. This process is known as the Direct Numerical Simulations (DNS) [14]. But obtaining the solutions and ensemble averaging them is computationally very expensive i.e. it needs high computational resources and time. Thus it is more popular to average the equations rather than the solutions. Then for the present simulation the equations for the SST k-ω turbulence model are as follows [11], [24]- Continuity equation: ρ. U = 0 (2.9) Reynolds averaged Navier-Stokes (RANS) equation: ρ U. U +. ρ u u = p I +. µ ( U + ( U) T ) (2.10) Transport equations for k-ω model: ρ + ρ u. k = P ρβ 0 k ω + (μ + σ k μ T ) k (2.11) ρ ρρ + ρ u. ω = P ρρ ω 2 + (μ + σ μ ω μ T ) ω + 2 (1 F 1 ) ρσ ω2 T ω ω. k (2.12) Where, P= min (P k, 10 β 0 k ω) And P k = µ T ( u ( u + ( u) T ) 2 3 ( u) 2 ) 2 3 ρ k. u The turbulent eddy viscosity is given by, μ T = ρa 1 k max(a 1 ω, SF 2 ) Here, S is the magnitude of the strain-rate tensor, 18
31 S = 2 S ii S ii Each of the constants is a blend of the corresponding constants of the k-ε and the k-ω model. = F (1 F 1 ) 2 (2.13) The interpolation functions F 1 and F 2 are defined as, F 1 = tanh(θ 1 4 ) θ 1 = min max k 500 μ, β 0 ω l w ρρl2, 4 ρ σ ω 2 k w CC kk l2 w CC kk = max( 2 ρ σ ω 2 ω ω. k, ) and, F 2 = tanh(θ 2 2 ) θ 2 = max( 2 k 500 μ, β 0 ω l w ρ ω l2 ) w Where, l w is the distance to the closest wall. Realizability Constraints are applied to the SST model. From the literature review study the model constants has been obtained by [2], [14], [24], β 1 = 0.075, γ 1 = 5/9, σ k1 = 0.85, σ ω1 = 0.5 β 2 = , γ 2 = 0.44, σ k2 = 1, σ ω2 = β 0 = 0.09, a 1 =
32 2.3. Computational domain and boundary conditions A sufficiently long domain (20 chord length) is chosen to avoid the effects of the outlet condition and resolve the flow behaviour accurately. The aerofoil having a chord length, c= 0.4 m chord is located near the center of the domain. To improve the computational efficiency, it is desirable to utilize a circular mesh domain adjacent to the aerofoil surface where the mesh is very fine than away from the aerofoil surface. Hence, two circular sub-domains are defined centered about the aerofoil for this study. The boundary conditions for the two dimensional steady state incompressible fluid flow is similar to the one used by McLaren et al. [2]. Figure 2.1 and Figure 2.4 show the complete flow domain and the boundary conditions respectively. From these figures, it is seen that the downstream length is greater than the upstream length to resolve the turbulence flow parameters well. Triangular meshing is used for the analysis away from the aerofoil surface and the boundary layer mesh is used on the aerofoil surface to predict the flow parameters well. Detail mesh view is shown in the section 2.5. Figure 2.3. Computational domain having the aerofoil. Figure 2.4. Computational domain showing the boundary conditions (not in scale). 20
33 The inlet is defined as a velocity inlet while the outlet is set as pressure outlet. The outlet pressure is set 1 atm. No slip wall condition is assumed near the aerofoil surface as well as the upper and lower wall of the domain Aerofoil geometry In this study, NACA 0015 aerofoil has been used and further modification has been employed for wind turbine performance improvement. The NACA0015 aerofoil having both an inward dimple and a Gurney flap at the lower surface is shown in the Figure 2.5. The aerofoil is analyzed at eleven different angles of attack (ranging from 0 0 to 22 0 ). The free stream velocity is fixed at m/s and the corresponding chordal Reynolds number (Re c ) is For the initial check and comparison with the standard NACA 0015 aerofoil, Gurney flap height (h) of 1% and the dimple radius (r) of 0.5% of the chord have been taken for the modified one. Figure 2.5. NACA0015 having gurney flap with inward dimple on the lower surface near the trailing edge Mesh independency test and model validation The mesh employed on the flow domain is generated based on a series of mesh independence tests. The boundary layer mesh is governed by the following parameter values: the boundary layer consists of 40 layers with a spreading rate of 1.1. The distance of the first layer from the wall has been taken as the order of 10-5 c [2]. The CFD simulation is validated against previously published experiments for NACA 0015 in Sheldahl et al. [9]. The comparison of lift coefficient in Figure 2.8 shows that the CFD results are within ±5-7% of the experimental results. The error percentage increases with 21


34 the angle of attack. This may be attributed to unsteady flow behaviour and boundary layer separation at a higher angle of attack. In this simulation, flow is assumed to be fully turbulent whereas the experimental flow-field is not fully turbulent. To establish mesh independence, the simulations were performed at different mesh counts. From Figure 2.8, it is also seen that a mesh count of approximately 200,000 is sufficient enough to obtain reliable results. Figure 2.6. Complete mesh view- denser mesh at the circular pseudo sub domain near the aerofoil. Figure 2.7. Boundary layer mesh near the aerofoil surface. 22
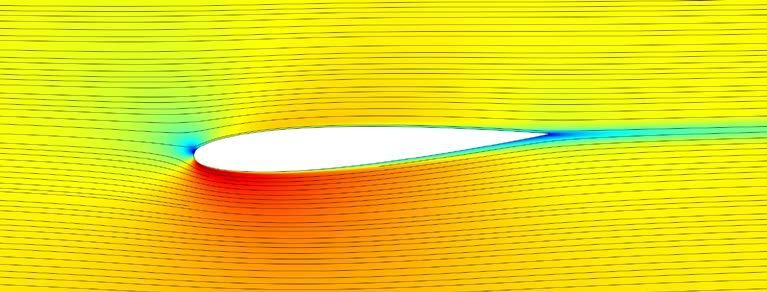
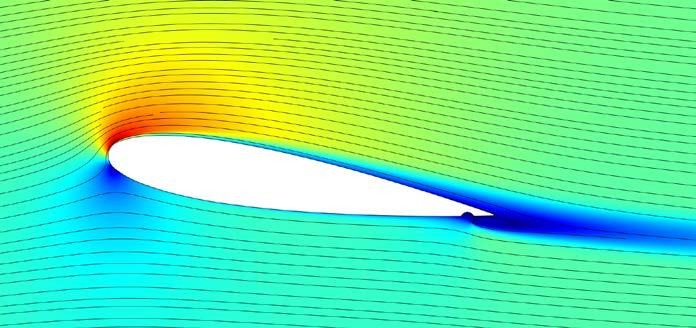
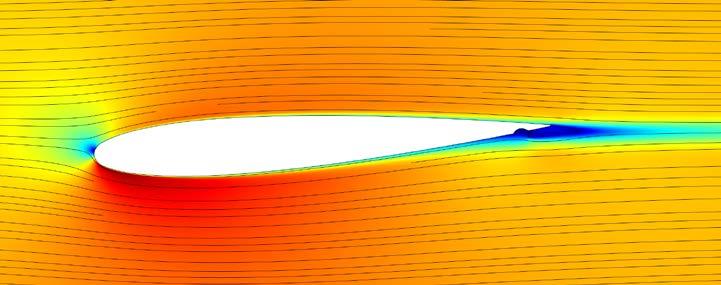
35 Lift Co-efficient, C L Angle of Attack (degree) Previously Published Experimental Study Mesh Element Mesh Element Mesh Element Mesh element Figure 2.8. Simulation validation and mesh independency test Results and discussions Dimples and flaps are employed to create turbulence that results in delayed of boundary layer separation. Thus, the stall condition is delayed which in turn increase the tangential force values. Figure 2.9 shows that aerofoil with a combination of dimple and flap has larger lift coefficients than aerofoil with only dimples. Aerofoil with only dimple in turn has larger lift coefficients than the regular NACA 0015 aerofoil. From Figure 2.10 it is seen that aerofoil having dimple and flap shows higher drag coefficient value than the other aerofoil. Figure 2.11 shows that the value of lift to drag ratio increases with increase of angle of attack up to an angle of 7 0. For the case of modified aerofoil having dimples and flaps, turbulence generation is higher than the other aerofoils due to greater flow separation and recirculation (Figure 2.14). Figure 2.12 to Figure 2.14 show the stream lines superimposed with velocity contour the at angle of attack 7 0. From the figures it is shown that due to dimples and flap, larger flow recirculation (larger blue region) are generated near the pressure side trailing edge which is the reason of higher lift to drag ratio value than the regular (standard) NACA 0015 aerofoil. 23
36 Lift Co-efficient, C L Inward Dimple NACA0015 Dimple and Gurney Flap Angle of Attack (degree) Figure 2.9. Variation of lift coefficient at various angles of attack. Drag Co-efficient, C D NACA 0015 with inward dimple NACA 0015 NACA 0015 with inward dimple and flap Angel of Attack (degree) Figure Variation of drag coefficient at various angles of attack. 24
 Figure 2.11. Variation of Lift to drag ratio at various angles of attack.")
 for NACA 0015 having inward dimple at 7 0 angle of")
37 Lift to Drag Ratio, C L /C D Inward Dimple NACA0015 Dimple and Gurney Flap Angle of Attack (degree) Figure Variation of Lift to drag ratio at various angles of attack. Figure Streamlines (superimposed with velocity contour) for NACA 0015 at 7 0 angle of attack. Figure Streamlines (superimposed with velocity contour) for NACA 0015 having inward dimple at 7 0 angle of attack. 25
 for NACA 0015")
38 Figure Streamlines (superimposed with velocity contour) for NACA 0015 having dimples and flaps at 7 0 angle of attack. 26
39 Chapter 3. Optimization study Chapter 2 describes the aerofoil modification effects on the performance of the wind turbine blade. In order to maximize the average torque of the wind turbine blade it is necessary to find an optimized configuration of flap height and dimple radius configuration. The technique of searching for the minimum or maximum value of a given function (which can be called cost/objective function) with varying the dependant parameters or values of that function, incorporating any constraints is called optimization [68]. The goal of the optimization algorithm is to find the true or global minimum or maximum of that objective function efficiently. While solving such types of problems, the objective function may be complex, nonlinear and/or non-differentiable function having too many parameters and design constraints. Typical optimization problems may have infinite number of solutions. Optimization is actually concerned with selecting the best and feasible sets of solution among the entire sets Optimization method Most real-life optimization problems may have several sets of solutions. Several general approaches to optimization are available as follows: Analytical methods, Graphical methods, Experimental methods, Numerical methods etc. [68]. Analytical method is based on the classical technique of differential calculus. This method cannot be applied to highly nonlinear problems. The graphical method may be used to find the optimized value of the function if the number of variables and constraints do not exceed a few. The optimum value of a function can be achieved by direct experimentation. In this method, the function is set up and adjusted one by one and the performance criterion is measured in each case. This method may lead to optimum or near optimum operating conditions. Moreover, the reliability of this method should be checked. In the 27
40 numerical based approach, various search algorithms are employed to generate a series of solutions iteratively starting with an initial estimate for the solution. The process will continue until the convergence criterion is satisfied. Numerical methods can be used to solve highly nonlinear optimization problems which cannot be solved analytically CFD and optimization In computational fluid dynamics (CFD), numerical methods are applied to solve the fluid flow equations (i.e. Navier-Stokes equations) with appropriate boundary conditions. The problem may be assumed as steady state or transient condition. In this study, the optimization procedure is carried out with the combination of design of experimentation (DOE) and numerical search approach. The DOE values have been obtained from the CFD analysis. As direct aerodynamic optimizations suffer from high computational costs, DOE based optimization can be a good alternative if the response surface has been constructed properly. Objective function evaluation in many engineering problems is costly which makes the optimization task expensive. A popular approach for aerodynamic optimization is to construct, from a selected number of design points, a surrogate of the objective function, to be applied for subsequent optimization. Kim et al. [69] performed such type of optimization technique applied to a twodimensional channel having periodic ribs Optimization procedure for this study Having established the enhancement of aerofoil due to the presence of dimple and Gurney flap, this section introduces an optimization procedure in order to maximize the average tangential torque. The optimization procedure is based on Response Surface Approximation (RSA) technique as this takes less computational time. The reliability and applicability of RSM based optimization techniques applied at different fluid flow optimization problems were discussed in many previously published articles [19], [20], [34], [44], [46], [48] [51], [69]. 28
41 In this study, the tangential force is used as the objective function at a fixed tip speed ratio, λ=3.5 for Re c = Previous research work also suggests that the maximum performance of the VAWT blade can be achieved at a tip speed ratio of 3.5 [64]. Further studies can be performed in the future to optimize the performance at different tip speed ratios. To create a response surface, the optimization code takes 16 selected design points (Table 3.1) using the central composite design (CCD) proposed in Myers et al. [45], [70]. The flow chart shows these various steps involved in the optimization process. After constructing the response surface model, a global optimization method, Genetic algorithm (GA) [20], [49], [68], [71], [72] is used to find the optimum value of the problem. A second order polynomial is used to obtain a full quadratic model. The coefficient of determinant (R 2 ) for the RSA model is 0.93 which indicates the reliability of the approximation model. The values obtained from the response surface model have also been checked with the CFD simulation results and the values are varied approximately within ±10%. Thus, the response surface model is deemed highly reliable and can be used for further analysis of the optimization problem. As the design variable is small (less than four), the RSA algorithm has been developed in such a way that it can take any of the following types of response surface design for the quadratic model [45]: Central composite design (CCD) and Box-Behnken design (BBD). CCD design can also be classified as three types: circumscribed (CCC), inscribed (CCI) and faced (CCF) [70]. After obtaining the response at different data sets, the objective or cost function is then created. As in literature [19], [20], [34], [44] [51] the response surface is approximated using a quadratic approximation and written as n n 2 n y = a 0 + i=1 a i x i + i=1 a ii x i + i<j a ii x i x j + ε (3.1) Where, x i, x j are the independent design variables y is the response surface function a o is the constant parameter 29
42 a i is the parameter that gives the linear effect of x i a ii is the parameter that gives the quadratic effect of x i a ij is the parameter that gives the interaction between x i and x j ε is the fitting error. 30
 Construct the surrogate model using C T (i) and the arrays of design variables k=k+1 Y i NNNN N Is the coefficient of determinant (R 2 ) sufficiently")
43 Start Predetermine the design of experiment data sets (Nexp) and determine the values of design variables for each experiment (using DOE theory, such as CCD) k=1 Recalculate design variables Run CFD simulation and store tangential force in C T (k) Construct the surrogate model using C T (i) and the arrays of design variables k=k+1 Y i NNNN N Is the coefficient of determinant (R 2 ) sufficiently large? Y Calculate the optimal values of design variables from the surrogate model N End Figure 3.1. Flow chart of the optimization process. 31
44 3.4. Optimization results In this section, the result of the optimization procedure has been presented. For the RSA, we have chosen the radius of the dimple to be the 1 st design variable (x 1 ), the flap height to be the second design variable (x 2 ) and the non-dimensional tangential force to be the response (y). The resulting polynomial function is used as the objective function of the optimization problem using Genetic Algorithm (GA). For the GA, a population size of 50, a crossover fraction of 0.8, mutation rate of 0.1, and number of generations of 1500 are assumed. Table 3.1 shows the tangential force coefficient values for different data sets using the CCD design analysis. In the present case, the CCF design is good enough to create a reliable response surface. After obtaining the response at different data sets, the objective function is then created and the results are shown in Table 3.3. From Table 3.4 it can be seen that aerofoil having dimple radius m and flap height having m gives the best performance. Table 3.1 Response results of selected experimental data sets Trial No X 1 (m) Designed Parameters X 2 (m) Response Parameter, y (Non-dimensional Tangential Force)
45 Table 3.2 shows the results of the ANOVA (Analysis of variance) analysis performed in MATLAB [73]. ANOVA examines the sensitivity of the cost function to each input variable by analyzing the p-value (indicates the level of significance) of the response surface. Normally in statistics, the response surface approximation results are considered to be significant if the p-value is less than 0.05 [74]. Smaller p-value indicates higher sensitivity to the response surface. For the present study, p-value for the dimple radius is and flap height is which indicate that both design variables have significant effects on the performance of the wind turbine. Table 3.2 ANOVA results Design Variable p-value Dimple radius, (x 1 ) Flap Height (x 2 ) Table 3.3 RSA Result a a a a a a Table 3.4 Optimized Value Design Variable Lower Bound Upper Bound Optimized Value Dimple radius, (x 1 ) (m) (m) (m) Flap Height (x 2 ) (m) (m) (m) Non dimensional Tangential Force (y)
46 Figure 3.2 shows the tangential force coefficient at different iterations of the optimization process. It is seen from the figure that 51 generations are needed to reach the optimized (maximized) tangential force. The optimization process has also been checked with another global optimization algorithm termed as Simulated annealing algorithm [75] and similar results has been obtained (Figure 3.3). Figure 3.3 also indicates that simulated annealing algorithm (needs 8 iteration) is more efficient than the genetic algorithm (needs 40 iteration) for the present study while predicting maximum function value. Figure 3.2. Optimization (maximization) history for Genetic algorithm: force coefficient values at different iteration (generation). Figure 3.4 and Figure 3.5 compare the performance of optimized aerofoil with the base NACA 0015 aerofoil. From the figures it is seen that the modified and optimized shape of the aerofoil generates a larger tangential force than the baseline aerofoil NACA This is a result of the dimple and Gurney flap being introduced at the lower surface of the aerofoil, which results in a much larger lift force at a positive angle of attack even up to the stall condition (12 0 angle of attack) as seen from Figure 3.5. Subsequently, the optimized aerofoil shows significantly larger values of lift coefficient for azimuthal angle approximately up to Due to the lower value of negative angle of attack, beyond the azimuthal angle of 210 0, the optimized aerofoil only moderately 34
47 outperforms the base NACA 0015 aerofoil. In total, the average tangential force obtained for the optimized aerofoil is almost 35% larger than the base NACA 0015 aerofoil. Figure 3.3. Optimization (maximization) history for Simulated Annealing algorithm: force coefficient values at different iterations NACA 0015 Optimized Tangential Force (N) Figure Azimuthal Angle (θ) Tangential Force Variation at different azimuthal angle. 35
48 Lift Coefficient, C L NACA 0015 Optimized Airfoil Theta (degree) Figure 3.5. Variation of lift coefficient at different azimuthal angle. Dimples and Gurney flaps are employed to create greater turbulence that results in creating the flow recirculation near the aerofoil trailing edge. Figure 3.6 and Figure 3.7 show the velocity contours as well as flow streamlines at different azimuthal angles for the baseline NACA 0015 and the optimized aerofoil respectively. At a larger angle of attack boundary layer separation and flow recirculation are observed. It is seen by comparing Figure 3.6 (e) and Figure 3.7 (e) that the optimized aerofoil has generated higher pressure at lower surface and larger suction at the upper surface of the aerofoil. Figure 3.8 indicates that at θ=60 0, a significant amount of flow separation has been observed for the standard NACA 0015 aerofoil but the optimized aerofoil still exhibits attached flow. Additionally, the optimized aerofoil exhibits larger turbulence generation than the base NACA 0015 aerofoil due to the combined effects of dimple and Gurney flap. Figure 3.8 shows the flow recirculation generated for the dimple and flap configuration near the trailing edge of the optimized aerofoil. This flow recirculation increases the lift force specifically at a positive angle of attack and thus increases the tangential force value. From Figure 3.6 and Figure 3.7 it is also seen that for the optimized aerofoil, the upper surface suction and lower surface pressure are much higher than the base NACA 0015 aerofoil which thereby increases the lift coefficient values. Having demonstrated the improved performance of the optimized aerofoil for 36


 θ= 0 0 (b) θ = 15 0")
49 steady-state conditions, results under dynamic conditions will also be tested and presented in the next sections. (a) θ= 0 0 (b) θ = 15 0 (c) θ=
")
 θ=")
50 (d) θ = 60 0 (e) θ = (f) θ=
 θ = 255 0 Velocity")


51 (g) θ =210 0 (h) θ= (i) θ = Velocity (m/s) Figure 3.6. Velocity contour superimposed with flow streamlines for NACA 0015 at various azimuthal angles. 39
 θ =")

52 (a) θ= 0 0 (b) θ = 15 0 (c) θ=
")
 θ=")
53 (d) θ = 60 0 (e) θ = (f) θ=

")

54 (g) θ =210 0 (h) θ= (i) θ =

 Flow separation (superimposed with velocity contour) near the trailing edge")
55 Velocity (m/s) Figure 3.7. Velocity contour superimposed with flow streamlines for the optimized aerofoil at various azimuthal angles. (a) Figure 3.8. (b) Flow separation (superimposed with velocity contour) near the trailing edge for the (a) standard NACA 0015 and (b) optimized aerofoil at azimuthal angle, θ =
56 Chapter 4. Parametric study: Dynamic condition analysis The cyclic variation of the local angle of attack for the case of vertical axis wind turbine is very similar to the flow field around a pitching aerofoil. Figure 4.1 shows the cyclic variation of the local angle of attack at different orbital (azimuthal) angle of the VAWT motion. It is also seen at that lower tip speed ratios, the local angle of attack is greater than the higher tip speed ratios. Angle of Attack, α (deg.) λ=4 λ=3 λ= Azimuthal Angle, θ (deg.) Figure 4.1. Angle of attack as a function of azimuthal angle at different tip speed ratios. A large number of experimental studies have been carried out to predict the flow field around the pitching aerofoil at different Reynolds number for various applications 44
57 [15], [16], [22], [23], [76], [77]. At low tip speed ratio case for VAWTs (i.e. larger angle of attacks), greater vortex and flow separation incidence have been observed on the surfaces of the aerofoil. The vortex created at larger AOA, moves along the aerofoil surface during the dynamic pitching cycle. This causes the increase of the boundary layer thickness and in turn massive flow separation phenomenon is observed. The larger the AOA, the greater the vortex has been generated. Due to the massive flow separation the aerofoil cannot generate lift after a certain point and eventually the tangential force becomes to decrease. This phenomenon can be referred as dynamic stall condition [23]. In addition to the dynamic stall effect, VAWTs also experiences the fluid structure interaction occurrence, since VAWT blade has the cyclic motion along the generated wake developed at the upstream period of the cycle. Thus, to predict such type of flow behaviour is challenging. Proper modeling of the turbulent flow and fine grids are required to capture the fluid-structure interaction accurately. In this study, the aerofoil modification effects is analyzed for only light stall conditions (AOA< 20 0 ) i.e. at moderately high tip speed ratio to avoid the massive flow separation at deep dynamic stall which occurs at very high angle of attacks (>20 0 ) [23] Problem statement As the blade rotates in a VAWT, the direction and magnitude of the effective wind velocity change in a cyclic manner. Figure 4.2 shows a simple schematic of the single aerofoil pitching motion which is similar to the VAWT blade. Thus, the oscillatory motion (pitching oscillation) of the blade can be assumed as- α= α mean + α amp sin (ωt) (4.1) Where, α mean = mean angle of attack α amp = pitch oscillation amplitude ω = angular velocity. 45
58 k= reduced frequency, ω c 2U Figure 4.2. Simple schematic of the aerofoil pitching motion Numerical techniques and method of analysis Previous literature has used different values of frequencies and oscillating amplitudes to analyze the wind turbine performance [15], [16], [22], [23], [18], [59]. For the present unsteady CFD simulation, the aerofoil is kept aligned with the horizontal axis. The horizontal and vertical components of the boundary conditions are modified to alter the direction of the far-field flow over the aerofoil at every time step. The mean angle of attack is set to 8 0 and amplitude is set to The horizontal and vertical velocity components of the sinusoidal pitching motions are shown in Figure 4.3. In this thesis the performance of the aerofoils has been analyzed for light dynamic stall conditions only (up to angle of attack). The performance of the optimized aerofoil has been analyzed at two different chordal Reynolds number, Re c = and Very few experimental studies have been found to analyze the aerofoil performance light dynamic stall conditions at these low Reynolds numbers (Re c 10 6 ). From the experimental study of Lee et al. [23], it can be said that deep dynamic stall occurs at a higher angle of attack (>20 0 ) in comparison with the static stall condition (>12 0 ). Under light dynamic conditions, almost attached flow or moderate flow separations have been observed even at the 18 0 angle of attack. For this reason, the revised k-ω turbulence model [58] has been used to capture the flow condition for the current oscillating dynamic condition as this model is capable to capture the flow 46
59 parameters accurately at moderate pressure gradients with moderate flow separation [11], [24]. The angular frequency of the oscillation has been assumed to be rad/s. (a) (b) Figure 4.3. Sinusoidal free stream (inlet) velocity (a) Horizontal and (b) Vertical velocity field. The revised k-ω model [24] solves for the turbulent kinetic energy, k, and for the dissipation per unit turbulent kinetic energy, ω. In the CFD simulation software COMSOL [24], the revised k-ω model uses the wall function near the aerofoil wall while the SST k- ω model does not use the wall function. For this reason revised k-ω model is computationally more efficient than the SST k-ω model specifically for light dynamic stall conditions. The revised k-ω model solves for the turbulent kinetic energy, k, and for the dissipation per unit turbulent kinetic energy, ω. The Wilcox revised k-ω model [24], [58] are described as follows: ρ + ρ u. k = P k ρ β k ω +. ((μ + σ μ T ) k) (4.2) 47
60 ρ + ρ u. ω = α ω k P k ρρ ω 2 +. ((μ + σ μ T ) ω) (4.3) Here, μ T = ρ k ω α = 13 25, β = β 0 f β, σ = 1 2, σ = 1 2 β 0 = , f β = χ w χ w χ w = Ω iiω jj S kk (β 0 ω) 3 β 0 = 9 1 ; χ k 0 100, f β = χ k χ ; χ k > 0 ; χ k = k 1 ( k. ω) ω3 Ω ii is is the mean rotation-rate tensor: Ω ii = 1 2 ( u ı u ȷ ) x j x i and S ii is the mean strain-rate tensor: S ii = 1 2 ( u ı u ȷ ) x j x i 48
61 The wall function used for this turbulent flow simulation is such that the computational domain is assumed to start a distance y from the wall. The distance y is computed iteratively by solving the following [24]- y + = ρu τ y μ Where, the friction velocity (u τ ) is assumed such that: u u τ = 1 κ log y+ + B (4.4) Here, κ is the von Karman constant whose value is 0.41 and B is an empirical constant equals to 5.2. For the computation the friction velocity u τ is assumed to be 1 4 equivalent to β 0 k which becomes and the boundary condition for ω can be defined as ρ.k/(κ y + µ). This corresponds to the distance from the wall where the logarithmic layer meets the viscous sub-layer. The solutions are always checked in such that the y + value is on all the walls of the aerofoil [24]. As SST k-ω model does not use wall function, the y + value on near wall region should be 1 [22], [24]. For this reason more fine mesh is necessary at the near wall region while using the SST k-ω model. Thus, SST k-ω model takes more time to converge than the revised k-ω turbulence model but SST k-ω model gives high accuracy especially at adverse pressure gradients and highly separating flow [11], [24] which is seen at deep dynamic stall conditions having larger AOA (> 20 0 ) [23] Validation studies for the dynamic case From previous literature review study it is seen that lift coefficient values are very sensitive to the oscillating frequency values as well as the turbulence intensities [16], [22], [18], [59]. For this reason, turbulence modeling under dynamic and pitching oscillation condition is still an active area of research. Still no such turbulence model is available to predict accurately the flow behaviour of an aerofoil under dynamic oscillation condition [15], [16], [18], [22], [59]. Considering all of the above conditions, the results of the present studies are validated against the experimental study of Lee et al. [23], [59] 49
62 and the results are shown in Figure 4.4. This is the only experimental study which has been carried out at low Reynolds number cases (order of 10 5 ) which is appropriate for the analysis of VAWT. It is seen from Figure 4.4 that the simulations are in reasonable agreement with the experiments. Though at relatively higher angle of attacks the results are not accurate but the overall trend of the results are similar. Various research works is still going on to predict the results under dynamic conditions accurately [15], [16], [18], [22]. These researchers validated the results for low Reynolds number cases, but for the numerical simulations they used very large AOA (>20 0 ). To the best knowledge of the author, this work is the first study to validate the CFD results of Lee et al. [23], [59] with the light dynamic stall cases (AOA < 20 0 ) at low Reynolds number conditions [76], [78] Present numerical simulations Experimental study of Lee et al. α(t)= sin (18.67t) Lift coefficient (C L ) Angle of attack, α (deg.) (a) 50
63 Lift coefficient (C L ) Experimental study of Lee et al. Present numerical simulation Angle of attack, α (deg.) Figure 4.4. Comparison of lift coefficient between previously published experimental study [23], [59] and current numerical simulation at Re c = for oscillating motion: (a) sin (18.67t); (b) 15 0 sin (18.67t). (b) α(t)= 15 0 sin (18.67t) 4.4. Performance of NACA 0015 aerofoil under pitching oscillation To the best of the author knowledge, no research work has been found to analyze the flow behaviour of the standard NACA 0015 under oscillating pitching condition at low Reynolds number flow. Thus, in this section the simulation has been performed at k= and for the aerofoil NACA 0015 at chord Reynolds number The mean angle of attack is assumed to be zero and two different amplitudes have been assumed to be and Figure Figure 4.8 show the tangential force coefficient at different flow condition for NACA 0015 aerofoil. From these figures it is seen that all the simulation shows almost quasi-steady state behaviour after four revolutions. It can also be said that for higher oscillation frequency, the value of tangential force coefficient is larger. From 51
64 Figure 4.8 it is seen that the results are little unsteady even after six or seven cycles of oscillations. This unsteady nature can be described while analyzing the streamlines around the aerofoil surface. Figure 4.9 shows the streamlines around the aerofoil surface for different oscillating condition. From Figure 4.9 (g) it can be seen that flow recirculation begins at the trailing edge for oscillations with the larger angular velocity and amplitude. This flow recirculation may be responsible for the unsteady behaviour of the aerofoil at larger angular speed (41.89 rad/s). It should be noted that none of the cases exhibit stall condition (even at high angle of attack such as ). 52
65 Tangential Force Coefficient (C T ) No of Revolution sin (18.67t) Figure 4.5. Tangential Force Coefficient (C T ) (a) sin (18.67t) 1st 2nd 3rd 4th 5th Azimuthal Angle, θ (deg.) (b) Tangential Force Coefficient at different (a) revolution and (b) azimuthal Angle for the condition sin (18.67t). 53
66 Tangential Force Coefficient (C T ) sin (41.89t) No of Revolution (a) sin (41.89t) 1st 2nd 3rd 4th 5th Tangential Force Coefficient (C T ) Azimuthal Angle, θ (deg.) Figure 4.6. (b) Tangential Force Coefficient at different (a) revolution and (b) Azimuthal Angle for the condition sin (41.89t). 54
67 Tangential Force Coefficient (C T ) sin (18.67t) No of Revolution (a) sin (18.67 t) 1st 2nd 3rd Tangential Force Coefficient (C T ) th 5th Azimuthal Angle, θ (deg.) (b) Figure 4.7. Tangential Force Coefficient at different (a) revolution and (b) azimuthal Angle for the condition sin (18.67t). 55
68 Tangential Force Coefficient (C T ) sin (41.89t) No of Revolution (a) sin (41.89 t) 1st 2nd 3rd 4th 5th Tangential Force Coefficient (C T ) Azimuthal Angle, θ (deg.) (b) Figure 4.8. Tangential Force Coefficient at different (a) revolution and (b) azimuthal Angle for the condition sin (41.89t). 56


69 (a) α= 16 0 ; ω = rad/s (b) α = 5 0 ; ω = rad/s 57
 α= 16.6 0 ; ω = 18.")
70 (c) α= 5 0 ; ω = rad/s (d) α= ; ω = rad/s 58


71 (e) α= ; ω = rad/s (near the trailing edge) (f) α= ; ω = rad/s 59
. 4.5.")
72 Figure 4.9. (g) α= ; ω = rad/s (flow recirculation near the trailing edge) Streamlines around the aerofoil surface for the oscillating motion (a)-(e): sin (18.67t) and (f)-(g): sin (41.89t) Performance comparison between the standard NACA 0015 and the optimized aerofoil This section will describe the performance of the optimized aerofoil and compare the results with the regular NACA 0015 aerofoil. From the previous section, it is observed that the performance of the wind turbine is too much sensitive with the reduced frequency values even other parameters are kept constant. Hence, the results are compared only for the angular frequency rad/s. At this angular speed good quasisteady condition values has been obtained. The optimized blade performance is compared for two different oscillating motions: (a) sin (18.67t) and (b) sin (18.67t). In order to understand the instantaneous flow at different positions in the oscillation cycle and compare the results, Figure 4.10 is used to represent the velocity contours superimposed with flow streamlines at Re c = From Figure 4.10, an almost attached flow is observed throughout the motion of the aerofoil. At a higher angle of attack (18 0 ) small flow recirculation has been observed due to the fluid-structure interaction case for the rapid pitching of the aerofoil. It is also seen from Figure 4.10 (c) and (f) that optimized aerofoil exhibits a very little upper surface (suction side) flow recirculation or flow separation compared to the standard NACA 0015 aerofoil. As the upper surface flow recirculation is the cause of stall condition, this phenomenon should be avoided or needed to be delayed. Due to the optimized configuration of Gurney flap 60


73 and dimple, the flow separation has been delayed and observed at AOA> 18 0 but for the standard NACA 0015 aerofoil case it has been observed approximately at AOA > Thus, the optimized aerofoil shows better results. Figure 4.11 and Figure 4.12 plot the tangential force over five oscillations for two different chordal Reynolds numbers. It is seen from these figures that five cycles provide sufficient time to achieve a quasi-steady state condition. The figures also indicate that the optimized aerofoil achieves improved aerodynamic performance. The performances of the optimized blades are also tested for double blades condition. (a) α = 8 0 ; NACA 0015 aerofoil (b) α = ; NACA 0015 aerofoil 61

 (d) α")
 α = 18.")
74 (c) α = ; NACA 0015 aerofoil (near the trailing edge) (d) α = 8 0 ; Optimized aerofoil (e) α = ; Optimized aerofoil 62
 at different angles of attack at Re c = 3.6 10 5 : (a)-(c) NACA 0015 and (d)-(f) optimized aerofoil. Figure 4.")
75 (f) α = ; Optimized aerofoil (near the trailing edge) Velocity (m/s) Figure Velocity contours (single blade) superimposed with the streamlines for for the oscillating motion sin (18.67t) at different angles of attack at Re c = : (a)-(c) NACA 0015 and (d)-(f) optimized aerofoil. Figure 4.13 shows the velocity contours (double blades) for the oscillating motion sin (18.67t) at Re c = It is observed that due to the optimized configuration of gurney flap and dimple, the velocity at the lower surface (pressure side surface) of the aerofoil is lower than the standard NACA 0015 aerofoil. This indicates the higher pressure at the lower side or the pressure side surface of the aerofoil which in turn can increase the tangential force of the aerofoil. Figure 4.14 to Figure 4.16 show the performance of the optimized aerofoil for single and double blade cases at different oscillating conditions. 63
76 Tangential Force, F T (N) Number of Revolution Optimized NACA0015 Figure Tangential force comparison (single blade) between NACA 0015 and optimized aerofoil at Re c = for oscillating motion: sin (18.67t). 8 7 NACA 0015 optimized Tangential Force, F T (N) Number of Revolution Figure Tangential force comparison (single blade) between NACA 0015 and optimized aerofoil at Re c = for oscillating motion: sin (18.67t). 64

")
77 (a) α = ; NACA 0015 aerofoil (b) α = ; NACA 0015 aerofoil (close view) 65
 Figure 4.13.")
 at Re c = 2.")
78 (c) α = ; optimized aerofoil (d) α = ; optimized aerofoil (close view) Figure Velocity contours (m/s) superimposed with the streamlines for the oscillating motion sin (18.67t) at Re c = : (a)-(b) NACA 0015 and (c)-(d) optimized aerofoil (double blade). 66
CHAPTER 4 OPTIMIZATION OF COEFFICIENT OF LIFT, DRAG AND POWER - AN ITERATIVE APPROACH
 82 CHAPTER 4 OPTIMIZATION OF COEFFICIENT OF LIFT, DRAG AND POWER - AN ITERATIVE APPROACH The coefficient of lift, drag and power for wind turbine rotor is optimized using an iterative approach. The coefficient
Turbulent Boundary Layers & Turbulence Models. Lecture 09
 Turbulent Boundary Layers & Turbulence Models Lecture 09 The turbulent boundary layer In turbulent flow, the boundary layer is defined as the thin region on the surface of a body in which viscous effects
Numerical Investigation on the Performance of Double Layered H-Rotor Darrieus Turbine
 Numerical Investigation on the Performance of Double Layered H-Rotor Darrieus Turbine Submitted by S.M. Rakibul Hassan Student ID: 0413102055 Supervisor Dr. Mohammad Ali Professor Department of Mechanical
COMPUTATIONAL SIMULATION OF THE FLOW PAST AN AIRFOIL FOR AN UNMANNED AERIAL VEHICLE
 COMPUTATIONAL SIMULATION OF THE FLOW PAST AN AIRFOIL FOR AN UNMANNED AERIAL VEHICLE L. Velázquez-Araque 1 and J. Nožička 2 1 Division of Thermal fluids, Department of Mechanical Engineering, National University
Numerical Methods in Aerodynamics. Turbulence Modeling. Lecture 5: Turbulence modeling
 Turbulence Modeling Niels N. Sørensen Professor MSO, Ph.D. Department of Civil Engineering, Alborg University & Wind Energy Department, Risø National Laboratory Technical University of Denmark 1 Outline
Manhar Dhanak Florida Atlantic University Graduate Student: Zaqie Reza
 REPRESENTING PRESENCE OF SUBSURFACE CURRENT TURBINES IN OCEAN MODELS Manhar Dhanak Florida Atlantic University Graduate Student: Zaqie Reza 1 Momentum Equations 2 Effect of inclusion of Coriolis force
CHAPTER 3 ANALYSIS OF NACA 4 SERIES AIRFOILS
 54 CHAPTER 3 ANALYSIS OF NACA 4 SERIES AIRFOILS The baseline characteristics and analysis of NACA 4 series airfoils are presented in this chapter in detail. The correlations for coefficient of lift and
NUMERICAL INVESTIGATION OF VERTICAL AXIS WIND TURBINE WITH TWIST ANGLE IN BLADES
 Eleventh International Conference on CFD in the Minerals and Process Industries CSIRO, Melbourne, Australia 7-9 December 05 NUMERICAL INVESTIGATION OF VERTICAL AXIS WIND TURBINE WITH TWIST ANGLE IN BLADES
Active Control of Separated Cascade Flow
 Chapter 5 Active Control of Separated Cascade Flow In this chapter, the possibility of active control using a synthetic jet applied to an unconventional axial stator-rotor arrangement is investigated.
Large-eddy simulations for wind turbine blade: rotational augmentation and dynamic stall
 Large-eddy simulations for wind turbine blade: rotational augmentation and dynamic stall Y. Kim, I.P. Castro, and Z.T. Xie Introduction Wind turbines operate in the atmospheric boundary layer and their
Numerical Modelling of an H-type Darrieus Wind Turbine Performance under Turbulent Wind
 American Journal of Energy Research, 2017, Vol. 5, No. 3, 63-78 Available online at http://pubs.sciepub.com/ajer/5/3/1 Science and Education Publishing DOI:10.12691/ajer-5-3-1 Numerical Modelling of an
WALL ROUGHNESS EFFECTS ON SHOCK BOUNDARY LAYER INTERACTION FLOWS
 ISSN (Online) : 2319-8753 ISSN (Print) : 2347-6710 International Journal of Innovative Research in Science, Engineering and Technology An ISO 3297: 2007 Certified Organization, Volume 2, Special Issue
Masters in Mechanical Engineering. Problems of incompressible viscous flow. 2µ dx y(y h)+ U h y 0 < y < h,
+ U h y 0 < y < h,") Masters in Mechanical Engineering Problems of incompressible viscous flow 1. Consider the laminar Couette flow between two infinite flat plates (lower plate (y = 0) with no velocity and top plate (y =
Masters in Mechanical Engineering Problems of incompressible viscous flow 1. Consider the laminar Couette flow between two infinite flat plates (lower plate (y = 0) with no velocity and top plate (y =
Mestrado Integrado em Engenharia Mecânica Aerodynamics 1 st Semester 2012/13
 Mestrado Integrado em Engenharia Mecânica Aerodynamics 1 st Semester 212/13 Exam 2ª época, 2 February 213 Name : Time : 8: Number: Duration : 3 hours 1 st Part : No textbooks/notes allowed 2 nd Part :
Performance Analysis and Design of Vertical Axis Tidal Stream Turbine
 Journal of Shipping and Ocean Engineering 2 (2012) 191-200 D DAVID PUBLISHING Performance Analysis and Design of Vertical Axis Tidal Stream Turbine Beom-Soo Hyun, Da-Hye Choi, Jun-Seon Han and Ji-Yuan
Effect of Blade Number on a Straight-Bladed Vertical-Axis Darreius Wind Turbine
 Effect of Blade Number on a Straight-Bladed Vertical-Axis Darreius Wind Turbine Marco Raciti Castelli, Stefano De Betta and Ernesto Benini Abstract This paper presents a mean for reducing the torque variation
Effect of Blade Number on a Straight-Bladed Vertical-Axis Darreius Wind Turbine
 Effect of Blade Number on a Straight-Bladed Vertical-Axis Darreius Wind Turbine Marco Raciti Castelli, Stefano De Betta and Ernesto Benini Abstract This paper presents a mean for reducing the torque variation
There are no simple turbulent flows
 Turbulence 1 There are no simple turbulent flows Turbulent boundary layer: Instantaneous velocity field (snapshot) Ref: Prof. M. Gad-el-Hak, University of Notre Dame Prediction of turbulent flows standard
A Computational Investigation of a Turbulent Flow Over a Backward Facing Step with OpenFOAM
 206 9th International Conference on Developments in esystems Engineering A Computational Investigation of a Turbulent Flow Over a Backward Facing Step with OpenFOAM Hayder Al-Jelawy, Stefan Kaczmarczyk
1. Fluid Dynamics Around Airfoils
 1. Fluid Dynamics Around Airfoils Two-dimensional flow around a streamlined shape Foces on an airfoil Distribution of pressue coefficient over an airfoil The variation of the lift coefficient with the
Numerical study of battle damaged two-dimensional wings
 Advances in Fluid Mechanics IX 141 Numerical study of battle damaged two-dimensional wings S. Djellal, T. Azzam, M. Djellab & K. Lakkaichi Fluid Mechanics Laboratory Polytechnical School Bordj El Bahri,
International Journal of Modern Trends in Engineering and Research e-issn No.: , Date: 2-4 July, 2015
 International Journal of Modern Trends in Engineering and Research www.ijmter.com e-issn No.:2349-9745, Date: 2-4 July, 2015 CFD Analysis of Airfoil NACA0012 Pritesh S. Gugliya 1, Yogesh R. Jaiswal 2,
BOUNDARY LAYER FLOWS HINCHEY
 BOUNDARY LAYER FLOWS HINCHEY BOUNDARY LAYER PHENOMENA When a body moves through a viscous fluid, the fluid at its surface moves with it. It does not slip over the surface. When a body moves at high speed,
Application of a Helmholtz resonator excited by grazing flow for manipulation of a turbulent boundary layer
 Application of a Helmholtz resonator excited by grazing flow for manipulation of a turbulent boundary layer Farzin Ghanadi School of Mechanical Engineering The University of Adelaide South Australia, 5005
Simulation of Aeroelastic System with Aerodynamic Nonlinearity
 Simulation of Aeroelastic System with Aerodynamic Nonlinearity Muhamad Khairil Hafizi Mohd Zorkipli School of Aerospace Engineering, Universiti Sains Malaysia, Penang, MALAYSIA Norizham Abdul Razak School
Performance of a Vertical Axis Wind Turbine under Accelerating and Decelerating Flows
 Available online at www.sciencedirect.com Procedia CIRP 00 (2013) 000 000 www.elsevier.com/locate/procedia 2 nd International Through-life Engineering Services Conference Performance of a Vertical Axis
Available online at ScienceDirect. Procedia Engineering 79 (2014 ) 49 54
 49 54") Available online at www.sciencedirect.com ScienceDirect Procedia Engineering 79 (2014 ) 49 54 37th National Conference on Theoretical and Applied Mechanics (37th NCTAM 2013) & The 1st International Conference
Available online at www.sciencedirect.com ScienceDirect Procedia Engineering 79 (2014 ) 49 54 37th National Conference on Theoretical and Applied Mechanics (37th NCTAM 2013) & The 1st International Conference
Lecture-4. Flow Past Immersed Bodies
 Lecture-4 Flow Past Immersed Bodies Learning objectives After completing this lecture, you should be able to: Identify and discuss the features of external flow Explain the fundamental characteristics
Department of Mechanical Engineering
 Department of Mechanical Engineering AMEE401 / AUTO400 Aerodynamics Instructor: Marios M. Fyrillas Email: eng.fm@fit.ac.cy HOMEWORK ASSIGNMENT #2 QUESTION 1 Clearly there are two mechanisms responsible
Computational investigation of flow control by means of tubercles on Darrieus wind turbine blades
 Journal of Physics: Conference Series PAPER OPEN ACCESS Computational investigation of flow control by means of tubercles on Darrieus wind turbine blades To cite this article: K Sevinç et al 2015 J. Phys.:
SENSITIVITY ANALYSIS OF THE FACTORS AFFECTING FORCE GENERATION BY WING FLAPPING MOTION
 Proceedings of the ASME 2013 International Mechanical Engineering Congress and Exposition IMECE2013 November 15-21, 2013, San Diego, California, USA IMECE2013-65472 SENSITIVITY ANALYSIS OF THE FACTORS
Research on Propeller Characteristics of Tip Induced Loss
 4th International Conference on Machinery, Materials and Information Technology Applications (ICMMITA 2016) Research on Propeller Characteristics of Tip Induced Loss Yang Song1, a, Peng Shan2, b 1 School
NUMERICAL AND EXPERIMENTAL INVESTIGATION OF H-DARRIEUS VERTICAL AXIS WIND TURBINE.
 NUMERICAL AND EXPERIMENTAL INVESTIGATION OF H-DARRIEUS VERTICAL AXIS WIND TURBINE Normunds Jekabsons 1, Sabine Upnere 1, Janis Kleperis 2,3 1 Ventspils University College, Latvia; 2 SIA Multipla Energy,
On the transient modelling of impinging jets heat transfer. A practical approach
 Turbulence, Heat and Mass Transfer 7 2012 Begell House, Inc. On the transient modelling of impinging jets heat transfer. A practical approach M. Bovo 1,2 and L. Davidson 1 1 Dept. of Applied Mechanics,
An Overview of Impellers, Velocity Profile and Reactor Design
 An Overview of s, Velocity Profile and Reactor Design Praveen Patel 1, Pranay Vaidya 1, Gurmeet Singh 2 1 Indian Institute of Technology Bombay, India 1 Indian Oil Corporation Limited, R&D Centre Faridabad
THE EFFECT OF INTERNAL ACOUSTIC EXCITATION ON THE AERODYNAMIC CHARACTERISTICS OF AIRFOIL AT HIGH ANGLE OF ATTACKE
 Vol.1, Issue.2, pp-371-384 ISSN: 2249-6645 THE EFFECT OF INTERNAL ACOUSTIC EXCITATION ON THE AERODYNAMIC CHARACTERISTICS OF AIRFOIL AT HIGH ANGLE OF ATTACKE Dr. Mohammed W. Khadim Mechanical Engineering
NUMERICAL SIMULATION AND MODELING OF UNSTEADY FLOW AROUND AN AIRFOIL. (AERODYNAMIC FORM)
") Journal of Fundamental and Applied Sciences ISSN 1112-9867 Available online at http://www.jfas.info NUMERICAL SIMULATION AND MODELING OF UNSTEADY FLOW AROUND AN AIRFOIL. (AERODYNAMIC FORM) M. Y. Habib
Journal of Fundamental and Applied Sciences ISSN 1112-9867 Available online at http://www.jfas.info NUMERICAL SIMULATION AND MODELING OF UNSTEADY FLOW AROUND AN AIRFOIL. (AERODYNAMIC FORM) M. Y. Habib
ANALYSIS AND OPTIMIZATION OF A VERTICAL AXIS WIND TURBINE SAVONIUS-TYPE PANEL USING CFD TECHNIQUES
 ANALYSIS AND OPTIMIZATION OF A VERTICAL AXIS WIND TURBINE SAVONIUS-TYPE PANEL USING CFD TECHNIQUES J. Vilarroig, S. Chiva*, R. Martínez and J. Segarra** *Author for correspondence ** Heliotec.SL Department
Coupled Fluid and Heat Flow Analysis Around NACA Aerofoil Profiles at Various Mach Numbers
 International Journal of Engineering Research and Technology. ISSN 0974-3154 Volume 6, Number 2 (2013), pp. 249-258 International Research Publication House http://www.irphouse.com Coupled Fluid and Heat
TURBULENT FLOW ACROSS A ROTATING CYLINDER WITH SURFACE ROUGHNESS
 HEFAT2014 10 th International Conference on Heat Transfer, Fluid Mechanics and Thermodynamics 14 16 July 2014 Orlando, Florida TURBULENT FLOW ACROSS A ROTATING CYLINDER WITH SURFACE ROUGHNESS Everts, M.,
LARGE EDDY SIMULATION OF FLOW OVER NOZZLE GUIDE VANE OF A TRANSONIC HIGH PRESSURE TURBINE
 20 th Annual CFD Symposium, August 09-10, 2018, Bangalore LARGE EDDY SIMULATION OF FLOW OVER NOZZLE GUIDE VANE OF A TRANSONIC HIGH PRESSURE TURBINE Bharathan R D, Manigandan P, Vishal Tandon, Sharad Kapil,
COMPUTATIONAL FLUID DYNAMICS ANALYSIS OF A V-RIB WITH GAP ROUGHENED SOLAR AIR HEATER
 THERMAL SCIENCE: Year 2018, Vol. 22, No. 2, pp. 963-972 963 COMPUTATIONAL FLUID DYNAMICS ANALYSIS OF A V-RIB WITH GAP ROUGHENED SOLAR AIR HEATER by Jitesh RANA, Anshuman SILORI, Rajesh MAITHANI *, and
Research on Dynamic Stall and Aerodynamic Characteristics of Wind Turbine 3D Rotational Blade
 Research on Dynamic Stall and Aerodynamic Characteristics of Wind Turbine 3D Rotational Blade HU Guo-yu, SUN Wen-lei, Dong Ping The School of Mechanical Engineering Xinjiang University Urumqi, Xinjiang,
CFD based design and analysis of micro-structured. surfaces with application to drag and noise reduction
 KES Transactions on Sustainable Design and Manufacturing I Sustainable Design and Manufacturing 2014 : pp.162-171 : Paper sdm14-068 CFD based design and analysis of micro-structured surfaces with application
Masters in Mechanical Engineering Aerodynamics 1 st Semester 2015/16
 Masters in Mechanical Engineering Aerodynamics st Semester 05/6 Exam st season, 8 January 06 Name : Time : 8:30 Number: Duration : 3 hours st Part : No textbooks/notes allowed nd Part : Textbooks allowed
Performance characteristics of turbo blower in a refuse collecting system according to operation conditions
 Journal of Mechanical Science and Technology 22 (2008) 1896~1901 Journal of Mechanical Science and Technology www.springerlink.com/content/1738-494x DOI 10.1007/s12206-008-0729-6 Performance characteristics
Validation of Chaviaro Poulos and Hansen Stall Delay Model in the Case of Horizontal Axis Wind Turbine Operating in Yaw Conditions
 Energy and Power Engineering, 013, 5, 18-5 http://dx.doi.org/10.436/epe.013.51003 Published Online January 013 (http://www.scirp.org/journal/epe) Validation of Chaviaro Poulos and Hansen Stall Delay Model
The Simulation of Wraparound Fins Aerodynamic Characteristics
 The Simulation of Wraparound Fins Aerodynamic Characteristics Institute of Launch Dynamics Nanjing University of Science and Technology Nanjing Xiaolingwei 00 P. R. China laithabbass@yahoo.com Abstract:
Lecture 4: Wind energy
 ES427: The Natural Environment and Engineering Global warming and renewable energy Lecture 4: Wind energy Philip Davies Room A322 philip.davies@warwick.ac.uk 1 Overview of topic Wind resources Origin of
CFD in COMSOL Multiphysics
 CFD in COMSOL Multiphysics Mats Nigam Copyright 2016 COMSOL. Any of the images, text, and equations here may be copied and modified for your own internal use. All trademarks are the property of their respective
Direct Numerical Simulations of Transitional Flow in Turbomachinery
 Direct Numerical Simulations of Transitional Flow in Turbomachinery J.G. Wissink and W. Rodi Institute for Hydromechanics University of Karlsruhe Unsteady transitional flow over turbine blades Periodic
2-D and 3-D Assessment of Cambered and Symmetric Airfoils: A CFD Study
 Clemson University TigerPrints All Theses Theses 12-2009 2-D and 3-D Assessment of Cambered and Symmetric Airfoils: A CFD Study Tuncay Kamas Clemson University, tkamas@clemson.edu Follow this and additional
HEAT TRANSFER IN A RECIRCULATION ZONE AT STEADY-STATE AND OSCILLATING CONDITIONS - THE BACK FACING STEP TEST CASE
 HEAT TRANSFER IN A RECIRCULATION ZONE AT STEADY-STATE AND OSCILLATING CONDITIONS - THE BACK FACING STEP TEST CASE A.K. Pozarlik 1, D. Panara, J.B.W. Kok 1, T.H. van der Meer 1 1 Laboratory of Thermal Engineering,
International Journal of Scientific & Engineering Research, Volume 6, Issue 5, May ISSN
 International Journal of Scientific & Engineering Research, Volume 6, Issue 5, May-2015 28 CFD BASED HEAT TRANSFER ANALYSIS OF SOLAR AIR HEATER DUCT PROVIDED WITH ARTIFICIAL ROUGHNESS Vivek Rao, Dr. Ajay
Introduction to ANSYS FLUENT
 Lecture 6 Turbulence 14. 0 Release Introduction to ANSYS FLUENT 1 2011 ANSYS, Inc. January 19, 2012 Lecture Theme: Introduction The majority of engineering flows are turbulent. Successfully simulating
Aerodynamic force analysis in high Reynolds number flows by Lamb vector integration
 Aerodynamic force analysis in high Reynolds number flows by Lamb vector integration Claudio Marongiu, Renato Tognaccini 2 CIRA, Italian Center for Aerospace Research, Capua (CE), Italy E-mail: c.marongiu@cira.it
Contents. I Introduction 1. Preface. xiii
 Contents Preface xiii I Introduction 1 1 Continuous matter 3 1.1 Molecules................................ 4 1.2 The continuum approximation.................... 6 1.3 Newtonian mechanics.........................
Explicit algebraic Reynolds stress models for internal flows
 5. Double Circular Arc (DCA) cascade blade flow, problem statement The second test case deals with a DCA compressor cascade, which is considered a severe challenge for the CFD codes, due to the presence
The effect of geometric parameters on the head loss factor in headers
 Fluid Structure Interaction V 355 The effect of geometric parameters on the head loss factor in headers A. Mansourpour & S. Shayamehr Mechanical Engineering Department, Azad University of Karaj, Iran Abstract
Numerical investigation of swirl flow inside a supersonic nozzle
 Advances in Fluid Mechanics IX 131 Numerical investigation of swirl flow inside a supersonic nozzle E. Eslamian, H. Shirvani & A. Shirvani Faculty of Science and Technology, Anglia Ruskin University, UK
Visualization of flow pattern over or around immersed objects in open channel flow.
 EXPERIMENT SEVEN: FLOW VISUALIZATION AND ANALYSIS I OBJECTIVE OF THE EXPERIMENT: Visualization of flow pattern over or around immersed objects in open channel flow. II THEORY AND EQUATION: Open channel:
Simulation of Flow Pattern through a Three-Bucket Savonius. Wind Turbine by Using a Sliding Mesh Technique
 Simulation of Flow Pattern through a Three-Bucket Savonius Wind Turbine by Using a Sliding Mesh Technique Dr. Dhirgham AL-Khafaji Department of Mechanical engineering/college of Engineering, University
Chapter 1: Basic Concepts
 What is a fluid? A fluid is a substance in the gaseous or liquid form Distinction between solid and fluid? Solid: can resist an applied shear by deforming. Stress is proportional to strain Fluid: deforms
Introduction to Turbulence AEEM Why study turbulent flows?
 Introduction to Turbulence AEEM 7063-003 Dr. Peter J. Disimile UC-FEST Department of Aerospace Engineering Peter.disimile@uc.edu Intro to Turbulence: C1A Why 1 Most flows encountered in engineering and
Numerical Prediction Of Torque On Guide Vanes In A Reversible Pump-Turbine
 Journal of Multidisciplinary Engineering Science and Technology (JMEST) ISSN: 3159 Vol. 2 Issue 6, June - 215 Numerical Prediction Of Torque On Guide Vanes In A Reversible Pump-Turbine Turbine and pump
Numerical investigation of the flow instabilities in centrifugal fan
 Proceedings of the 4th WSEAS International Conference on Fluid Mechanics and Aerodynamics, Elounda, Greece, August 21-23, 26 (pp282-288) Numerical investigation of the flow instabilities in centrifugal
Propeller Loads of Large Commercial Vessels at Crash Stop
 Second International Symposium on Marine Propulsors smp 11, Hamburg, Germany, June 2011 Propeller Loads of Large Commercial Vessels at Crash Stop J.W. Hur, H. Lee, B.J. Chang 1 1 Hyundai Heavy Industries,
Parametric Investigation of Hull Shaped Fuselage for an Amphibious UAV
 Ninth International Conference on Computational Fluid Dynamics (ICCFD9), Istanbul, Turkey, July 11-15, 2016 ICCFD9-2016-226 Parametric Investigation of Hull Shaped Fuselage for an Amphibious UAV Emre Sazak
NUMERICAL AND WIND TUNNEL INVESTIGATION ON AERODYNAMIC COEFFICIENTS OF A THREE BLADED SAVONIUS WIND TURBINE WITH AND WITHOUT OVERLAP BETWEEN BLADES
 NUMERICAL AND WIND TUNNEL INVESTIGATION ON AERODYNAMIC COEFFICIENTS OF A THREE BLADED SAVONIUS WIND TURBINE WITH AND WITHOUT OVERLAP BETWEEN BLADES Mosfequr Rahman, Khandakar N. Morshed 2, Mahbub K. Ahmed
Detailed Outline, M E 320 Fluid Flow, Spring Semester 2015
 Detailed Outline, M E 320 Fluid Flow, Spring Semester 2015 I. Introduction (Chapters 1 and 2) A. What is Fluid Mechanics? 1. What is a fluid? 2. What is mechanics? B. Classification of Fluid Flows 1. Viscous
Assessment of Various Diffuser Structures to Improve the Power Production of a Wind Turbine Rotor
 DOI: 10.24352/UB.OVGU-2018-033 TECHNISCHE MECHANIK, 38, 3, (2018), 256-266 submitted: June 27, 2018 Assessment of Various Diffuser Structures to Improve the Power Production of a Wind Turbine Rotor Yiyin
COMPUTATIONAL STUDY OF SEPARATION CONTROL MECHANISM WITH THE IMAGINARY BODY FORCE ADDED TO THE FLOWS OVER AN AIRFOIL
 COMPUTATIONAL STUDY OF SEPARATION CONTROL MECHANISM WITH THE IMAGINARY BODY FORCE ADDED TO THE FLOWS OVER AN AIRFOIL Kengo Asada 1 and Kozo Fujii 2 ABSTRACT The effects of body force distribution on the
Computational Fluid Dynamics Study Of Fluid Flow And Aerodynamic Forces On An Airfoil S.Kandwal 1, Dr. S. Singh 2
 Computational Fluid Dynamics Study Of Fluid Flow And Aerodynamic Forces On An Airfoil S.Kandwal 1, Dr. S. Singh 2 1 M. Tech Scholar, 2 Associate Professor Department of Mechanical Engineering, Bipin Tripathi
Comparison of Turbulence Models in the Flow over a Backward-Facing Step Priscila Pires Araujo 1, André Luiz Tenório Rezende 2
 Comparison of Turbulence Models in the Flow over a Backward-Facing Step Priscila Pires Araujo 1, André Luiz Tenório Rezende 2 Department of Mechanical and Materials Engineering, Military Engineering Institute,
Before we consider two canonical turbulent flows we need a general description of turbulence.
 Chapter 2 Canonical Turbulent Flows Before we consider two canonical turbulent flows we need a general description of turbulence. 2.1 A Brief Introduction to Turbulence One way of looking at turbulent
Side-View Mirror Vibrations Induced Aerodynamically by Separating Vortices
 Open Journal of Fluid Dynamics, 2016, 6, 42-56 Published Online March 2016 in SciRes. http://www.scirp.org/journal/ojfd http://dx.doi.org/10.4236/ojfd.2016.61004 Side-View Mirror Vibrations Induced Aerodynamically
CFD Analysis for Thermal Behavior of Turbulent Channel Flow of Different Geometry of Bottom Plate
 International Journal Of Engineering Research And Development e-issn: 2278-067X, p-issn: 2278-800X, www.ijerd.com Volume 13, Issue 9 (September 2017), PP.12-19 CFD Analysis for Thermal Behavior of Turbulent
Numerical Simulation of Flow Around An Elliptical Cylinder at High Reynolds Numbers
 International Journal of Fluids Engineering. ISSN 0974-3138 Volume 5, Number 1 (2013), pp. 29-37 International Research Publication House http://www.irphouse.com Numerical Simulation of Flow Around An
Given the water behaves as shown above, which direction will the cylinder rotate?
 water stream fixed but free to rotate Given the water behaves as shown above, which direction will the cylinder rotate? ) Clockwise 2) Counter-clockwise 3) Not enough information F y U 0 U F x V=0 V=0
Fluid Dynamic Simulations of Wind Turbines. John Abraham, Brian Plourde, Greg Mowry University of St. Thomas
 Fluid Dynamic Simulations of Wind Turbines John Abraham, Brian Plourde, Greg Mowry University of St. Thomas 1 Presentation Overview Why vertical-axis turbines? How are they modeled? How much energy can
DEVELOPMENT OF CFD MODEL FOR A SWIRL STABILIZED SPRAY COMBUSTOR
 DRAFT Proceedings of ASME IMECE: International Mechanical Engineering Conference & Exposition Chicago, Illinois Nov. 5-10, 2006 IMECE2006-14867 DEVELOPMENT OF CFD MODEL FOR A SWIRL STABILIZED SPRAY COMBUSTOR
CHAPTER 7 NUMERICAL MODELLING OF A SPIRAL HEAT EXCHANGER USING CFD TECHNIQUE
 CHAPTER 7 NUMERICAL MODELLING OF A SPIRAL HEAT EXCHANGER USING CFD TECHNIQUE In this chapter, the governing equations for the proposed numerical model with discretisation methods are presented. Spiral
OpenFOAM Simulations for MAV Applications
 16 th Annual CFD Symposium 11th-12th August 2014, Bangalore 1 OpenFOAM Simulations for MAV Applications Syed Zahid*, A. Rajesh, M.B. Subrahmanya, B.N. Rajani *Student, Dept. of Mech. Engg, SDM, Dharwad,
Hybrid LES RANS Method Based on an Explicit Algebraic Reynolds Stress Model
 Hybrid RANS Method Based on an Explicit Algebraic Reynolds Stress Model Benoit Jaffrézic, Michael Breuer and Antonio Delgado Institute of Fluid Mechanics, LSTM University of Nürnberg bjaffrez/breuer@lstm.uni-erlangen.de
ABSTRACT I. INTRODUCTION
 2016 IJSRSET Volume 2 Issue 4 Print ISSN : 2395-1990 Online ISSN : 2394-4099 Themed Section: Engineering and Technology Analysis of Compressible Effect in the Flow Metering By Orifice Plate Using Prasanna
Drag reduction in a class 8 truck - scaled down model
 Drag reduction in a class 8 truck - scaled down model Vishwa Krishna. R 1, Suwathy. R 2, Pragadeesh. M 1, and Venkatesan. M 1,* 1 School of Mechanical Engineering, SASTRA Deemed University, Tirumalaisamudram,
Heat Transfer from An Impingement Jet onto A Heated Half-Prolate Spheroid Attached to A Heated Flat Plate
 1 nd International Conference on Environment and Industrial Innovation IPCBEE vol.35 (1) (1) IACSIT Press, Singapore Heat Transfer from An Impingement Jet onto A Heated Half-Prolate Spheroid Attached to
Colloquium FLUID DYNAMICS 2012 Institute of Thermomechanics AS CR, v.v.i., Prague, October 24-26, 2012 p.
 Colloquium FLUID DYNAMICS 212 Institute of Thermomechanics AS CR, v.v.i., Prague, October 24-26, 212 p. ON A COMPARISON OF NUMERICAL SIMULATIONS OF ATMOSPHERIC FLOW OVER COMPLEX TERRAIN T. Bodnár, L. Beneš
Turbulence modelling. Sørensen, Niels N. Publication date: Link back to DTU Orbit
 Downloaded from orbit.dtu.dk on: Dec 19, 2017 Turbulence modelling Sørensen, Niels N. Publication date: 2010 Link back to DTU Orbit Citation (APA): Sørensen, N. N. (2010). Turbulence modelling. Paper presented
Attached and Detached Eddy Simulation
 Attached and Detached Eddy Simulation Philippe R. Spalart Boeing Commercial Airplanes, Seattle, USA Mikhail K. Strelets Saint-Petersburg Polytechnic University and New Technologies and Services (NTS),
RECONSTRUCTION OF TURBULENT FLUCTUATIONS FOR HYBRID RANS/LES SIMULATIONS USING A SYNTHETIC-EDDY METHOD
 RECONSTRUCTION OF TURBULENT FLUCTUATIONS FOR HYBRID RANS/LES SIMULATIONS USING A SYNTHETIC-EDDY METHOD N. Jarrin 1, A. Revell 1, R. Prosser 1 and D. Laurence 1,2 1 School of MACE, the University of Manchester,
Numerical Investigation of Thermal Performance in Cross Flow Around Square Array of Circular Cylinders
 Numerical Investigation of Thermal Performance in Cross Flow Around Square Array of Circular Cylinders A. Jugal M. Panchal, B. A M Lakdawala 2 A. M. Tech student, Mechanical Engineering Department, Institute
GENERALISATION OF THE TWO-SCALE MOMENTUM THEORY FOR COUPLED WIND TURBINE/FARM OPTIMISATION
 25 th National Symposium on Wind Engineering, Tokyo, Japan, 3-5 December 2018 第 25 回風工学シンポジウム (2018) GENERALISATION OF THE TWO-SCALE MOMENTUM THEORY FOR COUPLED WIND TURBINE/FARM OPTIMISATION Takafumi
Iterative Learning Control for Smart Rotors in Wind turbines First Results
 Iterative Learning Control for Smart Rotors in Wind turbines First Results Owen Tutty 1, Mark Blackwell 2, Eric Rogers 3, Richard Sandberg 1 1 Engineering and the Environment University of Southampton
Department of Energy Sciences, LTH
 Department of Energy Sciences, LTH MMV11 Fluid Mechanics LABORATION 1 Flow Around Bodies OBJECTIVES (1) To understand how body shape and surface finish influence the flow-related forces () To understand
Principles of Convection
 Principles of Convection Point Conduction & convection are similar both require the presence of a material medium. But convection requires the presence of fluid motion. Heat transfer through the: Solid
LES ANALYSIS ON CYLINDER CASCADE FLOW BASED ON ENERGY RATIO COEFFICIENT
 2th International Conference on Heat Transfer, Fluid Mechanics and Thermodynamics ANALYSIS ON CYLINDER CASCADE FLOW BASED ON ENERGY RATIO COEFFICIENT Wang T.*, Gao S.F., Liu Y.W., Lu Z.H. and Hu H.P. *Author
Numerical Simulation of Flow Separation Control using Multiple DBD Plasma Actuators
 Journal of Applied Fluid Mechanics, Vol. 9, No. 4, pp. 1865-1875, 2016. Available online at www.jafmonline.net, ISSN 1735-3572, EISSN 1735-3645. DOI: 10.18869/acadpub.jafm.68.235.25325 Numerical Simulation
PEMP ACD2505. M.S. Ramaiah School of Advanced Studies, Bengaluru
 Two-Dimensional Potential Flow Session delivered by: Prof. M. D. Deshpande 1 Session Objectives -- At the end of this session the delegate would have understood PEMP The potential theory and its application
A Computational Fluid Dynamics Investigation of Solar Air Heater Duct Provided with Inclined Circular Ribs as Artificial Roughness
 Bonfring International Journal of Industrial Engineering and Management Science, Vol. 4, No. 3, August 2014 115 A Computational Fluid Dynamics Investigation of Solar Air Heater Duct Provided with Inclined