Similarity Measures and Clustering In Genetics
|
|
|
- Warren Bryan
- 6 years ago
- Views:
Transcription
1 Similarity Measures and Clustering In Genetics Daniel Lawson Heilbronn Institute for Mathematical Research School of mathematics University of Bristol
2 Talk outline Introduction Genetic data and overview 1 Generic approaches Similarity measures Similarity based clustering Spectral methods 2 Genetics models Direct model-based clustering Model-based similarity measures ChromoPainter/FineSTRUCTURE clustering 3 Results for real data 2/40

3 Motivation: Models and Clustering Models for clustering essential Choice of measure strongly influences clustering Example: Random walk 3/40
 SNP l Correlations due to relatedness Genome position O(106-9) Correlations due to linkage")
4 Genetics data Individual i Individuals - O(103+) SNP l Correlations due to relatedness Genome position O(106-9) Correlations due to linkage 4/40
 Step 1: Similarity matrix Step 2: Clustering")

5 Outline: The process SNPs O(106-9) Populations O(102-3) Step 1: Similarity matrix Step 2: Clustering Individuals O(103-4) Step 1: SNPs are converted to similarity matrices Step 2: Analyse the population structure 5/40
6 Simulated data Simulate data using 'real' conditions Sequence data including linkage disequilibrium, random mating within populations, 'complex' demography Change how much data we show the models 6/40
7 Part 1. Generic Approaches Treat SNPs as independent features Cluster individuals as independent samples from some clustering distribution on Individual Number i SNP location l 7/40
8 Clustering K clusters (which should be inferred) Find 'best' assignment of samples into clusters 'Best' is some score, potentially using: Raw Data (Direct) Distances between points (Similaritybased) Dimensionality reduction (Spectral) 8/40
 Almost")


9 Similarity Measures (between SNPs) Almost infinite number of choices... e.g. Cosine distance TF-IDF (term Frequency, inverse document frequency) Allele Sharing distance/identity by state Edit distance/'norm' distance e.g. L1, L2 Covariance Exponential Normalised covariance Normalised count of shared alleles 9/40

10 Similarity measures of simulated data 10/40
11 NCOV 11/40
 (suitably")
 Low dimensional High")
12 Dimensionality reduction SVD of = PCA of = MDS on all give (suitably normalised) (suitably normalised) Eigenvalues Eigenvectors (Left Eigenvectors do differ) Low dimensional High dimensional... 12/40
13 How many dimensions? Scree Kaiser All Eigenvalue orientated... Kaiser (1960) criterion (EV>1) Scree test (Cattell 1966, large jump in EV spectrum ) Velicer's MAP criterion Horn's Parallel Analysis (PA) criterion Also consider Eigenvectors Tracy-Widom distribution 13/40
14 How many dimensions? N N MAP (Minimum Average Partial Correlation), Velicer 1976 Remove largest eigenvalue Compute (partial) correlation between remaining eigenvectors and the data (accounting for previous eigenvectors) Repeat Parallel Analysis (Horn 1965) Tracy-Widom Distribution (TW 1994, Patterson et al 2006) Theoretical distribution of the EVs of an L by N matrix (L is the (effective) number of SNPs) Remove biggest EV if bigger than some N quantile Daniel Lawson, University of Bristol Repeat Simulate many matrices the same shape, with the same mean and variance as the data Keep all components bigger than some quantile of the simulated values L 14/40
15 Clustering: MVN Multivariate Normal ( Soft K-Means, implemented by MCLUST in R) Infer mean and variance for each cluster BIC model selection for K 15/40
16 Clustering: K-Means Minimise Euclidean distance to cluster centers Hard K-Means (as uses the same distance penalty as MVN, but imposes a strict boundary) K estimated using the Calinski (1974) criterion (comparing variance within clusters to that between clusters) 16/40
17 Clustering: Hierarchical methods Successively merge closest samples (or successively split... lots of ways to define close ) e.g. UPGMA (Unweighted-Pair Group Method with Arithmetic Mean). Close here is distance to the centroid of the clusters (e.g. Ward's (1963) minimum variance criterion) K estimated using the Calinski (1974) criterion 17/40
18 NCOV NCOV NCOV 18/40
19 An algorithm to generate papers from Student Projects: Roll 3 dice and refer to the table: Dice roll Similarity Measure Dimensionality Reduction Clustering Algorithm 1 IBD/ASD None MVN 2 Covariance PCA - MAP K-Means 3 Normalised Covariance PCA - Parallel Analysis Hierarchical (standard) 4 Something from Document clustering PCA - Tracy-Widom Hierarchical (iteratively modifying data) 5 Something modelbased Spectral Graph Theory Something from CS literature 6 Something else... Something from image??? analysis 19/40
20 Part 2: Genetics models Similarity measures matter more than clustering model MVN model seems best On PCA, all models do similarly well No similarity measure is good enough Time to understand why... 20/40

21 Ancestry process Each generation randomly chooses parent Red individuals ancestors to those sampled Take limit Time Present keeping constant Rate of coalescence between pairs Lots known about this Coalescent Tree distribution. 21/40
22 Genetic model - Ancestral Tree Time towards present Hein, Schierup and Wiuf 'Gene Genealogies, Variation and Evolution', OUP /40
23 Ancestry process with recombination Probability of getting DNA from two parents Creates a graph structure Coalescence rates unchanged... But now a birth/death process Easily simulated but few analytical results Time Present 23/40
24 Ancestral Recombination Graph Time towards present Hein, Schierup and Wiuf 'Gene Genealogies, Variation and Evolution', OUP /40
25 Ancestral Recombination Graph Summary Ancestral Recombination Graph (ARG) model backwards in time, ignore unobserved ancestors is equivalent to the Forwards in time model Random mating, within known size populations No selection Inference under the ARG is impossible for reasonable datasets But when recombination is large, each SNP is independently drawn from a random tree 25/40
 Some SNP distribution i.e. Counting identical SNPs captures all the information in the tree How do times in tree relate to population structure?")
26 Time to Most Recent Common Ancestor Random Tree Ancestral Population Mutation Recall that each SNP has a random tree McVean (2009) showed that (where f is simple and known) Some SNP distribution i.e. Counting identical SNPs captures all the information in the tree How do times in tree relate to population structure? Present populations 26/40
 Wright studied a related model, leads to Beta distribution of SNP frequency Normal distribution approximation exists.")
27 Genetic drift Ancestral Population Mutation Some SNP distribution Kimura derived exact distribution for this case... (nasty) Wright studied a related model, leads to Beta distribution of SNP frequency Normal distribution approximation exists... simpler to handle covariance effects Present populations 'Independent drift' of SNP distribution (Recall relationship to diffusion) 27/40
28 Direct Model-based clustering Population model: Beta distribution for SNP frequencies in each Assume individuals exchangeable within populations Gives likelihood for frequency of SNPs Binomial distribution Assume no linkage (linkage approximations exist) Gives popular STRUCTURE* model Still can't cope with large datasets Can we do this well on genomic (linked) data? *Pritchard, Stephens and Donnelly, Genetics, 155: , /40

29 ChromoPainter 'Coancestry' similarity matrix Unlinked limit: normalised Daniel Lawson,sharing University of Bristol allele See: Li and Stephens, Genetics 165: , /40
30 ESU 30/40


31 FineSTRUCTURE Population structure model Individuals exchangeable within populations Populations donate chunks independently at a characteristic rate Coancestry matrix Population assignment Donation frequency of population Number of individuals to donate from 31/40
.")

32 Probability of a partition Dirichlet Process prior for partition Rows of (i.e. biological parameters)... : ) are Dirichlet (containing hidden so conjugate, and we integrate out (Idea: add each individual, update Dirichlet posterior, use as prior for the next individual) 32/40
33 Proven theoretical results To O(N), Coancestry matrix is a rotation of the eigenvector matrix If SNPs are uncorrelated and the number of individuals is large To O(N), FineSTRUCTURE likelihood is equivalent to the STRUCTURE* likelihood if SNPs are uncorrelated, And the MVN drift is weak, likelihood with a genotyped SNPs are not very rare structured covariance... With linkage model we do better. *Pritchard, Stephens and Donnelly, Genetics, 155: , 2000 Calculations due to Simon Myers 33/40
34 Comparison of linked methods 34/40
35 HGDP data 938 Individuals worldwide 650k SNPs, linked (but relatively weakly) Known to contain structure at all scales, but previous models missed this Similarity approaches can analyse the whole data Focus on East Asian individuals 35/40
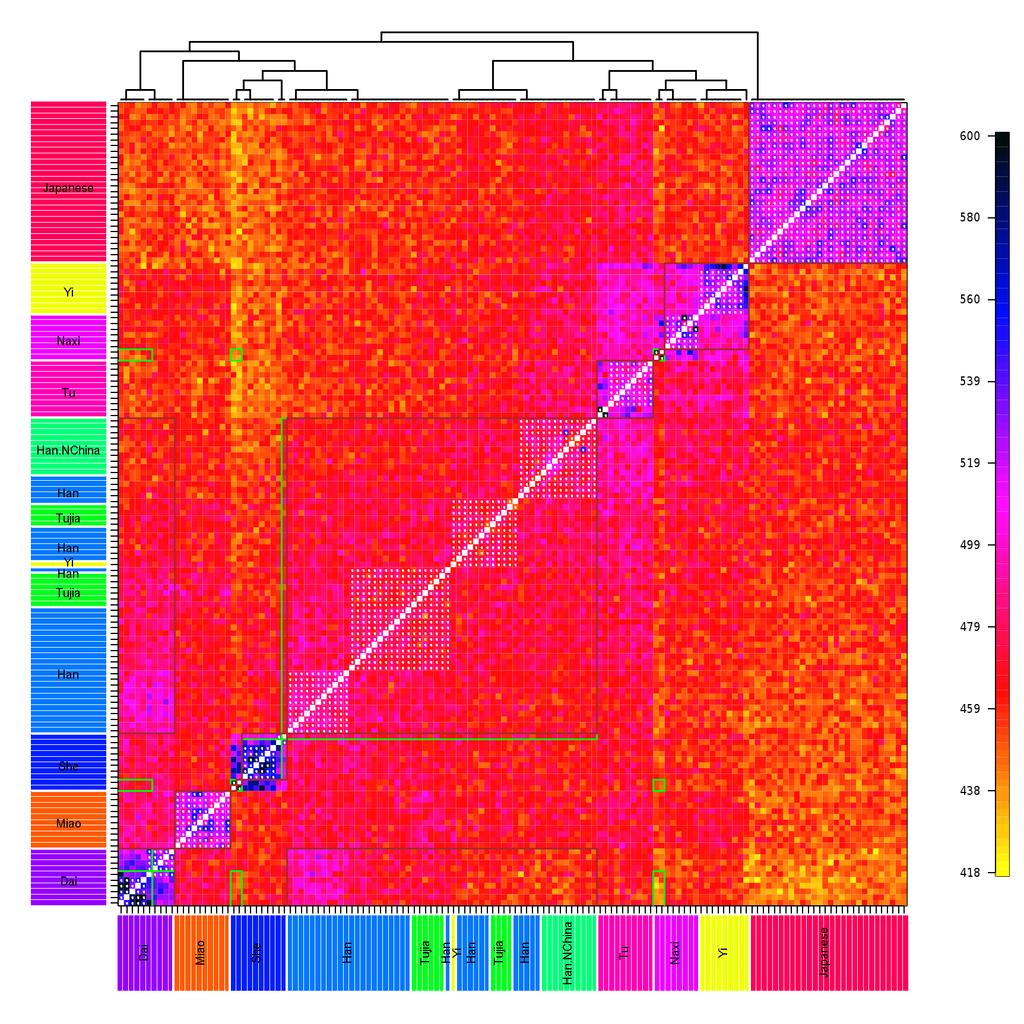
36 ChromoPainter 36/40

37 ChromoPainter Eigenvector space 37/40

38 ChromoPainter Correlation 38/40
39 Conclusions In General Models matter Summaries are part of the model 'Model-Free' approaches are still making assumptions! Genetics Normalising variance is important other unlinked measures are all worse Linked models extract more information No 'correct' linked model at this stage! ChromoPainter/FineSTRUCTURE pipeline is the most robust option 39/40
 (CP algorithm) Simon Myers")
 (CP/FS concept) Peter Green (Bristol)")

40 Acknowledgements: finestructure Garrett Hellenthal (Oxford) (CP algorithm) Simon Myers (Oxford) (theory) Daniel Falush (Max Planck Institute) (CP/FS concept) Peter Green (Bristol) Grant, support Bluecrystal HPC Bristol FineSTRUCTURE Code & GUI: 40/40

41 FastIBD 41/40
42 FastIBD (Browning and Browning 2011) Alternative linked model: Identify r closest segments of DNA for each pair of individuals Genetic lengths of each are related to time since common ancestor Similarity measure: sum of the genetic lengths found for each pair Somewhat heuristic, has some tuning parameters, but empirically works well 42/40

43 Comparison of clusterings 43/40
44 44/40

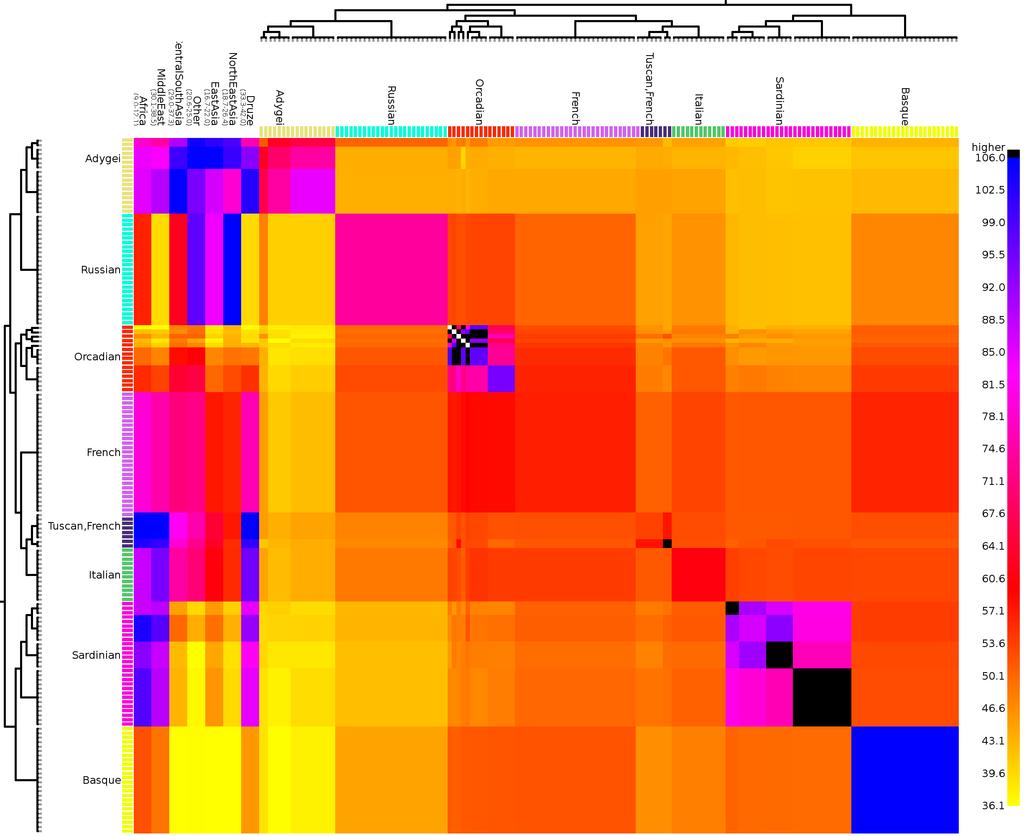
45 Tuscan Italian French Structure in the copy matrix Orcadian Russian Adygei Sardinian Tuscan Italian French Orcadian Russian Adygei Sardinian Basque Basque 45
46 Weak Biological Model for prior 'Correct' Ancestral Recombination Graph for the limit of large populations at large time with simple population structure Ancestral population Frequency of donating Time (increasing F) 12 P2 P1 K P K 1 PK F 46/40
47 Posterior evaluation MCMC update of hyperparameters and partitions Partition moves: Move an individual Merge Split Merge and resplit Merge/split 'nearly Gibbs' move: p(q m ; a, b)= p(q1) p(q 2 q1 ) p(qm q1: m 1) p (q m=a) n a F ( x m P m )dh <m, S ( P m ) a (Not exact as the 'unsplit' population interacts with the remaining dataset) Simple case: Pella and Masuda Canadian J. Fish. Aquatic Science 63: , /40


48 Clustering into k clusters Find similar individuals Three main approaches: Cluster on raw data Cluster on similarity matrix Cluster on dimensionality reduced version of data, e.g. MDS/PCA/SVD Recall: Lowest dimension description usually best... Raw data approach terrible here (without good model) 48/40
49 The future Admixture model Pure population structure is not correct recent mixing leads to admixture Seek conjugate mixture model for individuals Hierarchical Dirichlet Process! Interpretation: Pure populations created by drift, we see mixtures Better model: Allow drift and admixture to both occur in real time Requires more sophisticated model, can we keep conjugacy? (Matrix Coalescent* results available) Daniel Lawson, University of Bristol diffusion*wooding Dirichlet tree** andconcept Rogers, Genetics, 161: , 2002 **Neal, in J. M. Bernardo, et al. (ed.), Bayesian Statistics 7, pp , /40
50 Mixing: Pairwise coincidence (Individual labels not shown) Run 1 HGDP DATA (650k SNPs, 938 Individuals) Run 2 (data for the hardest continent, Central South Asia) 50/40
51 MAP tree: whole world HGDP data Continuous populations ~650,000 SNPs 938 individuals Continents Self-ID'd populations 51/40
52 Posterior evaluation: building block Sample from posterior p(q m ; a, b)= p(q1) p(q 2 q1 ) p(qm q1: m 1) Metropolis-Hastings proposal for a split: Random individuals creates population a and b from c Move rest from c with probability p (m ; a) n a F ( x m p m )dh <m, S ( p ) P (S a,{i=1,, m }) P (S c,{i=1,, m }) na P (S a, {i=1,, m 1}) P (S c,{i=1,, m 1}) m (Not exact as the 'unsplit' population interacts with the remaining dataset) Exact case: Pella and Masuda Canadian J. Fish. Aquatic Science 63: , /40
53 Probability of a partition Rows of P ab are Dirichlet Conjugate to multinomial, sum to 1 Weak prior Compute posterior incrementally due to conjugacy p( x a q)= F ( x m P a, q)dh m a dh <m, S a <m, S a ( Pa) ( P a )= Dirichlet ( P a ;{βab + x <m, b }b=1,, K ) (Idea: add each individual, update Dirichlet posterior, use as prior for the next individual) 53/40
54 Final model Posterior K K a x ab /c ab p X n a x a a b=1 ab n bx a=1 K ab Prior for hyperparameters { if a b if a=b Drift due to mutation Ancestral donation frequency ab= V b 1 V b = 1 F / F Drift in allele frequency 54/40
55 Posterior visualisation Too many populations! Pairwise coincidence matrix Create MAP (maximum a posteriori) tree from MAP partition Show partition split posterior support (Population summary of data matrix X) 55/40
Populations in statistical genetics
 Populations in statistical genetics What are they, and how can we infer them from whole genome data? Daniel Lawson Heilbronn Institute, University of Bristol www.paintmychromosomes.com Work with: January
Supplementary Materials for
 www.sciencemag.org/content/343/6172/747/suppl/dc1 Supplementary Materials for A Genetic Atlas of Human Admixture History Garrett Hellenthal, George B. J. Busby, Gavin Band, James F. Wilson, Cristian Capelli,
Learning ancestral genetic processes using nonparametric Bayesian models
 Learning ancestral genetic processes using nonparametric Bayesian models Kyung-Ah Sohn October 31, 2011 Committee Members: Eric P. Xing, Chair Zoubin Ghahramani Russell Schwartz Kathryn Roeder Matthew
Non-Parametric Bayes
 Non-Parametric Bayes Mark Schmidt UBC Machine Learning Reading Group January 2016 Current Hot Topics in Machine Learning Bayesian learning includes: Gaussian processes. Approximate inference. Bayesian
The Combinatorial Interpretation of Formulas in Coalescent Theory
 The Combinatorial Interpretation of Formulas in Coalescent Theory John L. Spouge National Center for Biotechnology Information NLM, NIH, DHHS spouge@ncbi.nlm.nih.gov Bldg. A, Rm. N 0 NCBI, NLM, NIH Bethesda
Clustering using Mixture Models
 Clustering using Mixture Models The full posterior of the Gaussian Mixture Model is p(x, Z, µ,, ) =p(x Z, µ, )p(z )p( )p(µ, ) data likelihood (Gaussian) correspondence prob. (Multinomial) mixture prior
6 Introduction to Population Genetics
 70 Grundlagen der Bioinformatik, SoSe 11, D. Huson, May 19, 2011 6 Introduction to Population Genetics This chapter is based on: J. Hein, M.H. Schierup and C. Wuif, Gene genealogies, variation and evolution,
Multivariate analysis of genetic data: exploring groups diversity
 Multivariate analysis of genetic data: exploring groups diversity T. Jombart Imperial College London Bogota 01-12-2010 1/42 Outline Introduction Clustering algorithms Hierarchical clustering K-means Multivariate
6 Introduction to Population Genetics
 Grundlagen der Bioinformatik, SoSe 14, D. Huson, May 18, 2014 67 6 Introduction to Population Genetics This chapter is based on: J. Hein, M.H. Schierup and C. Wuif, Gene genealogies, variation and evolution,
Overview of clustering analysis. Yuehua Cui
 Overview of clustering analysis Yuehua Cui Email: cuiy@msu.edu http://www.stt.msu.edu/~cui A data set with clear cluster structure How would you design an algorithm for finding the three clusters in this
Modelling Genetic Variations with Fragmentation-Coagulation Processes
 Modelling Genetic Variations with Fragmentation-Coagulation Processes Yee Whye Teh, Charles Blundell, Lloyd Elliott Gatsby Computational Neuroscience Unit, UCL Genetic Variations in Populations Inferring
Bayesian Methods for Machine Learning
 Bayesian Methods for Machine Learning CS 584: Big Data Analytics Material adapted from Radford Neal s tutorial (http://ftp.cs.utoronto.ca/pub/radford/bayes-tut.pdf), Zoubin Ghahramni (http://hunch.net/~coms-4771/zoubin_ghahramani_bayesian_learning.pdf),
Frequency Spectra and Inference in Population Genetics
 Frequency Spectra and Inference in Population Genetics Although coalescent models have come to play a central role in population genetics, there are some situations where genealogies may not lead to efficient
CPSC 540: Machine Learning
 CPSC 540: Machine Learning MCMC and Non-Parametric Bayes Mark Schmidt University of British Columbia Winter 2016 Admin I went through project proposals: Some of you got a message on Piazza. No news is
Advanced Machine Learning
 Advanced Machine Learning Nonparametric Bayesian Models --Learning/Reasoning in Open Possible Worlds Eric Xing Lecture 7, August 4, 2009 Reading: Eric Xing Eric Xing @ CMU, 2006-2009 Clustering Eric Xing
Gentle Introduction to Infinite Gaussian Mixture Modeling
 Gentle Introduction to Infinite Gaussian Mixture Modeling with an application in neuroscience By Frank Wood Rasmussen, NIPS 1999 Neuroscience Application: Spike Sorting Important in neuroscience and for
Pattern Recognition and Machine Learning
 Christopher M. Bishop Pattern Recognition and Machine Learning ÖSpri inger Contents Preface Mathematical notation Contents vii xi xiii 1 Introduction 1 1.1 Example: Polynomial Curve Fitting 4 1.2 Probability
Supplementary Materials: Efficient moment-based inference of admixture parameters and sources of gene flow
 Supplementary Materials: Efficient moment-based inference of admixture parameters and sources of gene flow Mark Lipson, Po-Ru Loh, Alex Levin, David Reich, Nick Patterson, and Bonnie Berger 41 Surui Karitiana
Methods for Cryptic Structure. Methods for Cryptic Structure
 Case-Control Association Testing Review Consider testing for association between a disease and a genetic marker Idea is to look for an association by comparing allele/genotype frequencies between the cases
Feature Engineering, Model Evaluations
 Feature Engineering, Model Evaluations Giri Iyengar Cornell University gi43@cornell.edu Feb 5, 2018 Giri Iyengar (Cornell Tech) Feature Engineering Feb 5, 2018 1 / 35 Overview 1 ETL 2 Feature Engineering
Data Exploration and Unsupervised Learning with Clustering
 Data Exploration and Unsupervised Learning with Clustering Paul F Rodriguez,PhD San Diego Supercomputer Center Predictive Analytic Center of Excellence Clustering Idea Given a set of data can we find a
Computer Vision Group Prof. Daniel Cremers. 14. Clustering
 Group Prof. Daniel Cremers 14. Clustering Motivation Supervised learning is good for interaction with humans, but labels from a supervisor are hard to obtain Clustering is unsupervised learning, i.e. it
Principal component analysis (PCA) for clustering gene expression data
 for clustering gene expression data") Principal component analysis (PCA) for clustering gene expression data Ka Yee Yeung Walter L. Ruzzo Bioinformatics, v17 #9 (2001) pp 763-774 1 Outline of talk Background and motivation Design of our empirical
Principal component analysis (PCA) for clustering gene expression data Ka Yee Yeung Walter L. Ruzzo Bioinformatics, v17 #9 (2001) pp 763-774 1 Outline of talk Background and motivation Design of our empirical
The Bayesian Choice. Christian P. Robert. From Decision-Theoretic Foundations to Computational Implementation. Second Edition.
 Christian P. Robert The Bayesian Choice From Decision-Theoretic Foundations to Computational Implementation Second Edition With 23 Illustrations ^Springer" Contents Preface to the Second Edition Preface
EVOLUTIONARY DISTANCES
 EVOLUTIONARY DISTANCES FROM STRINGS TO TREES Luca Bortolussi 1 1 Dipartimento di Matematica ed Informatica Università degli studi di Trieste luca@dmi.units.it Trieste, 14 th November 2007 OUTLINE 1 STRINGS:
Computational Systems Biology: Biology X
 Bud Mishra Room 1002, 715 Broadway, Courant Institute, NYU, New York, USA Human Population Genomics Outline 1 2 Damn the Human Genomes. Small initial populations; genes too distant; pestered with transposons;
Genetic Association Studies in the Presence of Population Structure and Admixture
 Genetic Association Studies in the Presence of Population Structure and Admixture Purushottam W. Laud and Nicholas M. Pajewski Division of Biostatistics Department of Population Health Medical College
Machine Learning - MT Clustering
 Machine Learning - MT 2016 15. Clustering Varun Kanade University of Oxford November 28, 2016 Announcements No new practical this week All practicals must be signed off in sessions this week Firm Deadline:
Gene Genealogies Coalescence Theory. Annabelle Haudry Glasgow, July 2009
 Gene Genealogies Coalescence Theory Annabelle Haudry Glasgow, July 2009 What could tell a gene genealogy? How much diversity in the population? Has the demographic size of the population changed? How?
Y-STR: Haplotype Frequency Estimation and Evidence Calculation
 Calculating evidence Further work Questions and Evidence Mikkel, MSc Student Supervised by associate professor Poul Svante Eriksen Department of Mathematical Sciences Aalborg University, Denmark June 16
Introduction to Machine Learning. PCA and Spectral Clustering. Introduction to Machine Learning, Slides: Eran Halperin
 1 Introduction to Machine Learning PCA and Spectral Clustering Introduction to Machine Learning, 2013-14 Slides: Eran Halperin Singular Value Decomposition (SVD) The singular value decomposition (SVD)
STA 4273H: Statistical Machine Learning
 STA 4273H: Statistical Machine Learning Russ Salakhutdinov Department of Statistics! rsalakhu@utstat.toronto.edu! http://www.utstat.utoronto.ca/~rsalakhu/ Sidney Smith Hall, Room 6002 Lecture 3 Linear
BIOINFORMATICS. Gilles Guillot
 BIOINFORMATICS Vol. 00 no. 00 2008 Pages 1 19 Supplementary material for: Inference of structure in subdivided populations at low levels of genetic differentiation. The correlated allele frequencies model
Bayesian Models in Machine Learning
 Bayesian Models in Machine Learning Lukáš Burget Escuela de Ciencias Informáticas 2017 Buenos Aires, July 24-29 2017 Frequentist vs. Bayesian Frequentist point of view: Probability is the frequency of
Introduction to Probabilistic Machine Learning
 Introduction to Probabilistic Machine Learning Piyush Rai Dept. of CSE, IIT Kanpur (Mini-course 1) Nov 03, 2015 Piyush Rai (IIT Kanpur) Introduction to Probabilistic Machine Learning 1 Machine Learning
STA 4273H: Statistical Machine Learning
 STA 4273H: Statistical Machine Learning Russ Salakhutdinov Department of Computer Science! Department of Statistical Sciences! rsalakhu@cs.toronto.edu! h0p://www.cs.utoronto.ca/~rsalakhu/ Lecture 7 Approximate
Maximum Likelihood (ML), Expectation Maximization (EM) Pieter Abbeel UC Berkeley EECS
, Expectation Maximization (EM) Pieter Abbeel UC Berkeley EECS") Maximum Likelihood (ML), Expectation Maximization (EM) Pieter Abbeel UC Berkeley EECS Many slides adapted from Thrun, Burgard and Fox, Probabilistic Robotics Outline Maximum likelihood (ML) Priors, and
Maximum Likelihood (ML), Expectation Maximization (EM) Pieter Abbeel UC Berkeley EECS Many slides adapted from Thrun, Burgard and Fox, Probabilistic Robotics Outline Maximum likelihood (ML) Priors, and
Contents. Part I: Fundamentals of Bayesian Inference 1
 Contents Preface xiii Part I: Fundamentals of Bayesian Inference 1 1 Probability and inference 3 1.1 The three steps of Bayesian data analysis 3 1.2 General notation for statistical inference 4 1.3 Bayesian
Mathematical models in population genetics II
 Mathematical models in population genetics II Anand Bhaskar Evolutionary Biology and Theory of Computing Bootcamp January 1, 014 Quick recap Large discrete-time randomly mating Wright-Fisher population
Estimating Evolutionary Trees. Phylogenetic Methods
 Estimating Evolutionary Trees v if the data are consistent with infinite sites then all methods should yield the same tree v it gets more complicated when there is homoplasy, i.e., parallel or convergent
Variational Scoring of Graphical Model Structures
 Variational Scoring of Graphical Model Structures Matthew J. Beal Work with Zoubin Ghahramani & Carl Rasmussen, Toronto. 15th September 2003 Overview Bayesian model selection Approximations using Variational
Notes on Population Genetics
 Notes on Population Genetics Graham Coop 1 1 Department of Evolution and Ecology & Center for Population Biology, University of California, Davis. To whom correspondence should be addressed: gmcoop@ucdavis.edu
Clusters. Unsupervised Learning. Luc Anselin. Copyright 2017 by Luc Anselin, All Rights Reserved
 Clusters Unsupervised Learning Luc Anselin http://spatial.uchicago.edu 1 curse of dimensionality principal components multidimensional scaling classical clustering methods 2 Curse of Dimensionality 3 Curse
Integer Programming in Computational Biology. D. Gusfield University of California, Davis Presented December 12, 2016.!
 Integer Programming in Computational Biology D. Gusfield University of California, Davis Presented December 12, 2016. There are many important phylogeny problems that depart from simple tree models: Missing
p(d g A,g B )p(g B ), g B
p(g B ), g B") Supplementary Note Marginal effects for two-locus models Here we derive the marginal effect size of the three models given in Figure 1 of the main text. For each model we assume the two loci (A and B)
Supplementary Note Marginal effects for two-locus models Here we derive the marginal effect size of the three models given in Figure 1 of the main text. For each model we assume the two loci (A and B)
Visualizing Population Genetics
 Visualizing Population Genetics Supervisors: Rachel Fewster, James Russell, Paul Murrell Louise McMillan 1 December 2015 Louise McMillan Visualizing Population Genetics 1 December 2015 1 / 29 Outline 1
Simultaneous Inference for Multiple Testing and Clustering via Dirichlet Process Mixture Models
 Simultaneous Inference for Multiple Testing and Clustering via Dirichlet Process Mixture Models David B. Dahl Department of Statistics Texas A&M University Marina Vannucci, Michael Newton, & Qianxing Mo
27 : Distributed Monte Carlo Markov Chain. 1 Recap of MCMC and Naive Parallel Gibbs Sampling
 10-708: Probabilistic Graphical Models 10-708, Spring 2014 27 : Distributed Monte Carlo Markov Chain Lecturer: Eric P. Xing Scribes: Pengtao Xie, Khoa Luu In this scribe, we are going to review the Parallel
PMR Learning as Inference
 Outline PMR Learning as Inference Probabilistic Modelling and Reasoning Amos Storkey Modelling 2 The Exponential Family 3 Bayesian Sets School of Informatics, University of Edinburgh Amos Storkey PMR Learning
Figure S1: The model underlying our inference of the age of ancient genomes
 A genetic method for dating ancient genomes provides a direct estimate of human generation interval in the last 45,000 years Priya Moorjani, Sriram Sankararaman, Qiaomei Fu, Molly Przeworski, Nick Patterson,
Unsupervised machine learning
 Chapter 9 Unsupervised machine learning Unsupervised machine learning (a.k.a. cluster analysis) is a set of methods to assign objects into clusters under a predefined distance measure when class labels
Phylogenetic Tree Reconstruction
 I519 Introduction to Bioinformatics, 2011 Phylogenetic Tree Reconstruction Yuzhen Ye (yye@indiana.edu) School of Informatics & Computing, IUB Evolution theory Speciation Evolution of new organisms is driven
Ronald Christensen. University of New Mexico. Albuquerque, New Mexico. Wesley Johnson. University of California, Irvine. Irvine, California
 Texts in Statistical Science Bayesian Ideas and Data Analysis An Introduction for Scientists and Statisticians Ronald Christensen University of New Mexico Albuquerque, New Mexico Wesley Johnson University
Bayesian time series classification
 Bayesian time series classification Peter Sykacek Department of Engineering Science University of Oxford Oxford, OX 3PJ, UK psyk@robots.ox.ac.uk Stephen Roberts Department of Engineering Science University
Computational Genomics. Systems biology. Putting it together: Data integration using graphical models
 02-710 Computational Genomics Systems biology Putting it together: Data integration using graphical models High throughput data So far in this class we discussed several different types of high throughput
Outline. Binomial, Multinomial, Normal, Beta, Dirichlet. Posterior mean, MAP, credible interval, posterior distribution
 Outline A short review on Bayesian analysis. Binomial, Multinomial, Normal, Beta, Dirichlet Posterior mean, MAP, credible interval, posterior distribution Gibbs sampling Revisit the Gaussian mixture model
Multivariate analysis of genetic data exploring group diversity
 Multivariate analysis of genetic data exploring group diversity Thibaut Jombart, Marie-Pauline Beugin MRC Centre for Outbreak Analysis and Modelling Imperial College London Genetic data analysis with PR
BIOINFORMATICS. StructHDP: Automatic inference of number of clusters and population structure from admixed genotype data
 BIOINFORMATICS Vol. 00 no. 00 2011 Pages 1 9 StructHDP: Automatic inference of number of clusters and population structure from admixed genotype data Suyash Shringarpure 1, Daegun Won 1 and Eric P. Xing
Dr. Amira A. AL-Hosary
 Phylogenetic analysis Amira A. AL-Hosary PhD of infectious diseases Department of Animal Medicine (Infectious Diseases) Faculty of Veterinary Medicine Assiut University-Egypt Phylogenetic Basics: Biological
The problem Lineage model Examples. The lineage model
 The lineage model A Bayesian approach to inferring community structure and evolutionary history from whole-genome metagenomic data Jack O Brien Bowdoin College with Daniel Falush and Xavier Didelot Cambridge,
Clustering K-means. Machine Learning CSE546. Sham Kakade University of Washington. November 15, Review: PCA Start: unsupervised learning
 Clustering K-means Machine Learning CSE546 Sham Kakade University of Washington November 15, 2016 1 Announcements: Project Milestones due date passed. HW3 due on Monday It ll be collaborative HW2 grades
Bayesian Clustering with the Dirichlet Process: Issues with priors and interpreting MCMC. Shane T. Jensen
 Bayesian Clustering with the Dirichlet Process: Issues with priors and interpreting MCMC Shane T. Jensen Department of Statistics The Wharton School, University of Pennsylvania stjensen@wharton.upenn.edu
Closed-form sampling formulas for the coalescent with recombination
 0 / 21 Closed-form sampling formulas for the coalescent with recombination Yun S. Song CS Division and Department of Statistics University of California, Berkeley September 7, 2009 Joint work with Paul
Computer Vision Group Prof. Daniel Cremers. 10a. Markov Chain Monte Carlo
 Group Prof. Daniel Cremers 10a. Markov Chain Monte Carlo Markov Chain Monte Carlo In high-dimensional spaces, rejection sampling and importance sampling are very inefficient An alternative is Markov Chain
The Wright-Fisher Model and Genetic Drift
 The Wright-Fisher Model and Genetic Drift January 22, 2015 1 1 Hardy-Weinberg Equilibrium Our goal is to understand the dynamics of allele and genotype frequencies in an infinite, randomlymating population
Haplotyping as Perfect Phylogeny: A direct approach
 Haplotyping as Perfect Phylogeny: A direct approach Vineet Bafna Dan Gusfield Giuseppe Lancia Shibu Yooseph February 7, 2003 Abstract A full Haplotype Map of the human genome will prove extremely valuable
PCA and admixture models
 PCA and admixture models CM226: Machine Learning for Bioinformatics. Fall 2016 Sriram Sankararaman Acknowledgments: Fei Sha, Ameet Talwalkar, Alkes Price PCA and admixture models 1 / 57 Announcements HW1
CSci 8980: Advanced Topics in Graphical Models Analysis of Genetic Variation
 CSci 8980: Advanced Topics in Graphical Models Analysis of Genetic Variation Instructor: Arindam Banerjee November 26, 2007 Genetic Polymorphism Single nucleotide polymorphism (SNP) Genetic Polymorphism
Lecturer: David Blei Lecture #3 Scribes: Jordan Boyd-Graber and Francisco Pereira October 1, 2007
 COS 597C: Bayesian Nonparametrics Lecturer: David Blei Lecture # Scribes: Jordan Boyd-Graber and Francisco Pereira October, 7 Gibbs Sampling with a DP First, let s recapitulate the model that we re using.
Genetic Drift in Human Evolution
 Genetic Drift in Human Evolution (Part 2 of 2) 1 Ecology and Evolutionary Biology Center for Computational Molecular Biology Brown University Outline Introduction to genetic drift Modeling genetic drift
Lecture 18 : Ewens sampling formula
 Lecture 8 : Ewens sampling formula MATH85K - Spring 00 Lecturer: Sebastien Roch References: [Dur08, Chapter.3]. Previous class In the previous lecture, we introduced Kingman s coalescent as a limit of
Stat 5101 Lecture Notes
 Stat 5101 Lecture Notes Charles J. Geyer Copyright 1998, 1999, 2000, 2001 by Charles J. Geyer May 7, 2001 ii Stat 5101 (Geyer) Course Notes Contents 1 Random Variables and Change of Variables 1 1.1 Random
Research Statement on Statistics Jun Zhang
 Research Statement on Statistics Jun Zhang (junzhang@galton.uchicago.edu) My interest on statistics generally includes machine learning and statistical genetics. My recent work focus on detection and interpretation
Contrasts for a within-species comparative method
 Contrasts for a within-species comparative method Joseph Felsenstein, Department of Genetics, University of Washington, Box 357360, Seattle, Washington 98195-7360, USA email address: joe@genetics.washington.edu
Amira A. AL-Hosary PhD of infectious diseases Department of Animal Medicine (Infectious Diseases) Faculty of Veterinary Medicine Assiut
 Faculty of Veterinary Medicine Assiut") Amira A. AL-Hosary PhD of infectious diseases Department of Animal Medicine (Infectious Diseases) Faculty of Veterinary Medicine Assiut University-Egypt Phylogenetic analysis Phylogenetic Basics: Biological
Amira A. AL-Hosary PhD of infectious diseases Department of Animal Medicine (Infectious Diseases) Faculty of Veterinary Medicine Assiut University-Egypt Phylogenetic analysis Phylogenetic Basics: Biological
Genetic Variation in Finite Populations
 Genetic Variation in Finite Populations The amount of genetic variation found in a population is influenced by two opposing forces: mutation and genetic drift. 1 Mutation tends to increase variation. 2
MCMC: Markov Chain Monte Carlo
 I529: Machine Learning in Bioinformatics (Spring 2013) MCMC: Markov Chain Monte Carlo Yuzhen Ye School of Informatics and Computing Indiana University, Bloomington Spring 2013 Contents Review of Markov
Data Mining Techniques
 Data Mining Techniques CS 622 - Section 2 - Spring 27 Pre-final Review Jan-Willem van de Meent Feedback Feedback https://goo.gl/er7eo8 (also posted on Piazza) Also, please fill out your TRACE evaluations!
Statistics 202: Data Mining. c Jonathan Taylor. Model-based clustering Based in part on slides from textbook, slides of Susan Holmes.
 Model-based clustering Based in part on slides from textbook, slides of Susan Holmes December 2, 2012 1 / 1 Model-based clustering General approach Choose a type of mixture model (e.g. multivariate Normal)
Part IV: Monte Carlo and nonparametric Bayes
 Part IV: Monte Carlo and nonparametric Bayes Outline Monte Carlo methods Nonparametric Bayesian models Outline Monte Carlo methods Nonparametric Bayesian models The Monte Carlo principle The expectation
Multivariate Statistics 101. Ordination (PCA, NMDS, CA) Cluster Analysis (UPGMA, Ward s) Canonical Correspondence Analysis
 Cluster Analysis (UPGMA, Ward s) Canonical Correspondence Analysis") Multivariate Statistics 101 Ordination (PCA, NMDS, CA) Cluster Analysis (UPGMA, Ward s) Canonical Correspondence Analysis Multivariate Statistics 101 Copy of slides and exercises PAST software download
Multivariate Statistics 101 Ordination (PCA, NMDS, CA) Cluster Analysis (UPGMA, Ward s) Canonical Correspondence Analysis Multivariate Statistics 101 Copy of slides and exercises PAST software download
 that of Phylotree.org, mtdna tree Build 1756 (Supplementary TableS2). is resulted in 78 individuals allocated to the hg B4a1a1 and three individuals to hg Q. e control region (nps 57372 and nps 1602416526)
Short Answer Questions: Answer on your separate blank paper. Points are given in parentheses.
 ISQS 6348 Final exam solutions. Name: Open book and notes, but no electronic devices. Answer short answer questions on separate blank paper. Answer multiple choice on this exam sheet. Put your name on
Estimating Recombination Rates. LRH selection test, and recombination
 Estimating Recombination Rates LRH selection test, and recombination Recall that LRH tests for selection by looking at frequencies of specific haplotypes. Clearly the test is dependent on the recombination
PROBABILITY DISTRIBUTIONS. J. Elder CSE 6390/PSYC 6225 Computational Modeling of Visual Perception
 PROBABILITY DISTRIBUTIONS Credits 2 These slides were sourced and/or modified from: Christopher Bishop, Microsoft UK Parametric Distributions 3 Basic building blocks: Need to determine given Representation:
CSE 473: Artificial Intelligence Autumn Topics
 CSE 473: Artificial Intelligence Autumn 2014 Bayesian Networks Learning II Dan Weld Slides adapted from Jack Breese, Dan Klein, Daphne Koller, Stuart Russell, Andrew Moore & Luke Zettlemoyer 1 473 Topics
(Genome-wide) association analysis
 association analysis") (Genome-wide) association analysis 1 Key concepts Mapping QTL by association relies on linkage disequilibrium in the population; LD can be caused by close linkage between a QTL and marker (= good) or by
(Genome-wide) association analysis 1 Key concepts Mapping QTL by association relies on linkage disequilibrium in the population; LD can be caused by close linkage between a QTL and marker (= good) or by
Linear Regression (1/1/17)
") STA613/CBB540: Statistical methods in computational biology Linear Regression (1/1/17) Lecturer: Barbara Engelhardt Scribe: Ethan Hada 1. Linear regression 1.1. Linear regression basics. Linear regression
STA613/CBB540: Statistical methods in computational biology Linear Regression (1/1/17) Lecturer: Barbara Engelhardt Scribe: Ethan Hada 1. Linear regression 1.1. Linear regression basics. Linear regression
The Monte Carlo Method: Bayesian Networks
 The Method: Bayesian Networks Dieter W. Heermann Methods 2009 Dieter W. Heermann ( Methods)The Method: Bayesian Networks 2009 1 / 18 Outline 1 Bayesian Networks 2 Gene Expression Data 3 Bayesian Networks
Gibbs Sampling Methods for Multiple Sequence Alignment
 Gibbs Sampling Methods for Multiple Sequence Alignment Scott C. Schmidler 1 Jun S. Liu 2 1 Section on Medical Informatics and 2 Department of Statistics Stanford University 11/17/99 1 Outline Statistical
Supplementary Notes: Segment Parameter Labelling in MCMC Change Detection
 Supplementary Notes: Segment Parameter Labelling in MCMC Change Detection Alireza Ahrabian 1 arxiv:1901.0545v1 [eess.sp] 16 Jan 019 Abstract This work addresses the problem of segmentation in time series
1.5.1 ESTIMATION OF HAPLOTYPE FREQUENCIES:
 .5. ESTIMATION OF HAPLOTYPE FREQUENCIES: Chapter - 8 For SNPs, alleles A j,b j at locus j there are 4 haplotypes: A A, A B, B A and B B frequencies q,q,q 3,q 4. Assume HWE at haplotype level. Only the
Applying cluster analysis to 2011 Census local authority data
 Applying cluster analysis to 2011 Census local authority data Kitty.Lymperopoulou@manchester.ac.uk SPSS User Group Conference November, 10 2017 Outline Basic ideas of cluster analysis How to choose variables
PATTERN RECOGNITION AND MACHINE LEARNING CHAPTER 2: PROBABILITY DISTRIBUTIONS
 PATTERN RECOGNITION AND MACHINE LEARNING CHAPTER 2: PROBABILITY DISTRIBUTIONS Parametric Distributions Basic building blocks: Need to determine given Representation: or? Recall Curve Fitting Binary Variables
Preprocessing & dimensionality reduction
 Introduction to Data Mining Preprocessing & dimensionality reduction CPSC/AMTH 445a/545a Guy Wolf guy.wolf@yale.edu Yale University Fall 2016 CPSC 445 (Guy Wolf) Dimensionality reduction Yale - Fall 2016
A Nonparametric Bayesian Approach for Haplotype Reconstruction from Single and Multi-Population Data
 A Nonparametric Bayesian Approach for Haplotype Reconstruction from Single and Multi-Population Data Eric P. Xing January 27 CMU-ML-7-17 Kyung-Ah Sohn School of Computer Science Carnegie Mellon University
Dimensionality Reduction Techniques (DRT)
") Dimensionality Reduction Techniques (DRT) Introduction: Sometimes we have lot of variables in the data for analysis which create multidimensional matrix. To simplify calculation and to get appropriate,
Dimensionality Reduction Techniques (DRT) Introduction: Sometimes we have lot of variables in the data for analysis which create multidimensional matrix. To simplify calculation and to get appropriate,
CSC 2541: Bayesian Methods for Machine Learning
 CSC 2541: Bayesian Methods for Machine Learning Radford M. Neal, University of Toronto, 2011 Lecture 4 Problem: Density Estimation We have observed data, y 1,..., y n, drawn independently from some unknown
Statistical Machine Learning
 Statistical Machine Learning Christoph Lampert Spring Semester 2015/2016 // Lecture 12 1 / 36 Unsupervised Learning Dimensionality Reduction 2 / 36 Dimensionality Reduction Given: data X = {x 1,..., x
Mark your answers ON THE EXAM ITSELF. If you are not sure of your answer you may wish to provide a brief explanation.
 CS 189 Spring 2015 Introduction to Machine Learning Midterm You have 80 minutes for the exam. The exam is closed book, closed notes except your one-page crib sheet. No calculators or electronic items.