Introduction to Analysis of Variance. Chapter 11
|
|
|
- Stuart Collins
- 6 years ago
- Views:
Transcription
1 Introduction to Analysis of Variance Chapter 11
2 Review t-tests Single-sample t-test Independent samples t-test Related or paired-samples t-test s m M t ) ( 1 1 ) ( m m s M M t M D D D s M t n s s M 1 ) ( N M X S 1 1 ( ) 1 n s n s s M M N s s D M D 1 ) ( N M D S D D n s s M 1 ) ( N M X S
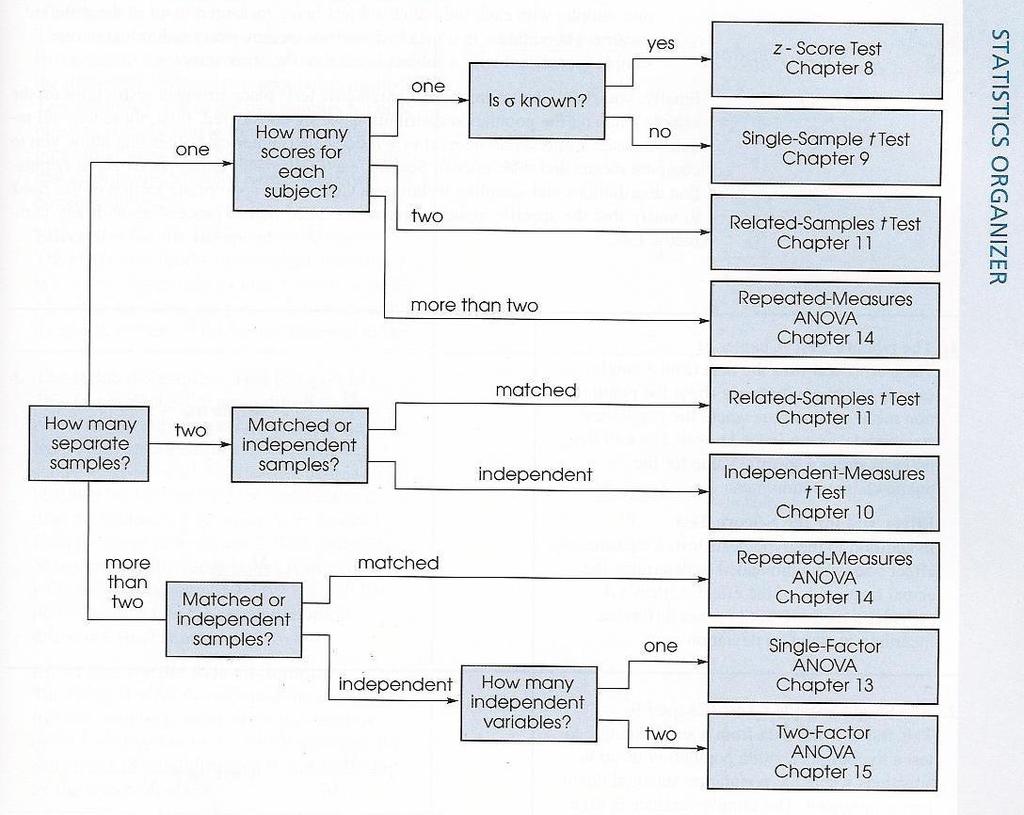
3 Which test do I use? What is the DV? What is the IV? What factor designates the groups? What and how many levels make up the factor Is it a between or within subject design? How many groups of subjects? How many measures for each subject? Which t-test do you use?
4
5 What type of t-test? What is the DV? IV? What design is used (between or within-ss)? A newspaper article reported that the typical American family spent an average of $81 on Halloween candy and costumes last year. You are interested in finding out if families in Spartanburg spend more or less than the national average. A researcher would like to replicate a study that found that older adults that owned pets were less likely to go to the doctor after an upsetting event than those who did not own pets. She would like to compare a group of pet owners to a group of people without pets and measure the number of visits to the doctor per year.
6 Method: Compare multiple groups A -level design may be too simple to answer the research question Beins et al. (007) Present cartoons to Ss after told to expect something that was either Not very funny Very funny No message about how funny to expect Results: Ratings of jokes depended on what people were expecting What are the benefits of the design?
7 ANOVA: Analysis of Variance How can we compare 3 or more levels at same time? Single-factor or One-way ANOVA Between subject design 1 factor or IV but + levels Example DV = # colds IV = drug type 3 levels bet-ss: placebo, low dose, high dose of vitamin C H : Null hypothesis: no difference between means Alternative hypothesis: difference between means H 1 Examine VARIANCE instead of sample mean difference S ( X M ) N : 1 3
8 Why use ANOVAs? If =.05 for each t-test you compute Each test, 5% chance of type I error or 1 in 0 tests expect error If need multiple t-tests error Calculate chance of making Type I error: 1-(1-α) c Where c is number of comparisons 1-(1-.05) 3 = 1 (.95) 3 =.14 = 14% chance! Bonferroni adjustment: divide alpha by # tests Instead perform all tests simultaneously in ANOVA
9 ANOVA test statistic T-test ratio: t difference between sample means difference expected by chance F-ratio (ANOVA): F variance differences between sample means variance difference expected by chance (error)
10 Logic of ANOVA Separates total variability in the DV into two parts Between-treatments variability Systematic variance = diff s in means due to the IV (treatment effect) with error variance Within-treatments variability Error variance
11 group Between-Treatment Variance 3 X 3 1 X 4 Includes systematic variance plus error variance 1 X rating
12 group Within-Treatment Variance 3 SS3 SS 18 1 SS1 SS SS SS SS within rating 1 3 SS 18 within
13 Logic of ANOVA Separates total variability in the DV into two parts Between-treatments variability Systematic variance = diff s in means due to the IV (treatment effect) with error variance Within-treatments variability Error variance Need to calculate Sum of Squares = SS Sum of squared deviations from each score from mean (X M) Note: if you then divide by N-1 you get variance (s )! Right?! Note: and then if you take square root you get standard deviation (s)! Right?!
14 Overall goal of ANOVA Evaluate difference between groups Distinguish if between-treatment differences due to: Treatment effect Chance or Error Inter-Individual differences between subject Intra-Individual differences within subject
15 ANOVA: Partitions the Variance Total Variance Between Treatment Variance Within Treatment Variance 1. Treatment effects. Error F = Between variance Within variance Error
16 The Analysis of Variance: The F-statistic Analysis of variance (ANOVA) looks at the ratio: F= variation among sample means variation among individuals in the same sample F= Treatment Effect +differences due to chance differences due to chance If there is no treatment effect, what would you expect for the value of F? 0 +differences due to chance F= differences due to chance = 1 = no effect
17 The Analysis of Variance F-statistic Analysis of variance (ANOVA) looks at the ratio: F= variation among sample means variation among individuals in the same sample F= Treatment Effect +differences due to chance differences due to chance If there IS a treatment effect, what would you expect for the value of F? Error term >0 +differences due to chance F= differences due to chance = >1 = an effect!
18 ANOVA formulas MS B = MS W = SS = sums of squares
19 Dogs, friends and stress 45 people were asked do a stressful task and their HR was measured 15 were randomly assigned to one of three groups Group 1 Group Group 3 Alone With a friend With their dog
20 Results What are hypotheses? H : H : not all of,,and are equal A 1 3 X SS Group 1 Group Group 3 Alone With a friend With their dog We cannot use the t-test, because there are more than samples to be compared. So, use ANOVA
21 The ANOVA X S Group 1 Group Group 3 Alone With a friend With their dog Between Group Variance = 1194 Within Group Variance = 84.9 F = 14.1
22 Conclusion? Is there evidence that the level of stress differs among the experimental groups? 1. Determine correct df. Determine the critical F 3. Are the mean differences statistically significant?
23 ANOVA formulas: df Total df = N 1 Total = df within + df between Within df = (n 1) or = N k Total number of subjects number of groups or levels Between df = k 1 Number of groups or levels - 1
24 ANOVA formulas: df Total df = N 1 Within df = (n 1) or = N k Between df = k 1 (where k = # grps or levels) Total = df within + df between Dog example: 45 people; 15 per condition Total = 45 1 = 44 Within = (15-1)+(15-1)+(15-1) = 4 OR Within = 45 3 = 4 Between = 3 1 = Total = 4 + = 44 LOOK UP in table: Between (numerator) and within (denominator) df
25 DF within Critical F Table A.8 pp DF between
26 t distribution for df = 18 F-ratios distribution for df = 1, 18. Notice that the critical values for =.05 are t = ±.101 and that F =.101 = 4.41
27 Critical F Calculate between df and within df Ex: between =, within = 4 Look up critical = = 5.18 What is conclusion if: F (, 4) = 14.1 Write-up A one-way ANOVA was conducted to examine the effect of emotional support on heart rate. A significant difference in HR was found between the groups that dealt with a stressful event alone (M = 85.5, SD = 9.), with a friend (M = 91.3, SD = 8.3), and with a dog (M = 73.4, SD = 9.9), F(, 4) = 14.1, p <.01.
28 Anova: Definitional formulas Between groups SS (sums of squares) Sum of squared deviations from each group s mean from grand mean multiplied by the number of Ss in group Within groups SS Sum of squared deviations of each score from group mean Total SS [( M M Sum of squared deviations of each score from the grand mean ( X MG) g G ( X M g ) ) n ]
29 ANOVA (theoretical) formulas: SS Total SS = = 46 Within SS = = 16 Between SS = = 30 ( X MG) ( X M g ) [( M M SS total = SS between + SS within 46 = g G ) n ] Temp Cond X = G= N= k=3 T 1 =5 T =0 T 3 =5 M G = SS 1 =6 SS =6 SS 3 =4 n 1 =5 n =5 n 3 =5 M 1 =1 M =4 M 3 =1
30 ANOVA computational formulas: Sum of Squares (SS) Total SS: sum of squared deviations from grand mean G SS TOTAL X N Within SS = SS = sum of squared deviations from grp mean SS Within Between SS = sum of squared deviations of grp mean from grand mean T G SS between n N SS total = SS between + SS within Where G = grand (overall) sum of scores Where N = total number of scores ( X M g ) ( X M ) ( 1 g X M g 3 Where T = sum of scores for group Where n = number of scores in group )
31 ANOVA formulas: SS Total SS = = /15 = 46 Within SS = SS = = 16 Between SS = SS X = 5 /5 + 0 /5 + 5 /5 30 /15 = 30 SS total = SS between + SS within 46 = T n G N SS between G N Temp Cond X = G= N= k=3 T 1 =5 T =0 T 3 =5 SS 1 =6 SS =6 SS 3 =4 n 1 =5 n =5 n 3 =5 M 1 =1 M =4 M 3 =1
32 ANOVA formulas MS between SS df between between MS between MS within SS df within within MS within MS between F F MS within
33 ANOVA summary table Source df SS MS F Between * Within Total * Significant at.01 level F (, 1) = 11.8, p <.01
34 Effect size How much of the variability in DV is attributed to IV? Effect size for ANOVA: eta-squared (η ) SS SS Between Total
35 Post-hoc tests If ANOVA result is significant How do you know which grps differ? Need to do t-tests but reduce Type I error Use Tukey s HSD test Pairwise comparisons while keeping same alpha level
ANOVA continued. Chapter 10
 ANOVA continued Chapter 10 Zettergren (003) School adjustment in adolescence for previously rejected, average, and popular children. Effect of peer reputation on academic performance and school adjustment
ANOVA continued. Chapter 10
 ANOVA continued Chapter 10 Zettergren (003) School adjustment in adolescence for previously rejected, average, and popular children. Effect of peer reputation on academic performance and school adjustment
ANOVA continued. Chapter 11
 ANOVA continued Chapter 11 Zettergren (003) School adjustment in adolescence for previously rejected, average, and popular children. Effect of peer reputation on academic performance and school adjustment
An Old Research Question
 ANOVA An Old Research Question The impact of TV on high-school grade Watch or not watch Two groups The impact of TV hours on high-school grade Exactly how much TV watching would make difference Multiple
1. What does the alternate hypothesis ask for a one-way between-subjects analysis of variance?
 1. What does the alternate hypothesis ask for a one-way between-subjects analysis of variance? 2. What is the difference between between-group variability and within-group variability? 3. What does between-group
The One-Way Repeated-Measures ANOVA. (For Within-Subjects Designs)
") The One-Way Repeated-Measures ANOVA (For Within-Subjects Designs) Logic of the Repeated-Measures ANOVA The repeated-measures ANOVA extends the analysis of variance to research situations using repeated-measures
The One-Way Repeated-Measures ANOVA (For Within-Subjects Designs) Logic of the Repeated-Measures ANOVA The repeated-measures ANOVA extends the analysis of variance to research situations using repeated-measures
One-way between-subjects ANOVA. Comparing three or more independent means
 One-way between-subjects ANOVA Comparing three or more independent means Data files SpiderBG.sav Attractiveness.sav Homework: sourcesofself-esteem.sav ANOVA: A Framework Understand the basic principles
One-way between-subjects ANOVA. Comparing three or more independent means
 One-way between-subjects ANOVA Comparing three or more independent means ANOVA: A Framework Understand the basic principles of ANOVA Why it is done? What it tells us? Theory of one-way between-subjects
Multiple t Tests. Introduction to Analysis of Variance. Experiments with More than 2 Conditions
 Introduction to Analysis of Variance 1 Experiments with More than 2 Conditions Often the research that psychologists perform has more conditions than just the control and experimental conditions You might
The One-Way Independent-Samples ANOVA. (For Between-Subjects Designs)
") The One-Way Independent-Samples ANOVA (For Between-Subjects Designs) Computations for the ANOVA In computing the terms required for the F-statistic, we won t explicitly compute any sample variances or
The One-Way Independent-Samples ANOVA (For Between-Subjects Designs) Computations for the ANOVA In computing the terms required for the F-statistic, we won t explicitly compute any sample variances or
Difference in two or more average scores in different groups
 ANOVAs Analysis of Variance (ANOVA) Difference in two or more average scores in different groups Each participant tested once Same outcome tested in each group Simplest is one-way ANOVA (one variable as
Analysis of Variance (ANOVA)
") Analysis of Variance (ANOVA) Two types of ANOVA tests: Independent measures and Repeated measures Comparing 2 means: X 1 = 20 t - test X 2 = 30 How can we Compare 3 means?: X 1 = 20 X 2 = 30 X 3 = 35 ANOVA
Analysis of Variance (ANOVA) Two types of ANOVA tests: Independent measures and Repeated measures Comparing 2 means: X 1 = 20 t - test X 2 = 30 How can we Compare 3 means?: X 1 = 20 X 2 = 30 X 3 = 35 ANOVA
Comparing Several Means: ANOVA
 Comparing Several Means: ANOVA Understand the basic principles of ANOVA Why it is done? What it tells us? Theory of one way independent ANOVA Following up an ANOVA: Planned contrasts/comparisons Choosing
8/23/2018. One-Way ANOVA F-test. 1. Situation/hypotheses. 2. Test statistic. 3.Distribution. 4. Assumptions
 PSY 5101: Advanced Statistics for Psychological and Behavioral Research 1 1. Situation/hypotheses 2. Test statistic One-Way ANOVA F-test One factor J>2 independent samples H o :µ 1 µ 2 µ J F 3.Distribution
Introduction to the Analysis of Variance (ANOVA) Computing One-Way Independent Measures (Between Subjects) ANOVAs
 Computing One-Way Independent Measures (Between Subjects) ANOVAs") Introduction to the Analysis of Variance (ANOVA) Computing One-Way Independent Measures (Between Subjects) ANOVAs The Analysis of Variance (ANOVA) The analysis of variance (ANOVA) is a statistical technique
Introduction to the Analysis of Variance (ANOVA) Computing One-Way Independent Measures (Between Subjects) ANOVAs The Analysis of Variance (ANOVA) The analysis of variance (ANOVA) is a statistical technique
Analysis of Variance ANOVA. What We Will Cover in This Section. Situation
 Analysis of Variance ANOVA 8//007 P7 Analysis of Variance What We Will Cover in This Section Introduction. Overview. Simple ANOVA. Repeated Measures ANOVA. Factorial ANOVA 8//007 P7 Analysis of Variance
ONE FACTOR COMPLETELY RANDOMIZED ANOVA
 MALLOY PSYCH 3000 1-ANOVA PAGE 1 ONE FACTOR COMPLETELY RANDOMIZED ANOVA Sampling Distribution of F F is a test statistic [ ][ ][ ][ ] Test Statistic: F = MALLOY PSYCH 3000 1-ANOVA PAGE 2 ONE WAY ANOVA
Analysis of Variance (ANOVA)
") Analysis of Variance (ANOVA) Used for comparing or more means an extension of the t test Independent Variable (factor) = categorical (qualita5ve) predictor should have at least levels, but can have many
Analysis of Variance (ANOVA) Used for comparing or more means an extension of the t test Independent Variable (factor) = categorical (qualita5ve) predictor should have at least levels, but can have many
Your schedule of coming weeks. One-way ANOVA, II. Review from last time. Review from last time /22/2004. Create ANOVA table
 Your schedule of coming weeks One-way ANOVA, II 9.07 //00 Today: One-way ANOVA, part II Next week: Two-way ANOVA, parts I and II. One-way ANOVA HW due Thursday Week of May Teacher out of town all week
10/31/2012. One-Way ANOVA F-test
 PSY 511: Advanced Statistics for Psychological and Behavioral Research 1 1. Situation/hypotheses 2. Test statistic 3.Distribution 4. Assumptions One-Way ANOVA F-test One factor J>2 independent samples
One-Way ANOVA Source Table J - 1 SS B / J - 1 MS B /MS W. Pairwise Post-Hoc Comparisons of Means
 One-Way ANOVA Source Table ANOVA MODEL: ij = µ* + α j + ε ij H 0 : µ 1 = µ =... = µ j or H 0 : Σα j = 0 Source Sum of Squares df Mean Squares F Between Groups n j ( j - * ) J - 1 SS B / J - 1 MS B /MS
OHSU OGI Class ECE-580-DOE :Design of Experiments Steve Brainerd
 Why We Use Analysis of Variance to Compare Group Means and How it Works The question of how to compare the population means of more than two groups is an important one to researchers. Let us suppose that
Keppel, G. & Wickens, T.D. Design and Analysis Chapter 2: Sources of Variability and Sums of Squares
 Keppel, G. & Wickens, T.D. Design and Analysis Chapter 2: Sources of Variability and Sums of Squares K&W introduce the notion of a simple experiment with two conditions. Note that the raw data (p. 16)
An inferential procedure to use sample data to understand a population Procedures
 Hypothesis Test An inferential procedure to use sample data to understand a population Procedures Hypotheses, the alpha value, the critical region (z-scores), statistics, conclusion Two types of errors
ANOVA Analysis of Variance
 ANOVA Analysis of Variance ANOVA Analysis of Variance Extends independent samples t test ANOVA Analysis of Variance Extends independent samples t test Compares the means of groups of independent observations
Factorial Independent Samples ANOVA
 Factorial Independent Samples ANOVA Liljenquist, Zhong and Galinsky (2010) found that people were more charitable when they were in a clean smelling room than in a neutral smelling room. Based on that
Review. One-way ANOVA, I. What s coming up. Multiple comparisons
 Review One-way ANOVA, I 9.07 /15/00 Earlier in this class, we talked about twosample z- and t-tests for the difference between two conditions of an independent variable Does a trial drug work better than
COMPARING SEVERAL MEANS: ANOVA
 LAST UPDATED: November 15, 2012 COMPARING SEVERAL MEANS: ANOVA Objectives 2 Basic principles of ANOVA Equations underlying one-way ANOVA Doing a one-way ANOVA in R Following up an ANOVA: Planned contrasts/comparisons
ANALYTICAL COMPARISONS AMONG TREATMENT MEANS (CHAPTER 4)
") ANALYTICAL COMPARISONS AMONG TREATMENT MEANS (CHAPTER 4) ERSH 8310 Fall 2007 September 11, 2007 Today s Class The need for analytic comparisons. Planned comparisons. Comparisons among treatment means.
ANALYTICAL COMPARISONS AMONG TREATMENT MEANS (CHAPTER 4) ERSH 8310 Fall 2007 September 11, 2007 Today s Class The need for analytic comparisons. Planned comparisons. Comparisons among treatment means.
One-Way Analysis of Variance: ANOVA
 One-Way Analysis of Variance: ANOVA Dr. J. Kyle Roberts Southern Methodist University Simmons School of Education and Human Development Department of Teaching and Learning Background to ANOVA Recall from
Hypothesis T e T sting w ith with O ne O One-Way - ANOV ANO A V Statistics Arlo Clark Foos -
 Hypothesis Testing with One-Way ANOVA Statistics Arlo Clark-Foos Conceptual Refresher 1. Standardized z distribution of scores and of means can be represented as percentile rankings. 2. t distribution
Hypothesis testing: Steps
 Review for Exam 2 Hypothesis testing: Steps Exam 2 Review 1. Determine appropriate test and hypotheses 2. Use distribution table to find critical statistic value(s) representing rejection region 3. Compute
22s:152 Applied Linear Regression. Chapter 8: 1-Way Analysis of Variance (ANOVA) 2-Way Analysis of Variance (ANOVA)
 2-Way Analysis of Variance (ANOVA)") 22s:152 Applied Linear Regression Chapter 8: 1-Way Analysis of Variance (ANOVA) 2-Way Analysis of Variance (ANOVA) We now consider an analysis with only categorical predictors (i.e. all predictors are
22s:152 Applied Linear Regression Chapter 8: 1-Way Analysis of Variance (ANOVA) 2-Way Analysis of Variance (ANOVA) We now consider an analysis with only categorical predictors (i.e. all predictors are
Assignment #7. Chapter 12: 18, 24 Chapter 13: 28. Due next Friday Nov. 20 th by 2pm in your TA s homework box
 Assignment #7 Chapter 12: 18, 24 Chapter 13: 28 Due next Friday Nov. 20 th by 2pm in your TA s homework box Lab Report Posted on web-site Dates Rough draft due to TAs homework box on Monday Nov. 16 th
STAT 525 Fall Final exam. Tuesday December 14, 2010
 STAT 525 Fall 2010 Final exam Tuesday December 14, 2010 Time: 2 hours Name (please print): Show all your work and calculations. Partial credit will be given for work that is partially correct. Points will
Independent Samples ANOVA
 Independent Samples ANOVA In this example students were randomly assigned to one of three mnemonics (techniques for improving memory) rehearsal (the control group; simply repeat the words), visual imagery
Calculating Fobt for all possible combinations of variances for each sample Calculating the probability of (F) for each different value of Fobt
 for each different value of Fobt") PSY 305 Module 5-A AVP Transcript During the past two modules, you have been introduced to inferential statistics. We have spent time on z-tests and the three types of t-tests. We are now ready to move
PSY 305 Module 5-A AVP Transcript During the past two modules, you have been introduced to inferential statistics. We have spent time on z-tests and the three types of t-tests. We are now ready to move
One-way Analysis of Variance. Major Points. T-test. Ψ320 Ainsworth
 One-way Analysis of Variance Ψ30 Ainsworth Major Points Problem with t-tests and multiple groups The logic behind ANOVA Calculations Multiple comparisons Assumptions of analysis of variance Effect Size
Multiple Pairwise Comparison Procedures in One-Way ANOVA with Fixed Effects Model
 Biostatistics 250 ANOVA Multiple Comparisons 1 ORIGIN 1 Multiple Pairwise Comparison Procedures in One-Way ANOVA with Fixed Effects Model When the omnibus F-Test for ANOVA rejects the null hypothesis that
What Does the F-Ratio Tell Us?
 Planned Comparisons What Does the F-Ratio Tell Us? The F-ratio (called an omnibus or overall F) provides a test of whether or not there a treatment effects in an experiment A significant F-ratio suggests
One-Way Analysis of Variance (ANOVA) Paul K. Strode, Ph.D.
 Paul K. Strode, Ph.D.") One-Way Analysis of Variance (ANOVA) Paul K. Strode, Ph.D. Purpose While the T-test is useful to compare the means of two samples, many biology experiments involve the parallel measurement of three or
One-Way Analysis of Variance (ANOVA) Paul K. Strode, Ph.D. Purpose While the T-test is useful to compare the means of two samples, many biology experiments involve the parallel measurement of three or
2 Hand-out 2. Dr. M. P. M. M. M c Loughlin Revised 2018
 Math 403 - P. & S. III - Dr. McLoughlin - 1 2018 2 Hand-out 2 Dr. M. P. M. M. M c Loughlin Revised 2018 3. Fundamentals 3.1. Preliminaries. Suppose we can produce a random sample of weights of 10 year-olds
Analyses of Variance. Block 2b
 Analyses of Variance Block 2b Types of analyses 1 way ANOVA For more than 2 levels of a factor between subjects ANCOVA For continuous co-varying factor, between subjects ANOVA for factorial design Multiple
H0: Tested by k-grp ANOVA
 Pairwise Comparisons ANOVA for multiple condition designs Pairwise comparisons and RH Testing Alpha inflation & Correction LSD & HSD procedures Alpha estimation reconsidered H0: Tested by k-grp ANOVA Regardless
ANOVA: Comparing More Than Two Means
 1 ANOVA: Comparing More Than Two Means 10.1 ANOVA: The Completely Randomized Design Elements of a Designed Experiment Before we begin any calculations, we need to discuss some terminology. To make this
H0: Tested by k-grp ANOVA
 Analyses of K-Group Designs : Omnibus F, Pairwise Comparisons & Trend Analyses ANOVA for multiple condition designs Pairwise comparisons and RH Testing Alpha inflation & Correction LSD & HSD procedures
ANOVA Situation The F Statistic Multiple Comparisons. 1-Way ANOVA MATH 143. Department of Mathematics and Statistics Calvin College
 1-Way ANOVA MATH 143 Department of Mathematics and Statistics Calvin College An example ANOVA situation Example (Treating Blisters) Subjects: 25 patients with blisters Treatments: Treatment A, Treatment
Department of Economics. Business Statistics. Chapter 12 Chi-square test of independence & Analysis of Variance ECON 509. Dr.
 Department of Economics Business Statistics Chapter 1 Chi-square test of independence & Analysis of Variance ECON 509 Dr. Mohammad Zainal Chapter Goals After completing this chapter, you should be able
One- factor ANOVA. F Ra5o. If H 0 is true. F Distribu5on. If H 1 is true 5/25/12. One- way ANOVA: A supersized independent- samples t- test
 F Ra5o F = variability between groups variability within groups One- factor ANOVA If H 0 is true random error F = random error " µ F =1 If H 1 is true random error +(treatment effect)2 F = " µ F >1 random
Analysis of variance (ANOVA) ANOVA. Null hypothesis for simple ANOVA. H 0 : Variance among groups = 0
 ANOVA. Null hypothesis for simple ANOVA. H 0 : Variance among groups = 0") Analysis of variance (ANOVA) ANOVA Comparing the means of more than two groups Like a t-test, but can compare more than two groups Asks whether any of two or more means is different from any other. In
Analysis of variance (ANOVA) ANOVA Comparing the means of more than two groups Like a t-test, but can compare more than two groups Asks whether any of two or more means is different from any other. In
This gives us an upper and lower bound that capture our population mean.
 Confidence Intervals Critical Values Practice Problems 1 Estimation 1.1 Confidence Intervals Definition 1.1 Margin of error. The margin of error of a distribution is the amount of error we predict when
Introduction to the Analysis of Variance (ANOVA)
") Introduction to the Analysis of Variance (ANOVA) The Analysis of Variance (ANOVA) The analysis of variance (ANOVA) is a statistical technique for testing for differences between the means of multiple (more
Introduction to the Analysis of Variance (ANOVA) The Analysis of Variance (ANOVA) The analysis of variance (ANOVA) is a statistical technique for testing for differences between the means of multiple (more
psyc3010 lecture 2 factorial between-ps ANOVA I: omnibus tests
 psyc3010 lecture 2 factorial between-ps ANOVA I: omnibus tests last lecture: introduction to factorial designs next lecture: factorial between-ps ANOVA II: (effect sizes and follow-up tests) 1 general
Hypothesis testing: Steps
 Review for Exam 2 Hypothesis testing: Steps Repeated-Measures ANOVA 1. Determine appropriate test and hypotheses 2. Use distribution table to find critical statistic value(s) representing rejection region
MALLOY PSYCH 3000 MEAN & VARIANCE PAGE 1 STATISTICS MEASURES OF CENTRAL TENDENCY. In an experiment, these are applied to the dependent variable (DV)
") MALLOY PSYCH 3000 MEAN & VARIANCE PAGE 1 STATISTICS Descriptive statistics Inferential statistics MEASURES OF CENTRAL TENDENCY In an experiment, these are applied to the dependent variable (DV) E.g., MEASURES
MALLOY PSYCH 3000 MEAN & VARIANCE PAGE 1 STATISTICS Descriptive statistics Inferential statistics MEASURES OF CENTRAL TENDENCY In an experiment, these are applied to the dependent variable (DV) E.g., MEASURES
Variance Estimates and the F Ratio. ERSH 8310 Lecture 3 September 2, 2009
 Variance Estimates and the F Ratio ERSH 8310 Lecture 3 September 2, 2009 Today s Class Completing the analysis (the ANOVA table) Evaluating the F ratio Errors in hypothesis testing A complete numerical
N J SS W /df W N - 1
 One-Way ANOVA Source Table ANOVA MODEL: ij = µ* + α j + ε ij H 0 : µ = µ =... = µ j or H 0 : Σα j = 0 Source Sum of Squares df Mean Squares F J Between Groups nj( j * ) J - SS B /(J ) MS B /MS W = ( N
1. The (dependent variable) is the variable of interest to be measured in the experiment.
 is the variable of interest to be measured in the experiment.") Chapter 10 Analysis of variance (ANOVA) 10.1 Elements of a designed experiment 1. The (dependent variable) is the variable of interest to be measured in the experiment. 2. are those variables whose effect
Chapter 10 Analysis of variance (ANOVA) 10.1 Elements of a designed experiment 1. The (dependent variable) is the variable of interest to be measured in the experiment. 2. are those variables whose effect
Degrees of freedom df=1. Limitations OR in SPSS LIM: Knowing σ and µ is unlikely in large
 Z Test Comparing a group mean to a hypothesis T test (about 1 mean) T test (about 2 means) Comparing mean to sample mean. Similar means = will have same response to treatment Two unknown means are different
ANOVA: Comparing More Than Two Means
 ANOVA: Comparing More Than Two Means Chapter 11 Cathy Poliak, Ph.D. cathy@math.uh.edu Office Fleming 11c Department of Mathematics University of Houston Lecture 25-3339 Cathy Poliak, Ph.D. cathy@math.uh.edu
CHAPTER 10 ONE-WAY ANALYSIS OF VARIANCE. It would be very unusual for all the research one might conduct to be restricted to
 CHAPTER 10 ONE-WAY ANALYSIS OF VARIANCE It would be very unusual for all the research one might conduct to be restricted to comparisons of only two samples. Respondents and various groups are seldom divided
One-Way ANOVA Cohen Chapter 12 EDUC/PSY 6600
 One-Way ANOVA Cohen Chapter 1 EDUC/PSY 6600 1 It is easy to lie with statistics. It is hard to tell the truth without statistics. -Andrejs Dunkels Motivating examples Dr. Vito randomly assigns 30 individuals
Chapter 8 Student Lecture Notes 8-1. Department of Economics. Business Statistics. Chapter 12 Chi-square test of independence & Analysis of Variance
 Chapter 8 Student Lecture Notes 8-1 Department of Economics Business Statistics Chapter 1 Chi-square test of independence & Analysis of Variance ECON 509 Dr. Mohammad Zainal Chapter Goals After completing
Lec 1: An Introduction to ANOVA
 Ying Li Stockholm University October 31, 2011 Three end-aisle displays Which is the best? Design of the Experiment Identify the stores of the similar size and type. The displays are randomly assigned to
9/28/2013. PSY 511: Advanced Statistics for Psychological and Behavioral Research 1
 PSY 511: Advanced Statistics for Psychological and Behavioral Research 1 The one-sample t-test and test of correlation are realistic, useful statistical tests The tests that we will learn next are even
The legacy of Sir Ronald A. Fisher. Fisher s three fundamental principles: local control, replication, and randomization.
 1 Chapter 1: Research Design Principles The legacy of Sir Ronald A. Fisher. Fisher s three fundamental principles: local control, replication, and randomization. 2 Chapter 2: Completely Randomized Design
Analysis of Variance: Repeated measures
 Repeated-Measures ANOVA: Analysis of Variance: Repeated measures Each subject participates in all conditions in the experiment (which is why it is called repeated measures). A repeated-measures ANOVA is
Stats fest Analysis of variance. Single factor ANOVA. Aims. Single factor ANOVA. Data
 1 Stats fest 2007 Analysis of variance murray.logan@sci.monash.edu.au Single factor ANOVA 2 Aims Description Investigate differences between population means Explanation How much of the variation in response
Extensions of One-Way ANOVA.
 Extensions of One-Way ANOVA http://www.pelagicos.net/classes_biometry_fa18.htm What do I want You to Know What are two main limitations of ANOVA? What two approaches can follow a significant ANOVA? How
Two-Way ANOVA. Chapter 15
 Two-Way ANOVA Chapter 15 Interaction Defined An interaction is present when the effects of one IV depend upon a second IV Interaction effect : The effect of each IV across the levels of the other IV When
Extensions of One-Way ANOVA.
 Extensions of One-Way ANOVA http://www.pelagicos.net/classes_biometry_fa17.htm What do I want You to Know What are two main limitations of ANOVA? What two approaches can follow a significant ANOVA? How
Comparisons among means (or, the analysis of factor effects)
") Comparisons among means (or, the analysis of factor effects) In carrying out our usual test that μ 1 = = μ r, we might be content to just reject this omnibus hypothesis but typically more is required:
Comparisons among means (or, the analysis of factor effects) In carrying out our usual test that μ 1 = = μ r, we might be content to just reject this omnibus hypothesis but typically more is required:
Contrasts (in general)
") 10/1/015 6-09/749 Experimental Design for Behavioral and Social Sciences Contrasts (in general) Context: An ANOVA rejects the overall null hypothesis that all k means of some factor are not equal, i.e.,
10/1/015 6-09/749 Experimental Design for Behavioral and Social Sciences Contrasts (in general) Context: An ANOVA rejects the overall null hypothesis that all k means of some factor are not equal, i.e.,
Study Guide #3: OneWay ANALYSIS OF VARIANCE (ANOVA)
") Study Guide #3: OneWay ANALYSIS OF VARIANCE (ANOVA) About the ANOVA Test In educational research, we are most often involved finding out whether there are differences between groups. For example, is there
Study Guide #3: OneWay ANALYSIS OF VARIANCE (ANOVA) About the ANOVA Test In educational research, we are most often involved finding out whether there are differences between groups. For example, is there
PSYC 331 STATISTICS FOR PSYCHOLOGISTS
 PSYC 331 STATISTICS FOR PSYCHOLOGISTS Session 4 A PARAMETRIC STATISTICAL TEST FOR MORE THAN TWO POPULATIONS Lecturer: Dr. Paul Narh Doku, Dept of Psychology, UG Contact Information: pndoku@ug.edu.gh College
Comparing the means of more than two groups
 Comparing the means of more than two groups Chapter 15 Analysis of variance (ANOVA) Like a t-test, but can compare more than two groups Asks whether any of two or more means is different from any other.
22s:152 Applied Linear Regression. 1-way ANOVA visual:
 22s:152 Applied Linear Regression 1-way ANOVA visual: Chapter 8: 1-Way Analysis of Variance (ANOVA) 2-Way Analysis of Variance (ANOVA) 0.00 0.05 0.10 0.15 0.20 0.25 0.30 0.35 Y We now consider an analysis
4:3 LEC - PLANNED COMPARISONS AND REGRESSION ANALYSES
 4:3 LEC - PLANNED COMPARISONS AND REGRESSION ANALYSES FOR SINGLE FACTOR BETWEEN-S DESIGNS Planned or A Priori Comparisons We previously showed various ways to test all possible pairwise comparisons for
Repeated Measures Analysis of Variance
 Repeated Measures Analysis of Variance Review Univariate Analysis of Variance Group A Group B Group C Repeated Measures Analysis of Variance Condition A Condition B Condition C Repeated Measures Analysis
Prepared by: Prof. Dr Bahaman Abu Samah Department of Professional Development and Continuing Education Faculty of Educational Studies Universiti
 Prepared by: Prof. Dr Bahaman Abu Samah Department of Professional Development and Continuing Education Faculty of Educational Studies Universiti Putra Malaysia Serdang Use in experiment, quasi-experiment
One-Way ANOVA. Some examples of when ANOVA would be appropriate include:
 One-Way ANOVA 1. Purpose Analysis of variance (ANOVA) is used when one wishes to determine whether two or more groups (e.g., classes A, B, and C) differ on some outcome of interest (e.g., an achievement
Analysis of Variance
 Statistical Techniques II EXST7015 Analysis of Variance 15a_ANOVA_Introduction 1 Design The simplest model for Analysis of Variance (ANOVA) is the CRD, the Completely Randomized Design This model is also
Analysis of variance
 Analysis of variance 1 Method If the null hypothesis is true, then the populations are the same: they are normal, and they have the same mean and the same variance. We will estimate the numerical value
BIOL Biometry LAB 6 - SINGLE FACTOR ANOVA and MULTIPLE COMPARISON PROCEDURES
 BIOL 458 - Biometry LAB 6 - SINGLE FACTOR ANOVA and MULTIPLE COMPARISON PROCEDURES PART 1: INTRODUCTION TO ANOVA Purpose of ANOVA Analysis of Variance (ANOVA) is an extremely useful statistical method
ANOVA 3/12/2012. Two reasons for using ANOVA. Type I Error and Multiple Tests. Review Independent Samples t test
 // ANOVA Lectures - Readings: GW Review Independent Samples t test Placeo Treatment 7 7 7 Mean... Review Independent Samples t test Placeo Treatment 7 7 7 Mean.. t (). p. C. I.: p t tcrit s pt crit s t
ANCOVA. Lecture 9 Andrew Ainsworth
 ANCOVA Lecture 9 Andrew Ainsworth What is ANCOVA? Analysis of covariance an extension of ANOVA in which main effects and interactions are assessed on DV scores after the DV has been adjusted for by the
Statistical methods for comparing multiple groups. Lecture 7: ANOVA. ANOVA: Definition. ANOVA: Concepts
 Statistical methods for comparing multiple groups Lecture 7: ANOVA Sandy Eckel seckel@jhsph.edu 30 April 2008 Continuous data: comparing multiple means Analysis of variance Binary data: comparing multiple
PSY 216. Assignment 12 Answers. Explain why the F-ratio is expected to be near 1.00 when the null hypothesis is true.
 PSY 21 Assignment 12 Answers 1. Problem 1 from the text Explain why the F-ratio is expected to be near 1.00 when the null hypothesis is true. When H0 is true, the treatment had no systematic effect. In
" M A #M B. Standard deviation of the population (Greek lowercase letter sigma) σ 2
 σ 2") Notation and Equations for Final Exam Symbol Definition X The variable we measure in a scientific study n The size of the sample N The size of the population M The mean of the sample µ The mean of the
Notation and Equations for Final Exam Symbol Definition X The variable we measure in a scientific study n The size of the sample N The size of the population M The mean of the sample µ The mean of the
Workshop 7.4a: Single factor ANOVA
 -1- Workshop 7.4a: Single factor ANOVA Murray Logan November 23, 2016 Table of contents 1 Revision 1 2 Anova Parameterization 2 3 Partitioning of variance (ANOVA) 10 4 Worked Examples 13 1. Revision 1.1.
Chapter 9 Inferences from Two Samples
 Chapter 9 Inferences from Two Samples 9-1 Review and Preview 9-2 Two Proportions 9-3 Two Means: Independent Samples 9-4 Two Dependent Samples (Matched Pairs) 9-5 Two Variances or Standard Deviations Review
Group comparison test for independent samples
 Group comparison test for independent samples The purpose of the Analysis of Variance (ANOVA) is to test for significant differences between means. Supposing that: samples come from normal populations
Chapter 16 One-way Analysis of Variance
 Chapter 16 One-way Analysis of Variance I am assuming that most people would prefer to see the solutions to these problems as computer printout. (I will use R and SPSS for consistency.) 16.1 Analysis of
CHL 5225H Advanced Statistical Methods for Clinical Trials: Multiplicity
 CHL 5225H Advanced Statistical Methods for Clinical Trials: Multiplicity Prof. Kevin E. Thorpe Dept. of Public Health Sciences University of Toronto Objectives 1. Be able to distinguish among the various
Keppel, G. & Wickens, T. D. Design and Analysis Chapter 12: Detailed Analyses of Main Effects and Simple Effects
 Keppel, G. & Wickens, T. D. Design and Analysis Chapter 1: Detailed Analyses of Main Effects and Simple Effects If the interaction is significant, then less attention is paid to the two main effects, and
Keppel, G. & Wickens, T. D. Design and Analysis Chapter 4: Analytical Comparisons Among Treatment Means
 Keppel, G. & Wickens, T. D. Design and Analysis Chapter 4: Analytical Comparisons Among Treatment Means 4.1 The Need for Analytical Comparisons...the between-groups sum of squares averages the differences
PLSC PRACTICE TEST ONE
 PLSC 724 - PRACTICE TEST ONE 1. Discuss briefly the relationship between the shape of the normal curve and the variance. 2. What is the relationship between a statistic and a parameter? 3. How is the α
Lab #12: Exam 3 Review Key
 Psychological Statistics Practice Lab#1 Dr. M. Plonsky Page 1 of 7 Lab #1: Exam 3 Review Key 1) a. Probability - Refers to the likelihood that an event will occur. Ranges from 0 to 1. b. Sampling Distribution
Factorial Analysis of Variance
 Factorial Analysis of Variance Conceptual Example A repeated-measures t-test is more likely to lead to rejection of the null hypothesis if a) *Subjects show considerable variability in their change scores.
Multivariate analysis of variance and covariance
 Introduction Multivariate analysis of variance and covariance Univariate ANOVA: have observations from several groups, numerical dependent variable. Ask whether dependent variable has same mean for each