CS145: INTRODUCTION TO DATA MINING
|
|
|
- Britton Thornton
- 5 years ago
- Views:
Transcription
1 CS145: INTRODUCTION TO DATA MINING 2: Vector Data: Prediction Instructor: Yizhou Sun October 8, 2018
2 TA Office Hour Time Change Junheng Hao: Tuesday 1-3pm Yunsheng Bai: Thursday 1-3pm 2
3 Methods to Learn Vector Data Set Data Sequence Data Text Data Classification Clustering Logistic Regression; Decision Tree; KNN SVM; NN K-means; hierarchical clustering; DBSCAN; Mixture Models Naïve Bayes for Text PLSA Prediction Frequent Pattern Mining Similarity Search Linear Regression GLM* Apriori; FP growth GSP; PrefixSpan DTW 3
4 How to learn these algorithms? Three levels When it is applicable? Input, output, strengths, weaknesses, time complexity How it works? Pseudo-code, work flows, major steps Can work out a toy problem by pen and paper Why it works? Intuition, philosophy, objective, derivation, proof 4
5 Vector Data: Prediction Vector Data Linear Regression Model Model Evaluation and Selection Summary 5


6 Example A matrix of n pp: n data objects / points p attributes / dimensions x 11 x i1 x n1 x 1f x if x nf x 1p x ip x np 6
7 Numerical E.g., height, income Attribute Type Categorical / discrete E.g., Sex, Race 7
8 Categorical Attribute Types Nominal: categories, states, or names of things Hair_color = {auburn, black, blond, brown, grey, red, white} marital status, occupation, ID numbers, zip codes Binary Nominal attribute with only 2 states (0 and 1) Symmetric binary: both outcomes equally important e.g., gender Asymmetric binary: outcomes not equally important. e.g., medical test (positive vs. negative) Convention: assign 1 to most important outcome (e.g., HIV positive) Ordinal Values have a meaningful order (ranking) but magnitude between successive values is not known. Size = {small, medium, large}, grades, army rankings 8
9 Basic Statistical Descriptions of Data Central Tendency Dispersion of the Data Graphic Displays 9
10 Measuring the Central Tendency Mean (algebraic measure) (sample vs. population): Note: n is sample size and N is population size. Weighted arithmetic mean: Trimmed mean: chopping extreme values Median: Middle value if odd number of values, or average of the middle two values otherwise Mode Value that occurs most frequently in the data Unimodal, bimodal, trimodal Empirical formula: x = x 1 n n i= 1 = n i= 1 n i= 1 w x mean mode = 3 ( mean median) i w i i x i µ = x N 10
11 Symmetric vs. Skewed Data Median, mean and mode of symmetric, positively and negatively skewed data symmetric positively skewed negatively skewed 11
12 Measuring the Dispersion of Data Quartiles, outliers and boxplots Quartiles: Q 1 (25 th percentile), Q 3 (75 th percentile) Inter-quartile range: IQR = Q 3 Q 1 Five number summary: min, Q 1, median, Q 3, max Outlier: usually, a value higher/lower than 1.5 x IQR of Q 3 or Q 1 Variance and standard deviation (sample: s, population: σ) Variance: (algebraic, scalable computation) n n n s = ( xi x) = [ xi ( xi ) n 1 n 1 n i= 1 i= 1 i= 1 σσ 2 = EE[ XX EE XX 2 ] = EE XX 2 EE XX 2 2 ] Box Plot Standard deviation s (or σ) is the square root of variance s 2 (or σ 2) 12
13 Graphic Displays of Basic Statistical Descriptions Histogram: x-axis are values, y-axis repres. frequencies Scatter plot: each pair of values is a pair of coordinates and plotted as points in the plane 13

14 Histogram Analysis Histogram: Graph display of tabulated frequencies, shown as bars It shows what proportion of cases fall into each of several categories Differs from a bar chart in that it is the area of the bar that denotes the value, not the height as in bar charts, a crucial distinction when the categories are not of uniform width The categories are usually specified as non-overlapping intervals of some variable. The categories (bars) must be adjacent

15 Scatter plot Provides a first look at bivariate data to see clusters of points, outliers, etc Each pair of values is treated as a pair of coordinates and plotted as points in the plane 15
16 Positively and Negatively Correlated Data The left half fragment is positively correlated The right half is negative correlated 16
17 Uncorrelated Data 17
 of the k-dim.")
18 Scatterplot Matrices Used by ermission of M. Ward, Worcester Polytechnic Institute Matrix of scatterplots (x-y-diagrams) of the k-dim. data [total of kk 2 + kk unique scatterplots] 18
19 Vector Data: Prediction Vector Data Linear Regression Model Model Evaluation and Selection Summary 19
20 Linear Regression Ordinary Least Square Regression Closed form solution Gradient descent Linear Regression with Probabilistic Interpretation 20
21 The Linear Regression Problem Any Attributes to Continuous Value: x y {age; major ; gender; race} GPA {income; credit score; profession} loan {college; major ; GPA} future income 21
22 Example of House Price Living Area (sqft) # of Beds Price (1000$) x=(xx 1, xx 2 ) y yy = ββ 0 + ββ 1 xx 1 + ββ 2 xx 2 22
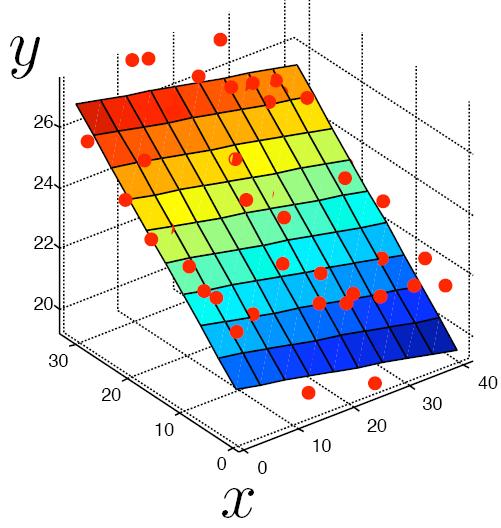
23 Illustration 23
24 Formalization Data: n independent data objects yy ii, ii = 1,, nn xx ii = xx iii, xx iii,, xx iiii T, i = 1,, nn A constant factor is added to model the bias term, i. e., xx iii = 1 T New x: xx ii = xx iii, xx iii, xx iii,, xx iiii Model: yy: dependent variable xx: explanatory variables ββ = ββ 0, ββ 1,, ββ pp TT : wwwwwwwwwww vvvvvvvvvvvv yy = xx TT ββ = ββ 0 + xx 1 ββ 1 + xx 2 ββ xx pp ββ pp 24
25 Model Construction A 3-step Process Use training data to find the best parameter ββ, denoted as ββ Model Selection Use validation data to select the best model E.g., Feature selection Model Usage Apply the model to the unseen data (test data): yy = xx TT ββ 25
26 Least Square Estimation Cost function (Mean Square Error): JJ ββ = 1 2 ii xx ii TT ββ yy ii 2 /nn Matrix form: JJ ββ = Xββ yy TT (XXββ yy)/2nn 1, 1, 1, x 11 x i1 x n1 or Xββ yy 2 /2nn x 1f x if x nf x 1p x ip x np XX: nn pp + 11 matrix yy 1 yy ii yy nn y: nn 11 vvvvvvvvvvvv 26
27 Ordinary Least Squares (OLS) Goal: find ββ that minimizes JJ ββ JJ ββ = 1 2nn Xββ yy TT XXββ yy = 1 2nn (ββtt XX TT XXββ yy TT XXββ ββ TT XX TT yy + yy TT yy) Ordinary least squares Set first derivative of JJ ββ as 0 ββ = (XXTT XXββ XX TT yy)/nn = 0 ββ = XX TT XX 1 XX TT yy More about matrix calculus: Z 27
28 Gradient Descent Minimize the cost function by moving down in the steepest direction 28
29 Batch Gradient Descent Move in the direction of steepest descend Repeat until converge { } ββ (tt+1) :=ββ (t) ηη ββ ββ=ββ (t), e.g., ηη = 0.01 Where JJ ββ = 1 2 ii xx TT 2 ii ββ yy ii /nn = ii JJ ii (ββ)/nn and ββ = JJ ii ββ /nn = xx ii xx TT ii ββ yy ii /nn ii ii 29
30 Stochastic Gradient Descent When a new observation, i, comes in, update weight immediately (extremely useful for largescale datasets): Repeat { for i=1:n { ββ (tt+1) :=ββ (t) + ηη(yy ii xx ii TT ββ (tt) )xx ii } } If the prediction for object i is smaller than the real value, ββ should move forward to the direction of xx ii 30

31 Probabilistic Interpretation Review of normal distribution X~NN μμ, σσ 2 ff XX = xx = 1 2ππσσ 2 ee xx μμ 2 2σσ 2 31
32 Probabilistic Interpretation Model: yy ii = xx ii TT ββ + ε ii ε ii ~NN(0, σσ 2 ) yy ii xx ii, ββ~nn(xx ii TT ββ, σσ 2 ) EE yy ii xx ii Likelihood: = xx ii TT ββ LL ββ = ii pp yy ii xx ii, ββ) = ii 1 exp{ yy 2 TT ii xx ii ββ 2ππσσ 2 2σσ 2 } Maximum Likelihood Estimation find ββ that maximizes L ββ arg max LL = arg min JJ, Equivalent to OLS! 32
33 Other Practical Issues Handle different scales of numerical attributes Z-score: zz = xx μμ σσ x: raw score to be standardized, μ: mean of the population, σ: standard deviation What if some attributes are nominal? Set dummy variables E.g., xx = 1, iiii ssssss = FF; xx = 0, iiii ssssss = MM Nominal variable with multiple values? Create more dummy variables for one variable What if some attribute are ordinal? replace x if by their rank Type equation here. r { 1,, M if f map the range of each variable onto [0, 1] by replacing i-th object in the f-th variable by zz iiii = rr iiii 1 MM ff 1 } 33
34 Other Practical Issues What if XX TT XX is not invertible? Add a small portion of identity matrix, λii, to it ridge regression or linear regression with l2 norm What if non-linear correlation exists? Transform features, say, xx to xx 2 34
35 Vector Data: Prediction Vector Data Linear Regression Model Model Evaluation and Selection Summary 35
36 Model Selection Problem Basic problem: how to choose between competing linear regression models Model too simple: underfit the data; poor predictions; high bias; low variance Model too complex: overfit the data; poor predictions; low bias; high variance Model just right: balance bias and variance to get good predictions 36
37 Bias: EE( ff xx ) ff(xx) Bias and Variance True predictor ff xx : xx TT ββ Estimated predictor ff xx : xx TT ββ How far away is the expectation of the estimator to the true value? The smaller the better. Variance: VVVVVV ff xx = EE[ ff xx EE ff xx How variant is the estimator? The smaller the better. Reconsider mean square error 2 ] JJ ββ /nn = ii xx ii TT ββ yy ii 2 /nn Can be considered as EE[ ff xx ff(xx) εε 2 ] = bbbbbbss 2 + vvvvvvvvvvvvvvvv + nnnnnnnnnn Note EE εε = 0, VVVVVV εε = σσ 2 37
38 Bias-Variance Trade-off 38
39 Example: degree d in regression 39
40 Example: regularization term in regression 40

41 Cross-Validation Partition the data into K folds Use K-1 fold as training, and 1 fold as testing Calculate the average accuracy best on K training-testing pairs Accuracy on validation/test dataset! Mean square error can again be used: ii xx ii TT ββ yy ii 2 /nn 41
 BIIII = kkkkkk(nn) 2ln( LL), Where n is the number of")
42 AIC & BIC* AIC and BIC can be used to test the quality of statistical models AIC (Akaike information criterion) AAAAAA = 2kk 2ln( LL), where k is the number of parameters in the model and LL is the likelihood under the estimated parameter BIC (Bayesian Information criterion) BIIII = kkkkkk(nn) 2ln( LL), Where n is the number of objects 42
43 Stepwise Feature Selection Avoid brute-force selection 2 pp Forward selection Starting with the best single feature Always add the feature that improves the performance best Stop if no feature will further improve the performance Backward elimination Start with the full model Always remove the feature that results in the best performance enhancement Stop if removing any feature will get worse performance 43
44 Vector Data: Prediction Vector Data Linear Regression Model Model Evaluation and Selection Summary 44
45 Summary What is vector data? Attribute types Basic statistics Visualization Linear regression OLS Probabilistic interpretation Model Evaluation and Selection Bias-Variance Trade-off Mean square error Cross-validation, AIC, BIC, step-wise feature selection 45
CS6220: DATA MINING TECHNIQUES
 CS6220: DATA MINING TECHNIQUES Matrix Data: Prediction Instructor: Yizhou Sun yzsun@ccs.neu.edu September 21, 2015 Announcements TA Monisha s office hour has changed to Thursdays 10-12pm, 462WVH (the same
CS6220: DATA MINING TECHNIQUES
 CS6220: DATA MINING TECHNIQUES Matrix Data: Prediction Instructor: Yizhou Sun yzsun@ccs.neu.edu September 14, 2014 Today s Schedule Course Project Introduction Linear Regression Model Decision Tree 2 Methods
ECLT 5810 Data Preprocessing. Prof. Wai Lam
 ECLT 5810 Data Preprocessing Prof. Wai Lam Why Data Preprocessing? Data in the real world is imperfect incomplete: lacking attribute values, lacking certain attributes of interest, or containing only aggregate
ANÁLISE DOS DADOS. Daniela Barreiro Claro
 ANÁLISE DOS DADOS Daniela Barreiro Claro Outline Data types Graphical Analysis Proimity measures Prof. Daniela Barreiro Claro Types of Data Sets Record Ordered Relational records Video data: sequence of
Getting To Know Your Data
 Getting To Know Your Data Road Map 1. Data Objects and Attribute Types 2. Descriptive Data Summarization 3. Measuring Data Similarity and Dissimilarity Data Objects and Attribute Types Types of data sets
Descriptive Data Summarization
 Descriptive Data Summarization Descriptive data summarization gives the general characteristics of the data and identify the presence of noise or outliers, which is useful for successful data cleaning
Chapter I: Introduction & Foundations
 Chapter I: Introduction & Foundations } 1.1 Introduction 1.1.1 Definitions & Motivations 1.1.2 Data to be Mined 1.1.3 Knowledge to be discovered 1.1.4 Techniques Utilized 1.1.5 Applications Adapted 1.1.6
CS145: INTRODUCTION TO DATA MINING
 CS145: INTRODUCTION TO DATA MINING 5: Vector Data: Support Vector Machine Instructor: Yizhou Sun yzsun@cs.ucla.edu October 18, 2017 Homework 1 Announcements Due end of the day of this Thursday (11:59pm)
CS145: INTRODUCTION TO DATA MINING
 CS145: INTRODUCTION TO DATA MINING 4: Vector Data: Decision Tree Instructor: Yizhou Sun yzsun@cs.ucla.edu October 10, 2017 Methods to Learn Vector Data Set Data Sequence Data Text Data Classification Clustering
CS249: ADVANCED DATA MINING
 CS249: ADVANCED DATA MINING Vector Data: Clustering: Part II Instructor: Yizhou Sun yzsun@cs.ucla.edu May 3, 2017 Methods to Learn: Last Lecture Classification Clustering Vector Data Text Data Recommender
CS145: INTRODUCTION TO DATA MINING
 CS145: INTRODUCTION TO DATA MINING Text Data: Topic Model Instructor: Yizhou Sun yzsun@cs.ucla.edu December 4, 2017 Methods to be Learnt Vector Data Set Data Sequence Data Text Data Classification Clustering
MSCBD 5002/IT5210: Knowledge Discovery and Data Minig
 MSCBD 5002/IT5210: Knowledge Discovery and Data Minig Instructor: Lei Chen Acknowledgement: Slides modified by Dr. Lei Chen based on the slides provided by Jiawei Han, Micheline Kamber, and Jian Pei and
CS6220: DATA MINING TECHNIQUES
 CS6220: DATA MINING TECHNIQUES Matrix Data: Clustering: Part 2 Instructor: Yizhou Sun yzsun@ccs.neu.edu November 3, 2015 Methods to Learn Matrix Data Text Data Set Data Sequence Data Time Series Graph
CS249: ADVANCED DATA MINING
 CS249: ADVANCED DATA MINING Clustering Evaluation and Practical Issues Instructor: Yizhou Sun yzsun@cs.ucla.edu May 2, 2017 Announcements Homework 2 due later today Due May 3 rd (11:59pm) Course project
P8130: Biostatistical Methods I
 P8130: Biostatistical Methods I Lecture 2: Descriptive Statistics Cody Chiuzan, PhD Department of Biostatistics Mailman School of Public Health (MSPH) Lecture 1: Recap Intro to Biostatistics Types of Data
Lecture 3. STAT161/261 Introduction to Pattern Recognition and Machine Learning Spring 2018 Prof. Allie Fletcher
 Lecture 3 STAT161/261 Introduction to Pattern Recognition and Machine Learning Spring 2018 Prof. Allie Fletcher Previous lectures What is machine learning? Objectives of machine learning Supervised and
CS6220: DATA MINING TECHNIQUES
 CS6220: DATA MINING TECHNIQUES Matrix Data: Classification: Part 2 Instructor: Yizhou Sun yzsun@ccs.neu.edu September 21, 2014 Methods to Learn Matrix Data Set Data Sequence Data Time Series Graph & Network
Data Mining Techniques. Lecture 2: Regression
 Data Mining Techniques CS 6220 - Section 3 - Fall 2016 Lecture 2: Regression Jan-Willem van de Meent (credit: Yijun Zhao, Marc Toussaint, Bishop) Administrativa Instructor Jan-Willem van de Meent Email:
Variable Selection in Predictive Regressions
 Variable Selection in Predictive Regressions Alessandro Stringhi Advanced Financial Econometrics III Winter/Spring 2018 Overview This chapter considers linear models for explaining a scalar variable when
CS6220: DATA MINING TECHNIQUES
 CS6220: DATA MINING TECHNIQUES Matrix Data: Clustering: Part 2 Instructor: Yizhou Sun yzsun@ccs.neu.edu October 19, 2014 Methods to Learn Matrix Data Set Data Sequence Data Time Series Graph & Network
Machine Learning Linear Regression. Prof. Matteo Matteucci
 Machine Learning Linear Regression Prof. Matteo Matteucci Outline 2 o Simple Linear Regression Model Least Squares Fit Measures of Fit Inference in Regression o Multi Variate Regession Model Least Squares
Machine learning comes from Bayesian decision theory in statistics. There we want to minimize the expected value of the loss function.
 Bayesian learning: Machine learning comes from Bayesian decision theory in statistics. There we want to minimize the expected value of the loss function. Let y be the true label and y be the predicted
CS249: ADVANCED DATA MINING
 CS249: ADVANCED DATA MINING Support Vector Machine and Neural Network Instructor: Yizhou Sun yzsun@cs.ucla.edu April 24, 2017 Homework 1 Announcements Due end of the day of this Friday (11:59pm) Reminder
CS 6375 Machine Learning
 CS 6375 Machine Learning Nicholas Ruozzi University of Texas at Dallas Slides adapted from David Sontag and Vibhav Gogate Course Info. Instructor: Nicholas Ruozzi Office: ECSS 3.409 Office hours: Tues.
Lecture 10: Logistic Regression
 BIOINF 585: Machine Learning for Systems Biology & Clinical Informatics Lecture 10: Logistic Regression Jie Wang Department of Computational Medicine & Bioinformatics University of Michigan 1 Outline An
CS6220: DATA MINING TECHNIQUES
 CS6220: DATA MINING TECHNIQUES Mining Graph/Network Data Instructor: Yizhou Sun yzsun@ccs.neu.edu November 16, 2015 Methods to Learn Classification Clustering Frequent Pattern Mining Matrix Data Decision
Linear Models for Regression CS534
 Linear Models for Regression CS534 Example Regression Problems Predict housing price based on House size, lot size, Location, # of rooms Predict stock price based on Price history of the past month Predict
Overfitting, Bias / Variance Analysis
 Overfitting, Bias / Variance Analysis Professor Ameet Talwalkar Professor Ameet Talwalkar CS260 Machine Learning Algorithms February 8, 207 / 40 Outline Administration 2 Review of last lecture 3 Basic
CS249: ADVANCED DATA MINING
 CS249: ADVANCED DATA MINING Graph and Network Instructor: Yizhou Sun yzsun@cs.ucla.edu May 31, 2017 Methods Learnt Classification Clustering Vector Data Text Data Recommender System Decision Tree; Naïve
Unit 2. Describing Data: Numerical
 Unit 2 Describing Data: Numerical Describing Data Numerically Describing Data Numerically Central Tendency Arithmetic Mean Median Mode Variation Range Interquartile Range Variance Standard Deviation Coefficient
ECE521 week 3: 23/26 January 2017
 ECE521 week 3: 23/26 January 2017 Outline Probabilistic interpretation of linear regression - Maximum likelihood estimation (MLE) - Maximum a posteriori (MAP) estimation Bias-variance trade-off Linear
MATH 1150 Chapter 2 Notation and Terminology
 MATH 1150 Chapter 2 Notation and Terminology Categorical Data The following is a dataset for 30 randomly selected adults in the U.S., showing the values of two categorical variables: whether or not the
Linear Models for Regression CS534
 Linear Models for Regression CS534 Prediction Problems Predict housing price based on House size, lot size, Location, # of rooms Predict stock price based on Price history of the past month Predict the
Statistical Learning with the Lasso, spring The Lasso
 Statistical Learning with the Lasso, spring 2017 1 Yeast: understanding basic life functions p=11,904 gene values n number of experiments ~ 10 Blomberg et al. 2003, 2010 The Lasso fmri brain scans function
Linear Models for Regression CS534
 Linear Models for Regression CS534 Example Regression Problems Predict housing price based on House size, lot size, Location, # of rooms Predict stock price based on Price history of the past month Predict
Linear Regression (continued)
") Linear Regression (continued) Professor Ameet Talwalkar Professor Ameet Talwalkar CS260 Machine Learning Algorithms February 6, 2017 1 / 39 Outline 1 Administration 2 Review of last lecture 3 Linear regression
Linear Regression (continued) Professor Ameet Talwalkar Professor Ameet Talwalkar CS260 Machine Learning Algorithms February 6, 2017 1 / 39 Outline 1 Administration 2 Review of last lecture 3 Linear regression
Chapter 3. Data Description
 Chapter 3. Data Description Graphical Methods Pie chart It is used to display the percentage of the total number of measurements falling into each of the categories of the variable by partition a circle.
Lecture 3. Linear Regression
 Lecture 3. Linear Regression COMP90051 Statistical Machine Learning Semester 2, 2017 Lecturer: Andrey Kan Copyright: University of Melbourne Weeks 2 to 8 inclusive Lecturer: Andrey Kan MS: Moscow, PhD:
Chapter 1 - Lecture 3 Measures of Location
 Chapter 1 - Lecture 3 of Location August 31st, 2009 Chapter 1 - Lecture 3 of Location General Types of measures Median Skewness Chapter 1 - Lecture 3 of Location Outline General Types of measures What
Variations. ECE 6540, Lecture 02 Multivariate Random Variables & Linear Algebra
 Variations ECE 6540, Lecture 02 Multivariate Random Variables & Linear Algebra Last Time Probability Density Functions Normal Distribution Expectation / Expectation of a function Independence Uncorrelated
Descriptive Univariate Statistics and Bivariate Correlation
 ESC 100 Exploring Engineering Descriptive Univariate Statistics and Bivariate Correlation Instructor: Sudhir Khetan, Ph.D. Wednesday/Friday, October 17/19, 2012 The Central Dogma of Statistics used to
CS6220: DATA MINING TECHNIQUES
 CS6220: DATA MINING TECHNIQUES Mining Graph/Network Data Instructor: Yizhou Sun yzsun@ccs.neu.edu March 16, 2016 Methods to Learn Classification Clustering Frequent Pattern Mining Matrix Data Decision
1-1. Chapter 1. Sampling and Descriptive Statistics by The McGraw-Hill Companies, Inc. All rights reserved.
 1-1 Chapter 1 Sampling and Descriptive Statistics 1-2 Why Statistics? Deal with uncertainty in repeated scientific measurements Draw conclusions from data Design valid experiments and draw reliable conclusions
Math, Stats, and Mathstats Review ECONOMETRICS (ECON 360) BEN VAN KAMMEN, PHD
 BEN VAN KAMMEN, PHD") Math, Stats, and Mathstats Review ECONOMETRICS (ECON 360) BEN VAN KAMMEN, PHD Outline These preliminaries serve to signal to students what tools they need to know to succeed in ECON 360 and refresh their
Math, Stats, and Mathstats Review ECONOMETRICS (ECON 360) BEN VAN KAMMEN, PHD Outline These preliminaries serve to signal to students what tools they need to know to succeed in ECON 360 and refresh their
CIVL 7012/8012. Collection and Analysis of Information
 CIVL 7012/8012 Collection and Analysis of Information Uncertainty in Engineering Statistics deals with the collection and analysis of data to solve real-world problems. Uncertainty is inherent in all real
Lecture 6. Notes on Linear Algebra. Perceptron
 Lecture 6. Notes on Linear Algebra. Perceptron COMP90051 Statistical Machine Learning Semester 2, 2017 Lecturer: Andrey Kan Copyright: University of Melbourne This lecture Notes on linear algebra Vectors
CLUe Training An Introduction to Machine Learning in R with an example from handwritten digit recognition
 CLUe Training An Introduction to Machine Learning in R with an example from handwritten digit recognition Ad Feelders Universiteit Utrecht Department of Information and Computing Sciences Algorithmic Data
SUPERVISED LEARNING: INTRODUCTION TO CLASSIFICATION
 SUPERVISED LEARNING: INTRODUCTION TO CLASSIFICATION 1 Outline Basic terminology Features Training and validation Model selection Error and loss measures Statistical comparison Evaluation measures 2 Terminology
A is one of the categories into which qualitative data can be classified.
 Chapter 2 Methods for Describing Sets of Data 2.1 Describing qualitative data Recall qualitative data: non-numerical or categorical data Basic definitions: A is one of the categories into which qualitative
CSE5243 INTRO. TO DATA MINING
 CSE5243 INTRO. TO DATA MINING Data & Data Preprocessing Huan Sun, CSE@The Ohio State University Slides adapted from UIUC CS412, Fall 2017, by Prof. Jiawei Han 2 Data & Data Preprocessing What is Data:
Chart types and when to use them
 APPENDIX A Chart types and when to use them Pie chart Figure illustration of pie chart 2.3 % 4.5 % Browser Usage for April 2012 18.3 % 38.3 % Internet Explorer Firefox Chrome Safari Opera 35.8 % Pie chart
Machine Learning Linear Classification. Prof. Matteo Matteucci
 Machine Learning Linear Classification Prof. Matteo Matteucci Recall from the first lecture 2 X R p Regression Y R Continuous Output X R p Y {Ω 0, Ω 1,, Ω K } Classification Discrete Output X R p Y (X)
Chapter 1. Looking at Data
 Chapter 1 Looking at Data Types of variables Looking at Data Be sure that each variable really does measure what you want it to. A poor choice of variables can lead to misleading conclusions!! For example,
What is Statistics? Statistics is the science of understanding data and of making decisions in the face of variability and uncertainty.
 What is Statistics? Statistics is the science of understanding data and of making decisions in the face of variability and uncertainty. Statistics is a field of study concerned with the data collection,
Introduction to Machine Learning Midterm Exam
 10-701 Introduction to Machine Learning Midterm Exam Instructors: Eric Xing, Ziv Bar-Joseph 17 November, 2015 There are 11 questions, for a total of 100 points. This exam is open book, open notes, but
Chapter 6: Classification
 Ludwig-Maximilians-Universität München Institut für Informatik Lehr- und Forschungseinheit für Datenbanksysteme Knowledge Discovery in Databases SS 2016 Chapter 6: Classification Lecture: Prof. Dr. Thomas
AP Final Review II Exploring Data (20% 30%)
") AP Final Review II Exploring Data (20% 30%) Quantitative vs Categorical Variables Quantitative variables are numerical values for which arithmetic operations such as means make sense. It is usually a measure
AP Final Review II Exploring Data (20% 30%) Quantitative vs Categorical Variables Quantitative variables are numerical values for which arithmetic operations such as means make sense. It is usually a measure
CPSC 340: Machine Learning and Data Mining
 CPSC 340: Machine Learning and Data Mining Linear Classifiers: predictions Original version of these slides by Mark Schmidt, with modifications by Mike Gelbart. 1 Admin Assignment 4: Due Friday of next
CSC2515 Winter 2015 Introduction to Machine Learning. Lecture 2: Linear regression
 CSC2515 Winter 2015 Introduction to Machine Learning Lecture 2: Linear regression All lecture slides will be available as.pdf on the course website: http://www.cs.toronto.edu/~urtasun/courses/csc2515/csc2515_winter15.html
Tastitsticsss? What s that? Principles of Biostatistics and Informatics. Variables, outcomes. Tastitsticsss? What s that?
 Tastitsticsss? What s that? Statistics describes random mass phanomenons. Principles of Biostatistics and Informatics nd Lecture: Descriptive Statistics 3 th September Dániel VERES Data Collecting (Sampling)
General Linear Models. with General Linear Hypothesis Tests and Likelihood Ratio Tests
 General Linear Models with General Linear Hypothesis Tests and Likelihood Ratio Tests 1 Background Linear combinations of Normals are Normal XX nn ~ NN μμ, ΣΣ AAAA ~ NN AAμμ, AAAAAA A sum of squared, standardized
STAT 200 Chapter 1 Looking at Data - Distributions
 STAT 200 Chapter 1 Looking at Data - Distributions What is Statistics? Statistics is a science that involves the design of studies, data collection, summarizing and analyzing the data, interpreting the
(quantitative or categorical variables) Numerical descriptions of center, variability, position (quantitative variables)
 Numerical descriptions of center, variability, position (quantitative variables)") 3. Descriptive Statistics Describing data with tables and graphs (quantitative or categorical variables) Numerical descriptions of center, variability, position (quantitative variables) Bivariate descriptions
3. Descriptive Statistics Describing data with tables and graphs (quantitative or categorical variables) Numerical descriptions of center, variability, position (quantitative variables) Bivariate descriptions
Chapter 2: Tools for Exploring Univariate Data
 Stats 11 (Fall 2004) Lecture Note Introduction to Statistical Methods for Business and Economics Instructor: Hongquan Xu Chapter 2: Tools for Exploring Univariate Data Section 2.1: Introduction What is
Machine Learning for OR & FE
 Machine Learning for OR & FE Regression II: Regularization and Shrinkage Methods Martin Haugh Department of Industrial Engineering and Operations Research Columbia University Email: martin.b.haugh@gmail.com
Lecture #11: Classification & Logistic Regression
 Lecture #11: Classification & Logistic Regression CS 109A, STAT 121A, AC 209A: Data Science Weiwei Pan, Pavlos Protopapas, Kevin Rader Fall 2016 Harvard University 1 Announcements Midterm: will be graded
Regression, Ridge Regression, Lasso
 Regression, Ridge Regression, Lasso Fabio G. Cozman - fgcozman@usp.br October 2, 2018 A general definition Regression studies the relationship between a response variable Y and covariates X 1,..., X n.
Linear Models for Regression. Sargur Srihari
 Linear Models for Regression Sargur srihari@cedar.buffalo.edu 1 Topics in Linear Regression What is regression? Polynomial Curve Fitting with Scalar input Linear Basis Function Models Maximum Likelihood
Linear Models in Machine Learning
 CS540 Intro to AI Linear Models in Machine Learning Lecturer: Xiaojin Zhu jerryzhu@cs.wisc.edu We briefly go over two linear models frequently used in machine learning: linear regression for, well, regression,
Midterm: CS 6375 Spring 2015 Solutions
 Midterm: CS 6375 Spring 2015 Solutions The exam is closed book. You are allowed a one-page cheat sheet. Answer the questions in the spaces provided on the question sheets. If you run out of room for an
EXAM IN STATISTICAL MACHINE LEARNING STATISTISK MASKININLÄRNING
 EXAM IN STATISTICAL MACHINE LEARNING STATISTISK MASKININLÄRNING DATE AND TIME: August 30, 2018, 14.00 19.00 RESPONSIBLE TEACHER: Niklas Wahlström NUMBER OF PROBLEMS: 5 AIDING MATERIAL: Calculator, mathematical
ISyE 691 Data mining and analytics
 ISyE 691 Data mining and analytics Regression Instructor: Prof. Kaibo Liu Department of Industrial and Systems Engineering UW-Madison Email: kliu8@wisc.edu Office: Room 3017 (Mechanical Engineering Building)
BIOL 51A - Biostatistics 1 1. Lecture 1: Intro to Biostatistics. Smoking: hazardous? FEV (l) Smoke
 Smoke") BIOL 51A - Biostatistics 1 1 Lecture 1: Intro to Biostatistics Smoking: hazardous? FEV (l) 1 2 3 4 5 No Yes Smoke BIOL 51A - Biostatistics 1 2 Box Plot a.k.a box-and-whisker diagram or candlestick chart
BIOL 51A - Biostatistics 1 1 Lecture 1: Intro to Biostatistics Smoking: hazardous? FEV (l) 1 2 3 4 5 No Yes Smoke BIOL 51A - Biostatistics 1 2 Box Plot a.k.a box-and-whisker diagram or candlestick chart
Linear Model Selection and Regularization
 Linear Model Selection and Regularization Recall the linear model Y = β 0 + β 1 X 1 + + β p X p + ɛ. In the lectures that follow, we consider some approaches for extending the linear model framework. In
Last Lecture. Distinguish Populations from Samples. Knowing different Sampling Techniques. Distinguish Parameters from Statistics
 Last Lecture Distinguish Populations from Samples Importance of identifying a population and well chosen sample Knowing different Sampling Techniques Distinguish Parameters from Statistics Knowing different
Multinomial Logistic Regression Model for Predicting Tornado Intensity Based on Path Length and Width
 World Environment 2014, 4(2): 61-66 DOI: 10.5923/j.env.20140402.02 Multinomial Logistic Regression Model for Predicting Caleb Michael Akers, Nathaniel John Smith, Naima Shifa * DePauw University, Greencastle,
Radial Basis Function (RBF) Networks
 Networks") CSE 5526: Introduction to Neural Networks Radial Basis Function (RBF) Networks 1 Function approximation We have been using MLPs as pattern classifiers But in general, they are function approximators Depending
CSE 5526: Introduction to Neural Networks Radial Basis Function (RBF) Networks 1 Function approximation We have been using MLPs as pattern classifiers But in general, they are function approximators Depending
FINAL: CS 6375 (Machine Learning) Fall 2014
 Fall 2014") FINAL: CS 6375 (Machine Learning) Fall 2014 The exam is closed book. You are allowed a one-page cheat sheet. Answer the questions in the spaces provided on the question sheets. If you run out of room for
FINAL: CS 6375 (Machine Learning) Fall 2014 The exam is closed book. You are allowed a one-page cheat sheet. Answer the questions in the spaces provided on the question sheets. If you run out of room for
Loss Functions and Optimization. Lecture 3-1
 Lecture 3: Loss Functions and Optimization Lecture 3-1 Administrative Assignment 1 is released: http://cs231n.github.io/assignments2017/assignment1/ Due Thursday April 20, 11:59pm on Canvas (Extending
Glossary for the Triola Statistics Series
 Glossary for the Triola Statistics Series Absolute deviation The measure of variation equal to the sum of the deviations of each value from the mean, divided by the number of values Acceptance sampling
Learning Objectives for Stat 225
 Learning Objectives for Stat 225 08/20/12 Introduction to Probability: Get some general ideas about probability, and learn how to use sample space to compute the probability of a specific event. Set Theory:
Measures of Central Tendency
 Measures of Central Tendency Summary Measures Summary Measures Central Tendency Mean Median Mode Quartile Range Variance Variation Coefficient of Variation Standard Deviation Measures of Central Tendency
COMS 4771 Regression. Nakul Verma
 COMS 4771 Regression Nakul Verma Last time Support Vector Machines Maximum Margin formulation Constrained Optimization Lagrange Duality Theory Convex Optimization SVM dual and Interpretation How get the
Course in Data Science
 Course in Data Science About the Course: In this course you will get an introduction to the main tools and ideas which are required for Data Scientist/Business Analyst/Data Analyst. The course gives an
Reminders. Thought questions should be submitted on eclass. Please list the section related to the thought question
 Linear regression Reminders Thought questions should be submitted on eclass Please list the section related to the thought question If it is a more general, open-ended question not exactly related to a
For instance, we want to know whether freshmen with parents of BA degree are predicted to get higher GPA than those with parents without BA degree.
 DESCRIPTIVE ANALYSIS For instance, we want to know whether freshmen with parents of BA degree are predicted to get higher GPA than those with parents without BA degree. Assume that we have data; what information
Hierarchical Generalized Linear Models. ERSH 8990 REMS Seminar on HLM Last Lecture!
 Hierarchical Generalized Linear Models ERSH 8990 REMS Seminar on HLM Last Lecture! Hierarchical Generalized Linear Models Introduction to generalized models Models for binary outcomes Interpreting parameter
Introduction to Machine Learning. Regression. Computer Science, Tel-Aviv University,
 1 Introduction to Machine Learning Regression Computer Science, Tel-Aviv University, 2013-14 Classification Input: X Real valued, vectors over real. Discrete values (0,1,2,...) Other structures (e.g.,
CS249: ADVANCED DATA MINING
 CS249: ADVANCED DATA MINING Recommender Systems Instructor: Yizhou Sun yzsun@cs.ucla.edu May 17, 2017 Methods Learnt: Last Lecture Classification Clustering Vector Data Text Data Recommender System Decision
Machine Learning. Lecture 4: Regularization and Bayesian Statistics. Feng Li. https://funglee.github.io
 Machine Learning Lecture 4: Regularization and Bayesian Statistics Feng Li fli@sdu.edu.cn https://funglee.github.io School of Computer Science and Technology Shandong University Fall 207 Overfitting Problem
Association studies and regression
 Association studies and regression CM226: Machine Learning for Bioinformatics. Fall 2016 Sriram Sankararaman Acknowledgments: Fei Sha, Ameet Talwalkar Association studies and regression 1 / 104 Administration
Biostatistics for biomedical profession. BIMM34 Karin Källen & Linda Hartman November-December 2015
 Biostatistics for biomedical profession BIMM34 Karin Källen & Linda Hartman November-December 2015 12015-11-02 Who needs a course in biostatistics? - Anyone who uses quntitative methods to interpret biological
Pattern Recognition and Machine Learning
 Christopher M. Bishop Pattern Recognition and Machine Learning ÖSpri inger Contents Preface Mathematical notation Contents vii xi xiii 1 Introduction 1 1.1 Example: Polynomial Curve Fitting 4 1.2 Probability
Introduction to Statistics
 Introduction to Statistics Data and Statistics Data consists of information coming from observations, counts, measurements, or responses. Statistics is the science of collecting, organizing, analyzing,
Machine Learning & Data Mining
 Group M L D Machine Learning M & Data Mining Chapter 7 Decision Trees Xin-Shun Xu @ SDU School of Computer Science and Technology, Shandong University Top 10 Algorithm in DM #1: C4.5 #2: K-Means #3: SVM
UNIVERSITY of PENNSYLVANIA CIS 520: Machine Learning Final, Fall 2013
 UNIVERSITY of PENNSYLVANIA CIS 520: Machine Learning Final, Fall 2013 Exam policy: This exam allows two one-page, two-sided cheat sheets; No other materials. Time: 2 hours. Be sure to write your name and
Lecture Slides. Elementary Statistics Tenth Edition. by Mario F. Triola. and the Triola Statistics Series. Slide 1
 Lecture Slides Elementary Statistics Tenth Edition and the Triola Statistics Series by Mario F. Triola Slide 1 Chapter 3 Statistics for Describing, Exploring, and Comparing Data 3-1 Overview 3-2 Measures
3 Lecture 3 Notes: Measures of Variation. The Boxplot. Definition of Probability
 3 Lecture 3 Notes: Measures of Variation. The Boxplot. Definition of Probability 3.1 Week 1 Review Creativity is more than just being different. Anybody can plan weird; that s easy. What s hard is to be
Introduction to Machine Learning Midterm Exam Solutions
 10-701 Introduction to Machine Learning Midterm Exam Solutions Instructors: Eric Xing, Ziv Bar-Joseph 17 November, 2015 There are 11 questions, for a total of 100 points. This exam is open book, open notes,
Ch 4. Linear Models for Classification
 Ch 4. Linear Models for Classification Pattern Recognition and Machine Learning, C. M. Bishop, 2006. Department of Computer Science and Engineering Pohang University of Science and echnology 77 Cheongam-ro,