CHAPTER 8 REGRESSION AND CORRELATION
|
|
|
- Esmond Singleton
- 5 years ago
- Views:
Transcription
1 CHAPTER 8 REGREION AND CORRELATION
2 Determg for relatoshps ad makg predctos based from sample formato s oe of the ma dea of data aalss. Everoe wats to aswer questos lke Ca I predct how ma uts I ll sell f I sped amout of advertsg dollars? ; or Does drkg more det cola reall relate to more weght ga? ; or Do chldre s backpacks seem to be gettg heaver each ear school, or s t just me? Lear regresso tres to fd relatoshps betwee two or more varables ad comes up wth a model that tres to descrbe that relatoshp, much lke the wa the le = + 3 eplas the relatoshp betwee ad. But ulke math where fuctos lke = + 3 tell the etre stor about the two varables, statstcs, thgs do t come out that perfectl; some varablt ad error s volved (that s what makes t fu!). 8.1 Lear Correlato aalss It s a statstcal techque to determe the stregth or degree of lear relatoshp estg betwee two varables. A measure of the degree of lear relatoshp s called the correlato coeffcet, ρ. The followg are some eamples of scatter dagrams of two varables X ad Y. (1) ρ < 0 () ρ > 0 (3) ρ = 0 Tpes of Correlato
3 Correlato betwee varables ca be classfed terms of t drectos ad magtude. o A postve lear correlato ests wheever the depedet varable creases, the depedet varable also creases or whe the depedet varable decreases, the depedet varable also decreases. o A egatve lear correlato ests wheever the depedet varable creases, the depedet varable also decreases or whe the depedet varable creases, the depedet varable decreases. o A zero lear correlato ests, f o lear relatoshp ests betwee depedet ad depedet varables. (t ma be so, that the relatoshp s ot lear, the relatoshp mght be a epoetal or logarthmc relatoshp). Note that ths does ot mea that there s o assocato betwee the depedet varable wth the depedet varable. The Pearso product-momet correlato coeffcet or smpl the sample correlato coeffcet, r, estmates the stregth of lear relatoshp betwee two varables X ad Y, where r 1 1 1, 1 1,
4 1 1 Sample coeffcet of determato epresses the proporto of the total varato of the depedet varable that s eplaed or accouted for b the depedet varable. The sample coeffcet of determato s computed b just squarg the sample coeffcet ad s deoted b r. Eample From a radom sample of 9 studets from a class, scores o the mdterm eam () ad the fal eam () were as follows: X Y a) Determe ad terpret r. b) Determe ad terpret r. Soluto The followg are maual computatos for the requred formula to derve the sample correlato coeffcet ad the coeffcet of determato.
5 Total * , , r r Thus, the sample correlato coeffcet s appromatel Ths dcates a strog postve lear relatoshp betwee the mdterm eam ad the fal eam scores. Ad the sample coeffcet of determato s appromatel or % whch dcates that appromatel % of the varablt of the fal eam score s accouted for b the mdterm eam score.
6 Eercse 8.1 Do the followg. 1.. A stud was made o the amout of coverted sugar a certa process at dfferece temperatures. The followg observatos were recorded. Temp () Coverted Sugar () Determe the sample correlato coeffcet ad the sample coeffcet of determato.. The followg data gve the tmes of 0 swmmers who etered a 5 ard freestle swmmg competto. The values are the swmmers best tme for the seaso ad the values are ther tmes the competto Determe the sample correlato coeffcet ad the sample coeffcet of determato.
7 8. Smple lear Regresso Aalss Regresso Aalss s a statstcal techque used for determg the fuctoal form of the relatoshp betwee two or more varables, where oe varable s called the depedet varable or the respose varable Y ad the rest are called the depedet or cocomtat varables X s. Is objectve s usuall to be able to predct or estmate the value of the respose varable gve the values of the depedet varable(s). I a math class, we have leared that relatoshps are dsplaed b meas of graphs. If we are gve the value of, we ca compute for the value of, as f predctg what should be the value of. But statstcs, relatoshps are ot that eas to predct. For stace, we kow that the heght of a perso has a fluece o hs weght. However, t s ot the ol reaso. Stll ma other factors affect the weght of a perso such as age, se, bod structure, other evrometal factors, ad geetc ssues. Oe wa of eplorg relatoshps s va scatter plots. The followg data shows 10 emploed dvduals from large compaes Makat, who were tervewed, the umber of ears the compa ad the umber of pad leaves s determed for each. No. of rs Servce No. of Leaves
8 No. ofpad Leaves Plottg the values a Cartesa coordate sstem we have the followg No. of Years Servce NOTE Two major codtos must be satsfed before applg the smple lear regresso model to a data. The depedet varable should have a ormal dstrbuto for each value of the depedet varable The depedet varable should have a costat amout of dsperso (stadard devato) for each value of the depedet varable.
9 The followg llustrato shows what the assumptos of lear regresso s. Smple lear regresso allows us to descrbe the relatoshp betwee a depedet varable Y ad the depedet varable X usg a lear equato kow as the smple lear regresso equato, Y o 1 X where β o ad β 1 are called the regresso coeffcets ad From a sample, a estmate of the regresso equato s of the form ŷ bo b1
10 where b1 ad bo b , 1 1, Eample A stud was made b a facal aalst of Jeas ad Shrts Ic. to determe the relatoshp betwee ther advertsg epedtures (X) ad sales (Y) (both hudred thousads of pesos). The followg data were recorded: Epedtures Sales Determe the regresso equato. We have the followg computatos:
11 Total From the above computatos we ote that Usg the formulas to derve the estmated regresso equato, we have
12 , , b Ad b o b 17 ( ) Thus the estmated regresso equato s gve b Note that ths procedure s ver tedous ad legth. However, ma statstcal packages ca easl compute the eeded formato to costruct the estmated regresso equato. Such statstcal tool s a plug- from Mcrosoft Ecel called PHStat.
13 The followg are computer geerated outputs from Ecel: Regresso Aalss Regresso Statstcs Multple R R Square Adjusted R Square Stadard Error Observatos 10 Coeffcets Stadard Error t Stat Itercept Epedtures Based from the computer output the regresso equato s gve b: Ths s what we epected ad the same wth our maual computato.,
14 Eercse Do the followg. 1. The followg are the test scores of 10 studets a pre test math ad ther fal eam calculus. Pretest Calculus Grade Determe the estmated regresso equato where depedet varable s the fal grade calculus.. Determe the estmated regresso equato for eercse 8.1 No. 1. Graph the estmated regresso le ad costruct a scatter plot of the gve data o the same graph. 3. Determe the estmated regresso equato for eercse 8.1 No.. Graph the estmated regresso le ad costruct a scatter plot of the gve data o the same graph. 8.3 Resduals A resdual s the dfferece betwee the observed value of ad the predcted value of ). Specfcall, for a data pot, ou take ts observed -value ; ths comes from the data set,
15 ad subtract the epected -value; ths s the value of, o the estmated le. If the resdual s large, the le does t ft well that spot. If the resdual s small, the le fts well that spot. I geeral, a postve resdual dcates that the estmated regresso equato uderestmated at that pot, ad a egatve resdual meas t overestmated at that pot. Resduals helps us determe whether the -values come from a ormal dstrbuto. Ths would allow us to measure how far off our predctos were from the actual observatos. Resduals also help detfg problems that occurred the process of trg to ft a straght le to the observatos. Ths s better vewed o a graph.
16 Based o the computed regresso equato, the followg resdual values are computed.
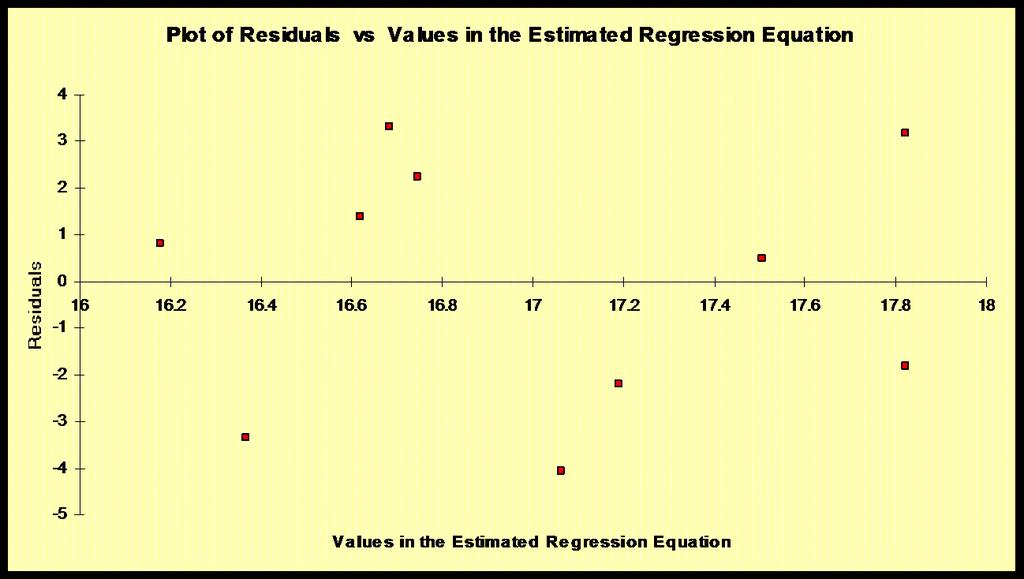
17 Observato Predcted Sales Resduals Stadardzed Resduals Stadardzed resduals just mea covertg the resduals to a Z-score, so ou see where t falls o the stadard ormal dstrbuto. Ths meas that we eed to use the formula, z where, ad are the mea ad stadard devato of the samplg dstrbuto of the resduals. The followg graphs shows the scatter plot of the data, resdual plot ad ormal probablt plot.
18
 resduals close to zero; ad fewer resduals as we go farther from zero.")
19 Note: the plot above s graphed usg PHStat of Mcrosoft Ecel. Checkg for ormalt s oe of the assumptos of the lear regresso model ad the resduals helps us determe f ths codto s met. Ad ths codto of ormalt s met, f we ca see o the resdual plot lots of(stadardzed) resduals close to zero; ad fewer resduals as we go farther from zero. The followg descrbes some gudeles o makg a correct cocluso ad terpretato of the results a data aalss. It s a usual mstake to terpret the result of a regresso aalss to a cause ad effect coclusos. However, ths ca ol be doe ad asserted f ad ol f the method or
20 procedure of collectg formato s doe b a well desged epermet that cotrols possble varable that ma affect the depedet as well as the depedet varable. If ths s ot the case the what we ca ol assert s that there s a relatoshp betwee the varables cocered. We caot clude the terpretato as to what s causg the relatoshp. Etrapolatg o the result of the regresso aalss. Ths s aother commo mstake whe dog coclusos a lear regresso aalss. For stace, the depedet varable s the lot area of a house. We caot assume the value of the depedet varable to be just 1 square feet or a value of 1, 000, 000 square feet. Or f the depedet varable s the heght of a tree, t makes o sese to use a egatve value of the depedet varable. Kow the lmtato of a smple lear regresso. Smple lear regresso does ot mea t s smple to compute or eas to work o. But t s smple a sese that we do t actuall cosder other factors ad just focus o a specfc oe. However, most varable that s usuall cosdered real world stuatos are affected b ot just oe factor or varable. Most lkel, a combato of ma factors would be approprate to aalze the behavor of oe varable. For stace, the heght of a perso s ot just affected b ts age, t ca also be affected b the evromet at whch the perso lves, aother factor would volve geetc structure of the perso, socal status of the perso, ad ma other factors.
21 Eercse Do the followg 1. OP compouds are used largel as pestcdes. However t s mportat to stud ther effects o speces that are eposed to them. A epermet was coducted whch dfferet doses of a partcular pestcde was admstered to 5 groups of 5 rabbts. The respose varable was a measure of bra actvt. It was postulated that bra actvt would decrease wth crease OP dosage. Dose Actvt Dose Actvt Dose Actvt Dose Actvt a) Obta the estmated lear regresso equato for bra actvt usg dosage as the depedet varable. b) Use the obtaed lear regresso equato obtaed (A) to predct bra actvt whe dosage s c) Compute the correlato coeffcet ad descrbe the relatoshp betwee bra actvt ad OP dosage.
22 . Determe resduals ad stadardzed resdual for eercse 8.1 No. 1. Plot the stadardzed resdual agast the estmated values of the depedet varable. (Use the stadardzed resduals as the as ad the estmated values of the depedet varable as the -as) Iterpret the result. 3. Determe resduals ad stadardzed resdual for eercse 8.1 No.. Plot the stadardzed resdual agast the estmated values of the depedet varable. (Use the stadardzed resduals as the as ad the estmated values of the depedet varable as the -as) Iterpret the graph. 4. A facal aalst wats to determe the relatoshp betwee the umbers of tem sold of a partcular product at dfferet stores metro mala. The followg sample data shows the umber of tems sold ad the regular prce of a certa product amog dfferet stores. Prce () Php Items Sold () a. Determe the regresso equato b. Compute the correlato coeffcet c. Determe the coeffcet of determato d. What s the epected umber of tems sold f the prce s Php0. e. Costruct a scatter plot for the sample data f. Sketch the estmated regresso equato the scatter plot g. Costruct a table for the resduals ad stadardzed resduals
23 Chapter Summar 1. The sample correlato coeffcet determes the drecto ad magtude of the lear relatoshp of the varables volved.. The coeffcet of determato epresses the accoutablt of the depedet varable to the varablt of the depedet varable. That s, the gve percetage measure the wa the depedet varable eplas the varablt of the depedet varable. 3. The scatter plot presets a vsual terpretato of the sample data. Ad mplctl dcates f there s a possblt of a lear relatoshp betwee the varables volved 4. Regresso aalss provdes a tool that helps statstcas predct values of a certa varable usg ts relatoshp wth aother varable. 5. I terpretg the result of a regresso aalss, the followg should be cosdered: Kow the lmtatos of the smple lear regresso Use values for the depedet varable that makes sese. Avod etrapolato. Do ot assume a cause ad effect coclusos whe the procedure of obtag the formato s ot eplctl dcated. Ths s to avod makg such assumptos that all other factors that ma affect the values of both the depedet ad depedet varable.


24 STATISTICAL TOOLS The followg are just some of the avalable statstcal tools that ca be used to ad the computato of comple formulas. PHStat for Mcrosoft Ecel Data Aalss Tool Pack for Mcrosoft Ecel. Statstca SAS SP MTab
25 Chapter Revew Wrte the letter correspodg to the correct aswer. 1. It determes f there s a lear relatoshp betwee two varables. a. regresso b. Mea c. coeffcet of varato d. correlato coeffcet. Whch correlato coeffcet represets the strogest lear relatoshp betwee two varables. a. 0.0 b. 0.5 c d Whch of the followg correlato coeffcet dcates a perfect lear relatoshp. a. 1 b. -1 c. both a ad b d. oe 4. Whch of the followg scatter plot dcates a perfect postve lear relatoshp? a. b. c. d. 5. The value of r = -0.5 meas that the relatoshp betwee the two varable s a. egatve lear b. postve lear c. o lear relatoshp d. caot be determed For os A mathematcs placemet test s gve to all eterg freshme at the Wsto Uverst. The followg are the score of 0 studets the placemet test ad ther respectve fourth ear fal grade math. Placemet Score 4th Yr Math Grade Placemet Score 4th Yr Math Grade
26 If the estmated regresso equato s costructed the equato would be a. ˆ b. ˆ c. ˆ d. ˆ Computg for the sample correlato coeffcet we would obta the value a b c d The sample coeffcet of determato s evaluated to be a % b % c % d % 9. The resdual s, whe the 4 th ear math grade s 80. a b c d
27 10. The estmated placemet test score s, where the 4 th ear math grade s 75. a. 7. b. 79 c 74. d If aother freshma applcat took the test, what would be hs epected grade f hs fal grade 4 th r math s 99. a. 99. b. 90 c 95 d Based from the data provded, the relatoshp betwee the math placemet scores ad the 4 th ear grade math shows, a. a postve lear relatoshp b. egatve lear relatoshp c o lear relatoshp d. o relatoshp 13. Whch of the followg s true about the relatoshp of the correlato coeffcet ad the slope of the estmated regresso equato? a. the have dfferet sgs b. the have the same sg c. the the same d. o cocluso ca be made For umber 14-18
28 The followg data shows the mleage of 10 trucks of Joh Lee Truckg Compa ad the umber of das for the delver. Mles () Das () If the estmated regresso equato s costructed the equato would be a. ˆ b. ˆ c. ˆ d. ˆ Computg for the sample correlato coeffcet we would obta the value a b c d The sample coeffcet of determato s evaluated to be a % b % c % d %
29 17. The resdual s, where the umber of mleage s 85. a b c d The estmated umber of das for delver s, where the umber of mleage s 750. a b c d What ca we sa about the relatoshp betwee the mleage of the trucks of the compa agast the umber of das for delver. a. whe the mleage creases the umber of das for delver also creases b. whe the mleage creases the umber of das for delver decreases c. the mleage has a effect wth the umber of das for delver d. the mleage does ot have a effect o the umber of das for delver 0. Whe small (large) value of the depedet varable are assocated wth small(large) values of a depedet varable, we ca sa that the relatoshp betwee the two varables s, a. egatve lear relatoshp b. postve lear relatoshp c. o lear relatoshp d. o relatoshp
30
Chapter Two. An Introduction to Regression ( )
") ubject: A Itroducto to Regresso Frst tage Chapter Two A Itroducto to Regresso (018-019) 1 pg. ubject: A Itroducto to Regresso Frst tage A Itroducto to Regresso Regresso aalss s a statstcal tool for the
ubject: A Itroducto to Regresso Frst tage Chapter Two A Itroducto to Regresso (018-019) 1 pg. ubject: A Itroducto to Regresso Frst tage A Itroducto to Regresso Regresso aalss s a statstcal tool for the
Statistics. Correlational. Dr. Ayman Eldeib. Simple Linear Regression and Correlation. SBE 304: Linear Regression & Correlation 1/3/2018
 /3/08 Sstems & Bomedcal Egeerg Departmet SBE 304: Bo-Statstcs Smple Lear Regresso ad Correlato Dr. Ama Eldeb Fall 07 Descrptve Orgasg, summarsg & descrbg data Statstcs Correlatoal Relatoshps Iferetal Geeralsg
Correlation and Regression Analysis
 Chapter V Correlato ad Regresso Aalss R. 5.. So far we have cosdered ol uvarate dstrbutos. Ma a tme, however, we come across problems whch volve two or more varables. Ths wll be the subject matter of the
Objectives of Multiple Regression
 Obectves of Multple Regresso Establsh the lear equato that best predcts values of a depedet varable Y usg more tha oe eplaator varable from a large set of potetal predctors {,,... k }. Fd that subset of
Chapter Business Statistics: A First Course Fifth Edition. Learning Objectives. Correlation vs. Regression. In this chapter, you learn:
 Chapter 3 3- Busess Statstcs: A Frst Course Ffth Edto Chapter 2 Correlato ad Smple Lear Regresso Busess Statstcs: A Frst Course, 5e 29 Pretce-Hall, Ic. Chap 2- Learg Objectves I ths chapter, you lear:
STA302/1001-Fall 2008 Midterm Test October 21, 2008
 STA3/-Fall 8 Mdterm Test October, 8 Last Name: Frst Name: Studet Number: Erolled (Crcle oe) STA3 STA INSTRUCTIONS Tme allowed: hour 45 mutes Ads allowed: A o-programmable calculator A table of values from
Statistics MINITAB - Lab 5
 Statstcs 10010 MINITAB - Lab 5 PART I: The Correlato Coeffcet Qute ofte statstcs we are preseted wth data that suggests that a lear relatoshp exsts betwee two varables. For example the plot below s of
 Regresso What s a Model? 1. Ofte Descrbe Relatoshp betwee Varables 2. Types - Determstc Models (o radomess) - Probablstc Models (wth radomess) EPI 809/Sprg 2008 9 Determstc Models 1. Hypothesze
Correlation and Simple Linear Regression
 Correlato ad Smple Lear Regresso Berl Che Departmet of Computer Scece & Iformato Egeerg Natoal Tawa Normal Uverst Referece:. W. Navd. Statstcs for Egeerg ad Scetsts. Chapter 7 (7.-7.3) & Teachg Materal
Chapter 13 Student Lecture Notes 13-1
 Chapter 3 Studet Lecture Notes 3- Basc Busess Statstcs (9 th Edto) Chapter 3 Smple Lear Regresso 4 Pretce-Hall, Ic. Chap 3- Chapter Topcs Types of Regresso Models Determg the Smple Lear Regresso Equato
Multiple Regression. More than 2 variables! Grade on Final. Multiple Regression 11/21/2012. Exam 2 Grades. Exam 2 Re-grades
 STAT 101 Dr. Kar Lock Morga 11/20/12 Exam 2 Grades Multple Regresso SECTIONS 9.2, 10.1, 10.2 Multple explaatory varables (10.1) Parttog varablty R 2, ANOVA (9.2) Codtos resdual plot (10.2) Trasformatos
Simple Linear Regression
 Statstcal Methods I (EST 75) Page 139 Smple Lear Regresso Smple regresso applcatos are used to ft a model descrbg a lear relatoshp betwee two varables. The aspects of least squares regresso ad correlato
Lecture 7. Confidence Intervals and Hypothesis Tests in the Simple CLR Model
 Lecture 7. Cofdece Itervals ad Hypothess Tests the Smple CLR Model I lecture 6 we troduced the Classcal Lear Regresso (CLR) model that s the radom expermet of whch the data Y,,, K, are the outcomes. The
12.2 Estimating Model parameters Assumptions: ox and y are related according to the simple linear regression model
 1. Estmatg Model parameters Assumptos: ox ad y are related accordg to the smple lear regresso model (The lear regresso model s the model that says that x ad y are related a lear fasho, but the observed
Mean is only appropriate for interval or ratio scales, not ordinal or nominal.
 Mea Same as ordary average Sum all the data values ad dvde by the sample sze. x = ( x + x +... + x Usg summato otato, we wrte ths as x = x = x = = ) x Mea s oly approprate for terval or rato scales, ot
ENGI 3423 Simple Linear Regression Page 12-01
 ENGI 343 mple Lear Regresso Page - mple Lear Regresso ometmes a expermet s set up where the expermeter has cotrol over the values of oe or more varables X ad measures the resultg values of aother varable
Multiple Choice Test. Chapter Adequacy of Models for Regression
 Multple Choce Test Chapter 06.0 Adequac of Models for Regresso. For a lear regresso model to be cosdered adequate, the percetage of scaled resduals that eed to be the rage [-,] s greater tha or equal to
UNIT 7 RANK CORRELATION
 UNIT 7 RANK CORRELATION Rak Correlato Structure 7. Itroucto Objectves 7. Cocept of Rak Correlato 7.3 Dervato of Rak Correlato Coeffcet Formula 7.4 Te or Repeate Raks 7.5 Cocurret Devato 7.6 Summar 7.7
Linear Regression with One Regressor
 Lear Regresso wth Oe Regressor AIM QA.7. Expla how regresso aalyss ecoometrcs measures the relatoshp betwee depedet ad depedet varables. A regresso aalyss has the goal of measurg how chages oe varable,
Summary of the lecture in Biostatistics
 Summary of the lecture Bostatstcs Probablty Desty Fucto For a cotuos radom varable, a probablty desty fucto s a fucto such that: 0 dx a b) b a dx A probablty desty fucto provdes a smple descrpto of the
Lecture Notes Types of economic variables
 Lecture Notes 3 1. Types of ecoomc varables () Cotuous varable takes o a cotuum the sample space, such as all pots o a le or all real umbers Example: GDP, Polluto cocetrato, etc. () Dscrete varables fte
Previous lecture. Lecture 8. Learning outcomes of this lecture. Today. Statistical test and Scales of measurement. Correlation
 Lecture 8 Emprcal Research Methods I434 Quattatve Data aalss II Relatos Prevous lecture Idea behd hpothess testg Is the dfferece betwee two samples a reflecto of the dfferece of two dfferet populatos or
"It is the mark of a truly intelligent person to be moved by statistics." George Bernard Shaw
 Chapter 0 Chapter 0 Lear Regresso ad Correlato "It s the mark of a truly tellget perso to be moved by statstcs." George Berard Shaw Source: https://www.google.com.ph/search?q=house+ad+car+pctures&bw=366&bh=667&tbm
Chapter 2 Supplemental Text Material
 -. Models for the Data ad the t-test Chapter upplemetal Text Materal The model preseted the text, equato (-3) s more properl called a meas model. ce the mea s a locato parameter, ths tpe of model s also
Simple Linear Regression
 Correlato ad Smple Lear Regresso Berl Che Departmet of Computer Scece & Iformato Egeerg Natoal Tawa Normal Uversty Referece:. W. Navd. Statstcs for Egeerg ad Scetsts. Chapter 7 (7.-7.3) & Teachg Materal
residual. (Note that usually in descriptions of regression analysis, upper-case
 Regresso Aalyss Regresso aalyss fts or derves a model that descres the varato of a respose (or depedet ) varale as a fucto of oe or more predctor (or depedet ) varales. The geeral regresso model s oe of
Simple Linear Regression - Scalar Form
 Smple Lear Regresso - Scalar Form Q.. Model Y X,..., p..a. Derve the ormal equatos that mmze Q. p..b. Solve for the ordary least squares estmators, p..c. Derve E, V, E, V, COV, p..d. Derve the mea ad varace
Ordinary Least Squares Regression. Simple Regression. Algebra and Assumptions.
 Ordary Least Squares egresso. Smple egresso. Algebra ad Assumptos. I ths part of the course we are gog to study a techque for aalysg the lear relatoshp betwee two varables Y ad X. We have pars of observatos
Midterm Exam 1, section 2 (Solution) Thursday, February hour, 15 minutes
 Thursday, February hour, 15 minutes") coometrcs, CON Sa Fracsco State Uverst Mchael Bar Sprg 5 Mdterm xam, secto Soluto Thursda, Februar 6 hour, 5 mutes Name: Istructos. Ths s closed book, closed otes exam.. No calculators of a kd are allowed..
coometrcs, CON Sa Fracsco State Uverst Mchael Bar Sprg 5 Mdterm xam, secto Soluto Thursda, Februar 6 hour, 5 mutes Name: Istructos. Ths s closed book, closed otes exam.. No calculators of a kd are allowed..
Probability and. Lecture 13: and Correlation
 933 Probablty ad Statstcs for Software ad Kowledge Egeers Lecture 3: Smple Lear Regresso ad Correlato Mocha Soptkamo, Ph.D. Outle The Smple Lear Regresso Model (.) Fttg the Regresso Le (.) The Aalyss of
Example: Multiple linear regression. Least squares regression. Repetition: Simple linear regression. Tron Anders Moger
 Example: Multple lear regresso 5000,00 4000,00 Tro Aders Moger 0.0.007 brthweght 3000,00 000,00 000,00 0,00 50,00 00,00 50,00 00,00 50,00 weght pouds Repetto: Smple lear regresso We defe a model Y = β0
Midterm Exam 1, section 1 (Solution) Thursday, February hour, 15 minutes
 Thursday, February hour, 15 minutes") coometrcs, CON Sa Fracsco State Uversty Mchael Bar Sprg 5 Mdterm am, secto Soluto Thursday, February 6 hour, 5 mutes Name: Istructos. Ths s closed book, closed otes eam.. No calculators of ay kd are allowed..
coometrcs, CON Sa Fracsco State Uversty Mchael Bar Sprg 5 Mdterm am, secto Soluto Thursday, February 6 hour, 5 mutes Name: Istructos. Ths s closed book, closed otes eam.. No calculators of ay kd are allowed..
Functions of Random Variables
 Fuctos of Radom Varables Chapter Fve Fuctos of Radom Varables 5. Itroducto A geeral egeerg aalyss model s show Fg. 5.. The model output (respose) cotas the performaces of a system or product, such as weght,
Analyzing Two-Dimensional Data. Analyzing Two-Dimensional Data
 /7/06 Aalzg Two-Dmesoal Data The most commo aaltcal measuremets volve the determato of a ukow cocetrato based o the respose of a aaltcal procedure (usuall strumetal). Such a measuremet requres calbrato,
Lecture 8: Linear Regression
 Lecture 8: Lear egresso May 4, GENOME 56, Sprg Goals Develop basc cocepts of lear regresso from a probablstc framework Estmatg parameters ad hypothess testg wth lear models Lear regresso Su I Lee, CSE
Johns Hopkins University Department of Biostatistics Math Review for Introductory Courses
 Johs Hopks Uverst Departmet of Bostatstcs Math Revew for Itroductor Courses Ratoale Bostatstcs courses wll rel o some fudametal mathematcal relatoshps, fuctos ad otato. The purpose of ths Math Revew s
CLASS NOTES. for. PBAF 528: Quantitative Methods II SPRING Instructor: Jean Swanson. Daniel J. Evans School of Public Affairs
 CLASS NOTES for PBAF 58: Quattatve Methods II SPRING 005 Istructor: Jea Swaso Dael J. Evas School of Publc Affars Uversty of Washgto Ackowledgemet: The structor wshes to thak Rachel Klet, Assstat Professor,
Statistics: Unlocking the Power of Data Lock 5
 STAT 0 Dr. Kar Lock Morga Exam 2 Grades: I- Class Multple Regresso SECTIONS 9.2, 0., 0.2 Multple explaatory varables (0.) Parttog varablty R 2, ANOVA (9.2) Codtos resdual plot (0.2) Exam 2 Re- grades Re-
ECON 482 / WH Hong The Simple Regression Model 1. Definition of the Simple Regression Model
 ECON 48 / WH Hog The Smple Regresso Model. Defto of the Smple Regresso Model Smple Regresso Model Expla varable y terms of varable x y = β + β x+ u y : depedet varable, explaed varable, respose varable,
Lecture 1: Introduction to Regression
 Lecture : Itroducto to Regresso A Eample: Eplag State Homcde Rates What kds of varables mght we use to epla/predct state homcde rates? Let s cosder just oe predctor for ow: povert Igore omtted varables,
: At least two means differ SST
 Formula Card for Eam 3 STA33 ANOVA F-Test: Completely Radomzed Desg ( total umber of observatos, k = Number of treatmets,& T = total for treatmet ) Step : Epress the Clam Step : The ypotheses: :... 0 A
Johns Hopkins University Department of Biostatistics Math Review for Introductory Courses
 Johs Hopks Uverst Departmet of Bostatstcs Math Revew for Itroductor Courses Ratoale Bostatstcs courses wll rel o some fudametal mathematcal relatoshps, fuctos ad otato. The purpose of ths Math Revew s
b. There appears to be a positive relationship between X and Y; that is, as X increases, so does Y.
 .46. a. The frst varable (X) s the frst umber the par ad s plotted o the horzotal axs, whle the secod varable (Y) s the secod umber the par ad s plotted o the vertcal axs. The scatterplot s show the fgure
Comparison of Dual to Ratio-Cum-Product Estimators of Population Mean
 Research Joural of Mathematcal ad Statstcal Sceces ISS 30 6047 Vol. 1(), 5-1, ovember (013) Res. J. Mathematcal ad Statstcal Sc. Comparso of Dual to Rato-Cum-Product Estmators of Populato Mea Abstract
Simple Linear Regression and Correlation.
 Smple Lear Regresso ad Correlato. Correspods to Chapter 0 Tamhae ad Dulop Sldes prepared b Elzabeth Newto (MIT) wth some sldes b Jacquele Telford (Johs Hopks Uverst) Smple lear regresso aalss estmates
Multiple Linear Regression Analysis
 LINEA EGESSION ANALYSIS MODULE III Lecture - 4 Multple Lear egresso Aalyss Dr. Shalabh Departmet of Mathematcs ad Statstcs Ida Isttute of Techology Kapur Cofdece terval estmato The cofdece tervals multple
Econometric Methods. Review of Estimation
 Ecoometrc Methods Revew of Estmato Estmatg the populato mea Radom samplg Pot ad terval estmators Lear estmators Ubased estmators Lear Ubased Estmators (LUEs) Effcecy (mmum varace) ad Best Lear Ubased Estmators
ESS Line Fitting
 ESS 5 014 17. Le Fttg A very commo problem data aalyss s lookg for relatoshpetwee dfferet parameters ad fttg les or surfaces to data. The smplest example s fttg a straght le ad we wll dscuss that here
Lecture 3. Sampling, sampling distributions, and parameter estimation
 Lecture 3 Samplg, samplg dstrbutos, ad parameter estmato Samplg Defto Populato s defed as the collecto of all the possble observatos of terest. The collecto of observatos we take from the populato s called
Homework Solution (#5)
") Homework Soluto (# Chapter : #6,, 8(b, 3, 4, 44, 49, 3, 9 ad 7 Chapter. Smple Lear Regresso ad Correlato.6 (6 th edto 7, old edto Page 9 Rafall volume ( vs Ruoff volume ( : 9 8 7 6 4 3 : a. Yes, the scatter-plot
Homework Soluto (# Chapter : #6,, 8(b, 3, 4, 44, 49, 3, 9 ad 7 Chapter. Smple Lear Regresso ad Correlato.6 (6 th edto 7, old edto Page 9 Rafall volume ( vs Ruoff volume ( : 9 8 7 6 4 3 : a. Yes, the scatter-plot
( ) = ( ) ( ) Chapter 13 Asymptotic Theory and Stochastic Regressors. Stochastic regressors model
 = ( ) ( ) Chapter 13 Asymptotic Theory and Stochastic Regressors. Stochastic regressors model") Chapter 3 Asmptotc Theor ad Stochastc Regressors The ature of eplaator varable s assumed to be o-stochastc or fed repeated samples a regresso aalss Such a assumpto s approprate for those epermets whch
Chapter 3 Asmptotc Theor ad Stochastc Regressors The ature of eplaator varable s assumed to be o-stochastc or fed repeated samples a regresso aalss Such a assumpto s approprate for those epermets whch
Simple Linear Regression and Correlation. Applied Statistics and Probability for Engineers. Chapter 11 Simple Linear Regression and Correlation
 4//6 Appled Statstcs ad Probablty for Egeers Sth Edto Douglas C. Motgomery George C. Ruger Chapter Smple Lear Regresso ad Correlato CHAPTER OUTLINE Smple Lear Regresso ad Correlato - Emprcal Models -8
Continuous Distributions
 7//3 Cotuous Dstrbutos Radom Varables of the Cotuous Type Desty Curve Percet Desty fucto, f (x) A smooth curve that ft the dstrbuto 3 4 5 6 7 8 9 Test scores Desty Curve Percet Probablty Desty Fucto, f
Chapter 8. Inferences about More Than Two Population Central Values
 Chapter 8. Ifereces about More Tha Two Populato Cetral Values Case tudy: Effect of Tmg of the Treatmet of Port-We tas wth Lasers ) To vestgate whether treatmet at a youg age would yeld better results tha
STATISTICAL PROPERTIES OF LEAST SQUARES ESTIMATORS. x, where. = y - ˆ " 1
 STATISTICAL PROPERTIES OF LEAST SQUARES ESTIMATORS Recall Assumpto E(Y x) η 0 + η x (lear codtoal mea fucto) Data (x, y ), (x 2, y 2 ),, (x, y ) Least squares estmator ˆ E (Y x) ˆ " 0 + ˆ " x, where ˆ
Lecture 1: Introduction to Regression
 Lecture : Itroducto to Regresso A Eample: Eplag State Homcde Rates What kds of varables mght we use to epla/predct state homcde rates? Let s cosder just oe predctor for ow: povert Igore omtted varables,
Third handout: On the Gini Index
 Thrd hadout: O the dex Corrado, a tala statstca, proposed (, 9, 96) to measure absolute equalt va the mea dfferece whch s defed as ( / ) where refers to the total umber of dvduals socet. Assume that. The
Estimation of Stress- Strength Reliability model using finite mixture of exponential distributions
 Iteratoal Joural of Computatoal Egeerg Research Vol, 0 Issue, Estmato of Stress- Stregth Relablty model usg fte mxture of expoetal dstrbutos K.Sadhya, T.S.Umamaheswar Departmet of Mathematcs, Lal Bhadur
STA 108 Applied Linear Models: Regression Analysis Spring Solution for Homework #1
 STA 08 Appled Lear Models: Regresso Aalyss Sprg 0 Soluto for Homework #. Let Y the dollar cost per year, X the umber of vsts per year. The the mathematcal relato betwee X ad Y s: Y 300 + X. Ths s a fuctoal
Chapter 13, Part A Analysis of Variance and Experimental Design. Introduction to Analysis of Variance. Introduction to Analysis of Variance
 Chapter, Part A Aalyss of Varace ad Epermetal Desg Itroducto to Aalyss of Varace Aalyss of Varace: Testg for the Equalty of Populato Meas Multple Comparso Procedures Itroducto to Aalyss of Varace Aalyss
The equation is sometimes presented in form Y = a + b x. This is reasonable, but it s not the notation we use.
 INTRODUCTORY NOTE ON LINEAR REGREION We have data of the form (x y ) (x y ) (x y ) These wll most ofte be preseted to us as two colum of a spreadsheet As the topc develops we wll see both upper case ad
ε. Therefore, the estimate
 Suggested Aswers, Problem Set 3 ECON 333 Da Hugerma. Ths s ot a very good dea. We kow from the secod FOC problem b) that ( ) SSE / = y x x = ( ) Whch ca be reduced to read y x x = ε x = ( ) The OLS model
hp calculators HP 30S Statistics Averages and Standard Deviations Average and Standard Deviation Practice Finding Averages and Standard Deviations
 HP 30S Statstcs Averages ad Stadard Devatos Average ad Stadard Devato Practce Fdg Averages ad Stadard Devatos HP 30S Statstcs Averages ad Stadard Devatos Average ad stadard devato The HP 30S provdes several
STA 105-M BASIC STATISTICS (This is a multiple choice paper.)
") DCDM BUSINESS SCHOOL September Mock Eamatos STA 0-M BASIC STATISTICS (Ths s a multple choce paper.) Tme: hours 0 mutes INSTRUCTIONS TO CANDIDATES Do ot ope ths questo paper utl you have bee told to do
DCDM BUSINESS SCHOOL September Mock Eamatos STA 0-M BASIC STATISTICS (Ths s a multple choce paper.) Tme: hours 0 mutes INSTRUCTIONS TO CANDIDATES Do ot ope ths questo paper utl you have bee told to do
i 2 σ ) i = 1,2,...,n , and = 3.01 = 4.01
 i = 1,2,...,n , and = 3.01 = 4.01") ECO 745, Homework 6 Le Cabrera. Assume that the followg data come from the lear model: ε ε ~ N, σ,,..., -6. -.5 7. 6.9 -. -. -.9. -..6.4.. -.6 -.7.7 Fd the mamum lkelhood estmates of,, ad σ ε s.6. 4. ε
ECO 745, Homework 6 Le Cabrera. Assume that the followg data come from the lear model: ε ε ~ N, σ,,..., -6. -.5 7. 6.9 -. -. -.9. -..6.4.. -.6 -.7.7 Fd the mamum lkelhood estmates of,, ad σ ε s.6. 4. ε
CHAPTER VI Statistical Analysis of Experimental Data
 Chapter VI Statstcal Aalyss of Expermetal Data CHAPTER VI Statstcal Aalyss of Expermetal Data Measuremets do ot lead to a uque value. Ths s a result of the multtude of errors (maly radom errors) that ca
UNIVERSITY OF OSLO DEPARTMENT OF ECONOMICS
 UNIVERSITY OF OSLO DEPARTMENT OF ECONOMICS Postpoed exam: ECON430 Statstcs Date of exam: Jauary 0, 0 Tme for exam: 09:00 a.m. :00 oo The problem set covers 5 pages Resources allowed: All wrtte ad prted
Generative classification models
 CS 75 Mache Learg Lecture Geeratve classfcato models Mlos Hauskrecht mlos@cs.ptt.edu 539 Seott Square Data: D { d, d,.., d} d, Classfcato represets a dscrete class value Goal: lear f : X Y Bar classfcato
Can we take the Mysticism Out of the Pearson Coefficient of Linear Correlation?
 Ca we tae the Mstcsm Out of the Pearso Coeffcet of Lear Correlato? Itroducto As the ttle of ths tutoral dcates, our purpose s to egeder a clear uderstadg of the Pearso coeffcet of lear correlato studets
Lecture Notes 2. The ability to manipulate matrices is critical in economics.
 Lecture Notes. Revew of Matrces he ablt to mapulate matrces s crtcal ecoomcs.. Matr a rectagular arra of umbers, parameters, or varables placed rows ad colums. Matrces are assocated wth lear equatos. lemets
MEASURES OF DISPERSION
 MEASURES OF DISPERSION Measure of Cetral Tedecy: Measures of Cetral Tedecy ad Dsperso ) Mathematcal Average: a) Arthmetc mea (A.M.) b) Geometrc mea (G.M.) c) Harmoc mea (H.M.) ) Averages of Posto: a) Meda
9.1 Introduction to the probit and logit models
 EC3000 Ecoometrcs Lecture 9 Probt & Logt Aalss 9. Itroducto to the probt ad logt models 9. The logt model 9.3 The probt model Appedx 9. Itroducto to the probt ad logt models These models are used regressos
Point Estimation: definition of estimators
 Pot Estmato: defto of estmators Pot estmator: ay fucto W (X,..., X ) of a data sample. The exercse of pot estmato s to use partcular fuctos of the data order to estmate certa ukow populato parameters.
Lecture 1 Review of Fundamental Statistical Concepts
 Lecture Revew of Fudametal Statstcal Cocepts Measures of Cetral Tedecy ad Dsperso A word about otato for ths class: Idvduals a populato are desgated, where the dex rages from to N, ad N s the total umber
{ }{ ( )} (, ) = ( ) ( ) ( ) Chapter 14 Exercises in Sampling Theory. Exercise 1 (Simple random sampling): Solution:
} (, ) = ( ) ( ) ( ) Chapter 14 Exercises in Sampling Theory. Exercise 1 (Simple random sampling): Solution:") Chapter 4 Exercses Samplg Theory Exercse (Smple radom samplg: Let there be two correlated radom varables X ad A sample of sze s draw from a populato by smple radom samplg wthout replacemet The observed
Chapter 4 Exercses Samplg Theory Exercse (Smple radom samplg: Let there be two correlated radom varables X ad A sample of sze s draw from a populato by smple radom samplg wthout replacemet The observed
UNIVERSITY OF OSLO DEPARTMENT OF ECONOMICS
 UNIVERSITY OF OSLO DEPARTMENT OF ECONOMICS Exam: ECON430 Statstcs Date of exam: Frday, December 8, 07 Grades are gve: Jauary 4, 08 Tme for exam: 0900 am 00 oo The problem set covers 5 pages Resources allowed:
CHAPTER 2. = y ˆ β x (.1022) So we can write
 So we can write") CHAPTER SOLUTIONS TO PROBLEMS. () Let y = GPA, x = ACT, ad = 8. The x = 5.875, y = 3.5, (x x )(y y ) = 5.85, ad (x x ) = 56.875. From equato (.9), we obta the slope as ˆβ = = 5.85/56.875., rouded to four
CHAPTER SOLUTIONS TO PROBLEMS. () Let y = GPA, x = ACT, ad = 8. The x = 5.875, y = 3.5, (x x )(y y ) = 5.85, ad (x x ) = 56.875. From equato (.9), we obta the slope as ˆβ = = 5.85/56.875., rouded to four
4. Standard Regression Model and Spatial Dependence Tests
 4. Stadard Regresso Model ad Spatal Depedece Tests Stadard regresso aalss fals the presece of spatal effects. I case of spatal depedeces ad/or spatal heterogeet a stadard regresso model wll be msspecfed.
best estimate (mean) for X uncertainty or error in the measurement (systematic, random or statistical) best
 for X uncertainty or error in the measurement (systematic, random or statistical) best") Error Aalyss Preamble Wheever a measuremet s made, the result followg from that measuremet s always subject to ucertaty The ucertaty ca be reduced by makg several measuremets of the same quatty or by mprovg
Error Aalyss Preamble Wheever a measuremet s made, the result followg from that measuremet s always subject to ucertaty The ucertaty ca be reduced by makg several measuremets of the same quatty or by mprovg
THE ROYAL STATISTICAL SOCIETY HIGHER CERTIFICATE
 THE ROYAL STATISTICAL SOCIETY 00 EXAMINATIONS SOLUTIONS HIGHER CERTIFICATE PAPER I STATISTICAL THEORY The Socety provdes these solutos to assst caddates preparg for the examatos future years ad for the
Measures of Dispersion
 Chapter 8 Measures of Dsperso Defto of Measures of Dsperso (page 31) A measure of dsperso s a descrptve summary measure that helps us characterze the data set terms of how vared the observatos are from
1. The weight of six Golden Retrievers is 66, 61, 70, 67, 92 and 66 pounds. The weight of six Labrador Retrievers is 54, 60, 72, 78, 84 and 67.
 Ecoomcs 3 Itroducto to Ecoometrcs Sprg 004 Professor Dobk Name Studet ID Frst Mdterm Exam You must aswer all the questos. The exam s closed book ad closed otes. You may use your calculators but please
Discrete Mathematics and Probability Theory Fall 2016 Seshia and Walrand DIS 10b
 CS 70 Dscrete Mathematcs ad Probablty Theory Fall 206 Sesha ad Walrad DIS 0b. Wll I Get My Package? Seaky delvery guy of some compay s out delverg packages to customers. Not oly does he had a radom package
Linear Regression. Can height information be used to predict weight of an individual? How long should you wait till next eruption?
 Iter-erupto Tme Weght Correlato & Regreo 1 1 Lear Regreo 0 80 70 80 Heght 1 Ca heght formato be ued to predct weght of a dvdual? How log hould ou wat tll et erupto? Weght: Repoe varable (Outcome, Depedet)
Lecture 2: The Simple Regression Model
 Lectre Notes o Advaced coometrcs Lectre : The Smple Regresso Model Takash Yamao Fall Semester 5 I ths lectre we revew the smple bvarate lear regresso model. We focs o statstcal assmptos to obta based estmators.
Lecture Notes Forecasting the process of estimating or predicting unknown situations
 Lecture Notes. Ecoomc Forecastg. Forecastg the process of estmatg or predctg ukow stuatos Eample usuall ecoomsts predct future ecoomc varables Forecastg apples to a varet of data () tme seres data predctg
Module 7. Lecture 7: Statistical parameter estimation
 Lecture 7: Statstcal parameter estmato Parameter Estmato Methods of Parameter Estmato 1) Method of Matchg Pots ) Method of Momets 3) Mamum Lkelhood method Populato Parameter Sample Parameter Ubased estmato
Reaction Time VS. Drug Percentage Subject Amount of Drug Times % Reaction Time in Seconds 1 Mary John Carl Sara William 5 4
 CHAPTER Smple Lear Regreo EXAMPLE A expermet volvg fve ubject coducted to determe the relatohp betwee the percetage of a certa drug the bloodtream ad the legth of tme t take the ubject to react to a tmulu.
Study of Correlation using Bayes Approach under bivariate Distributions
 Iteratoal Joural of Scece Egeerg ad Techolog Research IJSETR Volume Issue Februar 4 Stud of Correlato usg Baes Approach uder bvarate Dstrbutos N.S.Padharkar* ad. M.N.Deshpade** *Govt.Vdarbha Isttute of
Example. Row Hydrogen Carbon
 SMAM 39 Least Squares Example. Heatg ad combusto aalyses were performed order to study the composto of moo rocks collected by Apollo 4 ad 5 crews. Recorded c ad c of the Mtab output are the determatos
ECONOMETRIC THEORY. MODULE VIII Lecture - 26 Heteroskedasticity
 ECONOMETRIC THEORY MODULE VIII Lecture - 6 Heteroskedastcty Dr. Shalabh Departmet of Mathematcs ad Statstcs Ida Isttute of Techology Kapur . Breusch Paga test Ths test ca be appled whe the replcated data
Chapter 5 Elementary Statistics, Empirical Probability Distributions, and More on Simulation
 Chapter 5 Elemetary Statstcs, Emprcal Probablty Dstrbutos, ad More o Smulato Cotets Coectg Probablty wth Observatos of Data Sample Mea ad Sample Varace Regresso Techques Emprcal Dstrbuto Fuctos More o
Handout #8. X\Y f(x) 0 1/16 1/ / /16 3/ / /16 3/16 0 3/ /16 1/16 1/8 g(y) 1/16 1/4 3/8 1/4 1/16 1
 0 1/16 1/ / /16 3/ / /16 3/16 0 3/ /16 1/16 1/8 g(y) 1/16 1/4 3/8 1/4 1/16 1") Hadout #8 Ttle: Foudatos of Ecoometrcs Course: Eco 367 Fall/05 Istructor: Dr. I-Mg Chu Lear Regresso Model So far we have focused mostly o the study of a sgle radom varable, ts correspodg theoretcal dstrbuto,
Hadout #8 Ttle: Foudatos of Ecoometrcs Course: Eco 367 Fall/05 Istructor: Dr. I-Mg Chu Lear Regresso Model So far we have focused mostly o the study of a sgle radom varable, ts correspodg theoretcal dstrbuto,
Chapter Statistics Background of Regression Analysis
 Chapter 06.0 Statstcs Backgroud of Regresso Aalyss After readg ths chapter, you should be able to:. revew the statstcs backgroud eeded for learg regresso, ad. kow a bref hstory of regresso. Revew of Statstcal
Parameter, Statistic and Random Samples
 Parameter, Statstc ad Radom Samples A parameter s a umber that descrbes the populato. It s a fxed umber, but practce we do ot kow ts value. A statstc s a fucto of the sample data,.e., t s a quatty whose
Evaluating Polynomials
 Uverst of Nebraska - Lcol DgtalCommos@Uverst of Nebraska - Lcol MAT Exam Expostor Papers Math the Mddle Isttute Partershp 7-7 Evaluatg Polomals Thomas J. Harrgto Uverst of Nebraska-Lcol Follow ths ad addtoal
f f... f 1 n n (ii) Median : It is the value of the middle-most observation(s).
 Median : It is the value of the middle-most observation(s).") CHAPTER STATISTICS Pots to Remember :. Facts or fgures, collected wth a defte pupose, are called Data.. Statstcs s the area of study dealg wth the collecto, presetato, aalyss ad terpretato of data.. The
CHAPTER STATISTICS Pots to Remember :. Facts or fgures, collected wth a defte pupose, are called Data.. Statstcs s the area of study dealg wth the collecto, presetato, aalyss ad terpretato of data.. The
PGE 310: Formulation and Solution in Geosystems Engineering. Dr. Balhoff. Interpolation
 PGE 30: Formulato ad Soluto Geosystems Egeerg Dr. Balhoff Iterpolato Numercal Methods wth MATLAB, Recktewald, Chapter 0 ad Numercal Methods for Egeers, Chapra ad Caale, 5 th Ed., Part Fve, Chapter 8 ad
Chapter 5 Transformation and Weighting to Correct Model Inadequacies
 Chapter 5 Trasformato ad Weghtg to Correct Model Iadequaces The graphcal methods help detectg the volato of basc assumptos regresso aalss. Now we cosder the methods ad procedures for buldg the models through
The Mathematics of Portfolio Theory
 The Matheatcs of Portfolo Theory The rates of retur of stocks, ad are as follows Market odtos state / scearo) earsh Neutral ullsh Probablty 0. 0.5 0.3 % 5% 9% -3% 3% % 5% % -% Notato: R The retur of stock