Lecture 1: Introduction to Regression
|
|
|
- Amy Blair
- 5 years ago
- Views:
Transcription
1 Lecture : Itroducto to Regresso
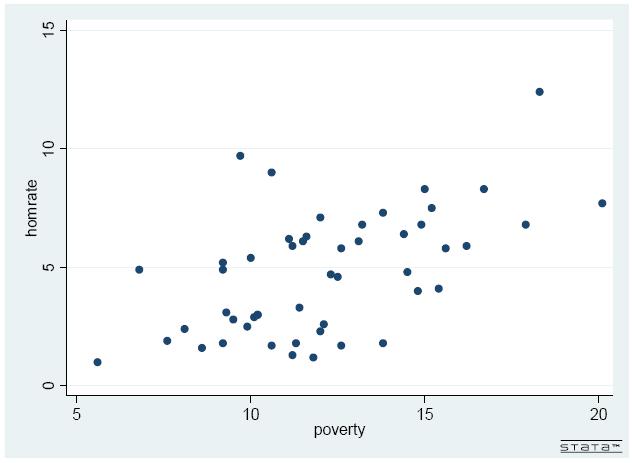
2 A Eample: Eplag State Homcde Rates What kds of varables mght we use to epla/predct state homcde rates? Let s cosder just oe predctor for ow: povert Igore omtted varables, measuremet error How mght ths be related to homcde rates?
3 Povert ad Homcde These data are located here: Dowload these data ad create a scatterplot Stata. Does there appear to be a relatoshp betwee povert ad homcde? What s the correlato?
4
5 Scatterplots ad correlatos Scatterplots wth correlatos of a +.; b.5; c +.85; ad d +.5.
6 Povert ad Homcde There appears to be some relatoshp betwee povert ad homcde rates, but t s ot perfect. But there s a lot of ose whch we wll attrbute to uobserved factors ad radom error.
7 Povert ad Homcde, cot. There s some ozero value of epected homcdes the absece of povert. We epect homcde rates to crease as povert rates crease. Thus, Y Ths s the Populato Regresso Fucto X
8 Povert ad Homcde, Sample Regresso Fucto s the depedet varable, homcde rate, whch we are trg to epla. represets our estmate of what the homcde rate would be the absece of povert* s our estmate of the effect of a hgher povert rate o homcde u s a ose term reflectg other thgs that fluece homcde rates *Ths s etrapolato outsde the rage of data. Not recommeded. u
9 Povert ad Homcde, cot. u Ol ad are drectl observable the equato above. The task of a regresso aalss s to provde estmates of the slope ad tercept terms. The relatoshp s assumed to be lear. A crease s assocated wth a crease. Same epected chage homcde gog from 6 to 7% povert as from 5 to 6%
10

11 . twowa scatter homrate povert lft homrate povert
12 Ordar Least Squares u Substatvel, what do these estmates mea? s the epected homcde rate f povert rates were zero. Ths s ever the case, ecept perhaps the case of a zombe apocalpse, so t s ot a meagful estmate..475 s the effect of a ut crease the povert rate o the homcde rate. You eed to kow how ou are measurg povert. I ths case, ut crease s a crease of percetage pot. So a percetage pot crease ot percet crease the povert rate s assocated wth a crease of.475 homcdes per, people the state. I AZ, ths would be ~3 homcdes.
13 Ordar Least Squares u How dd we arrve at ths estmate? Wh dd we draw the le eactl where we dd? Mmze the sum of the squared error, aka Ordar Least Squares OLS estmato m Y Y Wh squared error? Wh vertcal error? Not perpedcular.
14 Ordar Least Squares Estmates m Solvg for the mmum requres calculus set dervatve wth respect to β to ad solve The book shows how we ca go from some basc assumptos to estmates for β ad β wthout usg calculus. I wll go through two dfferet was to obta these estmates: Wooldrdge s ad Kha s khaacadem.org
15 Ordar Least Squares: Estmatg the tercept Wooldrdge s method Eu u E Assumg that the average value of the error term s zero, t s a trval matter to calculate β oce we kow β.
16 Ordar Least Squares: Estmatg the tercept Wooldrdge Icdetall, these last sets of equatos also mpl that the regresso le passes through the pot that correspods to the mea of ad the mea of :,
17 Ordar Least Squares: Estmatg the slope Wooldrdge Frst, we use the fact that the epected value of the error term s zero, to create geerate a ew equato equal to zero. We saw ths before, but here I use the eact formula used the book. u u u E
18 Ordar Least Squares: Estmatg the slope Wooldrdge We ca multpl ths last equato b sce the covarace betwee ad u s assumed to be zero ad the terms the paretheses are equal to u. Net, we plug our formula for the tercept ad smplf, u E u Cov
19 Ordar Least Squares: Estmatg the slope Wooldrdge Re-arragg...
20 Ordar Least Squares: Estmatg the slope Wooldrdge Re-arragg... Iterestgl, the fal result leads us to the relatoshp betwee covarace of ad ad varace of. var, cov

21 Ordar Least Squares: Estmates Kha s method Kha starts wth the actual pots, ad elaborates how these pots are related to the squared error, the square of the dstace betwee each pot, ad the le =m+b=β +β
22 Ordar Least Squares: Estmates Kha s method The vertcal dstace betwee a pot,, ad the regresso le = β +β s smpl -β +β Total Error It would be trval to mmze the total error. We could set β the slope equal to zero, ad β equal to the mea of, ad the the total error would be zero. Aother approach s to mmze the absolute dfferece, but ths actuall creates thorer math problems tha squarg the dffereces, ad results stuatos where there s ot a uque soluto. I short, what we wat s the sum of the squared error SE, whch meas we have to square ever term that equato.
23 Ordar Least Squares: Estmates Kha s method We eed to fd the β ad β that mmze the SE. Let s epad ths out. To be clear, the subscrpts for the β estmates just refer to our two regresso le estmates, whereas the subscrpts for our s ad s refer to the frst observato, secod observato ad so o. SE SE
24 Ordar Least Squares: Estmates Kha s method Summg these colums... Everthg but the regresso le coeffcets are kow ettes here. Ths equato represets a 3D surface, where dfferet values of β ad β correspod to dfferet values of the squared error. We just eed to pck the values of β ad β that mmze the SE. * * * * * mea mea mea mea mea SE
25 Ordar Least Squares: Estmates Kha s method Those famlar wth calculus wll kow that the mmum of the squared error surface occurs where the partal dervatve slope wth respect to β s equal to zero ad the partal dervatve wth respect to β s equal to zero. We ve see that before. How about the other dervatve? mea mea SE * *
26 Ordar Least Squares: Estmates Kha s method Replacg β... var, cov * * * * * * * * * * * * mea mea mea mea mea mea mea mea mea mea mea SE
27 Ordar Least Squares Estmates Hopefull t s reassurg to kow that we ca obta the same aswers from two ver dfferet methods. These formulas allow us, a bvarate regresso, to calculate the regresso le b had wthout usg fac statstcal packages. All we eed to do s fd the mea of, the mea of, the mea of the products of ad, ad the mea of the squares of, ad the we ca plug ths to the formulas ad crak out our solutos.
28 OLS b had, eample Let s look at a set of 5 pots, ad see how to calculate a regresso le b had. Here are our fve pots: 4, 7,6, 6,3,4
29 OLS b had, eample We ca geerall guess that the slope wll be postve, but we ca fd the slope eactl f we calculate four thgs: the mea of, the mea of, the mea of the products of ad, ad the mea of the squares of The s are 4,7,,6, ad. Ther mea s 9/5=3.8 The s are,6,,3, ad 4. Ther mea s 6/5=3. The products are 8,4,,8 ad 8. Ther mea s 76/5=5.. The squared s are 6,49,,36, ad 4. Ther mea s 5/5=.
30 OLS b had, eample Recall the formula for the slope: mea mea * * 5. 3.* * Oce we have the slope, the tercept s trval: * Ad our regresso le that mmzes the sum of squared dffereces: u
31 OLS b had, eample Checkg our work...
32 Aalss of Varace Oce we have our regresso le, we ca defe a ftted value as follows: Ths s our estmated value for gve our slope ad tercept estmates ad the value of. It s also sometmes called a predcted value. All of the -hats fall o the regresso le. For purposes of evaluatg our regresso, t makes sese to compare the -hats to the actual values of.
33 Aalss of Varace The total varato Y s parttoed to two parts: Resduals varato ot eplaed b the model Varato eplaed b the model Of course, order to assess varace, we square all of these terms: SST SSR SSE Where SST s the total sum of squares, SSE s the eplaed sum of squares, ad SSR s the resdual sum of squares.
34 R R-squared R represets the porto of the varace that s eplaed b the model. R SSE SST Tpcall, socal scece applcatos, our stadards for R are prett low. Idvdual-level regressos rarel eceed.3
35 Ordar Least Squares Estmates b had See Ecel fle: bvarate regresso b had.ls state hom povert -bar -bar * -bar Alabama Alaska Arzoa Arkasas Calfora
36 Ordar Least Squares Estmates b had, cot. We ca also get β from the covarace. corr hom pov, c matr Stata, whch shows that the covarace of homcde ad povert s 4.34 ad the varace of povert s 9.6. β =4.34/9.6=.475 The mea of homcde rates s 4.77, ad the mea of povert rates s.9. β = *.475=-.973 Or, Stata. reg hom pov
37 Stata output β =4.34/9.6=.475 β = *.475= reg hom pov Source SS df MS Number of obs = F, 48 =.36 Model Prob > F =. Resdual R-squared = Adj R-squared =.935 Total Root MSE = homrate Coef. Std. Err. t P> t [95% Cof. Iterval] povert _cos
38 Assumptos of the Classcal Lear Regresso Model X & Y are learl related the populato. We have a radom sample of sze from the populato. 3 The values of through are ot all the same. 4 The error has a epected value of zero for all values of : Eu = zero codtoal mea 5 The error term has a costat varace for all values of : Varu = homoscedastct
39 Leart If X ad Y are ot learl related, the estmates wll be correct. Look at our data! Eample, how do these data compare?:. summ Varable Obs Mea Std. Dev. M Ma
40
41
42 Leart, cot. How do these models compare? β =3 β =.5 Let s look at each of them separatel

43 Leart, cot., Regresso

44 Leart, cot., Regresso

45 Leart, cot., Regresso 3

46 Leart, cot., Regresso 4
47 3 Sample varato If there s o varato the values of, t s ot possble to estmate a regresso le. The le of best ft would pot straght up ad pass through ever pot. Mmal varato s sometmes problematc as well, as t makes regresso estmates ver ustable. Ths assumpto s eas to check b lookg at summar statstcs.
48 4 Zero codtoal mea Eu = I practcal terms, ths meas that the sum of the uobserved varables s ot related to. Also, t meas that varato our estmates of the tercept ad slope are all due to varatos the error terms. Should ths assumpto hold true, our estmates of the slope ad tercept are ubased, meag that o average we re gog to get the rght aswer.
49 5 Varu = homoscedastct I practcal terms, ths meas that the varace of the error term s urelated to the depedet varables.
50
51 Root Mea Squared Error RMSE Root mea squared error gves us a dcato of how well the regresso le fts the data. RMSE SSR k Ths s the square root of the resdual sum of squares dvded b the sample sze mus the umber of parameters beg estmated k= smple bvarate regresso.
52 Root Mea Squared Error, cot. Provded the error term s dstrbuted ormall, the RMSE tells us: 68.3% of the observatos fall wth the bad that s ±*RMSE of the regresso le 95.4% of the observatos fall wth the bad that s ±*RMSE of the regresso le 99.7% of the observatos fall wth the bad that s ±3*RMSE of the regresso le RMSE s also a elemet calculatg the stadard errors of β ad β
53 Regresso estmates, stadard errors SE RMSE SE RMSE
54 Regresso estmates, stadard errors, cot. Whle these two stadard error formulas ma ot appear ver tutve, we ca glea some mportat formato from them:. As ucertat about the regresso le creases RMSE creases, the stadard errors of both β ad β crease.. As the varablt of creases, the stadard errors of both β ad β decrease.
55 Formal test of model ft, F-test F k, N k SSE k SSR Where k = the umber of parameters the model, ad s the sample sze Ths s a geeral test of model ft. If the F- test s statstcall sgfcat, t meas that the model eplas some of the varace Y. k
56 Net tme: Homework: Problems.4,.4, C.4, C.4 Read: Wooldrdge Chapters 9 & Apped C.6, ad Bushwa, Sweete & Wlso 6 artcle
Lecture 1: Introduction to Regression
 Lecture : Itroducto to Regresso A Eample: Eplag State Homcde Rates What kds of varables mght we use to epla/predct state homcde rates? Let s cosder just oe predctor for ow: povert Igore omtted varables,
Simple Linear Regression
 Statstcal Methods I (EST 75) Page 139 Smple Lear Regresso Smple regresso applcatos are used to ft a model descrbg a lear relatoshp betwee two varables. The aspects of least squares regresso ad correlato
Objectives of Multiple Regression
 Obectves of Multple Regresso Establsh the lear equato that best predcts values of a depedet varable Y usg more tha oe eplaator varable from a large set of potetal predctors {,,... k }. Fd that subset of
Statistics. Correlational. Dr. Ayman Eldeib. Simple Linear Regression and Correlation. SBE 304: Linear Regression & Correlation 1/3/2018
 /3/08 Sstems & Bomedcal Egeerg Departmet SBE 304: Bo-Statstcs Smple Lear Regresso ad Correlato Dr. Ama Eldeb Fall 07 Descrptve Orgasg, summarsg & descrbg data Statstcs Correlatoal Relatoshps Iferetal Geeralsg
12.2 Estimating Model parameters Assumptions: ox and y are related according to the simple linear regression model
 1. Estmatg Model parameters Assumptos: ox ad y are related accordg to the smple lear regresso model (The lear regresso model s the model that says that x ad y are related a lear fasho, but the observed
Midterm Exam 1, section 1 (Solution) Thursday, February hour, 15 minutes
 Thursday, February hour, 15 minutes") coometrcs, CON Sa Fracsco State Uversty Mchael Bar Sprg 5 Mdterm am, secto Soluto Thursday, February 6 hour, 5 mutes Name: Istructos. Ths s closed book, closed otes eam.. No calculators of ay kd are allowed..
coometrcs, CON Sa Fracsco State Uversty Mchael Bar Sprg 5 Mdterm am, secto Soluto Thursday, February 6 hour, 5 mutes Name: Istructos. Ths s closed book, closed otes eam.. No calculators of ay kd are allowed..
Econometric Methods. Review of Estimation
 Ecoometrc Methods Revew of Estmato Estmatg the populato mea Radom samplg Pot ad terval estmators Lear estmators Ubased estmators Lear Ubased Estmators (LUEs) Effcecy (mmum varace) ad Best Lear Ubased Estmators
ε. Therefore, the estimate
 Suggested Aswers, Problem Set 3 ECON 333 Da Hugerma. Ths s ot a very good dea. We kow from the secod FOC problem b) that ( ) SSE / = y x x = ( ) Whch ca be reduced to read y x x = ε x = ( ) The OLS model
Lecture Notes 2. The ability to manipulate matrices is critical in economics.
 Lecture Notes. Revew of Matrces he ablt to mapulate matrces s crtcal ecoomcs.. Matr a rectagular arra of umbers, parameters, or varables placed rows ad colums. Matrces are assocated wth lear equatos. lemets
ECON 482 / WH Hong The Simple Regression Model 1. Definition of the Simple Regression Model
 ECON 48 / WH Hog The Smple Regresso Model. Defto of the Smple Regresso Model Smple Regresso Model Expla varable y terms of varable x y = β + β x+ u y : depedet varable, explaed varable, respose varable,
STA 108 Applied Linear Models: Regression Analysis Spring Solution for Homework #1
 STA 08 Appled Lear Models: Regresso Aalyss Sprg 0 Soluto for Homework #. Let Y the dollar cost per year, X the umber of vsts per year. The the mathematcal relato betwee X ad Y s: Y 300 + X. Ths s a fuctoal
Midterm Exam 1, section 2 (Solution) Thursday, February hour, 15 minutes
 Thursday, February hour, 15 minutes") coometrcs, CON Sa Fracsco State Uverst Mchael Bar Sprg 5 Mdterm xam, secto Soluto Thursda, Februar 6 hour, 5 mutes Name: Istructos. Ths s closed book, closed otes exam.. No calculators of a kd are allowed..
coometrcs, CON Sa Fracsco State Uverst Mchael Bar Sprg 5 Mdterm xam, secto Soluto Thursda, Februar 6 hour, 5 mutes Name: Istructos. Ths s closed book, closed otes exam.. No calculators of a kd are allowed..
 Regresso What s a Model? 1. Ofte Descrbe Relatoshp betwee Varables 2. Types - Determstc Models (o radomess) - Probablstc Models (wth radomess) EPI 809/Sprg 2008 9 Determstc Models 1. Hypothesze
Linear Regression with One Regressor
 Lear Regresso wth Oe Regressor AIM QA.7. Expla how regresso aalyss ecoometrcs measures the relatoshp betwee depedet ad depedet varables. A regresso aalyss has the goal of measurg how chages oe varable,
Correlation and Simple Linear Regression
 Correlato ad Smple Lear Regresso Berl Che Departmet of Computer Scece & Iformato Egeerg Natoal Tawa Normal Uverst Referece:. W. Navd. Statstcs for Egeerg ad Scetsts. Chapter 7 (7.-7.3) & Teachg Materal
Chapter Two. An Introduction to Regression ( )
") ubject: A Itroducto to Regresso Frst tage Chapter Two A Itroducto to Regresso (018-019) 1 pg. ubject: A Itroducto to Regresso Frst tage A Itroducto to Regresso Regresso aalss s a statstcal tool for the
ubject: A Itroducto to Regresso Frst tage Chapter Two A Itroducto to Regresso (018-019) 1 pg. ubject: A Itroducto to Regresso Frst tage A Itroducto to Regresso Regresso aalss s a statstcal tool for the
Ordinary Least Squares Regression. Simple Regression. Algebra and Assumptions.
 Ordary Least Squares egresso. Smple egresso. Algebra ad Assumptos. I ths part of the course we are gog to study a techque for aalysg the lear relatoshp betwee two varables Y ad X. We have pars of observatos
Recall MLR 5 Homskedasticity error u has the same variance given any values of the explanatory variables Var(u x1,...,xk) = 2 or E(UU ) = 2 I
 = 2 or E(UU ) = 2 I") Chapter 8 Heterosedastcty Recall MLR 5 Homsedastcty error u has the same varace gve ay values of the eplaatory varables Varu,..., = or EUU = I Suppose other GM assumptos hold but have heterosedastcty.
Chapter 8 Heterosedastcty Recall MLR 5 Homsedastcty error u has the same varace gve ay values of the eplaatory varables Varu,..., = or EUU = I Suppose other GM assumptos hold but have heterosedastcty.
Simple Linear Regression and Correlation.
 Smple Lear Regresso ad Correlato. Correspods to Chapter 0 Tamhae ad Dulop Sldes prepared b Elzabeth Newto (MIT) wth some sldes b Jacquele Telford (Johs Hopks Uverst) Smple lear regresso aalss estmates
Lecture Notes Types of economic variables
 Lecture Notes 3 1. Types of ecoomc varables () Cotuous varable takes o a cotuum the sample space, such as all pots o a le or all real umbers Example: GDP, Polluto cocetrato, etc. () Dscrete varables fte
Lecture Notes Forecasting the process of estimating or predicting unknown situations
 Lecture Notes. Ecoomc Forecastg. Forecastg the process of estmatg or predctg ukow stuatos Eample usuall ecoomsts predct future ecoomc varables Forecastg apples to a varet of data () tme seres data predctg
Multiple Choice Test. Chapter Adequacy of Models for Regression
 Multple Choce Test Chapter 06.0 Adequac of Models for Regresso. For a lear regresso model to be cosdered adequate, the percetage of scaled resduals that eed to be the rage [-,] s greater tha or equal to
ENGI 3423 Simple Linear Regression Page 12-01
 ENGI 343 mple Lear Regresso Page - mple Lear Regresso ometmes a expermet s set up where the expermeter has cotrol over the values of oe or more varables X ad measures the resultg values of aother varable
4. Standard Regression Model and Spatial Dependence Tests
 4. Stadard Regresso Model ad Spatal Depedece Tests Stadard regresso aalss fals the presece of spatal effects. I case of spatal depedeces ad/or spatal heterogeet a stadard regresso model wll be msspecfed.
Statistics MINITAB - Lab 5
 Statstcs 10010 MINITAB - Lab 5 PART I: The Correlato Coeffcet Qute ofte statstcs we are preseted wth data that suggests that a lear relatoshp exsts betwee two varables. For example the plot below s of
Simple Linear Regression
 Correlato ad Smple Lear Regresso Berl Che Departmet of Computer Scece & Iformato Egeerg Natoal Tawa Normal Uversty Referece:. W. Navd. Statstcs for Egeerg ad Scetsts. Chapter 7 (7.-7.3) & Teachg Materal
Chapter 13 Student Lecture Notes 13-1
 Chapter 3 Studet Lecture Notes 3- Basc Busess Statstcs (9 th Edto) Chapter 3 Smple Lear Regresso 4 Pretce-Hall, Ic. Chap 3- Chapter Topcs Types of Regresso Models Determg the Smple Lear Regresso Equato
Chapter 2 Supplemental Text Material
 -. Models for the Data ad the t-test Chapter upplemetal Text Materal The model preseted the text, equato (-3) s more properl called a meas model. ce the mea s a locato parameter, ths tpe of model s also
Lecture 2: The Simple Regression Model
 Lectre Notes o Advaced coometrcs Lectre : The Smple Regresso Model Takash Yamao Fall Semester 5 I ths lectre we revew the smple bvarate lear regresso model. We focs o statstcal assmptos to obta based estmators.
Line Fitting and Regression
 Marquette Uverst MSCS6 Le Fttg ad Regresso Dael B. Rowe, Ph.D. Professor Departmet of Mathematcs, Statstcs, ad Computer Scece Coprght 8 b Marquette Uverst Least Squares Regresso MSCS6 For LSR we have pots
Sampling Theory MODULE V LECTURE - 14 RATIO AND PRODUCT METHODS OF ESTIMATION
 Samplg Theor MODULE V LECTUE - 4 ATIO AND PODUCT METHODS OF ESTIMATION D. SHALABH DEPATMENT OF MATHEMATICS AND STATISTICS INDIAN INSTITUTE OF TECHNOLOG KANPU A mportat objectve a statstcal estmato procedure
ESS Line Fitting
 ESS 5 014 17. Le Fttg A very commo problem data aalyss s lookg for relatoshpetwee dfferet parameters ad fttg les or surfaces to data. The smplest example s fttg a straght le ad we wll dscuss that here
( ) = ( ) ( ) Chapter 13 Asymptotic Theory and Stochastic Regressors. Stochastic regressors model
 = ( ) ( ) Chapter 13 Asymptotic Theory and Stochastic Regressors. Stochastic regressors model") Chapter 3 Asmptotc Theor ad Stochastc Regressors The ature of eplaator varable s assumed to be o-stochastc or fed repeated samples a regresso aalss Such a assumpto s approprate for those epermets whch
Chapter 3 Asmptotc Theor ad Stochastc Regressors The ature of eplaator varable s assumed to be o-stochastc or fed repeated samples a regresso aalss Such a assumpto s approprate for those epermets whch
Multiple Regression. More than 2 variables! Grade on Final. Multiple Regression 11/21/2012. Exam 2 Grades. Exam 2 Re-grades
 STAT 101 Dr. Kar Lock Morga 11/20/12 Exam 2 Grades Multple Regresso SECTIONS 9.2, 10.1, 10.2 Multple explaatory varables (10.1) Parttog varablty R 2, ANOVA (9.2) Codtos resdual plot (10.2) Trasformatos
i 2 σ ) i = 1,2,...,n , and = 3.01 = 4.01
 i = 1,2,...,n , and = 3.01 = 4.01") ECO 745, Homework 6 Le Cabrera. Assume that the followg data come from the lear model: ε ε ~ N, σ,,..., -6. -.5 7. 6.9 -. -. -.9. -..6.4.. -.6 -.7.7 Fd the mamum lkelhood estmates of,, ad σ ε s.6. 4. ε
ECO 745, Homework 6 Le Cabrera. Assume that the followg data come from the lear model: ε ε ~ N, σ,,..., -6. -.5 7. 6.9 -. -. -.9. -..6.4.. -.6 -.7.7 Fd the mamum lkelhood estmates of,, ad σ ε s.6. 4. ε
STA302/1001-Fall 2008 Midterm Test October 21, 2008
 STA3/-Fall 8 Mdterm Test October, 8 Last Name: Frst Name: Studet Number: Erolled (Crcle oe) STA3 STA INSTRUCTIONS Tme allowed: hour 45 mutes Ads allowed: A o-programmable calculator A table of values from
UNIVERSITY OF OSLO DEPARTMENT OF ECONOMICS
 UNIVERSITY OF OSLO DEPARTMENT OF ECONOMICS Exam: ECON430 Statstcs Date of exam: Frday, December 8, 07 Grades are gve: Jauary 4, 08 Tme for exam: 0900 am 00 oo The problem set covers 5 pages Resources allowed:
Lecture 8: Linear Regression
 Lecture 8: Lear egresso May 4, GENOME 56, Sprg Goals Develop basc cocepts of lear regresso from a probablstc framework Estmatg parameters ad hypothess testg wth lear models Lear regresso Su I Lee, CSE
STATISTICAL PROPERTIES OF LEAST SQUARES ESTIMATORS. x, where. = y - ˆ " 1
 STATISTICAL PROPERTIES OF LEAST SQUARES ESTIMATORS Recall Assumpto E(Y x) η 0 + η x (lear codtoal mea fucto) Data (x, y ), (x 2, y 2 ),, (x, y ) Least squares estmator ˆ E (Y x) ˆ " 0 + ˆ " x, where ˆ
CLASS NOTES. for. PBAF 528: Quantitative Methods II SPRING Instructor: Jean Swanson. Daniel J. Evans School of Public Affairs
 CLASS NOTES for PBAF 58: Quattatve Methods II SPRING 005 Istructor: Jea Swaso Dael J. Evas School of Publc Affars Uversty of Washgto Ackowledgemet: The structor wshes to thak Rachel Klet, Assstat Professor,
Lecture 7. Confidence Intervals and Hypothesis Tests in the Simple CLR Model
 Lecture 7. Cofdece Itervals ad Hypothess Tests the Smple CLR Model I lecture 6 we troduced the Classcal Lear Regresso (CLR) model that s the radom expermet of whch the data Y,,, K, are the outcomes. The
Probability and. Lecture 13: and Correlation
 933 Probablty ad Statstcs for Software ad Kowledge Egeers Lecture 3: Smple Lear Regresso ad Correlato Mocha Soptkamo, Ph.D. Outle The Smple Lear Regresso Model (.) Fttg the Regresso Le (.) The Aalyss of
The equation is sometimes presented in form Y = a + b x. This is reasonable, but it s not the notation we use.
 INTRODUCTORY NOTE ON LINEAR REGREION We have data of the form (x y ) (x y ) (x y ) These wll most ofte be preseted to us as two colum of a spreadsheet As the topc develops we wll see both upper case ad
Chapter Business Statistics: A First Course Fifth Edition. Learning Objectives. Correlation vs. Regression. In this chapter, you learn:
 Chapter 3 3- Busess Statstcs: A Frst Course Ffth Edto Chapter 2 Correlato ad Smple Lear Regresso Busess Statstcs: A Frst Course, 5e 29 Pretce-Hall, Ic. Chap 2- Learg Objectves I ths chapter, you lear:
Example: Multiple linear regression. Least squares regression. Repetition: Simple linear regression. Tron Anders Moger
 Example: Multple lear regresso 5000,00 4000,00 Tro Aders Moger 0.0.007 brthweght 3000,00 000,00 000,00 0,00 50,00 00,00 50,00 00,00 50,00 weght pouds Repetto: Smple lear regresso We defe a model Y = β0
9.1 Introduction to the probit and logit models
 EC3000 Ecoometrcs Lecture 9 Probt & Logt Aalss 9. Itroducto to the probt ad logt models 9. The logt model 9.3 The probt model Appedx 9. Itroducto to the probt ad logt models These models are used regressos
Model Fitting, RANSAC. Jana Kosecka
 Model Fttg, RANSAC Jaa Kosecka Fttg: Issues Prevous strateges Le detecto Hough trasform Smple parametrc model, two parameters m, b m + b Votg strateg Hard to geeralze to hgher dmesos a o + a + a 2 2 +
residual. (Note that usually in descriptions of regression analysis, upper-case
 Regresso Aalyss Regresso aalyss fts or derves a model that descres the varato of a respose (or depedet ) varale as a fucto of oe or more predctor (or depedet ) varales. The geeral regresso model s oe of
Simple Linear Regression - Scalar Form
 Smple Lear Regresso - Scalar Form Q.. Model Y X,..., p..a. Derve the ormal equatos that mmze Q. p..b. Solve for the ordary least squares estmators, p..c. Derve E, V, E, V, COV, p..d. Derve the mea ad varace
UNIVERSITY OF OSLO DEPARTMENT OF ECONOMICS
 UNIVERSITY OF OSLO DEPARTMENT OF ECONOMICS Postpoed exam: ECON430 Statstcs Date of exam: Jauary 0, 0 Tme for exam: 09:00 a.m. :00 oo The problem set covers 5 pages Resources allowed: All wrtte ad prted
Summary of the lecture in Biostatistics
 Summary of the lecture Bostatstcs Probablty Desty Fucto For a cotuos radom varable, a probablty desty fucto s a fucto such that: 0 dx a b) b a dx A probablty desty fucto provdes a smple descrpto of the
b. There appears to be a positive relationship between X and Y; that is, as X increases, so does Y.
 .46. a. The frst varable (X) s the frst umber the par ad s plotted o the horzotal axs, whle the secod varable (Y) s the secod umber the par ad s plotted o the vertcal axs. The scatterplot s show the fgure
Maximum Likelihood Estimation
 Marquette Uverst Maxmum Lkelhood Estmato Dael B. Rowe, Ph.D. Professor Departmet of Mathematcs, Statstcs, ad Computer Scece Coprght 08 b Marquette Uverst Maxmum Lkelhood Estmato We have bee sag that ~
Lecture 3. Sampling, sampling distributions, and parameter estimation
 Lecture 3 Samplg, samplg dstrbutos, ad parameter estmato Samplg Defto Populato s defed as the collecto of all the possble observatos of terest. The collecto of observatos we take from the populato s called
Multivariate Transformation of Variables and Maximum Likelihood Estimation
 Marquette Uversty Multvarate Trasformato of Varables ad Maxmum Lkelhood Estmato Dael B. Rowe, Ph.D. Assocate Professor Departmet of Mathematcs, Statstcs, ad Computer Scece Copyrght 03 by Marquette Uversty
Multiple Linear Regression Analysis
 LINEA EGESSION ANALYSIS MODULE III Lecture - 4 Multple Lear egresso Aalyss Dr. Shalabh Departmet of Mathematcs ad Statstcs Ida Isttute of Techology Kapur Cofdece terval estmato The cofdece tervals multple
{ }{ ( )} (, ) = ( ) ( ) ( ) Chapter 14 Exercises in Sampling Theory. Exercise 1 (Simple random sampling): Solution:
} (, ) = ( ) ( ) ( ) Chapter 14 Exercises in Sampling Theory. Exercise 1 (Simple random sampling): Solution:") Chapter 4 Exercses Samplg Theory Exercse (Smple radom samplg: Let there be two correlated radom varables X ad A sample of sze s draw from a populato by smple radom samplg wthout replacemet The observed
Chapter 4 Exercses Samplg Theory Exercse (Smple radom samplg: Let there be two correlated radom varables X ad A sample of sze s draw from a populato by smple radom samplg wthout replacemet The observed
Homework Solution (#5)
") Homework Soluto (# Chapter : #6,, 8(b, 3, 4, 44, 49, 3, 9 ad 7 Chapter. Smple Lear Regresso ad Correlato.6 (6 th edto 7, old edto Page 9 Rafall volume ( vs Ruoff volume ( : 9 8 7 6 4 3 : a. Yes, the scatter-plot
Homework Soluto (# Chapter : #6,, 8(b, 3, 4, 44, 49, 3, 9 ad 7 Chapter. Smple Lear Regresso ad Correlato.6 (6 th edto 7, old edto Page 9 Rafall volume ( vs Ruoff volume ( : 9 8 7 6 4 3 : a. Yes, the scatter-plot
Lecture 2: Linear Least Squares Regression
 Lecture : Lear Least Squares Regresso Dave Armstrog UW Mlwaukee February 8, 016 Is the Relatoshp Lear? lbrary(car) data(davs) d 150) Davs$weght[d]
CHAPTER VI Statistical Analysis of Experimental Data
 Chapter VI Statstcal Aalyss of Expermetal Data CHAPTER VI Statstcal Aalyss of Expermetal Data Measuremets do ot lead to a uque value. Ths s a result of the multtude of errors (maly radom errors) that ca
ENGI 4421 Propagation of Error Page 8-01
 ENGI 441 Propagato of Error Page 8-01 Propagato of Error [Navd Chapter 3; ot Devore] Ay realstc measuremet procedure cotas error. Ay calculatos based o that measuremet wll therefore also cota a error.
Previous lecture. Lecture 8. Learning outcomes of this lecture. Today. Statistical test and Scales of measurement. Correlation
 Lecture 8 Emprcal Research Methods I434 Quattatve Data aalss II Relatos Prevous lecture Idea behd hpothess testg Is the dfferece betwee two samples a reflecto of the dfferece of two dfferet populatos or
CHAPTER 2. = y ˆ β x (.1022) So we can write
 So we can write") CHAPTER SOLUTIONS TO PROBLEMS. () Let y = GPA, x = ACT, ad = 8. The x = 5.875, y = 3.5, (x x )(y y ) = 5.85, ad (x x ) = 56.875. From equato (.9), we obta the slope as ˆβ = = 5.85/56.875., rouded to four
CHAPTER SOLUTIONS TO PROBLEMS. () Let y = GPA, x = ACT, ad = 8. The x = 5.875, y = 3.5, (x x )(y y ) = 5.85, ad (x x ) = 56.875. From equato (.9), we obta the slope as ˆβ = = 5.85/56.875., rouded to four
Third handout: On the Gini Index
 Thrd hadout: O the dex Corrado, a tala statstca, proposed (, 9, 96) to measure absolute equalt va the mea dfferece whch s defed as ( / ) where refers to the total umber of dvduals socet. Assume that. The
1. The weight of six Golden Retrievers is 66, 61, 70, 67, 92 and 66 pounds. The weight of six Labrador Retrievers is 54, 60, 72, 78, 84 and 67.
 Ecoomcs 3 Itroducto to Ecoometrcs Sprg 004 Professor Dobk Name Studet ID Frst Mdterm Exam You must aswer all the questos. The exam s closed book ad closed otes. You may use your calculators but please
Chapter 13, Part A Analysis of Variance and Experimental Design. Introduction to Analysis of Variance. Introduction to Analysis of Variance
 Chapter, Part A Aalyss of Varace ad Epermetal Desg Itroducto to Aalyss of Varace Aalyss of Varace: Testg for the Equalty of Populato Meas Multple Comparso Procedures Itroducto to Aalyss of Varace Aalyss
Correlation and Regression Analysis
 Chapter V Correlato ad Regresso Aalss R. 5.. So far we have cosdered ol uvarate dstrbutos. Ma a tme, however, we come across problems whch volve two or more varables. Ths wll be the subject matter of the
2SLS Estimates ECON In this case, begin with the assumption that E[ i
 SLS Estmates ECON 3033 Bll Evas Fall 05 Two-Stage Least Squares (SLS Cosder a stadard lear bvarate regresso model y 0 x. I ths case, beg wth the assumto that E[ x] 0 whch meas that OLS estmates of wll
Statistics: Unlocking the Power of Data Lock 5
 STAT 0 Dr. Kar Lock Morga Exam 2 Grades: I- Class Multple Regresso SECTIONS 9.2, 0., 0.2 Multple explaatory varables (0.) Parttog varablty R 2, ANOVA (9.2) Codtos resdual plot (0.2) Exam 2 Re- grades Re-
ECONOMETRIC THEORY. MODULE VIII Lecture - 26 Heteroskedasticity
 ECONOMETRIC THEORY MODULE VIII Lecture - 6 Heteroskedastcty Dr. Shalabh Departmet of Mathematcs ad Statstcs Ida Isttute of Techology Kapur . Breusch Paga test Ths test ca be appled whe the replcated data
Regression. Linear Regression. A Simple Data Display. A Batch of Data. The Mean is 220. A Value of 474. STAT Handout Module 15 1 st of June 2009
 STAT Hadout Module 5 st of Jue 9 Lear Regresso Regresso Joh D. Sork, M.D. Ph.D. Baltmore VA Medcal Ceter GRCC ad Uversty of Marylad School of Medce Claude D. Pepper Older Amercas Idepedece Ceter Reducg
TESTS BASED ON MAXIMUM LIKELIHOOD
 ESE 5 Toy E. Smth. The Basc Example. TESTS BASED ON MAXIMUM LIKELIHOOD To llustrate the propertes of maxmum lkelhood estmates ad tests, we cosder the smplest possble case of estmatg the mea of the ormal
Chapter 14 Logistic Regression Models
 Chapter 4 Logstc Regresso Models I the lear regresso model X β + ε, there are two types of varables explaatory varables X, X,, X k ad study varable y These varables ca be measured o a cotuous scale as
The expected value of a sum of random variables,, is the sum of the expected values:
 Sums of Radom Varables xpected Values ad Varaces of Sums ad Averages of Radom Varables The expected value of a sum of radom varables, say S, s the sum of the expected values: ( ) ( ) S Ths s always true
Analyzing Two-Dimensional Data. Analyzing Two-Dimensional Data
 /7/06 Aalzg Two-Dmesoal Data The most commo aaltcal measuremets volve the determato of a ukow cocetrato based o the respose of a aaltcal procedure (usuall strumetal). Such a measuremet requres calbrato,
Econ 388 R. Butler 2016 rev Lecture 5 Multivariate 2 I. Partitioned Regression and Partial Regression Table 1: Projections everywhere
 Eco 388 R. Butler 06 rev Lecture 5 Multvarate I. Parttoed Regresso ad Partal Regresso Table : Projectos everywhere P = ( ) ad M = I ( ) ad s a vector of oes assocated wth the costat term Sample Model Regresso
Investigation of Partially Conditional RP Model with Response Error. Ed Stanek
 Partally Codtoal Radom Permutato Model 7- vestgato of Partally Codtoal RP Model wth Respose Error TRODUCTO Ed Staek We explore the predctor that wll result a smple radom sample wth respose error whe a
STK4011 and STK9011 Autumn 2016
 STK4 ad STK9 Autum 6 Pot estmato Covers (most of the followg materal from chapter 7: Secto 7.: pages 3-3 Secto 7..: pages 3-33 Secto 7..: pages 35-3 Secto 7..3: pages 34-35 Secto 7.3.: pages 33-33 Secto
Example. Row Hydrogen Carbon
 SMAM 39 Least Squares Example. Heatg ad combusto aalyses were performed order to study the composto of moo rocks collected by Apollo 4 ad 5 crews. Recorded c ad c of the Mtab output are the determatos
UNIT 7 RANK CORRELATION
 UNIT 7 RANK CORRELATION Rak Correlato Structure 7. Itroucto Objectves 7. Cocept of Rak Correlato 7.3 Dervato of Rak Correlato Coeffcet Formula 7.4 Te or Repeate Raks 7.5 Cocurret Devato 7.6 Summar 7.7
Chapter 5 Properties of a Random Sample
 Lecture 6 o BST 63: Statstcal Theory I Ku Zhag, /0/008 Revew for the prevous lecture Cocepts: t-dstrbuto, F-dstrbuto Theorems: Dstrbutos of sample mea ad sample varace, relatoshp betwee sample mea ad sample
ln( weekly earn) age age
 age age") Problem Set 4, ECON 3033 (Due at the start of class, Wedesday, February 4, 04) (Questos marked wth a * are old test questos) Bll Evas Sprg 08. Cosder a multvarate regresso model of the form y 0 x x. Wrte
Problem Set 4, ECON 3033 (Due at the start of class, Wedesday, February 4, 04) (Questos marked wth a * are old test questos) Bll Evas Sprg 08. Cosder a multvarate regresso model of the form y 0 x x. Wrte
: At least two means differ SST
 Formula Card for Eam 3 STA33 ANOVA F-Test: Completely Radomzed Desg ( total umber of observatos, k = Number of treatmets,& T = total for treatmet ) Step : Epress the Clam Step : The ypotheses: :... 0 A
Simple Linear Regression and Correlation. Applied Statistics and Probability for Engineers. Chapter 11 Simple Linear Regression and Correlation
 4//6 Appled Statstcs ad Probablty for Egeers Sth Edto Douglas C. Motgomery George C. Ruger Chapter Smple Lear Regresso ad Correlato CHAPTER OUTLINE Smple Lear Regresso ad Correlato - Emprcal Models -8
CS 2750 Machine Learning. Lecture 8. Linear regression. CS 2750 Machine Learning. Linear regression. is a linear combination of input components x
 CS 75 Mache Learg Lecture 8 Lear regresso Mlos Hauskrecht mlos@cs.ptt.edu 539 Seott Square CS 75 Mache Learg Lear regresso Fucto f : X Y s a lear combato of put compoets f + + + K d d K k - parameters
Suggested Answers, Problem Set 4 ECON The R 2 for the unrestricted model is by definition u u u u
 Da Hgerma Fall 9 Sggested Aswers, Problem Set 4 ECON 333 The F-test s defed as ( SSEr The R for the restrcted model s by defto SSE / ( k ) R ( SSE / SST ) so therefore, SSE SST ( R ) ad lkewse SSEr SST
Comparison of Dual to Ratio-Cum-Product Estimators of Population Mean
 Research Joural of Mathematcal ad Statstcal Sceces ISS 30 6047 Vol. 1(), 5-1, ovember (013) Res. J. Mathematcal ad Statstcal Sc. Comparso of Dual to Rato-Cum-Product Estmators of Populato Mea Abstract
Chapter 8: Statistical Analysis of Simulated Data
 Marquette Uversty MSCS600 Chapter 8: Statstcal Aalyss of Smulated Data Dael B. Rowe, Ph.D. Departmet of Mathematcs, Statstcs, ad Computer Scece Copyrght 08 by Marquette Uversty MSCS600 Ageda 8. The Sample
SPECIAL CONSIDERATIONS FOR VOLUMETRIC Z-TEST FOR PROPORTIONS
 SPECIAL CONSIDERAIONS FOR VOLUMERIC Z-ES FOR PROPORIONS Oe s stctve reacto to the questo of whether two percetages are sgfcatly dfferet from each other s to treat them as f they were proportos whch the
X X X E[ ] E X E X. is the ()m n where the ( i,)th. j element is the mean of the ( i,)th., then
![X X X E[ ] E X E X. is the ()m n where the ( i,)th. j element is the mean of the ( i,)th., then](/thumbs/83/87696552.jpg "X X X E[ ] E X E X. is the ()m n where the ( i,)th. j element is the mean of the ( i,)th., then") Secto 5 Vectors of Radom Varables Whe workg wth several radom varables,,..., to arrage them vector form x, t s ofte coveet We ca the make use of matrx algebra to help us orgaze ad mapulate large umbers
Secto 5 Vectors of Radom Varables Whe workg wth several radom varables,,..., to arrage them vector form x, t s ofte coveet We ca the make use of matrx algebra to help us orgaze ad mapulate large umbers
Descriptive Statistics
 Page Techcal Math II Descrptve Statstcs Descrptve Statstcs Descrptve statstcs s the body of methods used to represet ad summarze sets of data. A descrpto of how a set of measuremets (for eample, people
ρ < 1 be five real numbers. The
 Lecture o BST 63: Statstcal Theory I Ku Zhag, /0/006 Revew for the prevous lecture Deftos: covarace, correlato Examples: How to calculate covarace ad correlato Theorems: propertes of correlato ad covarace
Johns Hopkins University Department of Biostatistics Math Review for Introductory Courses
 Johs Hopks Uverst Departmet of Bostatstcs Math Revew for Itroductor Courses Ratoale Bostatstcs courses wll rel o some fudametal mathematcal relatoshps, fuctos ad otato. The purpose of ths Math Revew s
Johns Hopkins University Department of Biostatistics Math Review for Introductory Courses
 Johs Hopks Uverst Departmet of Bostatstcs Math Revew for Itroductor Courses Ratoale Bostatstcs courses wll rel o some fudametal mathematcal relatoshps, fuctos ad otato. The purpose of ths Math Revew s
Continuous Distributions
 7//3 Cotuous Dstrbutos Radom Varables of the Cotuous Type Desty Curve Percet Desty fucto, f (x) A smooth curve that ft the dstrbuto 3 4 5 6 7 8 9 Test scores Desty Curve Percet Probablty Desty Fucto, f
Chapter 2 Simple Linear Regression
 Chapter Smple Lear Regresso. Itroducto ad Least Squares Estmates Regresso aalyss s a method for vestgatg the fuctoal relatoshp amog varables. I ths chapter we cosder problems volvg modelg the relatoshp
Chapter 4 Multiple Random Variables
 Revew for the prevous lecture: Theorems ad Examples: How to obta the pmf (pdf) of U = g (, Y) ad V = g (, Y) Chapter 4 Multple Radom Varables Chapter 44 Herarchcal Models ad Mxture Dstrbutos Examples:
best estimate (mean) for X uncertainty or error in the measurement (systematic, random or statistical) best
 for X uncertainty or error in the measurement (systematic, random or statistical) best") Error Aalyss Preamble Wheever a measuremet s made, the result followg from that measuremet s always subject to ucertaty The ucertaty ca be reduced by makg several measuremets of the same quatty or by mprovg
Error Aalyss Preamble Wheever a measuremet s made, the result followg from that measuremet s always subject to ucertaty The ucertaty ca be reduced by makg several measuremets of the same quatty or by mprovg
STA 105-M BASIC STATISTICS (This is a multiple choice paper.)
") DCDM BUSINESS SCHOOL September Mock Eamatos STA 0-M BASIC STATISTICS (Ths s a multple choce paper.) Tme: hours 0 mutes INSTRUCTIONS TO CANDIDATES Do ot ope ths questo paper utl you have bee told to do
DCDM BUSINESS SCHOOL September Mock Eamatos STA 0-M BASIC STATISTICS (Ths s a multple choce paper.) Tme: hours 0 mutes INSTRUCTIONS TO CANDIDATES Do ot ope ths questo paper utl you have bee told to do
Chapter Statistics Background of Regression Analysis
 Chapter 06.0 Statstcs Backgroud of Regresso Aalyss After readg ths chapter, you should be able to:. revew the statstcs backgroud eeded for learg regresso, ad. kow a bref hstory of regresso. Revew of Statstcal