Math 2200 Spring 2018, Exam 2
|
|
|
- Juliet Flynn
- 5 years ago
- Views:
Transcription
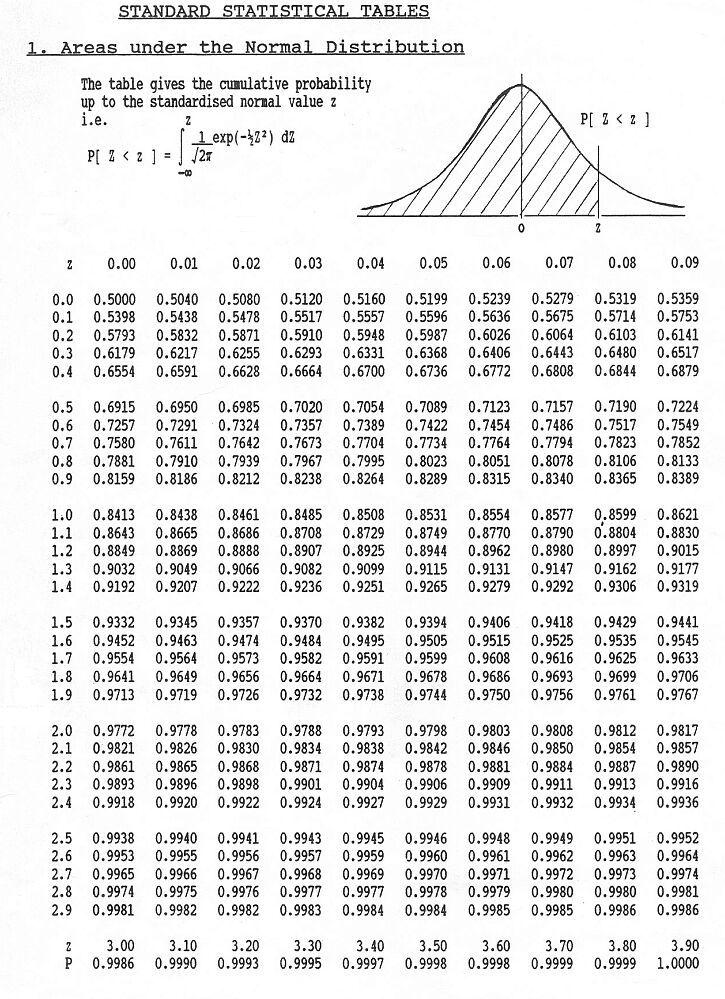
1 1 Math 2200 Spring 2018, Exam 2 You may use any calculator. You may use ONE cheat sheet in the form of a 4 x 6 note card (the medium size of the standard three sizes). The exam is out of 100 points. Each problem is worth 5 points. 1. Bone Mineral Density (BMD) is used as a measurement of the likelihood of bone fracture. The usual unit for BMD is gcm 2 but, for the problems found on this exam, we will use the unit mgcm 2 and round each measured value of BMD to the nearest integer. In every population (by age, gender, and race), the distribution of BMD is approximately normal. Mean BMD for 25 year old white women is 955 with standard deviation 123. Mean BMD for 25 year old black women is 1040 with standard deviation 135. Sam is 25 years old, white, and female. Her BMD is Nic is 25 years old, black, and female. The percentage of Nic s peers whose BMD is less than Nic s is the same as the percentage of Sam s peers whose BMD is less than Sam s. What is Nic s BMD? A) 1198 B) 1199 C) 1200 D) 1201 E) 1202 Solution B) 1199 Sam s BMD z-score is ( )123 or Nic has the same BMD z-score as Sam s (because they exceed the same proportion of their groups). Therefore, if x is Nic s raw BMD score, we have (x 1040)135 = , or x = ( )(135), or x = Rounding to the nearest integer, we have x = A slightly different approach is to calculate the proportion p S of Sam s peers with lesser BMD. We can do that in R with pnorm. Then we can use the quantile function to find the BMD in Nic s peer group that has the same proportion p S. Let us consider this alternative approach a verification of the first method. > pnorm(1100, mean = 955, sd = 123) # Proportion of Sam s peers with BMD < Sam s [1] > qnorm( , mean = 1040, sd = 135) # Answer: BMD for Nic s peers that corresponds to Sam s [1] > pnorm( , mean = 1040, sd = 135) # A check for a typo [1] Scores of a psychological test administered to prison inmates are normally distributed with mean 172 and standard deviation 33. Prisoners with scores less than 130 are labeled compliant. Prisoners with scores greater than 210 are labeled dangerous. Members of the in-between group are labeled latently hostile. The population of latently hostile inmates is what fraction of the total prison population? A) B) C) D) E) Solution D) The z-scores corresponding to 210 and 130 are ( )33, or and ( )33, or , respectively. Thus, the requested fraction is Φ(1.1515) Φ( ), or Φ(1.1515) (1 Φ(1.2727)) or Φ(1.1515) + Φ(1.2727) 1. Using the given table, and and therefore Φ(1.1515) = Φ(1.15) (Φ(1.16) Φ(1.15)) = ( ) = Φ(1.2727) = Φ(1.27) (Φ(1.28) Φ(1.27)) = ( ) = Proportion of latently hostile inmates = Φ(1.1515) + Φ(1.2727) 1 = =

2 2 The area under a normal density function is 1. In the figure below, the proportion that we seek is the shaded area under the curve. The code below begins with several lines that result in the displayed figure. Then a vector z of two z-scores is created: the first corresponding to the raw score 130 and the second corresponding to the raw score 210. The last line results in the requested proportion. > Raw.Scores = seq(from = 80, to = 260, by = 0.25) > Normal.Density = dnorm(raw.scores, mean = 172, sd = 33) > plot(raw.scores, Normal.Density, type = "l", lwd=2, xlim = c(80,260), ylim = c(0,0.013), + main = "Normal Density, Mean 172, Standard Deviation = 33") > lines(c(80,260),c(0,0)) > polygon( x=c(raw.scores[c(200,200:520,520)]), + y= c(0, Normal.Density[200:520], 0), col="gray90") > z = c( ( )33, ( )33 ) > z [1] > pnorm( z[2] ) - pnorm( z[1] ) # Requested fraction [1] In 1982, Robert K. Murray and Tim H. Blessing surveyed American academic historians asking them to rank U.S. presidents. The lengthy questionnaire also asked the surveyees if they leaned liberal or conservative. The two groups (190 liberals, 50 conservatives) agreed on 9 of 10 presidents in the top ten: Abraham Lincoln, Franklin D. Roosevelt, George Washington, Thomas Jefferson, Theodore Roosevelt, Woodrow Wilson, Andrew Jackson, Harry S. Truman, and John Adams (in order of the rankings assigned by the liberal historians). In the second row of the table are the rankings given by conservative historians to the same nine presidents listed in the same order. Note: Liberals ranked Lyndon Johnson 9 th and conservatives ranked Dwight Eisenhower 9 th. Both have been excluded. Calculate the Kendall tau correlation coefficient A) B) C) D) E) Solution D) The ordered pairs are (1,1), (2,3), (3,2), (4,4), (5,5), (6,8), (7,6), (8,7), (10,10). Each must be compared with all the others that follow. Before we begin, we remark that (4,4) and (5,5) are not ties. In fact neither group of historians ranked any pair of presidents on the list as being equal. There are no ties at all. we also note that the absence of a president ranked 9 th does not affect Kendall tau in any way. ANy
3 3 transformation that preserves order preserves Kendall tau. If you like, you can re-rank John Adams as 9 th on each list. Whether he is 9 th or 10 th, the order is preserved: he is last on the list. There are 8 concordant pairs associated with (1,1): Concordant: (2,3), (3,2), (4,4), (5,5), (6,8), (7,6), (8,7), (10,10). There are 6 concordant pairs and 1 discordant pair associated with (2,3). Concordant: (4,4), (5,5), (6,8), (7,6), (8,7), (10,10); Discordant: (3,2). There are 6 concordant pairs associated with (3,2). Concordant: (4,4), (5,5), (6,8), (7,6), (8,7), (10,10). There are 5 concordant pairs associated with (4,4). Concordant: (5,5), (6,8), (7,6), (8,7), (10,10). There are 4 concordant pairs associated with (5,5). Concordant: (6,8), (7,6), (8,7), (10,10). There is 1 concordant pair and 2 discordant pairs associated with (6,8). Concordant: (10,10); Discordant: (7,6), (8,7). There are 2 concordant pairs associated with (7,6). Concordant: (8,7), (10,10). There is 1 concordant pair associated with (8,7). Concordant: (10,10). Altogether, there are , or 33 concordant pairs and 3 discordant pairs. Thus τ = 33 ( 3 9 ) = = 5 6 = > liberal = c(1,2,3,4,5,6,7,8,9) > conservative = c(1,3,2,4,5,8,6,7,9) > cor(liberal,conservative,method = "kendall") [1] For the dataset in the preceding problem, find the Spearman rho correlation coefficient. A) B) C) D) E) Solution E) For Spearman rho we do change the values of John Adams from (10,10) to (9,9), although in the calculation we perform, a calculation that uses the Strange Formula for Spearman rho, the change happens to have no effect: the column difference is 0 either way. The column differences are 0, 1, 1, 0, 0, 2, 1, 1, 0 and their squares are 0, 1, 1, 0, 0, 4, 1, 1, 0. The sum of these squares is 8. Thus ρ = (9 2 1) 9 j=1 d 2 j = (80) (8) = = = > cor(liberal,conservative,method = "spearman") [1]
4 4 5. The dataset below consists of X = mean BMD (White women) and Y = mean BMD (Black women) at ages 25 to 85 in 10 year increments. Age X Y Summary statistics are X = , Y = , s X = , s Y = , and r X Y = What is the slope of the linear model of Y X? A) B) C) D) E) Solution A) If m is the slope of the regression line, then we have m = r X Y s Y = (0.9742) s X = > ww.bmd = c( 955, 945, 920, 876, 809, 740, 679) > bw.bmd = c(1040, 1017, 1034, 990, 969, 928, 859) > bmd.lm = lm(bw.bmd ~ ww.bmd) > coef(bmd.lm) (Intercept) ww.bmd We reuse the dataset of the preceding problem but we have eliminated one variable because it plays no role in this problem. The current dataset involves Age and Y = mean BMD (Black women). The table also contains the z-scores of the Y observations. What is the Pearson correlation coefficient between Age and Y? (Note: Problems 7, 9, and 10 will also depend on this data and possibly calculations done for this problem.) Age Y z Y A) B) C) D) E) Solution C) The mean age is the middle value, 55. Thus, the deviations are 30, 20, 10, 0, 10, 20, 30 and the sum of the square deviations is 2 ( ), or The standard deviation of Age is s Age = = It follows that ( (0.9731)( 30) + (0.6195)( 20) + (0.8809)( 10) r Age Y = 1 6 ) +(0.2043)(0) + ( )(10) + ( )(20) + ( )(30) ( ) ( ) 1 1 = ( ) =
5 5 > Age = seq(from = 25, to = 85, by = 10) > bw.bmd = c(1040, 1017, 1034, 990, 969, 928, 859) > cor(age, bw.bmd) # Answer for this problem [1] > # > # We continue the session to obtain data that answers problems to come. > # > lm(bw.bmd ~ Age) # The answer to the next problem is the slope; it appears under Age. Call: lm(formula = bw.bmd ~ Age) Coefficients: (Intercept) Age > resid( lm(bw.bmd ~ Age) ) # The answer to problem 9 is the 5 th entry of the response > sum( (lm(bw.bmd ~ Age)$fitted.values - mean(y))^2 ) # Answer to the 10 th problem. [1] Recent testing of 67 female cadavers at the Mayo Clinic resulted in a linear model for Women s BMD as a function of Age. According to the linear model, women lose BMD at the rate of mgcm 2 per year as they age. (Race was not considered in the study. Source: Femoral Strength..., Journal of Bone and Mineral Research, Volume 30, Issue 12, 2015, p ) According to the linear model that is based on the data of the preceding problem, at what rate per year do Black women lose BMD? A) B) C) D) E) Solution A) Using values that have already been given or calculated, we find that the slope m of the Y Age regression line is ( ) s m = r Y Age Y = = s Age We answer with because the problem asks for loss. The verification of using R can be found in the solution to the 6 th problem. We note that different studies have led to rather different linear models. The loss per year requested in this problem refers to Black women, who lose BMD less quickly than White women. The Mayo Clinic study refers to all women. The age range we have used is In the Mayo Clinic study, the age range is There is evidence that a linear model over both large ranges is inaccurate: yearly loss seems to accelerate with age. 8. The Mayo Clinic study that is discussed in the preceding problem reported a coefficient of determination equal to In that study, what was the correlation between BMD and Age? A) B) C) D) E) Solution A) We have r = 0.43 =
6 6 9. For the linear model Y Age of Problems 6 and 7 where Y = mean BMD (Black women) and the observations are Age Y what is the residual associated with the observation (65,969)? A) 4.13 B) 1.99 C) 8.11 D) E) Solution E) In problem 7 we calculated the slope m = of the regression line. We now calculate Y = and Age = 55. The Y-intercept of the regression line is b = Y m Age = ( )(55) = The regression line is Y = Age, and the fitted value for Age = 65 is Ŷ = ( )(65) = The requested residual is , or The verification in R is in the solution to the 6 th problem. 10. For the linear model Y Age of Problems 6, 7, and 9, where Y = mean BMD (Black women) and the observations are Age Y The sum of the squares of the errors is What is the sum of the squares explained by the regression line? A) B) C) D) E) Solution C) We have SST = (7-1) Var(Y), or SST = 6 ( ) 2 (from Problem 5), or Thus SSR = SST - SSE = = The verification in R can be found in the solution to the 6 th problem. 11. Let W be the distribution of mean BMD for Black men at ages 25, 35, 45, 55, 65, 75, 85. There is a strong positive correlation between W and the mean BMD Y of black women at the same ages (although the gender correlation discussed in Problem 5 is stronger than the race correlation just mentioned). If W is treated as a response variable and Y as an explanatory variable, then the linear model W Y results in SSE = and SSR = What is the linear correlation coefficient r YW? A) B) C) D) E) Solution B) We calculate SST = SSE + SSR = = It follows that SSR r Y W = SST = = = In the table below, X is a diameter measurement and Y a volume measurement for shortleaf pine trees the observations given here have been taken from a dataset of 70 trees that Donald Bruce and F.X. Schumacher published in Mean Sd X Y ln(x) ln(y)
7 7 Pearson s linear correlation coefficients for X and Y, for X and ln(y), for ln(x) and Y, and for ln(x) and ln(y) are: r X Y = , r X ln(y) = , r ln(x) Y = , and r ln(x) ln(y) = By using a linear model for an appropriate transformation of the observed values, find a model of the form Y = C X p where C and p are constants. What is p? (The next problem continues with this higher parabola model.) A) B) C) D) E) Solution C) By applying ln( ) to each side of Y = C X p, we obtain ln(y) = ln(c) + p ln(x). The linear model for this equation is Y) = ln(y) m ln(x) + m ln(x) where Thus m = r ln(x) ln(y) s ln(y) s ln(x) = ( ) = Y) = ( ) ( ) ln(x) = ln(x). Applying exp( ) to each side, we obtain Y = exp( ) X = ( ) X > X = c(5.1, 5.9, 8.6, 11.1, 12.2) > Y = c(3.0, 5.6, 16.6, 32.8, 28.2) > lm( log(y) ~ log(x) ) Call: lm(formula = log(y) ~ log(x)) Coefficients: (Intercept) log(x) > exp( ) [1] In the model Y = C X p of the preceding problem, what is C? A) B) C) D) E) Solution B) See the solution for the 12 th problem.
8 8 14. Weetabix Cereal has a new series of collectible cards inserted in its boxes of delicious food product. John Adams, John Quincy Adams, John Tyler, and John Kennedy are the collectible cards in the company s President Johns of the White House collection. Each box of Weetabix cereal contains one card, and the cards are inserted so that they are found in boxes with equal likelihoods. What is the probability p that the purchase of five cereal boxes will result in a complete set of the four Johns? Estimate p using the following table of random digits drawn from 1, 2, 3, and 4, and grouped in 30 blocks of 5 digits. Use each group of five digits in the table to simulate the purchase of 5 cereal boxes What estimate of p results from the simulation? A) B) C) D) E) Solution C) The collections that have 1, 2, 3, and 4 are: In the first row: In the second row: In the third row: 31412, In the fourth row: 44321, 23214, In the fifth row: Nada. Thus, p 730 = The composition of the sophomore class of Moose Jaw University is 712 female. Among all sophomores, the proportion with GPAs greater than or equal to 3.6 is 15. Gender and GPA are independent. If a sophomore is randomly selected, what is the probability that the student is male and has a GPA less than 3.6? A) B) C) D) E) Solution A) When the problem was conceived, the solution was intended to go as follows (but we advise the busy executive that a much shorter solution is given afterwards). Let F be the event of selecting a female, M = F c the event of selecting a male. Let HGPA be the event of selecting a student with a GPA greater than or equal to 3.6. Let LGPA = HGPA c be the event of choosing a student with a GPA less than 3.6. Then, in view of the independence of gender and GPA, 7 12 = P(F) ( ) = P F LGPA) (F HGPA) ( ) ( ) = P F LGPA + P F HGPA = P ( F LGPA ) + P(F)P(HGPA) = P ( F LGPA ) ( ) ( ) = P ( F LGPA ) It follows that P ( F LGPA ) = = = 7 15
9 9 Again using we have P ( F HGPA ) = P ( F ) P ( HGPA ) = ( ) ( ) 7 1 = , P ( M HGPA ) = P ( HGPA ) P ( F HGPA ) = = 5 60 = Finally, we have the partition of the entire sample space into four disjoint events: Ω = ( F LGPA ) ( F HGPA ) ( M LGPA ) ( M HGPA ). On applying P( ) to each side and solving for the probability of the specified event, we have P ( M LGPA ) ( 7 = ) 60 ( ) = = = A shorter solution using the independence of M and LGPA: P ( M LGPA ) = P ( M ) P ( LGPA ) ( = ) ( 1 1 ) ( 5 = 5 12 ) ( ) 4 = In Moose Jaw, days are either sunny xor cloudy. Weather patterns show that if it is sunny one day, then the probability of rain the next day is 217. If it is cloudy one day, then the probability of rain the next day is 25. On Monday, the CTV weatherman in Moose Jaw said, The probability that it will be sunny tomorrow is 14. What is the probability that it will rain in Moose Jaw on Wednesday? A) B) C) D) E) Solution B) Using the following tree diagram, we see that the requested probability is W Rain 14 TS ---W Dry TC ---W Rain 35 W Dry P(W R) = P(WR Ω) = P(WR (TS TC)) = P(WR TS) + P (WR TC) = P(WR TS)P(TS) + P(WR TC)P(TC) ( ) ( ) ( ) ( ) = =
10 An urn contained 6 red balls and 4 green balls. A first ball was removed from the urn and not replaced. Then a second ball was removed from the urn and not replaced. Finally a third ball was removed from the urn. In each selection, the likelihood of drawing any ball was the same as the likelihood of drawing any other ball. What is the probability that exactly 2 red balls were selected. A) B) C) D) E) Solution E) R R---G R R ---G---G G ---R---R 38 G 13 G---R G We can end up with exactly 2 red balls in these three ways: RGR, RRG, GRR. These are disjoint events. Therefore: P(exactly 2 red balls) = P(RGR) + P(RRG) + P(GRR) ( ) ( ) ( ) ( ) ( = = 1 2. ) ( 1 2 ) + ( 2 5 ) ( 2 3 ) ( ) 5 8
11 The prevalence of neuromuscular disorders is about 160 per 100,000 persons. As a biomarker of muscular disease, a creatine kinase (CK) level greater than 500 IUl has sensitivity 66% and specificity 77%. What is the probability that a member of the population with CK level > 500 IUl has a neuromuscular disorder? A) B) C) D) E) Solution A) Let NMD denote has neuromuscular disease and let POS and NEG denote CK assays greater than 500 IUl and less than 500 IUl respectively. We are given P(NMD) = = , P(POS NMD) = 0.66, and P (NEG NMD c ) = Then, acording to Bayes Theorem, P(NMD POS) = P(POS NMD) P(NMD) P(POS NMD) P(NMD) + P (POS NMD c ) P (NMD c ) = sensitivity prevalence sensitivity prevalence + (1 specificity)(1 prevalence) = (0.66)(0.0016) (0.66)(0.0016) + (1 0.77)( ) = The use of CK as a diagnostic marker originated in the 1960s. Nowadays, MRI is a more commonly used diagnostic tool: it is significantly more sensitive and more specific than CK tests. The use of CK as a test for acute myocardial infarction goes back to For that condition, CK is more sensitive (90%) but still not very specific. 19. Amiloride is a medication that is used to treat complications of heart failure and cirrhosis of the liver. In a trial designed to investigate its value as a treatment of cystic fibrosis (CF), it was found to be effective in 78.57% of CF patients. If a doctor prescribed amiloride for 20 CF patients, then what is the probability that at least 18 patients saw improvements in their conditions? (Assume that the effects of amiloride on the different patients are independent.) A) B) C) D) E) Solution A) The question asks for the probability P of 18, 19, or 20 successes in 20 independent, identically distributed Bernoulli trials where the probability of success in each trial is p = and the probability of failure is q = 1 p = Therefore ) ( ) ( ) P = ( p 18 q p 19 q p 20 q 0 = (20)(19) (0.7857) 18 (0.2143) (0.7857) 19 (0.2143)+(0.7857) 20 = On paper, twelve applicants for an executive position, 5 women and 7 men, seem equally qualified for the position. Two are selected at random for an interview. The probability that no woman is chosen for an interview is 722. The probability that two women are selected for an interview is 533. Let X be the number of women selected for an interview. What is the expectation of X? A) B) C) D) E) Solution C) The set V of values that X assumes with positive probabilities is V = {0, 1, 2}. We are given f X (0) = 722 and f X (2) = 533. It follows that f X (1) = 1 ( ) = 6666 ( ) = Thus ( ) ( ) ( ) E(X) = (0) + (1) + (2) = =
12 12
Analysing data: regression and correlation S6 and S7
 Basic medical statistics for clinical and experimental research Analysing data: regression and correlation S6 and S7 K. Jozwiak k.jozwiak@nki.nl 2 / 49 Correlation So far we have looked at the association
Statistics 135 Fall 2008 Final Exam
 Name: SID: Statistics 135 Fall 2008 Final Exam Show your work. The number of points each question is worth is shown at the beginning of the question. There are 10 problems. 1. [2] The normal equations
4. Suppose that we roll two die and let X be equal to the maximum of the two rolls. Find P (X {1, 3, 5}) and draw the PMF for X.
 and draw the PMF for X.") Math 10B with Professor Stankova Worksheet, Midterm #2; Wednesday, 3/21/2018 GSI name: Roy Zhao 1 Problems 1.1 Bayes Theorem 1. Suppose a test is 99% accurate and 1% of people have a disease. What is the
Math 10B with Professor Stankova Worksheet, Midterm #2; Wednesday, 3/21/2018 GSI name: Roy Zhao 1 Problems 1.1 Bayes Theorem 1. Suppose a test is 99% accurate and 1% of people have a disease. What is the
Elementary Statistics
 Elementary Statistics Brian E. Blank March 5, 2016 first president university press ii 0 Solutions to the Exercises Chapter 1 1. The population under study is composed of all licensed drivers in the United
Conditional probability
 CHAPTER 4 Conditional probability 4.1. Introduction Suppose there are 200 men, of which 100 are smokers, and 100 women, of which 20 are smokers. What is the probability that a person chosen at random will
Math 2200 Fall 2014, Final Exam You may use any calculator. You may use a 4 6 inch notecard as a cheat sheet.
 1 Math 2200 Fall 2014, Final Exam You may use any calculator. You may use a 4 6 inch notecard as a cheat sheet. Warning to the Reader! If you are a student for whom this document is a historical artifact,
Multiple Choice Practice Set 1
 Multiple Choice Practice Set 1 This set of questions covers material from Chapter 1. Multiple choice is the same format as for the midterm. Q1. Two events each have probability 0.2 of occurring and are
STAT/MA 416 Answers Homework 6 November 15, 2007 Solutions by Mark Daniel Ward PROBLEMS
 STAT/MA 4 Answers Homework November 5, 27 Solutions by Mark Daniel Ward PROBLEMS Chapter Problems 2a. The mass p, corresponds to neither of the first two balls being white, so p, 8 7 4/39. The mass p,
MATH 1150 Chapter 2 Notation and Terminology
 MATH 1150 Chapter 2 Notation and Terminology Categorical Data The following is a dataset for 30 randomly selected adults in the U.S., showing the values of two categorical variables: whether or not the
Stat 225 Week 2, 8/27/12-8/31/12, Notes: Independence and Bayes Rule
 Stat 225 Week 2, 8/27/12-8/31/12, Notes: Independence and Bayes Rule The Fall 2012 Stat 225 T.A.s September 7, 2012 1 Monday, 8/27/12, Notes on Independence In general, a conditional probability will change
STAT 135 Lab 11 Tests for Categorical Data (Fisher s Exact test, χ 2 tests for Homogeneity and Independence) and Linear Regression
 and Linear Regression") STAT 135 Lab 11 Tests for Categorical Data (Fisher s Exact test, χ 2 tests for Homogeneity and Independence) and Linear Regression Rebecca Barter April 20, 2015 Fisher s Exact Test Fisher s Exact Test
STAT 135 Lab 11 Tests for Categorical Data (Fisher s Exact test, χ 2 tests for Homogeneity and Independence) and Linear Regression Rebecca Barter April 20, 2015 Fisher s Exact Test Fisher s Exact Test
University of California, Berkeley, Statistics 131A: Statistical Inference for the Social and Life Sciences. Michael Lugo, Spring 2012
 University of California, Berkeley, Statistics 3A: Statistical Inference for the Social and Life Sciences Michael Lugo, Spring 202 Solutions to Exam Friday, March 2, 202. [5: 2+2+] Consider the stemplot
Name: Exam 2 Solutions. March 13, 2017
 Department of Mathematics University of Notre Dame Math 00 Finite Math Spring 07 Name: Instructors: Conant/Galvin Exam Solutions March, 07 This exam is in two parts on pages and contains problems worth
Discrete Distributions
 Discrete Distributions STA 281 Fall 2011 1 Introduction Previously we defined a random variable to be an experiment with numerical outcomes. Often different random variables are related in that they have
United States Presidents
 U.S. Presidents 1789-1845 Item 4213-A Name United States Presidents 1789-1845 M N Y P Y T Q K F Z B Z W B O E J A C K S O N Y A W O O N R Y P P F T E S A V I Z C R U P R Y C H S D D E P L N O B L M I L
MATH 2560 C F03 Elementary Statistics I Solutions to Assignment N3
 MATH 2560 C F03 Elementary Statistics I Solutions to Assignment N3 Total points: 50 (2.5 percents). Question 1: 12 points (1 point is equal to 0.05 percents); Question 2: 20 points; Question 3: 4 points;
Statistics 100 Exam 2 March 8, 2017
 STAT 100 EXAM 2 Spring 2017 (This page is worth 1 point. Graded on writing your name and net id clearly and circling section.) PRINT NAME (Last name) (First name) net ID CIRCLE SECTION please! L1 (MWF
15.1 The Regression Model: Analysis of Residuals
 15.1 The Regression Model: Analysis of Residuals Tom Lewis Fall Term 2009 Tom Lewis () 15.1 The Regression Model: Analysis of Residuals Fall Term 2009 1 / 12 Outline 1 The regression model 2 Estimating
UNIT 5 ~ Probability: What Are the Chances? 1
 UNIT 5 ~ Probability: What Are the Chances? 1 6.1: Simulation Simulation: The of chance behavior, based on a that accurately reflects the phenomenon under consideration. (ex 1) Suppose we are interested
Ch. 16: Correlation and Regression
 Ch. 1: Correlation and Regression With the shift to correlational analyses, we change the very nature of the question we are asking of our data. Heretofore, we were asking if a difference was likely to
Chapter 7. Practice Exam Questions and Solutions for Final Exam, Spring 2009 Statistics 301, Professor Wardrop
 Practice Exam Questions and Solutions for Final Exam, Spring 2009 Statistics 301, Professor Wardrop Chapter 6 1. A random sample of size n = 452 yields 113 successes. Calculate the 95% confidence interval
Review. Midterm Exam. Midterm Review. May 6th, 2015 AMS-UCSC. Spring Session 1 (Midterm Review) AMS-5 May 6th, / 24
 AMS-5 May 6th, / 24") Midterm Exam Midterm Review AMS-UCSC May 6th, 2015 Spring 2015. Session 1 (Midterm Review) AMS-5 May 6th, 2015 1 / 24 Topics Topics We will talk about... 1 Review Spring 2015. Session 1 (Midterm Review)
Midterm Exam Midterm Review AMS-UCSC May 6th, 2015 Spring 2015. Session 1 (Midterm Review) AMS-5 May 6th, 2015 1 / 24 Topics Topics We will talk about... 1 Review Spring 2015. Session 1 (Midterm Review)
Announcements: You can turn in homework until 6pm, slot on wall across from 2202 Bren. Make sure you use the correct slot! (Stats 8, closest to wall)
") Announcements: You can turn in homework until 6pm, slot on wall across from 2202 Bren. Make sure you use the correct slot! (Stats 8, closest to wall) We will cover Chs. 5 and 6 first, then 3 and 4. Mon,
Announcements: You can turn in homework until 6pm, slot on wall across from 2202 Bren. Make sure you use the correct slot! (Stats 8, closest to wall) We will cover Chs. 5 and 6 first, then 3 and 4. Mon,
HYPERGEOMETRIC and NEGATIVE HYPERGEOMETIC DISTRIBUTIONS
 HYPERGEOMETRIC and NEGATIVE HYPERGEOMETIC DISTRIBUTIONS A The Hypergeometric Situation: Sampling without Replacement In the section on Bernoulli trials [top of page 3 of those notes], it was indicated
6 THE NORMAL DISTRIBUTION
 CHAPTER 6 THE NORMAL DISTRIBUTION 341 6 THE NORMAL DISTRIBUTION Figure 6.1 If you ask enough people about their shoe size, you will find that your graphed data is shaped like a bell curve and can be described
Mrs. Poyner/Mr. Page Chapter 3 page 1
 Name: Date: Period: Chapter 2: Take Home TEST Bivariate Data Part 1: Multiple Choice. (2.5 points each) Hand write the letter corresponding to the best answer in space provided on page 6. 1. In a statistics
Section 7.2 Homework Answers
 25.5 30 Sample Mean P 0.1226 sum n b. The two z-scores are z 25 20(1.7) n 1.0 20 sum n 2.012 and z 30 20(1.7) n 1.0 0.894, 20 so the probability is approximately 0.1635 (0.1645 using Table A). P14. a.
Math 2200 Fall 2014, Exam 3 You may use any calculator. You may use a 4 6 inch notecard as a cheat sheet.
 1 Math 2200 Fall 2014, Exam 3 You may use any calculator. You may use a 4 6 inch notecard as a cheat sheet. Warning to the Reader! If you are a student for whom this document is a historical artifact,
Week 8: Correlation and Regression
 Health Sciences M.Sc. Programme Applied Biostatistics Week 8: Correlation and Regression The correlation coefficient Correlation coefficients are used to measure the strength of the relationship or association
2.6 Tools for Counting sample points
 2.6 Tools for Counting sample points When the number of simple events in S is too large, manual enumeration of every sample point in S is tedious or even impossible. (Example) If S contains N equiprobable
Honors Math 2 Exam Review Packet 1. Mastery Review from 2 nd Quarter
 Honors Math 2 Exam Review Packet 1 Mastery Review from 2 nd Quarter 1. A card is drawn from a 52-card deck. What is the probability of NOT drawing a face card or a spade? 2. A bag of marbles contains 6
1 A Review of Correlation and Regression
 1 A Review of Correlation and Regression SW, Chapter 12 Suppose we select n = 10 persons from the population of college seniors who plan to take the MCAT exam. Each takes the test, is coached, and then
Finding Relationships Among Variables
 Finding Relationships Among Variables BUS 230: Business and Economic Research and Communication 1 Goals Specific goals: Re-familiarize ourselves with basic statistics ideas: sampling distributions, hypothesis
Chapter 5 : Probability. Exercise Sheet. SHilal. 1 P a g e
 1 P a g e experiment ( observing / measuring ) outcomes = results sample space = set of all outcomes events = subset of outcomes If we collect all outcomes we are forming a sample space If we collect some
Introduction to Probability, Fall 2009
 Introduction to Probability, Fall 2009 Math 30530 Review questions for exam 1 solutions 1. Let A, B and C be events. Some of the following statements are always true, and some are not. For those that are
The Standard Deviation as a Ruler and the Normal Model
 The Standard Deviation as a Ruler and the Normal Model Al Nosedal University of Toronto Summer 2017 Al Nosedal University of Toronto The Standard Deviation as a Ruler and the Normal Model Summer 2017 1
Quantitative Bivariate Data
 Statistics 211 (L02) - Linear Regression Quantitative Bivariate Data Consider two quantitative variables, defined in the following way: X i - the observed value of Variable X from subject i, i = 1, 2,,
Math Sec 4 CST Topic 7. Statistics. i.e: Add up all values and divide by the total number of values.
 Measures of Central Tendency Statistics 1) Mean: The of all data values Mean= x = x 1+x 2 +x 3 + +x n n i.e: Add up all values and divide by the total number of values. 2) Mode: Most data value 3) Median:
STA 218: Statistics for Management
 Al Nosedal. University of Toronto. Fall 2017 My momma always said: Life was like a box of chocolates. You never know what you re gonna get. Forrest Gump. Simple Example Random Experiment: Rolling a fair
a. Write what the survey would look like (Hint: there should be 2 questions and options to select for an answer!).
.") HW 13-1 1. Several students at Rufus King High School were debating whether males or females were more involved in afterschool activities. There are three organized activities in the afterschool program
HW 13-1 1. Several students at Rufus King High School were debating whether males or females were more involved in afterschool activities. There are three organized activities in the afterschool program
In Class Review Exercises Vartanian: SW 540
 In Class Review Exercises Vartanian: SW 540 1. Given the following output from an OLS model looking at income, what is the slope and intercept for those who are black and those who are not black? b SE
UNIT 4 RANK CORRELATION (Rho AND KENDALL RANK CORRELATION
 UNIT 4 RANK CORRELATION (Rho AND KENDALL RANK CORRELATION Structure 4.0 Introduction 4.1 Objectives 4. Rank-Order s 4..1 Rank-order data 4.. Assumptions Underlying Pearson s r are Not Satisfied 4.3 Spearman
MATH 3510: PROBABILITY AND STATS July 1, 2011 FINAL EXAM
 MATH 3510: PROBABILITY AND STATS July 1, 2011 FINAL EXAM YOUR NAME: KEY: Answers in blue Show all your work. Answers out of the blue and without any supporting work may receive no credit even if they are
MATH ASSIGNMENT 2: SOLUTIONS
 MATH 204 - ASSIGNMENT 2: SOLUTIONS (a) Fitting the simple linear regression model to each of the variables in turn yields the following results: we look at t-tests for the individual coefficients, and
What is statistics? Statistics is the science of: Collecting information. Organizing and summarizing the information collected
 What is statistics? Statistics is the science of: Collecting information Organizing and summarizing the information collected Analyzing the information collected in order to draw conclusions Two types
Exam III #1 Solutions
 Department of Mathematics University of Notre Dame Math 10120 Finite Math Fall 2017 Name: Instructors: Basit & Migliore Exam III #1 Solutions November 14, 2017 This exam is in two parts on 11 pages and
QUIZ 1 (CHAPTERS 1-4) SOLUTIONS MATH 119 FALL 2012 KUNIYUKI 105 POINTS TOTAL, BUT 100 POINTS
 SOLUTIONS MATH 119 FALL 2012 KUNIYUKI 105 POINTS TOTAL, BUT 100 POINTS") QUIZ 1 (CHAPTERS 1-4) SOLUTIONS MATH 119 FALL 2012 KUNIYUKI 105 POINTS TOTAL, BUT 100 POINTS = 100% Show all work, simplify as appropriate, and use good form and procedure (as in class). Box in your final
QUIZ 1 (CHAPTERS 1-4) SOLUTIONS MATH 119 FALL 2012 KUNIYUKI 105 POINTS TOTAL, BUT 100 POINTS = 100% Show all work, simplify as appropriate, and use good form and procedure (as in class). Box in your final
Lecture 8: Summary Measures
 Lecture 8: Summary Measures Dipankar Bandyopadhyay, Ph.D. BMTRY 711: Analysis of Categorical Data Spring 2011 Division of Biostatistics and Epidemiology Medical University of South Carolina Lecture 8:
Ecn Analysis of Economic Data University of California - Davis February 23, 2010 Instructor: John Parman. Midterm 2. Name: ID Number: Section:
 Ecn 102 - Analysis of Economic Data University of California - Davis February 23, 2010 Instructor: John Parman Midterm 2 You have until 10:20am to complete this exam. Please remember to put your name,
Solutions to Problems and
 Solutions to Problems 1.2.24 and 1.2.27 Will Johnson September 6, 2014 Since people asked me about these problems, I said I d write up some solutions. (27) A general power function looks like f(x) = cx
Math is Cool Championships
 Individual Contest Express all answers as reduced fractions unless stated otherwise. Leave answers in terms of π where applicable. Do not round any answers unless stated otherwise. Record all answers on
Using Probability to do Statistics.
 Al Nosedal. University of Toronto. November 5, 2015 Milk and honey and hemoglobin Animal experiments suggested that honey in a diet might raise hemoglobin level. A researcher designed a study involving
Table of z values and probabilities for the standard normal distribution. z is the first column plus the top row. Each cell shows P(X z).
.") Table of z values and probabilities for the standard normal distribution. z is the first column plus the top row. Each cell shows P(X z). For example P(X 1.04) =.8508. For z < 0 subtract the value from
Table of z values and probabilities for the standard normal distribution. z is the first column plus the top row. Each cell shows P(X z). For example P(X 1.04) =.8508. For z < 0 subtract the value from
Review. Number of variables. Standard Scores. Anecdotal / Clinical. Bivariate relationships. Ch. 3: Correlation & Linear Regression
 Ch. 3: Correlation & Relationships between variables Scatterplots Exercise Correlation Race / DNA Review Why numbers? Distribution & Graphs : Histogram Central Tendency Mean (SD) The Central Limit Theorem
AP Final Review II Exploring Data (20% 30%)
") AP Final Review II Exploring Data (20% 30%) Quantitative vs Categorical Variables Quantitative variables are numerical values for which arithmetic operations such as means make sense. It is usually a measure
AP Final Review II Exploring Data (20% 30%) Quantitative vs Categorical Variables Quantitative variables are numerical values for which arithmetic operations such as means make sense. It is usually a measure
36-309/749 Math Review 2014
 36-309/749 Math Review 2014 The math content of 36-309 is not high. We will use algebra, including logs. We will not use calculus or matrix algebra. This optional handout is intended to help those students
# of 6s # of times Test the null hypthesis that the dice are fair at α =.01 significance
 Practice Final Exam Statistical Methods and Models - Math 410, Fall 2011 December 4, 2011 You may use a calculator, and you may bring in one sheet (8.5 by 11 or A4) of notes. Otherwise closed book. The
Introduction and Single Predictor Regression. Correlation
 Introduction and Single Predictor Regression Dr. J. Kyle Roberts Southern Methodist University Simmons School of Education and Human Development Department of Teaching and Learning Correlation A correlation
Ph.D. Qualifying Exam Monday Tuesday, January 4 5, 2016
 Ph.D. Qualifying Exam Monday Tuesday, January 4 5, 2016 Put your solution to each problem on a separate sheet of paper. Problem 1. (5106) Find the maximum likelihood estimate of θ where θ is a parameter
Problem #1. The following matrices are augmented matrices of linear systems. How many solutions has each system? Motivate your answer.
 Exam #4 covers the material about systems of linear equations and matrices (CH. 4.1-4.4, PART II); systems of linear inequalities in two variables (geometric approach) and linear programming (CH.5.1-5.2,
Math P (A 1 ) =.5, P (A 2 ) =.6, P (A 1 A 2 ) =.9r
 =.5, P (A 2 ) =.6, P (A 1 A 2 ) =.9r") Math 3070 1. Treibergs σιι First Midterm Exam Name: SAMPLE January 31, 2000 (1. Compute the sample mean x and sample standard deviation s for the January mean temperatures (in F for Seattle from 1900 to
Math 3070 1. Treibergs σιι First Midterm Exam Name: SAMPLE January 31, 2000 (1. Compute the sample mean x and sample standard deviation s for the January mean temperatures (in F for Seattle from 1900 to
Solutions to the Spring 2015 CAS Exam ST
 Solutions to the Spring 2015 CAS Exam ST (updated to include the CAS Final Answer Key of July 15) There were 25 questions in total, of equal value, on this 2.5 hour exam. There was a 10 minute reading
DSST Principles of Statistics
 DSST Principles of Statistics Time 10 Minutes 98 Questions Each incomplete statement is followed by four suggested completions. Select the one that is best in each case. 1. Which of the following variables
9 Correlation and Regression
 9 Correlation and Regression SW, Chapter 12. Suppose we select n = 10 persons from the population of college seniors who plan to take the MCAT exam. Each takes the test, is coached, and then retakes the
University of Georgia Department of Mathematics. Math 1113 Final Exam Fall 2016
 University of Georgia Department of Mathematics Math 1113 Final Exam Fall 2016 By providing my signature below I acknowledge that I abide by the University s academic honesty policy. This is my work, and
Date: Pd: Unit 4. GSE H Analytic Geometry EOC Review Name: Units Rewrite ( 12 3) 2 in simplest form. 2. Simplify
 2 in simplest form. 2. Simplify") GSE H Analytic Geometry EOC Review Name: Units 4 7 Date: Pd: Unit 4 1. Rewrite ( 12 3) 2 in simplest form. 2. Simplify 18 25 3. Which expression is equivalent to 32 8? a) 2 2 27 4. Which expression is
GSE H Analytic Geometry EOC Review Name: Units 4 7 Date: Pd: Unit 4 1. Rewrite ( 12 3) 2 in simplest form. 2. Simplify 18 25 3. Which expression is equivalent to 32 8? a) 2 2 27 4. Which expression is
STAT Exam Jam Solutions. Contents
 s Contents 1 First Day 2 Question 1: PDFs, CDFs, and Finding E(X), V (X).......................... 2 Question 2: Bayesian Inference...................................... 3 Question 3: Binomial to Normal
SHOW ALL WORK FOR CREDIT!!!
 MATH 1342ÞP04 FALL 2010 CHAPTERS 4, 5 & 6 NAME SHOW ALL WORK FOR CREDIT!!! 1. A study was done to investigate a possible relationship the circumference (in ft) and the height (in ft) of trees. The data
Ron Heck, Fall Week 3: Notes Building a Two-Level Model
 Ron Heck, Fall 2011 1 EDEP 768E: Seminar on Multilevel Modeling rev. 9/6/2011@11:27pm Week 3: Notes Building a Two-Level Model We will build a model to explain student math achievement using student-level
Table of z values and probabilities for the standard normal distribution. z is the first column plus the top row. Each cell shows P(X z).
.") Table of z values and probabilities for the standard normal distribution. z is the first column plus the top row. Each cell shows P(X z). For example P(X.04) =.8508. For z < 0 subtract the value from,
Table of z values and probabilities for the standard normal distribution. z is the first column plus the top row. Each cell shows P(X z). For example P(X.04) =.8508. For z < 0 subtract the value from,
Exam Empirical Methods VU University Amsterdam, Faculty of Exact Sciences h, February 12, 2015
 Exam Empirical Methods VU University Amsterdam, Faculty of Exact Sciences 18.30 21.15h, February 12, 2015 Question 1 is on this page. Always motivate your answers. Write your answers in English. Only the
Statistics 5100 Spring 2018 Exam 1
 Statistics 5100 Spring 2018 Exam 1 Directions: You have 60 minutes to complete the exam. Be sure to answer every question, and do not spend too much time on any part of any question. Be concise with all
Math/Stat 394 Homework 5
 Math/Stat 394 Homework 5 1. If we select two black balls then X 4. This happens with probability ( 4 2). If we select two white balls then X 2. This happens with ( 14 probability (8 2). If we select two
Section 4.6 Simple Linear Regression
 Section 4.6 Simple Linear Regression Objectives ˆ Basic philosophy of SLR and the regression assumptions ˆ Point & interval estimation of the model parameters, and how to make predictions ˆ Point and interval
STATISTICS FOR ECONOMISTS: A BEGINNING. John E. Floyd University of Toronto
 STATISTICS FOR ECONOMISTS: A BEGINNING John E. Floyd University of Toronto July 2, 2010 PREFACE The pages that follow contain the material presented in my introductory quantitative methods in economics
UNIVERSIDAD CARLOS III DE MADRID ECONOMETRICS Academic year 2009/10 FINAL EXAM (2nd Call) June, 25, 2010
 June, 25, 2010") UNIVERSIDAD CARLOS III DE MADRID ECONOMETRICS Academic year 2009/10 FINAL EXAM (2nd Call) June, 25, 2010 Very important: Take into account that: 1. Each question, unless otherwise stated, requires a complete
UNIVERSIDAD CARLOS III DE MADRID ECONOMETRICS Academic year 2009/10 FINAL EXAM (2nd Call) June, 25, 2010 Very important: Take into account that: 1. Each question, unless otherwise stated, requires a complete
Passing-Bablok Regression for Method Comparison
 Chapter 313 Passing-Bablok Regression for Method Comparison Introduction Passing-Bablok regression for method comparison is a robust, nonparametric method for fitting a straight line to two-dimensional
Example. What is the sample space for flipping a fair coin? Rolling a 6-sided die? Find the event E where E = {x x has exactly one head}
 Chapter 7 Notes 1 (c) Epstein, 2013 CHAPTER 7: PROBABILITY 7.1: Experiments, Sample Spaces and Events Chapter 7 Notes 2 (c) Epstein, 2013 What is the sample space for flipping a fair coin three times?
Lecture 7 Time-dependent Covariates in Cox Regression
 Lecture 7 Time-dependent Covariates in Cox Regression So far, we ve been considering the following Cox PH model: λ(t Z) = λ 0 (t) exp(β Z) = λ 0 (t) exp( β j Z j ) where β j is the parameter for the the
DEPARTMENT OF COMPUTER SCIENCE Autumn Semester MACHINE LEARNING AND ADAPTIVE INTELLIGENCE
 Data Provided: None DEPARTMENT OF COMPUTER SCIENCE Autumn Semester 203 204 MACHINE LEARNING AND ADAPTIVE INTELLIGENCE 2 hours Answer THREE of the four questions. All questions carry equal weight. Figures
Math 2311 TEST 2 REVIEW SHEET KEY
 Math 2311 TEST 2 REVIEW SHEET KEY #1 25, Define the following: 1. Continuous random variable 2. Discrete random variable 3. Density curve 4. Uniform density curve 5. Normal distribution 6. Sampling distribution
Dependence. Practitioner Course: Portfolio Optimization. John Dodson. September 10, Dependence. John Dodson. Outline.
 Practitioner Course: Portfolio Optimization September 10, 2008 Before we define dependence, it is useful to define Random variables X and Y are independent iff For all x, y. In particular, F (X,Y ) (x,
What does a population that is normally distributed look like? = 80 and = 10
 What does a population that is normally distributed look like? = 80 and = 10 50 60 70 80 90 100 110 X Empirical Rule 68% 95% 99.7% 68-95-99.7% RULE Empirical Rule restated 68% of the data values fall within
Simple Linear Regression
 9-1 l Chapter 9 l Simple Linear Regression 9.1 Simple Linear Regression 9.2 Scatter Diagram 9.3 Graphical Method for Determining Regression 9.4 Least Square Method 9.5 Correlation Coefficient and Coefficient
5. Let W follow a normal distribution with mean of μ and the variance of 1. Then, the pdf of W is
 Practice Final Exam Last Name:, First Name:. Please write LEGIBLY. Answer all questions on this exam in the space provided (you may use the back of any page if you need more space). Show all work but do
q3_3 MULTIPLE CHOICE. Choose the one alternative that best completes the statement or answers the question.
 q3_3 MULTIPLE CHOICE. Choose the one alternative that best completes the statement or answers the question. Provide an appropriate response. 1) In 2007, the number of wins had a mean of 81.79 with a standard
Term Definition Example Random Phenomena
 UNIT VI STUDY GUIDE Probabilities Course Learning Outcomes for Unit VI Upon completion of this unit, students should be able to: 1. Apply mathematical principles used in real-world situations. 1.1 Demonstrate
Regression Models REVISED TEACHING SUGGESTIONS ALTERNATIVE EXAMPLES
 M04_REND6289_10_IM_C04.QXD 5/7/08 2:49 PM Page 46 4 C H A P T E R Regression Models TEACHING SUGGESTIONS Teaching Suggestion 4.1: Which Is the Independent Variable? We find that students are often confused
Intro to Probability Day 4 (Compound events & their probabilities)
") Intro to Probability Day 4 (Compound events & their probabilities) Compound Events Let A, and B be two event. Then we can define 3 new events as follows: 1) A or B (also A B ) is the list of all outcomes
Intro to Probability Day 4 (Compound events & their probabilities) Compound Events Let A, and B be two event. Then we can define 3 new events as follows: 1) A or B (also A B ) is the list of all outcomes
This is a multiple choice and short answer practice exam. It does not count towards your grade. You may use the tables in your book.
 NAME (Please Print): HONOR PLEDGE (Please Sign): statistics 101 Practice Final Key This is a multiple choice and short answer practice exam. It does not count towards your grade. You may use the tables
Chapter 3: The Normal Distributions
 Chapter 3: The Normal Distributions http://www.yorku.ca/nuri/econ2500/econ2500-online-course-materials.pdf graphs-normal.doc / histogram-density.txt / normal dist table / ch3-image Ch3 exercises: 3.2,
Lecture Notes for BUSINESS STATISTICS - BMGT 571. Chapters 1 through 6. Professor Ahmadi, Ph.D. Department of Management
 Lecture Notes for BUSINESS STATISTICS - BMGT 571 Chapters 1 through 6 Professor Ahmadi, Ph.D. Department of Management Revised May 005 Glossary of Terms: Statistics Chapter 1 Data Data Set Elements Variable
Exam III Review Math-132 (Sections 7.1, 7.2, 7.3, 7.4, 7.5, 7.6, 8.1, 8.2, 8.3)
") 1 Exam III Review Math-132 (Sections 7.1, 7.2, 7.3, 7.4, 7.5, 7.6, 8.1, 8.2, 8.3) On this exam, questions may come from any of the following topic areas: - Union and intersection of sets - Complement of
1 Exam III Review Math-132 (Sections 7.1, 7.2, 7.3, 7.4, 7.5, 7.6, 8.1, 8.2, 8.3) On this exam, questions may come from any of the following topic areas: - Union and intersection of sets - Complement of
Data files for today. CourseEvalua2on2.sav pontokprediktorok.sav Happiness.sav Ca;erplot.sav
 Correlation Data files for today CourseEvalua2on2.sav pontokprediktorok.sav Happiness.sav Ca;erplot.sav Defining Correlation Co-variation or co-relation between two variables These variables change together
2. AXIOMATIC PROBABILITY
 IA Probability Lent Term 2. AXIOMATIC PROBABILITY 2. The axioms The formulation for classical probability in which all outcomes or points in the sample space are equally likely is too restrictive to develop
AP Statistics Semester I Examination Section I Questions 1-30 Spend approximately 60 minutes on this part of the exam.
 AP Statistics Semester I Examination Section I Questions 1-30 Spend approximately 60 minutes on this part of the exam. Name: Directions: The questions or incomplete statements below are each followed by
Conditional Probability Solutions STAT-UB.0103 Statistics for Business Control and Regression Models
 Conditional Probability Solutions STAT-UB.0103 Statistics for Business Control and Regression Models Counting (Review) 1. There are 10 people in a club. How many ways are there to choose the following:
Stat 225 Week 1, 8/20/12-8/24/12, Notes: Set Theory
 Stat 225 Week 1, 8/20/12-8/24/12, Notes: Set Theory The Fall 2012 Stat 225 T.A.s September 7, 2012 The material in this handout is intended to cover general set theory topics. Information includes (but
ECLT 5810 Linear Regression and Logistic Regression for Classification. Prof. Wai Lam
 ECLT 5810 Linear Regression and Logistic Regression for Classification Prof. Wai Lam Linear Regression Models Least Squares Input vectors is an attribute / feature / predictor (independent variable) The
Objectives. 2.3 Least-squares regression. Regression lines. Prediction and Extrapolation. Correlation and r 2. Transforming relationships
 Objectives 2.3 Least-squares regression Regression lines Prediction and Extrapolation Correlation and r 2 Transforming relationships Adapted from authors slides 2012 W.H. Freeman and Company Straight Line