Czech Geological Survey Remote sensing unit
|
|
|
- Leo Lyons
- 5 years ago
- Views:
Transcription


1 Czech Geological Survey Remote sensing unit


2 CGS Remote sensing unit Who we are? Part of the Dpt. of Regional geology of crystalline complexes Since 2005 Processing of satellite and airborne data Geoinformation products related to geological, geomorphological and environmental applications Veronika Kopačková M.Sc. team coordinator Jan Mišurec M.Sc. Jan Jelének B.Sc.
")
 NIR: near infrared (0.7-1.2 μm) SWIR: short wave infrared (1.2-2.")
 Visualization of the measured intensities of reflected or emmited")

3 Remote sensing: basic principle Acquisition of information about Earth s surface without direct contact via detection of reflected or emmited electromagnetic (EM) radiation a) Reflected solar radiation ( μm) VIS: visible - ( μm) NIR: near infrared ( μm) SWIR: short wave infrared ( μm) b) Emmited thermal radiation (8-15 μm) c) Artificial radiation (RADAR) (0.8 mm 1 m) Visualization of the measured intensities of reflected or emmited radiation image data Data acquired in various wavelengths of EM radiation multispectral principle Each spectral band of the image data represents different interval of EM radiation wavelengths


4 Remote sensing: data visualization 480 nm 550 nm 650 nm 750 nm 1650 nm 2200 nm
 Wide range of RS data Landsat 4, 5 and 7 (TM and ETM+) EO-1 (ALI and Hyperion) SRTM Digital Elevation Model ASTER")
5 Sources of Remote Sensing data U.S. Geological Survey data archive Available via Earth Explorer stewardship system Required registration (free of charge) Wide range of RS data Landsat 4, 5 and 7 (TM and ETM+) EO-1 (ALI and Hyperion) SRTM Digital Elevation Model ASTER Digital Elevation Model

6 Sources of Remote Sensing data Earth Explorer: Definition of the area of interest Manually, Shapefile, KML file

7 Sources of Remote Sensing data Earth Explorer: Selection of the dataset
 Cloud coverage (%) Processing level Day/night data")
8 Sources of Remote Sensing data Earth Explorer: Additional criteria (optional) Scene position (row, path) Cloud coverage (%) Processing level Day/night data
9 Sources of Remote Sensing data Earth Explorer: Results Footprint, Quicklook, Metadata Footprint
10 Sources of Remote Sensing data Earth Explorer: Results Footprint, Quicklook, Metadata Quicklook Footprint


11 Sources of Remote Sensing data Earth Explorer: Results Metadata Footprint, Quicklook, Metadata Quicklook Footprint
 Ready for direct download 2.")
12 Sources of Remote Sensing data Earth Explorer: Data ordering 1. Already pre-processed data No shopping cart icon Data required by another user in the past Already preprocessed (Level 1G or Level 1T) Ready for direct download 2. Data waiting for pre-processing Shopping cart icon available Data have not been processed yet JPEG quicklooks available only! Pre-processing must be ordered (free of charge) Data are added into archive and prepared for download The user ordering the data preprocessing is informed by when the data are ready for download
 Level 1B UTM coordinate system ALOS/PALSAR (radar")
13 Sources of Remote Sensing data ERSDAC GDS: ASTER (multispectral data) Level 1B UTM coordinate system ALOS/PALSAR (radar data)
: Thematic Mapper (TM) sensor 6 spectral bands (3 VIS, 1 NIR, 2 SWIR, 1 TIR)")
: Ehnanced Thematic Mapper + (ETM+) sensor 8 spectral bands (3 VIS, 1NIR, 2 SWIR, 1 TIR and 1 PAN) Spectral resolution Data acquired")
14 Landsat Long-term Earth observation mission Since 1972 (MSS), 1982 (TM) Data available via Earth Explorer Data cost: free of charge Scene dimensions: 180 x 180 km Landsat 5 ( ): Thematic Mapper (TM) sensor 6 spectral bands (3 VIS, 1 NIR, 2 SWIR, 1 TIR) Spatial resolution: 30 m (VIS, NIR and SWIR), 120 m (TIR) Landsat 7 (1999-?): Ehnanced Thematic Mapper + (ETM+) sensor 8 spectral bands (3 VIS, 1NIR, 2 SWIR, 1 TIR and 1 PAN) Spectral resolution Data acquired after May 2003 are not usable due to technical failure of the ETM+ sensor
15 Landsat band TM (Landsat 5) ETM+ (Landsat 7) Use 1:VIS-B ( μm) 2:VIS-G (0.53-0,60 μm) 3: VIS-R ( μm) 4: NIR ( μm) 5: SWIR ( μm) 7: SWIR ( μm) 6: TIR ( μm) 8: PAN ( μm) 30 m 30 m Fe 2+ and Fe 3+ absorption low values for Fe bearing minerals (pyrite, hematite, goethite ); kaolinite high values; absorption of vegetation pigments low values 30 m 30 m Fe 2+ reflection X Fe 3+ absorption - ; Fe 2+ higher values than Fe 3+ minerals; kaolinite high values; high reflectivity of vegetation 30 m 30 m Fe 2+ absorption moderate values of Fe 2+ bearing minerals; absorption of chlorophyll low values for vegetation 30 m 30 m Crystal field absorption moderate values of goethitic and hematitic iron; clays high values; cellular structure reflection very high values of vegetation 30 m 30 m Highest values for most rock and soil types, high values för hdrothermally altered rocks 30 m 30 m Absorption of OH and CO 3 bearing minerals low values for clays, mica, carbonates and sulphates groups 120 m 60 m Igneous rocks, quartz and feldspars X 15 m More surface details visible due to higher spatial resolution
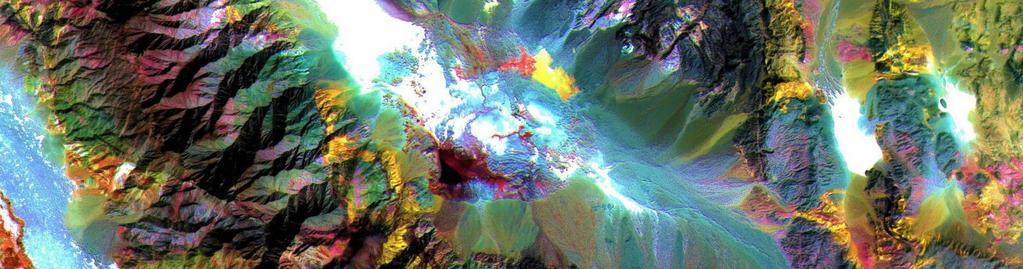
16 Landsat: band combinations RGB composites RGB: (VIS) True (natural)color RGB: (VNIR) Useful for vegetation studies RGB: Mineral composition RGB: Mineral composition Hydrothermal alterations RGB: (VIS true color)
17 Landsat: band combinations RGB composites RGB: (VIS) True (natural)color RGB: (VNIR) Useful for vegetation studies RGB: Mineral composition RGB: Mineral composition Hydrothermal alterations RGB: (VIS true color) RGB: (NIR+VIS)
18 Landsat: band combinations RGB composites RGB: (VIS) True (natural)color RGB: (VNIR) Useful for vegetation studies RGB: Mineral composition RGB: Mineral composition Hydrothermal alterations (VIS true color) RGB: (SWIR1+NIR+VIS) (NIR+VIS)
 (VIS true color) 5-4-2 (SWIR1+NIR+VIS) 4-3-2")
19 Landsat: band combinations RGB composites RGB: (VIS) True (natural)color RGB: (VNIR) Useful for vegetation studies RGB: Mineral composition RGB: Mineral composition Hydrothermal alterations RGB: (SWIR2-NIR-VIS) (VIS true color) (SWIR1+NIR+VIS) (NIR+VIS)
20 Landsat: band ratios Enhancing of the spectral contrast Removal of topographic effects and shadows 3/1: iron oxides, Fe bearing minerals (hematite, goethite, pyrite ) 5/7: intensity of hydroxyl absorption (clay minerals) 5/4: Fe 2+ detection discrimination of gossans and iron rich zones RGB: 5/7-3/1-4/3 (hydrothermal alterations) RGB: 5/7-3/1-3/5 (hydrothermal alterations, granites, migmatites, gabbros, basalts, tuffs, trachytes) RGB: 5/7-3/1-4/3 (hydrothermal alterations) RGB: 5/7-4/5-3/1 (mineral composition) RGB: 5/7-5/4-3/1 (mineral composition) RGB: 4/5-6/7-4/6 (granitoids, ignenous rocks)
21 Landsat: band ratios Enhancing of the spectral contrast Removal of topographic effects and shadows 3/1: iron oxides, Fe bearing minerals (hematite, goethite, pyrite ) 5/7: intensity of hydroxyl absorption (clay minerals) 5/4: Fe 2+ detection discrimination of gossans and iron rich zones RGB: 5/7-3/1-4/3 (hydrothermal alterations) RGB: 5/7-3/1-3/5 (hydrothermal alterations, granites, migmatites, gabbros, basalts, tuffs, trachytes) RGB: 5/7-3/1-3/5 5/7-3/1-4/3 (alterations, (hydrothermal granitesa, alterations) migmatites, tuffs, gabbros ) RGB: 5/7-4/5-3/1 (mineral composition) RGB: 5/7-5/4-3/1 (mineral composition) RGB: 4/5-6/7-4/6 (granitoids, ignenous rocks)
22 Landsat: band ratios Enhancing of the spectral contrast Removal of topographic effects and shadows 3/1: iron oxides, Fe bearing minerals (hematite, goethite, pyrite ) 5/7: intensity of hydroxyl absorption (clay minerals) 5/4: Fe2+ detection discrimination of gossans and iron rich zones RGB: 5/7-3/1-4/3 (hydrothermal alterations) RGB: 5/7-3/1-3/5 (hydrothermal alterations, granites, migmatites, gabbros, basalts, tuffs, trachytes) RGB: 5/7-4/5-3/1 (mineral composition) RGB: 5/7-5/4-3/1 (mineral composition) RGB: 4/5-6/7-4/6 (granitoids, ignenous rocks) RGB: 5/7-3/1-3/5 granitesa, migmatites, tuffs, gabbros ) 5/7-3/1-4/3 (alterations, 5/7-4/5-3/1 (hydrothermal (mineral composition) alterations)
23 Landsat: band ratios Enhancing of the spectral contrast Removal of topographic effects and shadows 3/1: iron oxides, Fe bearing minerals (hematite, goethite, pyrite ) 5/7: intensity of hydroxyl absorption (clay minerals) 5/4: Fe2+ detection discrimination of gossans and iron rich zones RGB: 5/7-3/1-4/3 (hydrothermal alterations) RGB: 5/7-3/1-3/5 (hydrothermal alterations, granites, migmatites, gabbros, basalts, tuffs, trachytes) RGB: 5/7-4/5-3/1 (mineral composition) RGB: 5/7-5/4-3/1 (mineral composition) RGB: 4/5-6/7-4/6 (granitoids, ignenous rocks) RGB: 5/7-3/1-3/5 granitesa, migmatites, tuffs, gabbros ) 5/7-3/1-4/3 (alterations, 5/7-4/5-3/1 5/7-5/4-3/1 (hydrothermal (mineral composition) alterations)
 5/7: intensity of")
 RGB: 5/7-3/1-3/5 (hydrothermal")
 RGB: 5/7-5/4-3/1 (mineral composition) RGB: 4/5-6/7-4/6 (granitoids,")

24 Landsat: band ratios Enhancing of the spectral contrast Removal of topographic effects and shadows 3/1: iron oxides, Fe bearing minerals (hematite, goethite, pyrite ) 5/7: intensity of hydroxyl absorption (clay minerals) 5/4: Fe2+ detection discrimination of gossans and iron rich zones RGB: 5/7-3/1-4/3 (hydrothermal alterations) RGB: 5/7-3/1-3/5 (hydrothermal alterations, granites, migmatites, gabbros, basalts, tuffs, trachytes) RGB: 5/7-4/5-3/1 (mineral composition) RGB: 5/7-5/4-3/1 (mineral composition) RGB: 4/5-6/7-4/6 (granitoids, ignenous rocks) 5/7-3/1-3/5 granitesa, migmatites, tuffs, gabbros ) RGB: 4/5-6/7-4/6 5/7-3/1-4/3 (alterations, 5/7-4/5-3/1 5/7-5/4-3/1 (hydrothermal (mineral (granitoids, composition) igneous alterations) rocks)
 Compression of the information from original correlated bands into few uncorrelated components E.g.: 95% of information from 6 original bands of TM/ETM+ could be compressed into 3 components that might be easily visualized RGB: PCA1-PCA2-PCA3")
25 Landsat: PCA transformation Only 3 bands can be visualized by any RGB combination information beard by other bands is invisible Spectral bands are strongly correlated Principle Component Analysis (PCA) Compression of the information from original correlated bands into few uncorrelated components E.g.: 95% of information from 6 original bands of TM/ETM+ could be compressed into 3 components that might be easily visualized RGB: PCA1-PCA2-PCA3
 6 SWIR (30 m) 5 TIR (90 m) Data acquired after April 2008 are not usable due to technical failure of the sensor (in SWIR")
26 ASTER EOS Terra satellite Operated since 2000 Data ordering via ERSDAC Data cost: 125 USD (9800 YEN) per scene Scene dimensions: 62 x 62 km 16 spectral bands 2 VIS (15 m) 2 NIR (15 m, nadir and backward looking DEM) 6 SWIR (30 m) 5 TIR (90 m) Data acquired after April 2008 are not usable due to technical failure of the sensor (in SWIR domain)

27 ASTER band range resolution 1: VIS-G μm 15 m 2: VIS-R μm 15 m 3N: NIR μm 15 m 3B: NIR μm 15 m 5: SWIR μm 30 m 6: SWIR μm 30 m 7: SWIR μm 30 m 8: SWIR μm 30 m 9: SWIR μm 30 m 10: SWIR μm 30 m 11: TIR μm 90 m 12: TIR μm 90 m 13: TIR μm 90 m 14: TIR μm 90 m 15: TIR μm 90 m
 1985 B) 1990 C)")
28 ASTER/Landsat Detection of El-Niño induced changes based on analysis of multitemporal EO data Mineral composition color scheme of Landsat TM data A) 1985 B) 1990 C) 2000/2001
 wet season B) dry")
29 ASTER Detection of El-Niño induced changes based on analysis of multitemporal EO data ASTER TIR analysis mineralogical band ratios A) wet season B) dry season
 1985 B) 1990")
30 ASTER/Landsat Detection of El-Niño induced changes based on analysis of multitemporal EO data Land cover classification of Landsat TM data A) 1985 B) 1990 C) 2000/2001

")
 4 time horizons: 1.")
 4.")
31 Temporal changes: coastal lines Landsat TM/ETM+ data available since years long time series Detection of the changes of lake coastal lines Data from the same part of the year (month) comparable conditions periodical changes of the water level (dry/wet periods) 4 time horizons: (Landsat 5 TM) (Landsat 5 TM) (Landsat 7 ETM+) /2011 (Landsat 5 TM)


32 Temporal changes: coastal lines Landsat data Classification: Water and other surfaces ENVI, ERDAS Imagine Water mask extraction: ENVI, ERDAS Imagine, ArcGIS Conversion of raster water mask to vector data ArcGIS: Raster to Polygon No polygon simplification!!!
33 Temporal changes: coastal lines Step 1: original vector data Step 1: Original vector data Original data are ragged lines follow pixels of the original raster data Step 2: Polygon simplification ArcGIS: Simplify polygon Bend simplification Simplification tolerance 90 m Step 3: Polygon smoothing Simplified polygons sharp edges ArcGIS: Smooth polygon PAEK smoothing Step 4: Final editing Final editing of incorrectly classified areas ArcGIS: Editor/Reshape feature
34 Temporal changes: coastal lines Step 2: 1: polygon original simplification vector data Step 1: Original vector data Original data are ragged lines follow pixels of the original raster data Step 2: Polygon simplification ArcGIS: Simplify polygon Bend simplification Simplification tolerance 90 m Step 3: Polygon smoothing Simplified polygons sharp edges ArcGIS: Smooth polygon PAEK smoothing Step 4: Final editing Final editing of incorrectly classified areas ArcGIS: Editor/Reshape feature
35 Temporal changes: coastal lines Step 2: 1: 3:polygon original simplification vector smoothing data Step 1: Original vector data Original data are ragged lines follow pixels of the original raster data Step 2: Polygon simplification ArcGIS: Simplify polygon Bend simplification Simplification tolerance 90 m Step 3: Polygon smoothing Simplified polygons sharp edges ArcGIS: Smooth polygon PAEK smoothing Step 4: Final editing Final editing of incorrectly classified areas ArcGIS: Editor/Reshape feature

36 Temporal changes: coastal lines Step Step 2: 1: 3:polygon original 4:final simplification editation vector smoothing data Step 1: Original vector data Original data are ragged lines follow pixels of the original raster data Step 2: Polygon simplification ArcGIS: Simplify polygon Bend simplification Simplification tolerance 90 m Step 3: Polygon smoothing Simplified polygons sharp edges ArcGIS: Smooth polygon PAEK smoothing Step 4: Final editing Final editing of incorrectly classified areas ArcGIS: Editor/Reshape feature
37 Temporal changes: coastal lines Lake Abaya (Bilate river delta) Lake Abijata
38 Temporal changes: coastal lines Lake Abaya (Bilate river delta) Lake Abijata


39 Temporal changes: coastal lines Lake Abaya (Bilate river delta) Lake Abijata
40 Temporal changes: coastal lines Lake Abaya (1987)
41 Temporal changes: coastal lines Lake Abaya (1987) (2010)
")
42 Temporal changes: coastal lines Lake Abaya (1987) (2010)
 Stereo pair image combination Spatial resolution: 30 m Complete coverage between 83 N and 83 S Many significant artifacts SRTM DEM")
43 Digital Elevation Models: ASTER vs. SRTM ASTER DEM ASTER nadir and backward looking sensors (NIR) Stereo pair image combination Spatial resolution: 30 m Complete coverage between 83 N and 83 S Many significant artifacts SRTM DEM Shuttle Radar Topographic Mission (STS-99, 2000) Radar Interferometry Spatial resolution: 30 m (US only), 90 m (other areas) Complete coverage between 60 N and 56 S Voids - corrected data available via Earth Explorer No significant arteficts
44 Digital Elevation Models: ASTER vs. SRTM ASTER DEM

45 Digital Elevation Models: ASTER vs. SRTM ASTER DEM SRTM DEM
 X suppressing topographical features paralelly oriented with the incoming light (in NW-SE direction) Multidirectional weighted shading 4 different directions of incoming light A 1")
46 Digital Elevation Models: Shaded relief Classical shading Light incoming from one direction Standard: A = 315 (NW), h = 45 Enhancing topographical features perpendicular to the incoming radiation (in SW-NE direction) X suppressing topographical features paralelly oriented with the incoming light (in NW-SE direction) Multidirectional weighted shading 4 different directions of incoming light A 1 =225, A 2 =270, A 3 =315, A 4 =360, h= 30 Weighted average of the single shadings Enhancing either sunlit and shadowed topographical features None of feature is hidden in shadow Too many shadows (some topographical features are hidden)

47 Digital Elevation Models: Shaded relief Classical shading Multidirectional weighted shading
48 Digital Elevation Models: Multidirectional shading DEM SH 225 (A=225, h=30 ) W 225 = sin 2 (aspect-(225*π/180)) SH 270 (A=270, h=30 ) W 270 = sin 2 (aspect-(270*π/180)) SH 315 (A=315, h=30 ) W 315 = sin 2 (aspect-(315*π/180)) SH 360 (A=360, h=30 ) W 360 = sin 2 (aspect-(360*π/180)) [(W 225 *SH 225 )+(W 270 *SH 270 )+(W 315 *SH 315 )+(W 360 *SH 360 )]/4
49 Digital Elevation Models: DEM products Shaded relief (hillshade)
50 Digital Elevation Models: DEM products Shaded relief Aspect (hillshade)


51 Digital Elevation Models: DEM products Shaded relief Aspect Slope(hillshade)


52 Digital Elevation Models: Morphometric analysis Slope dependant morphometric analysis Slope classification more than 25 Topographic features Peak Ridge Pass Plane Channel Pit Morphometric map: hue = topographic feature, lightness: slope

53 Digital Elevation Models: Morphometric analysis
 12.")
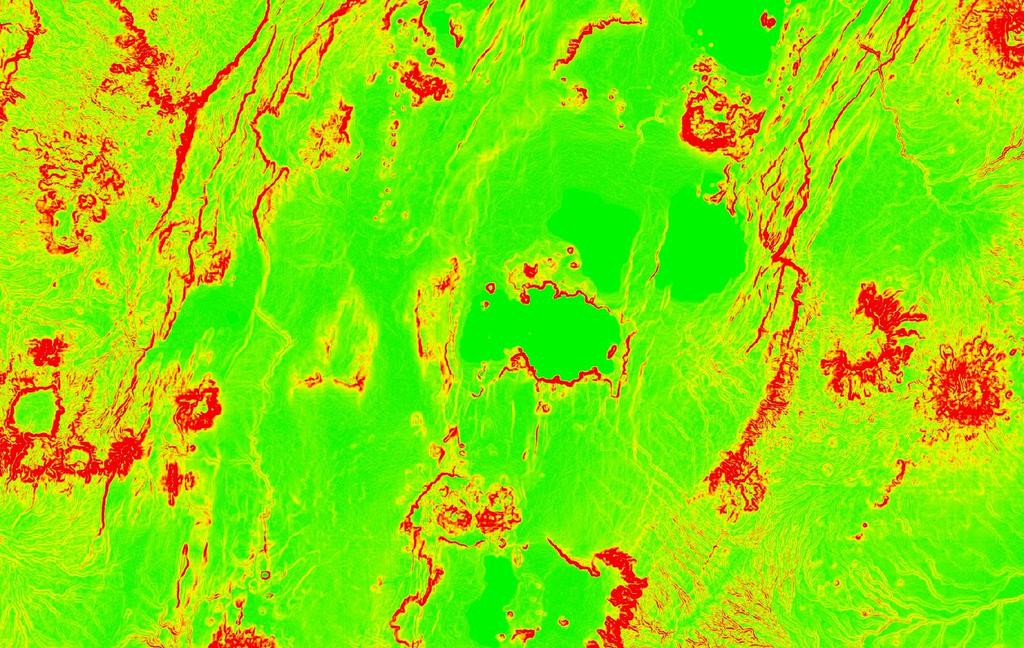
54 ALOS/PALSAR ALOS (Daichi) satellite Operated since 2006 by JAXA Data ordering via ERSDAC Data cost: 252 USD ( YEN) per scene Scene dimensions: 70 x 70 km Dual polarization (HH + HV) L-band (λ = 23 cm) 12.5 m spatial resolution Extraction and interpretation of the linear structures connected with brittle tectonics and terrain morphology Gradients of surface dielectric properties
55 ALOS/PALSAR Tectonic interpretation using ALOS/PALSAR derivatives Fracture pattern (faults and joints)
56 ALOS/PALSAR Tectonic interpretation using ALOS/PALSAR derivatives Fracture lineament pattern kernel (faults density and joints) Low High


57 ALOS/PALSAR Tectonic interpretation using ALOS/PALSAR derivatives Fracture Final lineament tectonic pattern kernel interpretation (faults density and joints) Low High
58 ALOS/PALSAR Validation: Lineament density and Symmetric Restistivity Profiling Low Lineament Kernel Density High
59 ALOS/PALSAR Validation: Lineament density and Symmetric Restistivity Profiling Low Lineament Kernel Density High
60 ALOS/PALSAR Validation: Lineament density and Symmetric Restistivity Profiling Low Lineament Kernel Density High


61 ALOS/PALSAR Validation: Lineament density and Symmetric Restistivity Profiling Low Lineament Kernel Density High

62 Thank you for your attention Czech Geological Survey Remote Sensing Unit Klárov 3 Prague Czech republic
New observations obtained via applying remote sensing methods in geological hazard assessment, Southern Ethiopia
 New observations obtained via applying remote sensing methods in geological hazard assessment, Southern Ethiopia Veronika Kopačková, Jan Mišurec Remote sensing Unit Czech Geological Survey, Klárov 3, Prague
Outcrop suitability analysis of blueschists within the Dry Lakes region of the Condrey Mountain Window, North-central Klamaths, Northern California
 Outcrop suitability analysis of blueschists within the Dry Lakes region of the Condrey Mountain Window, North-central Klamaths, Northern California (1) Introduction: This project proposes to assess the
Extraction and Integration of Mineralogical and Topographic Information Derived from ASTER and DEM Data
 Extraction and Integration of Mineralogical and Topographic Information Derived from ASTER and DEM Data Yasushi Yamaguchi, K. Kurata, R. Hirai (Nagoya Univ.) S. Noda (JOGMEC), and S. Kodama (GSJ) GRSG
Hyperspectral Data as a Tool for Mineral Exploration
 1 Hyperspectral Data as a Tool for Mineral Exploration Nahid Kavoosi, PhD candidate of remote sensing kavoosyn@yahoo.com Nahid Kavoosi Abstract In Geology a lot of minerals and rocks have characteristic
INTEGRATION OF PALSAR AND ASTER SATELLITE DATA FOR GEOLOGICAL MAPPING IN TROPICS
 INTEGRATION OF PALSAR AND ASTER SATELLITE DATA FOR GEOLOGICAL MAPPING IN TROPICS Amin Beiranvand Pour*, Mazlan Hashim Geoscience and Digital Earth Centre (Geo-DEC) Research Institute for Sustainability
Alteration zone Mapping in the Meiduk and Sar Cheshmeh Porphyry Copper Mining Districts of Iran using Advanced Land Imager (ALI) Satellite Data
 Satellite Data") Alteration zone Mapping in the Meiduk and Sar Cheshmeh Porphyry Copper Mining Districts of Iran using Advanced Land Imager (ALI) Satellite Data Amin Beiranvand Pour*, Mazlan Hashim Geoscience and Digital
Alteration zone Mapping in the Meiduk and Sar Cheshmeh Porphyry Copper Mining Districts of Iran using Advanced Land Imager (ALI) Satellite Data Amin Beiranvand Pour*, Mazlan Hashim Geoscience and Digital
Evaluating the information content of National ASTER Geoscience Maps in the Wagga Wagga and Cobar regions of New South Wales
 Evaluating the information content of National ASTER Geoscience Maps in the Wagga Wagga and Cobar regions of New South Wales The National ASTER Geoscience Maps, freely available from CSIRO/GA (https://data.csiro.au/dap/
GIS and Remote Sensing
 Spring School Land use and the vulnerability of socio-ecosystems to climate change: remote sensing and modelling techniques GIS and Remote Sensing Katerina Tzavella Project Researcher PhD candidate Technology
ADVANCED MINERAL MAPPING USING VISIBLE TO NEAR INFRARED, SHORTWAVE AND LONGWAVE INFRARED HIGH SPECTRAL RESOLUTION DATA
 ADVANCED MINERAL MAPPING USING VISIBLE TO NEAR INFRARED, SHORTWAVE AND LONGWAVE INFRARED HIGH SPECTRAL RESOLUTION DATA Veronika Kopačková, Lucie Koucká Overview Concept of our approach, QUANTOOLS into
Geological Mapping Using EO Data for Onshore O&G Exploration
 Geological Mapping Using EO Data for Onshore O&G Exploration Michael Hall ESA Oil and Gas Workshop, Frascati, Italy michael.hall@infoterra-global.com Why use EO data for Geological Mapping? Availability
INTEGRATION OF SATELLITE REMOTE SENSING DATA FOR GOLD PROSPECTING IN TROPICAL REGIONS
 INTEGRATION OF SATELLITE REMOTE SENSING DATA FOR GOLD PROSPECTING IN TROPICAL REGIONS Amin Beiranvand Pour, Mazlan Hashim Geoscience and Digital Earth Centre (Geo-DEC), Research Institute for Sustainability
Terrain and Satellite Imagery in Madre de Dios, Peru
 Rhett Butler/mongabay.com Terrain and Satellite Imagery in Madre de Dios, Peru Katherine Lininger CE 394 GIS for Water Resources Term Paper December 1, 2011 Introduction Informal and small-scale gold mining
DAMAGE DETECTION OF THE 2008 SICHUAN, CHINA EARTHQUAKE FROM ALOS OPTICAL IMAGES
 DAMAGE DETECTION OF THE 2008 SICHUAN, CHINA EARTHQUAKE FROM ALOS OPTICAL IMAGES Wen Liu, Fumio Yamazaki Department of Urban Environment Systems, Graduate School of Engineering, Chiba University, 1-33,
Applications of Remote Sensing Systems. to MINERAL DEPOSIT DISCOVERY, DEVELOPMENT
 REMS 6022: Term Project Applications of Remote Sensing Systems to MINERAL DEPOSIT DISCOVERY, DEVELOPMENT and RECLAMATION Venessa Bennett OVERVIEW Remote Sensing data extensively used in all aspects of
Digital Elevation Models (DEM) / DTM
 / DTM") Digital Elevation Models (DEM) / DTM Uses in remote sensing: queries and analysis, 3D visualisation, classification input Fogo Island, Cape Verde Republic ASTER DEM / image Banks Peninsula, Christchurch,
Digital Elevation Models (DEM) / DTM Uses in remote sensing: queries and analysis, 3D visualisation, classification input Fogo Island, Cape Verde Republic ASTER DEM / image Banks Peninsula, Christchurch,
Structural approach combining ALOS PALSAR linear feature extraction with field structural and geophysical investigations
 Structural approach combining ALOS PALSAR linear feature extraction with field structural and geophysical investigations 1 Veronika Kopačková, 1 Jan Franěk, 1 Kryštof Verner, 1 Karel Martínek, 2 Michal
Civil Engineering Journal
 Available online at www.civilejournal.org Civil Engineering Journal Vol. 1, No. 2, December, 2015 Comparative Study of Landsat and Aster Data by Morphometric Analysis Sujit Kumar a*, Tapasi Bhandary b
Satellite ASTER Global Geoscience Maps
 Satellite ASTER Global Geoscience Maps Michael Abrams Jet Propulsion Laboratory, California Institute of Technology, Pasadena USA (c) 2017 California Institute of Technology. Government sponsorship acknowledged.
Remotely sensed ore mineralization potentials in Ramand altered region, north of Iran
 American Journal of Civil Engineering 2015; 3(2-2): 18-23 Published online February 6, 2015 (http://www.sciencepublishinggroup.com/j/ajce) doi: 10.11648/j.ajce.s.2015030202.14 ISSN: 2330-8729 (Print);
Digital Elevation Models (DEM) / DTM
 / DTM") Digital Elevation Models (DEM) / DTM Uses in remote sensing: queries and analysis, 3D visualisation, layers in classification Fogo Island, Cape Verde Republic ASTER DEM / image Banks Peninsula, Christchurch,
Digital Elevation Models (DEM) / DTM Uses in remote sensing: queries and analysis, 3D visualisation, layers in classification Fogo Island, Cape Verde Republic ASTER DEM / image Banks Peninsula, Christchurch,
Urban Growth Analysis: Calculating Metrics to Quantify Urban Sprawl
 Urban Growth Analysis: Calculating Metrics to Quantify Urban Sprawl Jason Parent jason.parent@uconn.edu Academic Assistant GIS Analyst Daniel Civco Professor of Geomatics Center for Land Use Education
CHAPTER 6 HYDROTHERMAL ALTERATION ZONES MAPPING USING PRINCIPAL COMPONENT ANALYSIS AND BAND RATIO TECHNIQUES
 CHAPTER 6 HYDROTHERMAL ALTERATION ZONES MAPPING USING PRINCIPAL COMPONENT ANALYSIS AND BAND RATIO TECHNIQUES 6.1 INTRODUCTION Hydrothermal alteration zones mapping is one of the most common applications
AUTOMATIC EXTRACTION OF ALUVIAL FANS FROM ASTER L1 SATELLITE DATA AND A DIGITAL ELEVATION MODEL USING OBJECT-ORIENTED IMAGE ANALYSIS
 AUTOMATIC EXTRACTION OF ALUVIAL FANS FROM ASTER L1 SATELLITE DATA AND A DIGITAL ELEVATION MODEL USING OBJECT-ORIENTED IMAGE ANALYSIS Demetre P. Argialas, Angelos Tzotsos Laboratory of Remote Sensing, Department
ENGRG Introduction to GIS
 ENGRG 59910 Introduction to GIS Michael Piasecki March 17, 2014 Lecture 08: Terrain Analysis Outline: Terrain Analysis Earth Surface Representation Contour TIN Mass Points Digital Elevation Models Slope
Can Satellite Remote Sensing be Applied in Geological Mapping in Tropics?
 Can Satellite Remote Sensing be Applied in Geological Mapping in Tropics? Janusz Magiera 1, * 1 AGH University of Science and Technology, Faculty of Geology, Geophysics and Environmental Protection, A.
LANDSAT TM AND SRTM SATELLITE DATA FOR GEOlOGICAL MAPPING IN TR OPICAL ENVIRONMENTS: A CASE STUDY FROM PENINSULAR MALAYSIA
 LANDSAT TM AND SRTM SATELLITE DATA FOR GEOlOGICAL MAPPING IN TR OPICAL ENVIRONMENTS: A CASE STUDY FROM PENINSULAR MALAYSIA Amin Beiranvand Pour, Mazlan Hashim Geoscience and Digital Earth Centre (Geo-DEC),
Image Processing and Analysis of Mapping Alteration Zones In environmental research, East of Kurdistan, Iran
 World Applied Sciences Journal 11 (3): 278-283, 2010 ISSN 1818-4952 IDOSI Publications, 2010 Image Processing and Analysis of Mapping Alteration Zones In environmental research, East of Kurdistan, Iran
ENGRG Introduction to GIS
 ENGRG 59910 Introduction to GIS Michael Piasecki November 17, 2017 Lecture 11: Terrain Analysis Outline: Terrain Analysis Earth Surface Representation Contour TIN Mass Points Digital Elevation Models Slope
EMERGENCY PLANNING IN NORTHERN ALGERIA BASED ON REMOTE SENSING DATA IN RESPECT TO TSUNAMI HAZARD PREPAREDNESS
 EMERGENCY PLANNING IN NORTHERN ALGERIA BASED ON REMOTE SENSING DATA IN RESPECT TO TSUNAMI HAZARD PREPAREDNESS Barbara Theilen-Willige Technical University of Berlin, Institute of Applied Geosciences Department
Estimation of Wavelet Based Spatially Enhanced Evapotranspiration Using Energy Balance Approach
 Estimation of Wavelet Based Spatially Enhanced Evapotranspiration Using Energy Balance Approach Dr.Gowri 1 Dr.Thirumalaivasan 2 1 Associate Professor, Jerusalem College of Engineering, Department of Civil
GIS AS A TOOL FOR MINERAL EXPLORATION
 GIS AS A TOOL FOR MINERAL EXPLORATION By Njagi Dennis Muriithi I13/3169/2008 SGL 413: PROJECT IN GEOLOGY Course coordinators: Dr. C. M. Gichaba Dr. E. Dindi Supervisor: Dr. C. M. Gichaba OUTLINE Introduction
Land cover/land use mapping and cha Mongolian plateau using remote sens. Title. Author(s) Bagan, Hasi; Yamagata, Yoshiki. Citation Japan.
 Bagan, Hasi; Yamagata, Yoshiki. Citation Japan.") Title Land cover/land use mapping and cha Mongolian plateau using remote sens Author(s) Bagan, Hasi; Yamagata, Yoshiki International Symposium on "The Imp Citation Region Specific Systems". 6 Nove Japan.
Title Land cover/land use mapping and cha Mongolian plateau using remote sens Author(s) Bagan, Hasi; Yamagata, Yoshiki International Symposium on "The Imp Citation Region Specific Systems". 6 Nove Japan.
Fri. Apr. 14, Hewson paper: Geological Map using ASTER data Sabins Ch. 10 Oil Exploration Overview. Reading:
 Fri. Apr. 14, 2018 Hewson paper: Geological Map using ASTER data Sabins Ch. 10 Oil Exploration Overview Reading: Skim Sabins Chapter 10. Oil Exploration 1 Hewson et al. Objectives 1. 2. 3. 4. 5. 6. 7.
ERDAS ER Mapper Software
 ERDAS ER Mapper Software ER Mapper professional software is widely used in exploration industry and geologist worldwide for satellite image exploitation. It is known for its:- Powerful image processing
How to Construct Urban Three Dimensional GIS Model based on ArcView 3D Analysis
 How to Construct Urban Three Dimensional GIS Model based on ArcView 3D Analysis Ko Ko Lwin Division of Spatial Information Science Graduate School of Life and Environmental Sciences University of Tsukuba
THE UTILITY OF HYPERSPECTRAL DATA ON EXPLORATION OF SANDSTONE-HOSTED URANIUM DEPOSITS *
 THE UTILITY OF HYPERSPECTRAL DATA ON EXPLORATION OF SANDSTONE-HOSTED URANIUM DEPOSITS * Jie-lin Zhang Beijing Research Institute of Uranium Geology Key Laboratory of Remote Sensing Beijing 100029, China,
JOGMEC Remote Sensing Project -For satellite image analysis and field survey in Africa-
 0 JOGMEC Remote Sensing Project -For satellite image analysis and field survey in Africa- Takashi Ooka, General Manager, JOGMEC Geologic Remote Sensing Centre in Botswana 6 th February 2014 Mining Indaba,
Digital Elevation Models (DEM)
") Digital Elevation Models (DEM) Digital representation of the terrain surface enable 2.5 / 3D views Rule #1: they are models, not reality Rule #2: they always include some errors (subject to scale and data
Digital Elevation Models (DEM) Digital representation of the terrain surface enable 2.5 / 3D views Rule #1: they are models, not reality Rule #2: they always include some errors (subject to scale and data
Time Series Analysis with SAR & Optical Satellite Data
 Time Series Analysis with SAR & Optical Satellite Data Thomas Bahr ESRI European User Conference Thursday October 2015 harris.com Motivation Changes in land surface characteristics mirror a multitude of
Scientific registration n : 2180 Symposium n : 35 Presentation : poster MULDERS M.A.
 Scientific registration n : 2180 Symposium n : 35 Presentation : poster GIS and Remote sensing as tools to map soils in Zoundwéogo (Burkina Faso) SIG et télédétection, aides à la cartographie des sols
Change Detection Over Sokolov Open Pit Mine Areas, Czech Republic, Using Multi Temporal HyMAP Data ( )
") Change Detection Over Sokolov Open Pit Mine Areas, Czech Republic, Using Multi Temporal HyMAP Data (2009 2010) S. Adar* a G. Notesco b, A. Brook b, I. Livne b, P. Rojik c, V. Kopackova d, K. Zelenkova
Change Detection Over Sokolov Open Pit Mine Areas, Czech Republic, Using Multi Temporal HyMAP Data (2009 2010) S. Adar* a G. Notesco b, A. Brook b, I. Livne b, P. Rojik c, V. Kopackova d, K. Zelenkova
HYPERSPECTRAL IMAGING
 1 HYPERSPECTRAL IMAGING Lecture 9 Multispectral Vs. Hyperspectral 2 The term hyperspectral usually refers to an instrument whose spectral bands are constrained to the region of solar illumination, i.e.,
GEOSENSE - GEOLOGICAL MAPPING
 GEOSENSE - GEOLOGICAL MAPPING Whatever the terrain you re working in (from desert to arctic to tropical jungle), whatever the tectonic setting, Geosense has undertaken geological mapping in similar regions.
SOME APPLICATIONS OF THE REMOTE SENSING IN GEOLOGY BY USING OF ASTER IMAGES
 S E S 2 0 0 5 Scientific Conference SPACE, ECOLOGY, SAFETY with International Participation 10 13 June 2005, Varna, Bulgaria SOME APPLICATIONS OF THE REMOTE SENSING IN GEOLOGY BY USING OF ASTER IMAGES
This module presents remotely sensed assessment (choice of sensors and resolutions; airborne or ground based sensors; ground truthing)
") This module presents remotely sensed assessment (choice of sensors and resolutions; airborne or ground based sensors; ground truthing) 1 In this presentation you will be introduced to approaches for using
This module presents remotely sensed assessment (choice of sensors and resolutions; airborne or ground based sensors; ground truthing) 1 In this presentation you will be introduced to approaches for using
Monitoring Vegetation Growth of Spectrally Landsat Satellite Imagery ETM+ 7 & TM 5 for Western Region of Iraq by Using Remote Sensing Techniques.
 Monitoring Vegetation Growth of Spectrally Landsat Satellite Imagery ETM+ 7 & TM 5 for Western Region of Iraq by Using Remote Sensing Techniques. Fouad K. Mashee, Ahmed A. Zaeen & Gheidaa S. Hadi Remote
Yanbo Huang and Guy Fipps, P.E. 2. August 25, 2006
 Landsat Satellite Multi-Spectral Image Classification of Land Cover Change for GIS-Based Urbanization Analysis in Irrigation Districts: Evaluation in Low Rio Grande Valley 1 by Yanbo Huang and Guy Fipps,
Geo 327G Semester Project. Landslide Suitability Assessment of Olympic National Park, WA. Fall Shane Lewis
 Geo 327G Semester Project Landslide Suitability Assessment of Olympic National Park, WA Fall 2011 Shane Lewis 1 I. Problem Landslides cause millions of dollars of damage nationally every year, and are
S. Mahmoudishadi*, A.Malian, F. Hosseinali
 COMPARING INDEPENDENT COMPONENT ANALYSIS WITH PRINCIPLE COMPONENT ANALYSIS IN DETECTING ALTERATIONS OF PORPHYRY COPPER DEPOSIT (CASE STUDY: ARDESTAN AREA, CENTRAL IRAN) S. Mahmoudishadi*, A.Malian, F.
Geomorphologic Mapping by Airborne Laser Scanning in Southern Victoria Land
 Geomorphologic Mapping by Airborne Laser Scanning in Southern Victoria Land Bea Csatho, Terry Wilson, Tony Schenk, Garry McKenzie, Byrd Polar Research Center, The Ohio State University, Columbus, OH William
1 Oil Exploration and Production Authority, Ministry of Petroleum, Sudan 2 Faculty of Petroleum and Minerals, Al Neelain University, Khartoum, Sudan
 The Identification Of The Surface Phenomena Behind The Bad Acquired Seismic Data Through The Use Of Remote Sensing And GIS Techniques, Shelungo Area, Block-4, Muglad Basin, South Kordofan State, Sudan.
Fri. Apr. 20, Today: Review briefly Ch. 11 (Mineral Exploration) Summarize Ch Land use classification
 Summarize Ch Land use classification") Fri. Apr. 20, 2018 Today: Review briefly Ch. 11 (Mineral Exploration) Summarize Ch. 12 -- Land use classification Reading: Skim Sabins Chapter 12 -- Land Use Concept of multi-level classification important
Fri. Apr. 20, 2018 Today: Review briefly Ch. 11 (Mineral Exploration) Summarize Ch. 12 -- Land use classification Reading: Skim Sabins Chapter 12 -- Land Use Concept of multi-level classification important
Remote Sensing Techniques for Geological Mapping with special reference to ornamental stones. N.S.Gadagkar Director
 Remote Sensing Techniques for Geological Mapping with special reference to ornamental stones N.S.Gadagkar Director Remote Sensing and Aerial Surveys GSI, Bengaluru Contents of presentation I Remote sensing
PROANA A USEFUL SOFTWARE FOR TERRAIN ANALYSIS AND GEOENVIRONMENTAL APPLICATIONS STUDY CASE ON THE GEODYNAMIC EVOLUTION OF ARGOLIS PENINSULA, GREECE.
 PROANA A USEFUL SOFTWARE FOR TERRAIN ANALYSIS AND GEOENVIRONMENTAL APPLICATIONS STUDY CASE ON THE GEODYNAMIC EVOLUTION OF ARGOLIS PENINSULA, GREECE. Spyridoula Vassilopoulou * Institute of Cartography
Sediment-hosted/orogenic gold mineral systems exploration using PALSAR remote sensing data in Peninsular Malaysia
 IOP Conference Series: Earth and Environmental Science PAPER OPEN ACCESS Sediment-hosted/orogenic gold mineral systems exploration using PALSAR remote sensing data in Peninsular Malaysia To cite this article:
Positional accuracy of the drainage networks extracted from ASTER and SRTM for the Gorongosa National Park region - Comparative analysis
 Positional accuracy of the drainage networks extracted from ASTER and SRTM for the Gorongosa National Park region - Comparative analysis Tiago CARMO 1, Cidália C. FONTE 1,2 1 Departamento de Matemática,
Drought Estimation Maps by Means of Multidate Landsat Fused Images
 Remote Sensing for Science, Education, Rainer Reuter (Editor) and Natural and Cultural Heritage EARSeL, 2010 Drought Estimation Maps by Means of Multidate Landsat Fused Images Diego RENZA, Estíbaliz MARTINEZ,
Delineation of high landslide risk areas as a result of land cover, slope, and geology in San Mateo County, California
 Delineation of high landslide risk areas as a result of land cover, slope, and geology in San Mateo County, California Introduction Problem Overview This project attempts to delineate the high-risk areas
Free Geomatics Resources for Terrain Evaluation and Land Resource Assessment: a Case Study in Eastern Ghats Province of Southwestern Odisha, India
 Free Geomatics Resources for Terrain Evaluation and Land Resource Assessment: a Case Study in Eastern Ghats Province of Southwestern Odisha, India Bijay Kumar Sahu Geological Survey of India Southern Region
Mapping sub-pixel surface roughness using stereo imaging
 Mapping sub-pixel surface roughness using stereo imaging Amit Mushkin, Univ. of Washington, Geological Survey of Israel - Why look at surface roughness - Mapping unresolved roughness from space (Earth,
Fundamentals of Remote Sensing
 Division of Spatial Information Science Graduate School Life and Environment Sciences University of Tsukuba Fundamentals of Remote Sensing Prof. Dr. Yuji Murayama Surantha Dassanayake 10/6/2010 1 Fundamentals
EnvSci 360 Computer and Analytical Cartography
 EnvSci 360 Computer and Analytical Cartography Lecture 7 Mapping Images, Surfaces, and 3-D Data Brief Overview of Imagery What is Imagery? A spatial data model that defines space as an array of equally
Learning Objectives. Thermal Remote Sensing. Thermal = Emitted Infrared
 November 2014 lava flow on Kilauea (USGS Volcano Observatory) (http://hvo.wr.usgs.gov) Landsat-based thermal change of Nisyros Island (volcanic) Thermal Remote Sensing Distinguishing materials on the ground
AUTOMATISIERTE ZEITREIHENANALYSE VON FERNERKUNDUNGSDATEN FÜR DAS MONITORING VON OBERFLÄCHENGEWÄSSERN
 Place image here (10 x 3.5 ) AUTOMATISIERTE ZEITREIHENANALYSE VON FERNERKUNDUNGSDATEN FÜR DAS MONITORING VON OBERFLÄCHENGEWÄSSERN THOMAS BAHR & NICOLAI HOLZER 23. Workshop Arbeitskreis Umweltinformationssysteme
VISUALIZATION URBAN SPATIAL GROWTH OF DESERT CITIES FROM SATELLITE IMAGERY: A PRELIMINARY STUDY
 CO-439 VISUALIZATION URBAN SPATIAL GROWTH OF DESERT CITIES FROM SATELLITE IMAGERY: A PRELIMINARY STUDY YANG X. Florida State University, TALLAHASSEE, FLORIDA, UNITED STATES ABSTRACT Desert cities, particularly
ECVs: What s operational and what still requires R&D?
 Glaciers_cci input on ECVs: What s operational and what still requires R&D? Frank Paul* Department of Geography, University of Zurich *on behalf of the Glaciers_cci consortium Google Earth Operational
MOKWA (Sheet 41) 1:250,000 GEOPHYSICAL MAP SERIES AND INTERPRETATION
 1:250,000 GEOPHYSICAL MAP SERIES AND INTERPRETATION") TECHNICAL ASSISTANCE FOR THE INTERPRETATION OF AIRBORNE GEOPHYSICAL SURVEY Contract No. SMMRP/C.2.1/CON/07/02 MOKWA (Sheet 41) 1:250,000 GEOPHYSICAL MAP SERIES AND INTERPRETATION Prepared for Federal Republic
TECHNICAL ASSISTANCE FOR THE INTERPRETATION OF AIRBORNE GEOPHYSICAL SURVEY Contract No. SMMRP/C.2.1/CON/07/02 MOKWA (Sheet 41) 1:250,000 GEOPHYSICAL MAP SERIES AND INTERPRETATION Prepared for Federal Republic
Mapping small reservoirs in semi-arid regions using multitemporal SAR: methods and applications
 Mapping small reservoirs in semi-arid regions using multitemporal SAR: methods and applications Donato Amitrano Gerardo Di Martino Antonio Iodice Daniele Riccio Giuseppe Ruello University of Napoli, Italy
Remote Sensing I: Basics
 Remote Sensing I: Basics Kelly M. Brunt Earth System Science Interdisciplinary Center, University of Maryland Cryospheric Science Laboratory, Goddard Space Flight Center kelly.m.brunt@nasa.gov (Based on
9/12/2011. Training Course Remote Sensing - Basic Theory & Image Processing Methods September 2011
 Training Course Remote Sensing - Basic Theory & Image Processing Methods 19 23 September 2011 Introduction to Remote Sensing Michiel Damen (September 2011) damen@itc.nl 1 Overview Electro Magnetic (EM)
LAND COVER CATEGORY DEFINITION BY IMAGE INVARIANTS FOR AUTOMATED CLASSIFICATION
 LAND COVER CATEGORY DEFINITION BY IMAGE INVARIANTS FOR AUTOMATED CLASSIFICATION Nguyen Dinh Duong Environmental Remote Sensing Laboratory Institute of Geography Hoang Quoc Viet Rd., Cau Giay, Hanoi, Vietnam
A1 - Total Land Use by Mining and Milling topographical footprint
 A. LAND-USE A1 - Total Land Use by Mining and Milling topographical footprint Topographical Footprint: The total areal footprint (2-dimensional) used by the mine/mill is an overarching proxy for a variety
APPLICATION OF GIS AND REMOTE SENSING IN 3D MODELLING AND DETERMINATION OF MORPHOMETRIC FEATURES OF THE AGRI VOLCANO, AGRI, TURKEY
 APPLICATION OF GIS AND REMOTE SENSING IN 3D MODELLING AND DETERMINATION OF MORPHOMETRIC FEATURES OF THE AGRI VOLCANO, AGRI, TURKEY İrfan AKAR ABSTRACT Improving research methods and techniques present
GEO 874 Remote Sensing. Zihan Lin, Nafiseh Hagtalab, Ranjeet John
 GEO 874 Remote Sensing Zihan Lin, Nafiseh Hagtalab, Ranjeet John http://onlinelibrary.wiley.com/doi/10.1002/wat2.1147/full Landscape Heterogeneity S-I: homogeneous landscape using only cropland for the
EFFECT OF ANCILLARY DATA ON THE PERFORMANCE OF LAND COVER CLASSIFICATION USING A NEURAL NETWORK MODEL. Duong Dang KHOI.
 EFFECT OF ANCILLARY DATA ON THE PERFORMANCE OF LAND COVER CLASSIFICATION USING A NEURAL NETWORK MODEL Duong Dang KHOI 1 10 Feb, 2011 Presentation contents 1. Introduction 2. Methods 3. Results 4. Discussion
Many of remote sensing techniques are generic in nature and may be applied to a variety of vegetated landscapes, including
 Remote Sensing of Vegetation Many of remote sensing techniques are generic in nature and may be applied to a variety of vegetated landscapes, including 1. Agriculture 2. Forest 3. Rangeland 4. Wetland,
2013 Esri Europe, Middle East and Africa User Conference October 23-25, 2013 Munich, Germany
 2013 Esri Europe, Middle East and Africa User Conference October 23-25, 2013 Munich, Germany Environmental and Disaster Management System in the Valles Altos Region in Carabobo / NW-Venezuela Prof.Dr.habil.Barbara
Seek of Specific Soils in Puerto Rico using IKONOS
 Geological Aplication of Remote Sensing Copyright 2004 Department of Geology University of Puerto Rico, Mayagüez Seek of Specific Soils in Puerto Rico using IKONOS D. HERNÁNDEZ University of Puerto Rico
Remote sensing, GIS and groundwater exploration
 Remote sensing, GIS and groundwater exploration Geraint Burrows CEO of Groundwater Relief 4 th United Nations / Pakistan / Prince Sultan Bin Abdulaziz International Prize for Water International Conference
SPECTRAL DISCRIMINATION OF ROCK TYPES IN THE ARAVALLI MOUNTAIN RANGES OF RAJASTHAN (INDIA) USING LANDSAT THEMATIC MAPPER DATA
 USING LANDSAT THEMATIC MAPPER DATA") SPECTRAL DISCRIMINATION OF ROCK TYPES IN THE ARAVALLI MOUNTAIN RANGES OF RAJASTHAN (INDIA) USING LANDSAT THEMATIC MAPPER DATA Dr. Nilanchal Patel Reader, Department of Remote Sensing Birla Institute of
SPECTRAL DISCRIMINATION OF ROCK TYPES IN THE ARAVALLI MOUNTAIN RANGES OF RAJASTHAN (INDIA) USING LANDSAT THEMATIC MAPPER DATA Dr. Nilanchal Patel Reader, Department of Remote Sensing Birla Institute of
Assessment of Image Ratio Technique for Gold Exploration in Arid Region Using Landsat ETM+7: Limitations and Possible Source of Misinterpretations
 Assessment of Image Ratio Technique for Gold Exploration in Arid Region Using Landsat ETM+7: Limitations and Possible Source of Misinterpretations Esamaldeen Ali 1, Mohamed Y. Abdegalil 1, Abu Elhassan
EVALUATION AND MONITORING OF SNOWCOVER WATER RESOURCES IN CARPATHIAN BASINS USING GEOGRAPHIC INFORMATION AND SATELLITE DATA
 EVALUATION AND MONITORING OF SNOWCOVER WATER RESOURCES IN CARPATHIAN BASINS USING GEOGRAPHIC INFORMATION AND SATELLITE DATA Gheorghe Stancalie, Simona Catana, Anisoara Iordache National Institute of Meteorology
Spectral reflectance: When the solar radiation is incident upon the earth s surface, it is either
 Spectral reflectance: When the solar radiation is incident upon the earth s surface, it is either reflected by the surface, transmitted into the surface or absorbed and emitted by the surface. Remote sensing
AlOS-PALSAR data for Landslide Monitoring and Geological Mapping
 AlOS-PALSAR data for Landslide Monitoring and Geological Mapping Vern Singhroy, P-J Alasset, G Pavlic Canada Centre for Remote Sensing Ottawa, Canada vern.singhroy@ccrs.nrcan.gc.ca Objectives InSAR monitoring
GNR401 Principles of Satellite Image Processing
 Principles of Satellite Image Processing Instructor: Prof. CSRE, IIT Bombay bkmohan@csre.iitb.ac.in Slot 5 Guest Lecture PCT and Band Arithmetic November 07, 2012 9.30 AM 10.55 AM IIT Bombay Slide 1 November
Software requirements * : Part III: 2 hrs.
 Title: Product Type: Developer: Target audience: Format: Software requirements * : Data: Estimated time to complete: Mapping snow cover using MODIS Part I: The MODIS Instrument Part II: Normalized Difference
Application of Remote Sensing Method for Geological Interpretation of Sokoto Plain, Nigeria Aisabokhae Joseph 1 and Oresajo Bamidele 2
 Application of Remote Sensing Method for Geological Interpretation of Sokoto Plain, Nigeria Aisabokhae Joseph 1 and Oresajo Bamidele 2 1 Department of Applied Geophysics, Federal University Birnin Kebbi,
Copernicus for Raw Materials Workshop
 Copernicus for Raw Materials Workshop Copernicus 40 User Years Forum Listening Industry Workshop, to the Beat 5th September of the Earth 2016, Brussels About http://copernicus.eu/raw-materials-workshop
IDENTIFICATION OF GEOLOGIC LINEAMENTS AND GROUNDWATER FLOW SYSTEMS, USING DIGITAL ELEVATION MODELS, SATELLITE IMAGERY, AND SPRING. Miriam Rios-Sanchez
 IDENTIFICATION OF GEOLOGIC LINEAMENTS AND GROUNDWATER FLOW SYSTEMS, USING DIGITAL ELEVATION MODELS, SATELLITE IMAGERY, AND SPRING DATA IN QUITO, ECUADOR Miriam Rios-Sanchez PROBLEM STATEMENT Quito area
CHAPTER-7 INTERFEROMETRIC ANALYSIS OF SPACEBORNE ENVISAT-ASAR DATA FOR VEGETATION CLASSIFICATION
 147 CHAPTER-7 INTERFEROMETRIC ANALYSIS OF SPACEBORNE ENVISAT-ASAR DATA FOR VEGETATION CLASSIFICATION 7.1 INTRODUCTION: Interferometric synthetic aperture radar (InSAR) is a rapidly evolving SAR remote
Overview of Remote Sensing in Natural Resources Mapping
 Overview of Remote Sensing in Natural Resources Mapping What is remote sensing? Why remote sensing? Examples of remote sensing in natural resources mapping Class goals What is Remote Sensing A remote sensing
GLL THE STUDY OF METHODS FOR CORRECTING GLOBAL DIGITAL TERRAIN MODELS USING REMOTE SENSING DATA. I. Kolb, M. Lucyshyn, M. Panek
 GLL http://dx.doi.org/10.15576/gll/2013.3.59 Geomatics, Landmanagement and Landscape No. 3 2013, 59 66 THE STUDY OF METHODS FOR CORRECTING GLOBAL DIGITAL TERRAIN MODELS USING REMOTE SENSING DATA Ihor Kolb,
MAPPING LAND USE/ LAND COVER OF WEST GODAVARI DISTRICT USING NDVI TECHNIQUES AND GIS Anusha. B 1, Sridhar. P 2
 MAPPING LAND USE/ LAND COVER OF WEST GODAVARI DISTRICT USING NDVI TECHNIQUES AND GIS Anusha. B 1, Sridhar. P 2 1 M. Tech. Student, Department of Geoinformatics, SVECW, Bhimavaram, A.P, India 2 Assistant
ISO MODIS NDVI Weekly Composites for Canada South of 60 N Data Product Specification
 ISO 19131 MODIS NDVI Weekly Composites for South of 60 N Data Product Specification Revision: A Data specification: MODIS NDVI Composites for South of 60 N - Table of Contents - 1. OVERVIEW... 3 1.1. Informal
Learning Unit Student Guide. Title: Estimating Areas of Suitable Grazing Land Using GPS, GIS, and Remote Sensing
 Learning Unit Student Guide Name of Creator: Jeff Sun Institution: Casper College Email: jsun@caspercollege.edu Phone: Office (307) 268-3560 Cell (307) 277-9766 Title: Estimating Areas of Suitable Grazing
Display data in a map-like format so that geographic patterns and interrelationships are visible
 Vilmaliz Rodríguez Guzmán M.S. Student, Department of Geology University of Puerto Rico at Mayagüez Remote Sensing and Geographic Information Systems (GIS) Reference: James B. Campbell. Introduction to
Pan-Arctic Digital Elevation Model (DEM)
") Pan-Arctic Digital Elevation Model (DEM) Tazio Strozzi and Maurizio Santoro Gamma Remote Sensing, Gümligen, Switzerland Annett Bartsch et al. Institute of Photogrammetry and Remote Sensing, TU Wien, Austria
Pan-Arctic Digital Elevation Model (DEM) Tazio Strozzi and Maurizio Santoro Gamma Remote Sensing, Gümligen, Switzerland Annett Bartsch et al. Institute of Photogrammetry and Remote Sensing, TU Wien, Austria
1. Introduction. Chaithanya, V.V. 1, Binoy, B.V. 2, Vinod, T.R. 2. Publication Date: 8 April DOI: https://doi.org/ /cloud.ijarsg.
 Cloud Publications International Journal of Advanced Remote Sensing and GIS 2017, Volume 6, Issue 1, pp. 2088-2096 ISSN 2320 0243, Crossref: 10.23953/cloud.ijarsg.112 Research Article Open Access Estimation
Environmental Impact Assessment Land Use and Land Cover CISMHE 7.1 INTRODUCTION
 7 LAND USE AND LAND COVER 7.1 INTRODUCTION The knowledge of land use and land cover is important for many planning and management activities as it is considered an essential element for modeling and understanding
FUNDAMENTALS OF REMOTE SENSING FOR RISKS ASSESSMENT. 1. Introduction
 FUNDAMENTALS OF REMOTE SENSING FOR RISKS ASSESSMENT FRANÇOIS BECKER International Space University and University Louis Pasteur, Strasbourg, France; E-mail: becker@isu.isunet.edu Abstract. Remote sensing