SF House Site Suitability
|
|
|
- Bethanie Lane
- 6 years ago
- Views:
Transcription
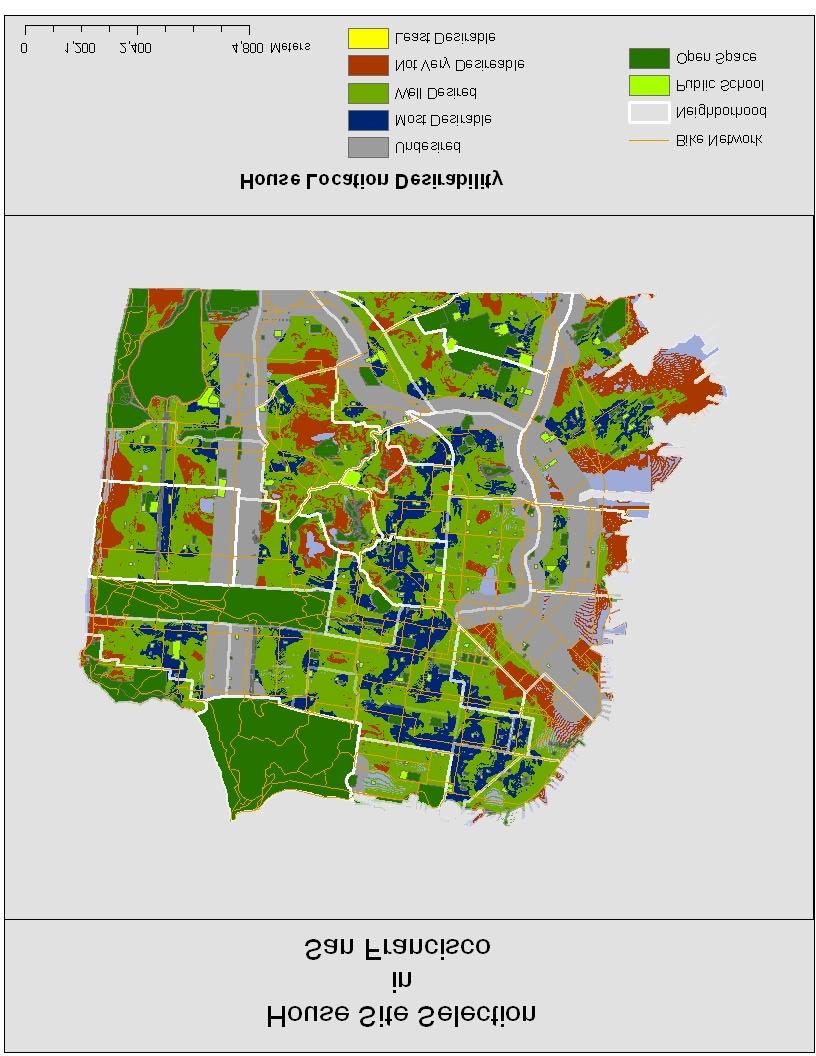
1 SF House Site Suitability Rick Waterman Geog /9/04 For my final project I chose to create a site suitability model for a house in San Francisco. Being a new resident to San Francisco, I was interested in learning about the geography of the city. After relocating from Marin County, I had a tough time figuring out which neighborhood would suit my specific needs. I thought that this would be a good exercise in GIS/Model Builder to explore my options by creating a model based on my desired criteria. Basically, I asked my self where I want to live, what I want to live close to, and what I would like to avoid. My personal criteria are based on the following; 1. I want to be close to designated open space areas yet not within them. 2. I desired excellent access to all bike routes in the city. 3. I also wanted to be a certain distance away from highways and certain roads within the city. 4. It was also important for me to live close to public school systems for my 3 children of various ages. 5. Being aware of the possibility for tsunami from regional tectonic activity, I opted for a location at certain elevations. 6. I also desired a house location within a certain degree of slope for the fact that I want to bike home and get a reasonable amount of exercise yet not kill my self on the hills. Method: I created four separate models; buffer model, slope model, mosaic dem model and a proximity favoring model. I later combined these models to create my final one called SF House Selection Model. I created a toolbox in my tool boxes in arc toolbox. There I created my models. I then set my model properties, (environmental and raster), to the proper specifications.
2 First Model: Mosaic DEM I used six USGS 10 meter DEM s (see references) to create a base map with proper coverage for the city of San Francisco. I used the DEM to raster tool in the conversion tool box. Next I used Data management>> Raster>> mosaic to combine my new rasters into a seamless base map, which will be important for future calculations of slope and elevation. From here I used spatial analyst>reclass>>reclassify to manually classify my elevation into 6 standard elevation classes to more easily work with in the future building process of my model. Second Model: Slope Model Using spatial analyst>>surface>> slope and imputing my mosaic raster I chose the Degree of slope option. Next I used spatial analyst>>reclass>>reclassify my slope output raster. I again used the reclassify to create 5 classes from 0 degrees of slope to the maximum 84 degrees. Third Model: Buffer Model Here I used the analysis>> Proximity>> buffer to create 3 buffer around various shape files (openspace, freeways, and streets). I used a parameter on each of the shapefiles to give flexibility for future running of my model. Next, I isolated my 1 road that I did not want o live close to. I did a query using the street name (19 th Ave) before running my buffer on my street shape. Then using the analysis>>overlay >>union tool I combined the three buffer shapes together creating my union buffer shape. Using conversion tools>>to raster>>feature to raster I created a new raster buffer union raster. Then using spatial analyst tools>>math>>logical>>boolean not tool I made the buffered areas true and the non buffer areas false creating my final Bufferzone raster.
3 Fourth Model: Proximity favoring model To make certain I was within certain distances to specific locations in this case, all open space, all bike routes and all public schools. I first needed to convert my 3 selected shape files into rasters. I did this using conversion tools>>to raster>>feature to raster From here I used Spatial analyst>>distance>>euclidean distance to specify a maximum distance allowable from these desired locations. After running these Euclidean distance tools then I combined them using two spatial anylist>>math>>plus tools creating Euclidean distance all. I then reclassified them using the reclassify tool into 5 classes. Combined Model: SF House Location Model Using the spatial analysis>>overlay>>weighted overlay tool I imputed all my final rasters. 1. For my reclassed buffer I set false data to restricted and changed my true data class to one. I set the influence at 10%. 2. For my reclass proximity favor model I kept the default 5 classes assigning a 40% influence. 3. Re classified slope raster was classed to reflect my desired preferences for living at certain degrees of slope then setting the influence at 30%. 4. I the reclassed the mosaic DEM raster to similar classes based on the elevation preferable to my living condition parameters. I set this input to a 25% influence. I named my final raster as run10 because I had 9 run previous at different weighted influences. I used this final version for my map. Evaluation:
4 I was very happy with the result of my map. It clearly showed the classes of desirability that fit my specific criteria. When I overlaid the bike, openspace, schools and neighborhood shapefiles over my final map the analysis proved to coincide very nicely to those features as was specified by my weighted overlay analysis. The map also well reflects the desired slope and elevation reclassed rasters. The most desirable locations were in perfect distances from all of my criteria and my overlay of neighborhood shapes gave me a good guide for my future house hunting in San Francisco. References:
5
6
GIS IN ECOLOGY: ANALYZING RASTER DATA
 GIS IN ECOLOGY: ANALYZING RASTER DATA Contents Introduction... 2 Raster Tools and Functionality... 2 Data Sources... 3 Tasks... 4 Getting Started... 4 Creating Raster Data... 5 Statistics... 8 Surface
Lesson 9 and 10: Final Project. by Diana Jo Lau
 Lesson 9 and 10: Final Project by Diana Jo Lau Introduction Acme Conservation Unlimited conducted a site selection analysis of conservation areas meeting specific criteria. The results of our analysis
High Speed / Commuter Rail Suitability Analysis For Central And Southern Arizona
 High Speed / Commuter Rail Suitability Analysis For Central And Southern Arizona Item Type Reports (Electronic) Authors Deveney, Matthew R. Publisher The University of Arizona. Rights Copyright is held
SIE 509 Principles of GIS Exercise 5 An Introduction to Spatial Analysis
 SIE 509 Principles of GIS Exercise 5 An Introduction to Spatial Analysis Due: Oct. 31, 2017 Total Points: 50 Introduction: The Governor of Maine is asking communities to look at regionalization for major
Suitability Analysis on Second Home Areas Selection in Smithers British Columbia
 GEOG 613 Term Project Suitability Analysis on Second Home Areas Selection in Smithers British Columbia Zhengzhe He November 2005 Abstract Introduction / background Data Source Data Manipulation Spatial
+ = Spatial Analysis of Raster Data. 2 =Fault in shale 3 = Fault in limestone 4 = no Fault, shale 5 = no Fault, limestone. 2 = fault 4 = no fault
 Spatial Analysis of Raster Data 0 0 1 1 0 0 1 1 1 0 1 1 1 1 1 1 2 4 4 4 2 4 4 2 4 4 4 2 4 4 2 4 4 3 4 4 4 2 3 + = 0 = shale 1 = limestone 2 = fault 4 = no fault 2 =Fault in shale 3 = Fault in limestone
Watershed Delineation
 Watershed Delineation Jessica L. Watkins, University of Georgia 2 April 2009 Updated by KC Love February 25, 2011 PURPOSE For this project, I delineated watersheds for the Coweeta synoptic sampling area
Working with Digital Elevation Models in ArcGIS 8.3
 Working with Digital Elevation Models in ArcGIS 8.3 The homework that you need to turn in is found at the end of this document. This lab continues your introduction to using the Spatial Analyst Extension
Spatial Analysis of Raster Data
 Spatial Analysis of Raster Data 0 0 1 1 0 0 1 1 1 0 1 1 1 1 1 1 2 4 4 4 2 4 5 5 4 2 4 4 4 2 5 5 4 4 2 4 5 4 3 5 4 4 4 2 5 5 5 3 + = 0 = shale 1 = limestone 2 = fault 4 = no fault 2 =Fault in shale 3 =
GIS IN ECOLOGY: ANALYZING RASTER DATA
 GIS IN ECOLOGY: ANALYZING RASTER DATA Contents Introduction... 2 Tools and Functionality for Raster Data... 2 Data Sources... 3 Tasks... 4 Getting Started... 4 Creating Raster Data... 5 Summary Statistics...
Chapter 6. Fundamentals of GIS-Based Data Analysis for Decision Support. Table 6.1. Spatial Data Transformations by Geospatial Data Types
 Chapter 6 Fundamentals of GIS-Based Data Analysis for Decision Support FROM: Points Lines Polygons Fields Table 6.1. Spatial Data Transformations by Geospatial Data Types TO: Points Lines Polygons Fields
Tutorial 8 Raster Data Analysis
 Objectives Tutorial 8 Raster Data Analysis This tutorial is designed to introduce you to a basic set of raster-based analyses including: 1. Displaying Digital Elevation Model (DEM) 2. Slope calculations
Southern California Earthquake Center
 Southern California Earthquake Center By: Mark Slothower Geog 406 Final Report Dr. Sun Table of Contents Introduction Page 3 Hypothesis and research questions Page 3 Methods and flowchart Page 4 Data Page
GIS Semester Project Working With Water Well Data in Irion County, Texas
 GIS Semester Project Working With Water Well Data in Irion County, Texas Grant Hawkins Question for the Project Upon picking a random point in Irion county, Texas, to what depth would I have to drill a
Spatial Analyst: Multiple Criteria Evaluation Material adapted from FOR 4114 developed by Forestry Associate Professor Steve Prisley
 Spatial Analyst: Multiple Criteria Evaluation Material adapted from FOR 4114 developed by Forestry Associate Professor Steve Prisley Section 1: Data In this exercise we will be working with several types
Exercise 2: Working with Vector Data in ArcGIS 9.3
 Exercise 2: Working with Vector Data in ArcGIS 9.3 There are several tools in ArcGIS 9.3 used for GIS operations on vector data. In this exercise we will use: Analysis Tools in ArcToolbox Overlay Analysis
A METHOD FOR PREDICTING NETWORK DISTANCE USING NETWORK SHORTEST DISTANCE AND SPATIAL INTERPOLATION
 A METHOD FOR PREDICTING NETWORK DISTANCE USING NETWORK SHORTEST DISTANCE AND SPATIAL INTERPOLATION Abdulnaser Arafat Ph.D. Student Urban and Regional Planning Supervisors: Professor Ruth Steiner Professor
Handling Raster Data for Hydrologic Applications
 Handling Raster Data for Hydrologic Applications Prepared by Venkatesh Merwade Lyles School of Civil Engineering, Purdue University vmerwade@purdue.edu January 2018 Objective The objective of this exercise
Location Suitability Analysis
 2010 Fall 406 Final Project Location Suitability Analysis New Burger stores in San Fernando Valley Presenter: Rich Lee I. Introduction In-N-Out Burger is famous in South West America. Established in 1948
GEOG4017 Geographical Information Systems Lab 8 Spatial Analysis and Digital Terrain Modeling
 DEPARTMENT OF GEOGRAPHY HONG KONG BAPTIST UNIVERSITY Prof. Q. Zhou GEOG4017 Geographical Information Systems Lab 8 Spatial Analysis and Digital Terrain Modeling Objectives The exercise is designed to familiarize
In this exercise we will learn how to use the analysis tools in ArcGIS with vector and raster data to further examine potential building sites.
 GIS Level 2 In the Introduction to GIS workshop we filtered data and visually examined it to determine where to potentially build a new mixed use facility. In order to get a low interest loan, the building
Identifying Wildfire Risk Areas in Western Washington State
 Identifying Wildfire Risk Areas in Western Washington State Matthew Seto University of Washington Tacoma GIS Certification Program URISA 2015 Undergraduate Geospatial Skills Competition Introduction 2014
Spatio-temporal models
 Spatio-temporal models Involve a least a three dimensional representation of one or more key attribute variation in planar (X-Y) space and through time. (a 4 th dimension could also be use, like Z for
MERGING (MERGE / MOSAIC) GEOSPATIAL DATA
 GEOSPATIAL DATA") This help guide describes how to merge two or more feature classes (vector) or rasters into one single feature class or raster dataset. The Merge Tool The Merge Tool combines input features from input
This help guide describes how to merge two or more feature classes (vector) or rasters into one single feature class or raster dataset. The Merge Tool The Merge Tool combines input features from input
The Looming Threat of Rising Sea Levels to the Florida Keys
 The Looming Threat of Rising Sea Levels to the Florida Keys 1. Introduction Sea levels are rising, and possibly faster than we thought before. In a recent report in 2017 by the National Oceanic and Atmospheric
How to Model Stream Temperature Using ArcMap
 How to Model Stream Temperature Using ArcMap Take note: Assumption before proceeding: A temperature point file has been attributed with TauDEM variables. There are three processes described in this document.
Volcanic Hazard Assessment of Southern Iceland Helper, GIS 327G
 Raeann Garcia 05/03/2018 Volcanic Hazard Assessment of Southern Iceland Helper, GIS 327G Introduction: Iceland is an island nation far in the northern hemisphere, with a portion of the country included
Exercise 2: Working with Vector Data in ArcGIS 9.3
 Exercise 2: Working with Vector Data in ArcGIS 9.3 There are several tools in ArcGIS 9.3 used for GIS operations on vector data. In this exercise we will use: Analysis Tools in ArcToolbox Overlay Analysis
Creating Watersheds from a DEM
 Creating Watersheds from a DEM These instructions enable you to create watersheds of specified area using a good quality Digital Elevation Model (DEM) in ArcGIS 8.1. The modeling is performed in ArcMap
SRJC Applied Technology 54A Introduction to GIS
 SRJC Applied Technology 54A Introduction to GIS Overview Lecture of Geographic Information Systems Fall 2004 Santa Rosa Junior College Presented By: Tim Pudoff, GIS Coordinator, County of Sonoma, Information
Introduction To Raster Based GIS Dr. Zhang GISC 1421 Fall 2016, 10/19
 Introduction To Raster Based GIS Dr. Zhang GISC 1421 Fall 2016, 10/19 Model of the course Using and making maps Navigating GIS maps Map design Working with spatial data Geoprocessing Spatial data infrastructure
Outcrop suitability analysis of blueschists within the Dry Lakes region of the Condrey Mountain Window, North-central Klamaths, Northern California
 Outcrop suitability analysis of blueschists within the Dry Lakes region of the Condrey Mountain Window, North-central Klamaths, Northern California (1) Introduction: This project proposes to assess the
Outline. Chapter 1. A history of products. What is ArcGIS? What is GIS? Some GIS applications Introducing the ArcGIS products How does GIS work?
 Outline Chapter 1 Introducing ArcGIS What is GIS? Some GIS applications Introducing the ArcGIS products How does GIS work? Basic data formats The ArcCatalog interface 1-1 1-2 A history of products Arc/Info
BROOKINGS May
 Appendix 1. Technical Methodology This study combines detailed data on transit systems, demographics, and employment to determine the accessibility of jobs via transit within and across the country s 100
Raster Analysis: An Example
 Raster Analysis: An Example Fires (1 or 4) Slope (1-4) + Geology (1-4) Erosion Ranking (3-12) 1 Typical Raster Model Types: Suitability Modeling: Where is optimum location? Distance Modeling: What is the
Course overview. Grading and Evaluation. Final project. Where and When? Welcome to REM402 Applied Spatial Analysis in Natural Resources.
 Welcome to REM402 Applied Spatial Analysis in Natural Resources Eva Strand, University of Idaho Map of the Pacific Northwest from http://www.or.blm.gov/gis/ Where and When? Lectures Monday & Wednesday
Acknowledgments xiii Preface xv. GIS Tutorial 1 Introducing GIS and health applications 1. What is GIS? 2
 Acknowledgments xiii Preface xv GIS Tutorial 1 Introducing GIS and health applications 1 What is GIS? 2 Spatial data 2 Digital map infrastructure 4 Unique capabilities of GIS 5 Installing ArcView and the
A GIS-based Approach to Watershed Analysis in Texas Author: Allison Guettner
 Texas A&M University Zachry Department of Civil Engineering CVEN 658 Civil Engineering Applications of GIS Instructor: Dr. Francisco Olivera A GIS-based Approach to Watershed Analysis in Texas Author:
COMMON GIS TECHNIQUES FOR VECTOR AND RASTER DATA PROCESSING. Ophelia Wang, Department of Geography and the Environment, University of Texas
 COMMON GIS TECHNIQUES FOR VECTOR AND RASTER DATA PROCESSING Ophelia Wang, Department of Geography and the Environment, University of Texas PART I: BASIC VECTOR TOOLS CLIP A FEATURE BASED ON THE EXTENT
The Northwest Environmental Training Center presents:
 The Northwest Environmental Training Center presents: Introduction to ArcGIS 9 for Fisheries and Wildlife Biology Applications Course ID: GIS - 400 October 1-3, 2008, 8:30 A.M. to 5 P.M. **Venue Change**
Raster Analysis; A Yellowstone Example 3/29/2018
 Fires (1 or 4) Typical Raster Model Types: Raster Analysis: An Example Suitability Modeling: Where is optimum location? Distance Modeling: What is the most efficient path from A to B? + Slope (1-4) Geology
Raster Analysis; A Yellowstone Example 10/24/2013. M. Helper GEO327G/386G, UT Austin 2. M. Helper GEO327G/386G, UT Austin 4
 + Fires (1 or 4) Slope (1-4) Geology (1-4) Erosion Ranking (3-12) Raster Analysis: An Example Typical Raster Model Types: Suitability Modeling: Where is optimum location? Distance Modeling: What is the
Effects of sea level rise on shallow atolls in the South Pacific
 Tuvalu 2100 Effects of sea level rise on shallow atolls in the South Pacific Kristin Vollmann GEO 327GG December 3, 20100 INTRODUCTION Residents of the tiny island nation of Tuvalu, withh a maximumm elevation
Python Raster Analysis. Kevin M. Johnston Nawajish Noman
 Python Raster Analysis Kevin M. Johnston Nawajish Noman Outline Managing rasters and performing analysis with Map Algebra How to access the analysis capability - Demonstration Complex expressions and optimization
Neighborhood Locations and Amenities
 University of Maryland School of Architecture, Planning and Preservation Fall, 2014 Neighborhood Locations and Amenities Authors: Cole Greene Jacob Johnson Maha Tariq Under the Supervision of: Dr. Chao
Raster Analysis: An Example
 Raster Analysis: An Example Fires (1 or 4) Slope (1-4) + Geology (1-4) Erosion Ranking (3-12) 11/8/2016 GEO327G/386G, UT Austin 1 Typical Raster Model Types: Suitability Modeling: Where is optimum location?
Archaeological Predictive Modeling within the context of Paleo-river Terraces in the City of Prince George
 Archaeological Predictive Modeling within the context of Paleo-river Terraces in the City of Prince George Background The documented pre-contact archaeological record of the Interior Plateau of B.C. is
Natalie Cabrera GSP 370 Assignment 5.5 March 1, 2018
 Network Analysis: Modeling Overland Paths Using a Least-cost Path Model to Track Migrations of the Wolpertinger of Bavarian Folklore in Redwood National Park, Northern California Natalie Cabrera GSP 370
Introduction to GIS I
 Introduction to GIS Introduction How to answer geographical questions such as follows: What is the population of a particular city? What are the characteristics of the soils in a particular land parcel?
Exercise 6: Working with Raster Data in ArcGIS 9.3
 Exercise 6: Working with Raster Data in ArcGIS 9.3 Why Spatial Analyst? Grid query Grid algebra Grid statistics Summary by zone Proximity mapping Reclassification Histograms Surface analysis Slope, aspect,
Lab 7: Cell, Neighborhood, and Zonal Statistics
 Lab 7: Cell, Neighborhood, and Zonal Statistics Exercise 1: Use the Cell Statistics function to detect change In this exercise, you will use the Spatial Analyst Cell Statistics function to compare the
Volcanic Hazards of Mt Shasta
 Volcanic Hazards of Mt Shasta Introduction Mt Shasta is a volcano in the northern part of California. Although it has been recently inactive for over 10,000 years. However, its eruption would cause damage
Spatial Analyst. By Sumita Rai
 ArcGIS Extentions Spatial Analyst By Sumita Rai Overview What does GIS do? How does GIS work data models Extension to GIS Spatial Analyst Spatial Analyst Tasks & Tools Surface Analysis Surface Creation
Abstract: Contents. Literature review. 2 Methodology.. 2 Applications, results and discussion.. 2 Conclusions 12. Introduction
 Abstract: Landfill is one of the primary methods for municipal solid waste disposal. In order to reduce the environmental damage and to protect the public health and welfare, choosing the site for landfill
BASIC SPATIAL ANALYSIS TOOLS IN A GIS. data set queries basic statistics buffering overlay reclassification
 BASIC SPATIAL ANALYSIS TOOLS IN A GIS data set queries basic statistics buffering overlay reclassification GIS ANALYSIS TOOLS GIS ANALYSIS TOOLS Database tools: query and summarize (similar to spreadsheet
GeoWEPP Tutorial Appendix
 GeoWEPP Tutorial Appendix Chris S. Renschler University at Buffalo - The State University of New York Department of Geography, 116 Wilkeson Quad Buffalo, New York 14261, USA Prepared for use at the WEPP/GeoWEPP
Transit Time Shed Analyzing Accessibility to Employment and Services
 Transit Time Shed Analyzing Accessibility to Employment and Services presented by Ammar Naji, Liz Thompson and Abdulnaser Arafat Shimberg Center for Housing Studies at the University of Florida www.shimberg.ufl.edu
Display data in a map-like format so that geographic patterns and interrelationships are visible
 Vilmaliz Rodríguez Guzmán M.S. Student, Department of Geology University of Puerto Rico at Mayagüez Remote Sensing and Geographic Information Systems (GIS) Reference: James B. Campbell. Introduction to
Exercise 4 Estimating the effects of sea level rise on coastlines by reclassification
 Exercise 4 Estimating the effects of sea level rise on coastlines by reclassification Due: Thursday February 1; at the start of class Goal: Get familiar with symbolizing and making time-series maps of
Midterm Exam : Answer
 Midterm Exam : Answer Create a double-spaced document with answers to the questions below. File Name: LASTNAME_Midterm.pdf Make sure to include your Name, UWNetID, course number, quarter and year, and
Locating Abandoned Mines Using Processed Lidar Data
 Locating Abandoned Mines Using Processed Lidar Data An Exercise in Extracting Determined Value Sets Using Known Data Locations. Geog593 Christopher Rowlette Wayne Coffey Intended Purpose of Analysis Currently
Spatial multicriteria analysis for home buyers
 Spatial multicriteria analysis for home buyers Xavier Albacete University of Eastern Finland, Department of Environmental Science, Research Group of Environmental Informatics, Yliopistoranta 1 E, P.O.
Data Structures & Database Queries in GIS
 Data Structures & Database Queries in GIS Objective In this lab we will show you how to use ArcGIS for analysis of digital elevation models (DEM s), in relationship to Rocky Mountain bighorn sheep (Ovis
DP Project Development Pvt. Ltd.
 Dear Sir/Madam, Greetings!!! Thanks for contacting DP Project Development for your training requirement. DP Project Development is leading professional training provider in GIS technologies and GIS application
Delineation of high landslide risk areas as a result of land cover, slope, and geology in San Mateo County, California
 Delineation of high landslide risk areas as a result of land cover, slope, and geology in San Mateo County, California Introduction Problem Overview This project attempts to delineate the high-risk areas
Basics of GIS. by Basudeb Bhatta. Computer Aided Design Centre Department of Computer Science and Engineering Jadavpur University
 Basics of GIS by Basudeb Bhatta Computer Aided Design Centre Department of Computer Science and Engineering Jadavpur University e-governance Training Programme Conducted by National Institute of Electronics
NR402 GIS Applications in Natural Resources
 NR402 GIS Applications in Natural Resources Lesson 1 Introduction to GIS Eva Strand, University of Idaho Map of the Pacific Northwest from http://www.or.blm.gov/gis/ Welcome to NR402 GIS Applications in
SPATIAL MODELING GIS Analysis Winter 2016
 SPATIAL MODELING GIS Analysis Winter 2016 Spatial Models Spatial Modeling attempts to represent how the world works All models are wrong, but some are useful (G.E. Box, quoted in course textbook pg. 379)
ARCGIS PRO COURSE, APPLIED TO ENVIROMENTAL MANAGEMENT GIS. Course. Training. .com
 ARC PRO COURSE, APPLIED TO ENVIROMENTAL MANAGEMENT TYC Training Course.com TRAINING OVERVIEW This Arc Pro online course will provide a great deal of information about the link between earth s ecosystems
Spatial Analysis using Vector GIS THE GOAL: PREPARATION:
 PLAN 512 GIS FOR PLANNERS Department of Urban and Environmental Planning University of Virginia Fall 2006 Prof. David L. Phillips Spatial Analysis using Vector GIS THE GOAL: This tutorial explores some
Hennepin GIS. Tree Planting Priority Areas - Analysis Methodology. GIS Services April 2018 GOAL:
 Hennepin GIS GIS Services April 2018 Tree Planting Priority Areas - Analysis Methodology GOAL: To create a GIS data layer that will aid Hennepin County Environment & Energy staff in determining where to
Laboratory Exercise - Temple-View Least- Cost Mountain Bike Trail
 Brigham Young University BYU ScholarsArchive Engineering Applications of GIS - Laboratory Exercises Civil and Environmental Engineering 2017 Laboratory Exercise - Temple-View Least- Cost Mountain Bike
Exercise 6: Using Burn Severity Data to Model Erosion Risk
 Exercise 6: Using Burn Severity Data to Model Erosion Risk Document Updated: November 2009 Software Versions: ERDAS Imagine 9.3 and ArcGIS 9.3, Microsoft Office 2007 Introduction A common use of burn severity
Using the Stock Hydrology Tools in ArcGIS
 Using the Stock Hydrology Tools in ArcGIS This lab exercise contains a homework assignment, detailed at the bottom, which is due Wednesday, October 6th. Several hydrology tools are part of the basic ArcGIS
Hydrology and Watershed Analysis
 Hydrology and Watershed Analysis Manual By: Elyse Maurer Reference Map Figure 1. This map provides context to the area of Washington State that is being focused on. The red outline indicates the boundary
Praveen Subramani December 7, 2008 Athena: praveens Final Project: Placing a New Upscale Restaurant in Suffolk County, MA
 11.188 Final Project: Placing a New Upscale Restaurant in Suffolk County, MA Abstract According to an August 2008 New York Times article, over 60% of new restaurants, delis, and food shops close within
Fire Susceptibility Analysis Carson National Forest New Mexico. Can a geographic information system (GIS) be used to analyze the susceptibility of
 be used to analyze the susceptibility of") 1 David Werth Fire Susceptibility Analysis Carson National Forest New Mexico Can a geographic information system (GIS) be used to analyze the susceptibility of Carson National Forest, New Mexico to forest
1 David Werth Fire Susceptibility Analysis Carson National Forest New Mexico Can a geographic information system (GIS) be used to analyze the susceptibility of Carson National Forest, New Mexico to forest
Introduction-Overview. Why use a GIS? What can a GIS do? Spatial (coordinate) data model Relational (tabular) data model
 data model Relational (tabular) data model") Introduction-Overview Why use a GIS? What can a GIS do? How does a GIS work? GIS definitions Spatial (coordinate) data model Relational (tabular) data model intro_gis.ppt 1 Why use a GIS? An extension
Introduction-Overview Why use a GIS? What can a GIS do? How does a GIS work? GIS definitions Spatial (coordinate) data model Relational (tabular) data model intro_gis.ppt 1 Why use a GIS? An extension
Exercise 3: GIS data on the World Wide Web
 Exercise 3: GIS data on the World Wide Web These web sites are a few examples of sites that are serving free GIS data. Many other sites exist. Search in Google or other search engine to find GIS data for
Trouble-Shooting Coordinate System Problems
 Trouble-Shooting Coordinate System Problems Written by Barbara M. Parmenter, revised 2/25/2014 OVERVIEW OF THE EXERCISE... 1 COPYING THE MAP PROJECTION EXERCISE FOLDER TO YOUR H: DRIVE OR DESKTOP... 2
Introduction. Project Summary In 2014 multiple local Otsego county agencies, Otsego County Soil and Water
 Introduction Project Summary In 2014 multiple local Otsego county agencies, Otsego County Soil and Water Conservation District (SWCD), the Otsego County Planning Department (OPD), and the Otsego County
LANDSLIDE HAZARD ANALYSIS AND ITS EFFECT ON ENDANGERED SPECIES HABITATS, GRAND COUNTY, UTAH
 12/5/2016 LANDSLIDE HAZARD ANALYSIS AND ITS EFFECT ON ENDANGERED SPECIES HABITATS, GRAND COUNTY, UTAH GIS Final Project Ashlyn Murphy Fall 2016 1. Introduction and Problem A well-known geologic hazard
Final GIS Project Paper
 Final GIS Project Paper Libby Mahaffy Spring 2010 Overview of the project For the final project in GIS I plan to do a site suitability analysis for the development of ecovillages in Marquette County, an
Estimating Probability of Success Rate
 Estimating Probability of Success Rate Don Ferguson, PhD A member of Appalachian Search and Rescue Conference Objective Provide SAR planners with a tool to help optimize effort allocation based on a number
Using GIS to Detect Changes in Land Use Land Cover for Electrical Transmission Line Sitting and Expansion Planning in Winona County, Minnesota, USA
 Using GIS to Detect Changes in Use Cover for Electrical Transmission Line Sitting and Expansion Planning in Winona County, Minnesota, USA Charles U. Uzoukwu Department of Resource Analysis, Saint Mary
Determining the Location of the Simav Fault
 Lindsey German May 3, 2012 Determining the Location of the Simav Fault 1. Introduction and Problem Formulation: The issue I will be focusing on involves interpreting the location of the Simav fault in
Using ArcGIS for Hydrology and Watershed Analysis:
 Using ArcGIS 10.2.2 for Hydrology and Watershed Analysis: A guide for running hydrologic analysis using elevation and a suite of ArcGIS tools Anna Nakae Feb. 10, 2015 Introduction Hydrology and watershed
Outline Anatomy of ArcGIS Metadata Data Types Vector Raster Conversion Adding Data Navigation Symbolization Methods Layer Files Editing Help Files
 UPlan Training Lab Exercise: Introduction to ArcGIS Outline Anatomy of ArcGIS Metadata Data Types Vector Raster Conversion Adding Data Navigation Symbolization Methods Layer Files Editing Help Files Anatomy
Calhoun County, Texas Under 5 Meter Sea Level Rise
 Kyle Kacal GEO 327G Calhoun County, Texas Under 5 Meter Sea Level Rise PROBLEM AND PURPOSE: Sea level rise is threat to all coastal areas. Although natural sea level rise happens at a very slow rate, hurricanes
Week 7 Last week: This week s topics. GIS and Forest Engineering Applications. FE 257. GIS and Forest Engineering Applications.
 FE 257. GIS and Forest Engineering Applications Week 7 Week 7 Last week: Spatial Projections Questions? Next week- read: Chapter 10: Updating GIS Databases Chapter 12: Synthesis of Techniques Applied to
LAB EXERCISE #2 Quantifying Patch Mosaics
 LAB EXERCISE #2 Quantifying Patch Mosaics Instructors: K. McGarigal Overview: In this exercise, you will learn to appreciate the challenges of quantifying patch mosaics and gain practical hands-on experience
Geographic Systems and Analysis
 Geographic Systems and Analysis New York University Robert F. Wagner Graduate School of Public Service Instructor Stephanie Rosoff Contact: stephanie.rosoff@nyu.edu Office hours: Mondays by appointment
Spatial Analysis in Your Browser
 Spatial Analysis in Your Browser Joseph Kerski Education Manager Esri jkerski@esri.com http://www.youtube.com/geographyuberalles Twitter http://twitter.com/josephkerski 303-449-7779 x 18237 Joseph Kerski
A Framework for Incorporating Community Benefits Agreements into. 14 July
 A Framework for Incorporating Community Benefits Agreements into Brownfield Redevelopm ent Projects: The Case of Chelsea, Massachusetts I. Introduction to the Project 2010 ESRI User Conference 14 July
GIS for ChEs Introduction to Geographic Information Systems
 GIS for ChEs Introduction to Geographic Information Systems AIChE Webinar John Cirucci 1 GIS for ChEs Introduction to Geographic Information Systems What is GIS? Tools and Methods Applications Examples
Goodbye Galveston. The Effects of Rising Sea Level on the. Coast of Galveston, TX. Maria Reistroffer GEO 327G
 Goodbye The Effects of Rising Sea Level on the Coast of, TX Maria Reistroffer GEO 327G 12/3/2015 Problem: Greenhouse gases contribute to global sea level rise and threaten human life, property, wildlife
Geo 327G Semester Project. Landslide Suitability Assessment of Olympic National Park, WA. Fall Shane Lewis
 Geo 327G Semester Project Landslide Suitability Assessment of Olympic National Park, WA Fall 2011 Shane Lewis 1 I. Problem Landslides cause millions of dollars of damage nationally every year, and are
Spatial Analysis with ArcGIS Pro STUDENT EDITION
 Spatial Analysis with ArcGIS Pro STUDENT EDITION Copyright 2018 Esri All rights reserved. Course version 2.0. Version release date November 2018. Printed in the United States of America. The information
Trail Flow: Analysis of Drainage Patterns Affecting a Mountain Bike Trail
 Andy Belcher BAE 590 Professor Huffman 12.9.11 Location Trail Flow: Analysis of Drainage Patterns Affecting a Mountain Bike Trail The location of the project area rests in the Cary area of Wake County,
caused displacement of ocean water resulting in a massive tsunami. II. Purpose
 I. Introduction The Great Sumatra Earthquake event took place on December 26, 2004, and was one of the most notable and devastating natural disasters of the decade. The event consisted of a major initial