From a Hurricane Evacuation Map Series to a 3D Analytical Approach to Emergency Response by SHA Road Maintenance Crews
|
|
|
- Pamela Pierce
- 5 years ago
- Views:
Transcription
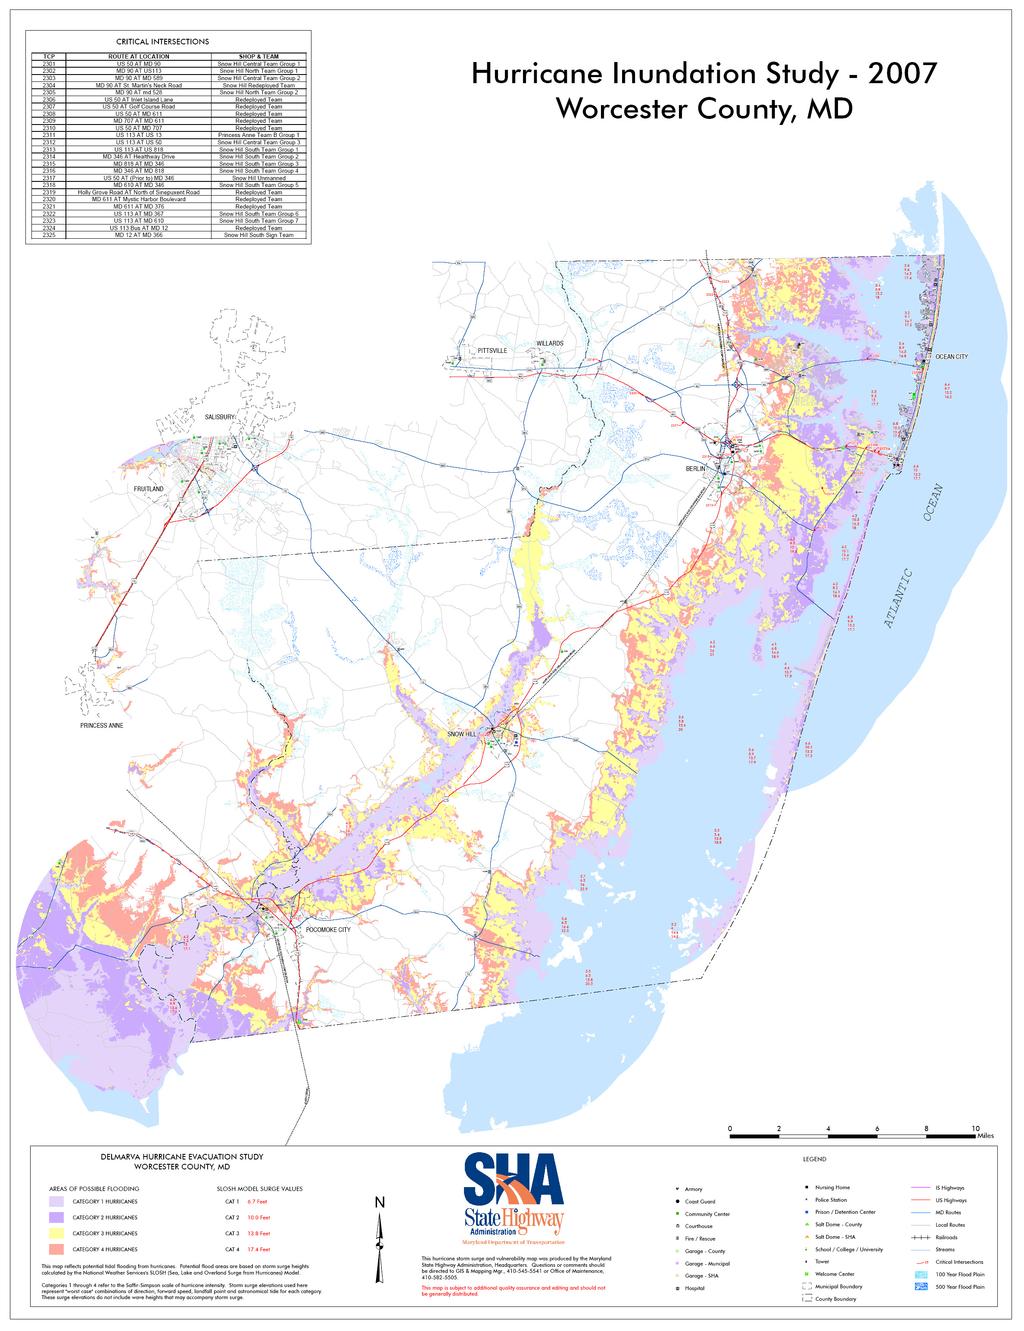
1 From a Hurricane Evacuation Map Series to a 3D Analytical Approach to Emergency Response by SHA Road Maintenance Crews Mike Sheffer Highway Information Services Division GIS Program Coordinator GIS-T T 2009 Oklahoma City, OK April 5-85
2 Introduction In Late 2006 the Highway Information Services Division s s (HISD) GIS Team attended an SHA District 1 Team Leaders meeting in Princess Anne, MD Part of the agenda was to solicit ideas regarding Hurricane Evacuation Mapping standards, and what the SHA Office of Maintenance (OOM) road crews would need to perform their role in closing and maintaining critical intersections identified in the evacuation plan
3 Introduction From this meeting, subsequent meetings and several design iterations, a prototype paper map format was created. The ultimate plan was to possibly provide laminated copies to all crews deployed during emergencies This solved an operational problem How do road crews from other SHA Districts know were they are supposed to report during and event It was not a 3D GIS Analytical solution, however

4
5 3D Spatial Data Research How How can SHA incorporate LiDAR and other 3D spatial data, the street centerline file, and other GIS data layers into a Decision Support System for Hurricane Evacuation Planning? Could Could this approach help to bridge the gap between planning and operational teams? Is the data complete and available to facilitate such an endeavor?
6 3D Data Availability in MD The The SHA GIS Team has 3D LiDAR datasets for the following Maryland Counties: More counties are becoming available. Anne Arundel County Baltimore County Charles County Dorchester County Howard County Saint Mary s s County Somerset County Talbot County Wicomico County Worcester County
7 3D Toolsets Utilized ArcGIS ArcGIS 3D and Spatial Analyst GRIDSPOT VB Tool, a free download from ESRI at arcscripts.esri.com/ ET GeoWizards,, a free trial from Ianko Tchoukanski of ET Spatial Techniques at ko.com/
8 3D Centerline Processing Steps Create Create a PolylineZ shapefile using 3D Analyst > Convert > Features to 3D Use Use ET GeoWizard to add PolylineZ as attributes to the shapefile
9 ET GeoWizard Adds the hidden PolylineZ Attributes
10 ET GeoWizard Display of Z Values 3D_Length] - the true 3D length of the polyline [2D_Length] - the 2D length of the polyline [Max_Z] - Maximum Z value [Min_Z] - Minimum Z value [Len_Up] - distance uphill [Len_Down] - distance downhill [H_Up] - total increase in height [H_Down] - total decrease in height [Av_S_Up] - average slope uphill [Max_S_Up] - maximum slope uphill [Av_S_Down] - average slope downhill [Max_S_Down] -maximum slope downhill
11 3D Centerline Processing Steps SHA SHA GIS Team has generated both 1/10 th, 1/100 th and 1/1,000 th mile points for all routes in MD The The GIS point data representing the 1/10 th and 1/100 th mile points are assigned an elevation using the GRIDSPOT tool and LiDAR DEM surface. Similarly, Similarly, other point feature class data, such as Points of Interest (POI), are also assigned an elevation

12 1/10th Mile Points
13 1/100th Mile Points
14 SLOSH Models Sea, Sea, Lake, and Overland Surge from Hurricanes (SLOSH) model is a computerized model developed by the Federal Emergency Management Agency (FEMA), United States Corps of Engineers (USACE), and the National Weather Service (NWS) to estimate storm surge depths resulting from historical, hypothetical, or predicted hurricanes by taking into account a storm's pressure, size, forward speed, forecast track, wind speeds, and topographical data
15 3D Centerline Processing Steps All GIS point layers are processed with GRIDSPOT and the SLOSH GRIDS, providing a depth of surge for Category 1 4 Hurricanes. Category Category 5 storm surges are usually not processed in the Mid Atlantic, since this size storm historically has not threatened us

16 1/100 th Mile Point Attributes Base elevations, with surge depths and map display attribute

17 LiDAR DEM is more accurate than the SLOSH storm surge polygons Elevation Attributes

18 Mile Points Compared to Inundation Zones

19 Facility/Infrastructure Vulnerability St. Michaels Elementary and Middle Schools 6 OrthoPhoto of Sample Site

20 Facility/Infrastructure Vulnerability St. Michaels Elementary and Middle Schools LiDAR DEM and Hillshade of Sample Site

21 Facility/Infrastructure Vulnerability St. Michaels Elementary and Middle Schools Inundation Zones with DEM/Hillshade
22 Facility/Infrastructure Vulnerability St. Michaels Elementary and Middle Schools Inundation Zones with DEM/Hillshade and Points of Interest (POI) and geodetic control point

23 Facility/Infrastructure Vulnerability St. Michaels Elementary and Middle Schools Inundation Zones with OrthoPhoto

24 Facility/Infrastructure Vulnerability St. Michaels Elementary and Middle Schools OrthoPhoto with DEM/Hillshade

25 Critical Intersection Evaluation

26 West of Critical Intersection

27 East Of Critical Intersection

28 Monument Evaluation

29 Monument Attributes
30 What s s Next? More More data validation. Are our assumptions right? Process Process additional counties as LiDAR becomes available (Both for Coastal and Riverine studies) Education Education and outreach to Emergency Managers and SHA District Team Leaders Collaborative Cross Jurisdictional research/data sharing Finalize Finalize data inputs toward a true GIS Decision Support System for Evacuation Planning
31 Contact Information Mike Sheffer,, GISP, CFM GIS Program Coordinator Maryland State Highway Administration Highway Information Services Division 707 N. Calvert Street, Mail-Stop C-607C Baltimore, MD (410)
FEMA REGION III COASTAL HAZARD STUDY
 FEMA REGION III COASTAL HAZARD STUDY Impacts and Rollout June 11, 2013 Robin Danforth, FEMA Region III David Bollinger, FEMA Region III Jeff Gangai, RAMPP Christine Worley, RAMPP 1 Today s Discussion Overview
Storm Surge Analysis Update Meeting Cross City, Florida June 17, 2014
 Big Bend Coastal Storm Surge Study Storm Surge Analysis Update Meeting Cross City, Florida June 17, 2014 Introductions Risk MAP Project Team FEMA Region IV Florida Division of Emergency Management (FDEM)
Glossary. ARC: American Red Cross. ASOS: Automated Surface Observing System (NWS & FAA) ATM: Abbreviated Transportation Model
 ATM: Abbreviated Transportation Model") A AFN Access and Functional Needs. People who may have additional needs before, during, and after an incident in functional areas, including but not limited to: maintaining independence, communication,
A AFN Access and Functional Needs. People who may have additional needs before, during, and after an incident in functional areas, including but not limited to: maintaining independence, communication,
Alluvial Soils: Fine grained sediment, especially of mud or clay particles at the bottom of a river or lake.
 A Alluvial Soils: Fine grained sediment, especially of mud or clay particles at the bottom of a river or lake. Average Error Affected List: Average Error Swath: ARC: American Red Cross ASOS: Automated
Who has the data? Results of Maryland s 3-Week Statewide GIS Inventory Challenge. This is your state. This is your inventory.
 Who has the data? Results of Maryland s 3-Week Statewide GIS Inventory Challenge This is your state. This is your inventory. Maryland s Need for GIS Inventory Maryland had no central repository for its
Calhoun County, Texas Under 5 Meter Sea Level Rise
 Kyle Kacal GEO 327G Calhoun County, Texas Under 5 Meter Sea Level Rise PROBLEM AND PURPOSE: Sea level rise is threat to all coastal areas. Although natural sea level rise happens at a very slow rate, hurricanes
SLOSH New Orleans Basin 2012 Update
 SLOSH New Orleans Basin 2012 Update Michael Koziara Science and Operations Officer National Weather Service Slidell, LA The Basics What is storm surge? What is SLOSH? Details Assumptions Inundation = Storm
Florida Statewide Regional Evacuation Study Program
 Florida Statewide Regional Evacuation Study Program Directional Atlas Lafayette County Volume 10-3 Book 4 Florida Division of Emergency Management North Central Florida Regional Planning Council North
Vulnerability of Cape Ann, Massachusetts to Storm-Surge From Extreme Coastal Weather Events. GIS and GEODATABASE Design
 Vulnerability of Cape Ann, Massachusetts to Storm-Surge From Extreme Coastal Weather Events GIS and GEODATABASE Design Coastal Storm-Surge Estimated 80 percent of U.S. population lives on or near the East/West
Depth Analysis Atlas. Florida Statewide Regional Evacuation Study Program. Wakulla County. Volume 9-2. Apalachee Florida Region
 Florida Statewide Regional Evacuation Study Program Depth Analysis Atlas Wakulla County Volume 9-2 Book 5 of 5 Florida Division of Emergency Management Apalachee Florida Regional Council Apalachee Florida
Dewberry Support to Federal, State, and Local Governments with Hurricane Evacuation Studies
 Dewberry Support to Federal, State, and Local Governments with Hurricane Evacuation Studies FEMA R2 and USACE Jacksonville Study Coordinators Presenting the Puerto Rico GeoPDF in San Juan About Dewberry
Hurricane Readiness for Coastal Communities
 Hurricane Readiness for Participant Guide Developed for: Federal Emergency Management Agency Emergency Management Institute 16825 South Seton Avenue Emmitsburg, MD 21727-8998 Developed by: C² Technologies,
Modeling Storm Surge for Emergency Management
 Modeling Storm Surge for Emergency Management Study Area: Guam is the southern-most island of the Mariana Archipelago and is located at 13 28 N, 144 47 E. It has a total area of 541.3 sq. km. and the highest
Semester Project Final Report. Logan River Flood Plain Analysis Using ArcGIS, HEC-GeoRAS, and HEC-RAS
 Semester Project Final Report Logan River Flood Plain Analysis Using ArcGIS, HEC-GeoRAS, and HEC-RAS Kedric Curtis, Josh Hogge, Jordan Jarrett, Jared Justensen May 6, 2016 CEE 6190 GIS for Civil Engineers
Maryland State Geographic Information Committee
 MD IMAP 3.0 Next generation of MD imap platform running on Esri s ArcGIS Enterprise Promoting authoritative data sharing among State agencies via Portal for ArcGIS Centralization of GIS infrastructure
Storm Surge/Coastal Inundation State of the Union. Jamie Rhome Storm Surge Team Lead NOAA/National Hurricane Center
 Storm Surge/Coastal Inundation State of the Union Jamie Rhome Storm Surge Team Lead NOAA/National Hurricane Center 2 Tampa: Cat 5 Scenario 3 4 The Stakes are High Combination of SLR and increasing coastal
Florida Statewide Regional Evacuation Study Program
 Florida Statewide Regional Evacuation Study Program Directional Atlas Brevard County Volume 10-6 Book 1 Florida Division of Emergency Management East Central Florida Regional Planning Council East Central
Storm Tide Atlas. Florida Statewide Regional Evacuation Study Program. Franklin County. Volume 7-2. Apalachee Florida Region
 Florida Statewide Regional Evacuation Study Program Storm Tide Atlas Franklin County Volume 7-2 Book 1 of 5 Florida Division of Emergency Management Apalachee Florida Regional Council Apalachee Florida
Draft for Discussion 11/11/2016
 Coastal Risk Consulting (CRC) Climate Vulnerability Assessment for Village of Key Biscayne Deliverable 1.1 in Statement of Work. Preliminary Vulnerability Assessment Identifying Flood Hotspots Introduction...
HURRICANE MATTHEW A GIS PERSPECTIVE GLYNN COUNTY GIS
 HURRICANE MATTHEW A GIS PERSPECTIVE GLYNN COUNTY GIS Situation September 25 th October 9 th 2016 Hurricane Matthew tracked its way up the east coast bringing hurricane force winds and flooding from Haiti
Storm Surge Forecast with Shifting Forecast Tracks
 Storm Surge Forecast with Shifting Forecast Tracks Storm Surge Findings in the Florida Keys Jon Rizzo Warning Coordination Meteorologist National Weather Service Florida Keys Florida Keys Life History
UTILIZING GIS IN NEXT GENERATION Tennessee Information for Public Safety. Presented by State of TN, OIR-GIS Services
 UTILIZING GIS IN NEXT GENERATION 9-1-1 Tennessee Information for Public Safety Presented by State of TN, OIR-GIS Services Next Generation 9-1-1 WHAT IT IS AND HOW IT WORKS Next Generation 9-1-1 IP (Internet
A Multi-Hazard Evaluation of Vulnerability using GIS along Cape Hatteras National Seashore, NC
 A Multi-Hazard Evaluation of Vulnerability using GIS along Cape Hatteras National Seashore, NC Tom Allen¹, Burrell Montz¹, JP Walsh¹, Tom Crawford² ¹East Carolina University, ²Saint Louis University Presented
Sea level rise Web GIS Applications
 Florida International University FIU Digital Commons GIS Center GIS Center 2018 Sea level rise Web GIS Applications Zhaohui Fu GIS-RS Center, Florida International University, Fujen@fiu.edu Sheyla Santana
Miami-Dade County Overview
 Miami-Dade County Overview 2,000 square miles World s busiest cruise port 2.6 million residents Second busiest US airport for international travelers Gateway to the Caribbean and Latin America Natural
HVX-HURREVAC (Beta) Webinar Series
 Webinar Series") HVX-HURREVAC (Beta) Webinar Series Day 1 - An introduction to HURREVAC and the new web-based HVX platform 2018 HVX-HURREVAC Webinar Series 1. Intro to HURREVAC and General Overview of the Program (August
HVX-HURREVAC (Beta) Webinar Series Day 1 - An introduction to HURREVAC and the new web-based HVX platform 2018 HVX-HURREVAC Webinar Series 1. Intro to HURREVAC and General Overview of the Program (August
2006 GIS-T T Symposium Columbus Ohio
 2006 GIS-T T Symposium Columbus Ohio Creating a Location Based Response System Using ESRI Technology Brian Stevens, CP Woolpert, Inc. Agenda Introduction What is LBRS? History Specifications Proposed Method
GIS-T 2010 Building a Successful Geospatial Data Sharing Framework: A Ohio DOT Success Story
 GIS-T 2010 Building a Successful Geospatial Data Sharing Framework: A Ohio DOT Success Story ODOT District 2 GIS John Puente District 1 GIS Coordinator\ Planning Administrator 2 Interoperability 3 District
HURREVAC The software Tool used by emergency officials for hurricane evacuation assistance
 HURREVAC 2010 A Quick Reference enc e Guide The software Tool used by emergency officials for hurricane evacuation assistance www.hurrevac.com FinalHURREVAC2010Guide.indd 1 About HURREVAC HURREVAC is a
HEC & GIS Modeling of the Brushy Creek HEC & GIS Watershed Modeling of the
 HEC & GIS Modeling of the Brushy Creek HEC & GIS Watershed Modeling of the By Cassandra Fagan 5, December 2014 http://ubcwatershedstudy.ursokr.com/images/ Contents Introduction... 3 Figure 1: 24-hour rainfall
2018 NASCIO Award Submission Category: Cross-Boundary Collaboration and Partnerships. Project Title: Tennessee Wildfires: A Coordinated GIS Response
 2018 NASCIO Award Submission Category: Cross-Boundary Collaboration and Partnerships Project Title: Tennessee Wildfires: A Coordinated GIS Response Sevier County, Tennessee State of Tennessee, Emergency
NWS HURRICANES June 3, 2015
 NWS HURRICANES June 3, 2015 Hurricane Season June 1 November 30 2 What s the concern? All tropical systems passing within 125nm of central Maryland since 1950 Mid-Atlantic Hurricanes Greatest Risk: August
Coastal Emergency Risks Assessment - CERA Real-Time Storm Surge and Wave Visualization Tool
 Coastal Emergency Risks Assessment - CERA Real-Time Storm Surge and Wave Visualization Tool Introduction This document provides guidance for using the Coastal Emergency Risks Assessment (CERA) visualization
A Cloud-Based Flood Warning System For Forecasting Impacts to Transportation Infrastructure Systems
 A Cloud-Based Flood Warning System For Forecasting Impacts to Transportation Infrastructure Systems Jon Goodall Associate Professor, Civil and Environmental Engineering Associate Director, Link Lab April
Climate Change and Mapping of the Future Nature
 Climate Change and Mapping of the Future Nature The XXIV FIG International Congress 2010 TS 4E Coasts and Natural Resources Tuesday 13 April Mr. Jesper Rye Rasmussen Denmark on the map Sydney, Australia,
NCTCOG GIS File Locations
 Boundaries Area Codes k:\bnd\region\area_codes.shp Area Type k:\bnd\region\areatype.shp Ciry Centroids (World) k:\bnd\usa_world\cities.shp City Centroids (NCTCOG Region) k:\bnd\region\city_point.shp vector.vector.bnd_city_point
Location: Jacksonville, FL December 11, 2012
 Technical Update Meeting Northeast Florida Surge Study Location: Jacksonville, FL December 11, 2012 Agenda 2:00 2:15 Welcome/Introductions Tucker Mahoney, FEMA Region IV Michael DelCharco, BakerAECOM 2:15
TRB First International Conference on Surface Transportation Resilience
 TRB First International Conference on Surface Transportation Resilience Applying the Sea-Level Scenario Sketch Planning Tool to Enhance the Resilience of Long-Range Transportation Plans: Lessons Learned
Comparative Analysis of Hurricane Vulnerability in New Orleans and Baton Rouge. Dr. Marc Levitan LSU Hurricane Center. April 2003
 Comparative Analysis of Hurricane Vulnerability in New Orleans and Baton Rouge Dr. Marc Levitan LSU Hurricane Center April 2003 In order to compare hurricane vulnerability of facilities located in different
INDOT Office of Traffic Safety
 Intro to GIS Spatial Analysis INDOT Office of Traffic Safety Intro to GIS Spatial Analysis INDOT Office of Traffic Safety Kevin Knoke Section 130 Program Manager Highway Engineer II Registered Professional
HURRICANE IVAN CHARACTERISTICS and STORM TIDE EVALUATION
 HURRICANE IVAN CHARACTERISTICS and STORM TIDE EVALUATION By Robert Wang and Michael Manausa Sponsored by Florida Department of Environmental Protection, Bureau of Beaches and Coastal Systems Submitted
WHAT S COOKING AT THE ESRGC? Michael S. Scott, PhD, GISP Eastern Shore Regional GIS Cooperative Salisbury University
 WHAT S COOKING AT THE ESRGC? Michael S. Scott, PhD, GISP Eastern Shore Regional GIS Cooperative Salisbury University ESRGC For more than a decade Established in 2004 as a self-sustaining collaboration
Flood Inundation Mapping
 KU GIS Day 2009 November 18, 2009 Flood Inundation Mapping Wendy L. Pearson NOAA s National Weather Service Central Region Headquarters Kansas City, Missouri Flood Inundation Mapping Objectives: Overview
2006 & 2007 Pre-Hurricane Scenario Analyses
 2006 & 2007 Pre-Hurricane Scenario Analyses Executive Summary May 2007 Page 1 OF X FOR OFFICIAL USE ONLY 4 Public Availability to be Determined Under 5 U.S.C. 552 NOTE: Limited Distribution. Release of
ERDC Support for Hurricane Sandy
 ERDC Support for Hurricane Sandy Chris Massey, CHL; Aaron Byrd, CHL; Nawa Pradhan, CHL; Jeff Melby, CHL; Jane Smith, CHL; Robert Walker, ITL; and Jennifer Wozencraft, JALBTCX ERDC Support for Hurricane
A More Comprehensive Vulnerability Assessment: Flood Damage in Virginia Beach
 A More Comprehensive Vulnerability Assessment: Flood Damage in Virginia Beach By Raj Shah GIS in Water Resources Fall 2017 Introduction One of the most obvious effects of flooding events is death. Humans
Experimental Probabilistic Hurricane Inundation Surge Height (PHISH) Guidance
 Guidance") Experimental Probabilistic Hurricane Inundation Surge Height (PHISH) Guidance DRBC Flood Advisory Committee John Kuhn - NWS/OCWWS Anne Myckow (NWS/MDL), Arthur Taylor (NWS/MDL) SLOSH Sea, Lake and Overland
Experimental Probabilistic Hurricane Inundation Surge Height (PHISH) Guidance DRBC Flood Advisory Committee John Kuhn - NWS/OCWWS Anne Myckow (NWS/MDL), Arthur Taylor (NWS/MDL) SLOSH Sea, Lake and Overland
THC-T-2013 Conference & Exhibition
 Modeling of Shutter Coastal Protection against Storm Surge for Galveston Bay C. Vipulanandan, Ph.D., P.E., Y. Jeannot Ahossin Guezo and and B. Basirat Texas Hurricane Center for Innovative Technology (THC-IT)
Maryland Transit Administration (MTA) Bus Accident Mapping and Analysis Application
 Bus Accident Mapping and Analysis Application") Maryland Transit Administration (MTA) Bus Accident Mapping and Analysis Application Ralign Wells, MTA Administrator Bernadette Bridges, MTA Chief Safety Officer Office of Safety, Quality Assurance, and
Maryland Transit Administration (MTA) Bus Accident Mapping and Analysis Application Ralign Wells, MTA Administrator Bernadette Bridges, MTA Chief Safety Officer Office of Safety, Quality Assurance, and
The Dance Hall Goes in What School District?
 The Dance Hall Goes in What School District? Vern C. Svatos Jarrod S. Doucette Abstract This paper presents the results of a GIS mapping effort created for the Delaware State Department of Education using
Massachusetts Department of Public Health Emergency Preparedness Bureau. August 27, hrs
 Massachusetts Department of Public Health Emergency Preparedness Bureau August 27, 2011 1500 hrs Health and Medical Situational Awareness Report: Hurricane Irene Situational Awareness Report: Hurricane
Application #: TEXT
 TOWN OF FORT MYERS BEACH 2008 PROPOSED COMPREHENSIVE PLAN AMENDMENTS Application #: 2008-13-TEXT Description: Modify the Coastal Management and Future Land Use Elements to reflect the state s new definition
A New National Flood Inundation Mapping Science Initiative
 A New National Flood Inundation Mapping Science Initiative William Guertal, PhD. Director, USGS Indiana and Kentucky Water Science Centers U.S. Department of the Interior U.S. Geological Survey Courtesy
Floodplain Mapping & Flood Warning Applications in North Carolina
 Floodplain Mapping & Flood Warning Applications in North Carolina Marc Stanard, IT Project Manager Ken Ashe, Assistant Director David Herlong, Flood Warning Program Manager NC Crime Control & Public Safety
HAZUS th Annual Conference
 HAZUS 2014 7 th Annual Conference VALIDATING THE HAZUS COASTAL SURGE MODEL FOR SUPERSTORM SANDY Spiridon Katehis 1 Jordan T. Hastings 1 1 University of Southern California 1 Superstorm Sandy, Oct 12 2
A Prepared Marylander Creates a Resilient Maryland
 Maryland Emergency Management Agency Operations Directorate Hazardous Winter Weather Outlook Briefing March 5, 2013 0800 A Prepared Marylander Creates a Resilient Maryland A strong low pressure will track
Final Results and Outreach Lessons Learned
 FEMA REGION III COASTAL HAZARD STUDY Final Results and Outreach Lessons Learned June 4, 2014 Mari Radford Christine Worley Robin Danforth David Bollinger FEMA Region III RAMPP FEMA Region III FEMA Region
IMPERIAL COUNTY PLANNING AND DEVELOPMENT
 IMPERIAL COUNTY PLANNING AND DEVELOPMENT GEODATABASE USER MANUAL FOR COUNTY BUSINESS DEVELOPMENT GIS June 2010 Prepared for: Prepared by: County of Imperial Planning and Development 801 Main Street El
Major Hurricane Matthew Briefing Situation Overview
 Major Hurricane Matthew Briefing Situation Overview At 5 p.m. Tuesday, Category 4 Hurricane Matthew was about 860 miles South-Southeast of Mayport, Florida, moving north around 10 mph. Maximum sustained
CATEX Hurricane Zachary
 CATEX Hurricane Zachary EXERCISE, EXERCISE,EXERCISE East Coast CATEX Power Restoration Functional Exercise 2013 This document was prepared under a grant from FEMA's Grants Programs Directorate, U.S. Department
Miami-Dade County Technical Update Meeting South Florida Coastal Study. May 11, 2016
 Miami-Dade County Technical Update Meeting South Florida Coastal Study May 11, 2016 Welcome and Introductions FEMA Region IV Christina Lindemer Technical Lead Production and Technical Services (PTS) Contractor
Risk Identification using Hazus
 Risk Identification using Hazus City of Boston, Suffolk County, MA Dave Shortman, GISP, CFM 6/21/2016 Agenda Objective Project Location Hazus Overview Hazus Level 2 Risk Assessment Comparison and Reporting
PRECAP. Rivers Breakout Session Final Presentation CAPSTONE 14
 Rivers Breakout Session Final Presentation CAPSTONE 14 Rivers Session Team -Army Corps of Engineers -3 Divisions, 4 Districts -Navigation & Emergency Management -U.S. Coast Guard -U.S. Department of Transportation
Office of Technology Partnerships GIS Collaboration
 Office of Technology Partnerships GIS Collaboration State GIS Update April 21, 2017 Mark Holmes, GISP Outline MGF Upgrade Project Census Programs Imagery Update LiDAR Update Open Discussion 2 MGF Background
John Laznik 273 Delaplane Ave Newark, DE (302)
") Office Address: John Laznik 273 Delaplane Ave Newark, DE 19711 (302) 831-0479 Center for Applied Demography and Survey Research College of Human Services, Education and Public Policy University of Delaware
Office Address: John Laznik 273 Delaplane Ave Newark, DE 19711 (302) 831-0479 Center for Applied Demography and Survey Research College of Human Services, Education and Public Policy University of Delaware
RHOAPS. Real-time Hydrology Ocean Atmosphere Prediction System. Pronunciation: Ropes Motto: More than just THREDDS
 RHOAPS Real-time Hydrology Ocean Atmosphere Prediction System Pronunciation: Ropes Motto: More than just THREDDS Key Aspects Integrated real-time data systems Atmospheric Hydrologic Coastal oceans Societal
McHenry County Property Search Sources of Information
 Disclaimer: The information in this system may contain inaccuracies or typographical errors. The information in this system is a digital representation of information derived from original documents; as
Maryland Bridges in Black & White. Sharing Archival Photos with the Public Using GIS
 Maryland Bridges in Black & White Sharing Archival Photos with the Public Using GIS Introductions Laurie Goudy Maryland State Highway Administration Assistant Division Chief, Data Services Engineering
SECONDARY ROADS LEVERAGING ENTERPRISE GIS. Secondary Road Department & GIS Department Linn County, Iowa April 20, 2015
 SECONDARY ROADS LEVERAGING ENTERPRISE GIS Secondary Road Department & GIS Department Linn County, Iowa April 20, 2015 Brad Ketels, P.E. Linn County Assistant Engineer Matt Boyle, GISP Linn County GIS Analyst
McHenry County Property Search Sources of Information
 Disclaimer: The information in this system may contain inaccuracies or typographical errors. The information in this system is a digital representation of information derived from original documents; as
Forecast Predictions of Winds, Waves and Storm Surge during Hurricane Arthur (2014)
") Forecast Predictions of Winds, Waves and Storm Surge during Hurricane Arthur (2014) R Cyriac 1, JC Dietrich 1, JG Fleming 2, BO Blanton 3, RA Luettich Jr 4, C Kaiser 5 1 Dept. of Civil, Construction, and
Forecast Predictions of Winds, Waves and Storm Surge during Hurricane Arthur (2014) R Cyriac 1, JC Dietrich 1, JG Fleming 2, BO Blanton 3, RA Luettich Jr 4, C Kaiser 5 1 Dept. of Civil, Construction, and
Hurricane Shelter Standards Governors Hurricane Conference 2018
 Hurricane Shelter Standards Governors Hurricane Conference 2018 Partnership with Florida Local Level State Level Hurricane Evacuation Studies Hurricane Evacuation Study Fresh Water Flooding Storm Surge
1 foot of Sea Level Rise
 1 foot of Sea Level Rise Schools Fire Stations Law Enforcement u Hospitals 1ft SLR 0 0.125 0.25 0.5 Miles the 2013 study A Geological Perspective U.S. Mid-Atlantic Coast a probable threat expected by 2050.
E Geographic Information System. Created By: Freda Rocker Pearl River County Mapping
 E-9-1-1 Geographic Information System Created By: Freda Rocker Pearl River County Mapping frocker@pearlrivercounty.net Overview of Pearl River County E-9-1-1 Communications District GIS In 1998 the Pearl
Crystal Goodison & Alexis Thomas University of Florida GeoPlan Center
 Crystal Goodison & Alexis Thomas University of Florida GeoPlan Center A1A Fort Lauderdale, Hurricane Sandy, October 2012 Photo Credits: Susan Stocker, Sun Sentinel FAU s Research Report (completed Jan
Monday, May 28, :30 a.m. EDT
 Monday, May 28, 2018 8:30 a.m. EDT Significant Activity May 27-28 Significant Events: Subtropical Storm Alberto; Ellicott City, MD flooding Tropical Activity: Atlantic Subtropical Storm Alberto Significant
SOUTHEAST COASTAL ASSESSMENT: Creating a shared vision
 SOUTHEAST COASTAL ASSESSMENT: Creating a shared vision November 12, 2017 Jacqueline Keiser, PG, PMP Regional Sediment Management Regional Center of Expertise SOUTH ATLANTIC DIVISION U.S. ARMY CORPS OF
What is CERA? Coastal Emergency Risks Assessment
 What is CERA? Coastal Emergency Risks Assessment Visualization tool using OGC standards Displays the outputs from the ADCIRC storm surge model or other coastal models Represents the maps on interactive
1 foot of Sea Level Rise
 1 foot of Sea Level Rise Schools Fire Stations $+ Law Enforcement u Hospitals 1ft SLR 0 0.25 0.55 1.1 Miles $+ Year 20 Population: the 2013 study A Geological Perspective U.S. Mid-Atlantic Coast a probable
LOMR SUBMITTAL LOWER NESTUCCA RIVER TILLAMOOK COUNTY, OREGON
 LOMR SUBMITTAL LOWER NESTUCCA RIVER TILLAMOOK COUNTY, OREGON Prepared for: TILLAMOOK COUNTY DEPARTMENT OF COMMUNITY DEVELOPMENT 1510-B THIRD STREET TILLAMOOK, OR 97141 Prepared by: 10300 SW GREENBURG ROAD,
Frank Revitte National Weather Service. Weather Forecast Office New Orleans/Baton Rouge
 Frank Revitte National Weather Service Weather Forecast Office New Orleans/Baton Rouge Above normal activity 17 Total Named Storms 7 Tropical Storms 4 Hurricanes 6 Major Hurricanes Not the most active,
Maryland Transit Administration (MTA) Bus Accident Mapping and Analysis Application
 Bus Accident Mapping and Analysis Application") Maryland Transit Administration (MTA) Bus Accident Mapping and Analysis Application Ralign Wells, MTA Administrator Bernadette Bridges, MTA Chief Safety Officer Office of Safety, Quality Assurance, and
Maryland Transit Administration (MTA) Bus Accident Mapping and Analysis Application Ralign Wells, MTA Administrator Bernadette Bridges, MTA Chief Safety Officer Office of Safety, Quality Assurance, and
From Vulnerability to Resilience And the Tools to Get There. Out of Harm s Way Partnership for the Delaware Estuary August 1, 2012
 From Vulnerability to Resilience And the Tools to Get There Out of Harm s Way Partnership for the Delaware Estuary August 1, 2012 Today s Presentation Tour of New Jersey Challenges Definitions so we re
Lake Champlain Richelieu River Flood Inundation Mapping and Forecasting Tool
 Lake Champlain Richelieu River Flood Inundation Mapping and Forecasting Tool Rob Flynn USGS New England Water Science Center, NH/VT Office U.S. Department of the Interior U.S. Geological Survey Lake Champlain
Coastal Inundation Forecasting Demonstration Project CIFDP. Flood Forecasting Initiative-Advisory Group (FFI-AG 3), Geneva, 5-7 Dec, 2017
, Geneva, 5-7 Dec, 2017") Coastal Inundation Forecasting Demonstration Project CIFDP Flood Forecasting Initiative-Advisory Group (FFI-AG 3), Geneva, 5-7 Dec, 2017 Coastal Flooding & Vulnerable Populations Coastal populations are
Coastal Inundation Forecasting Demonstration Project CIFDP Flood Forecasting Initiative-Advisory Group (FFI-AG 3), Geneva, 5-7 Dec, 2017 Coastal Flooding & Vulnerable Populations Coastal populations are
GC Briefing. Weather Sentinel Tropical Storm Michael. Status at 8 AM EDT (12 UTC) Today (NHC) Discussion. October 11, 2018
 Today (NHC) Discussion. October 11, 2018") GC Briefing Weather Sentinel Tropical Storm Michael October 11, 2018 After making landfall as a high-end category-4 hurricane on the Florida Panhandle, Michael weakened to tropical storm status early this
GC Briefing Weather Sentinel Tropical Storm Michael October 11, 2018 After making landfall as a high-end category-4 hurricane on the Florida Panhandle, Michael weakened to tropical storm status early this
Assessing the Vulnerability of New Jersey s Transportation System to the Impacts of Climate Change
 Assessing the Vulnerability of New Jersey s Transportation System to the Impacts of Climate Change Jeffrey Perlman, AICP, PP, LEED AP, Principal Planner North Jersey Transportation Planning Authority Project
Indiana GIS Resources
 Indiana GIS Resources National Association of Water Companies September 21, 2017 Jim Sparks Indiana Geographic Information Officer ABOUT THE INDIANA GEOGRAPHIC INFORMATION OFFICE I.C. 4-23-7.3 Indiana
National Hurricane Program. FEMA Region IV
 National Hurricane Program FEMA Region IV Percent NHP A quick background Hurricane Program major buckets (Toolboxes) Hurricane Evacuation Study HURREVAC Post Storm Assessments Training Hurricane Liaison
Transforming the Maricopa County Department of Transportation (MCDOT) GIS-based Transportation Asset Inventory System June 30, 2016
 GIS-based Transportation Asset Inventory System June 30, 2016") Transforming the Maricopa County Department of Transportation (MCDOT) GIS-based Transportation Asset Inventory System June 30, 2016 Presented By Steve Hossack, GIS Database Administrator 2016 Esri User
Transforming the Maricopa County Department of Transportation (MCDOT) GIS-based Transportation Asset Inventory System June 30, 2016 Presented By Steve Hossack, GIS Database Administrator 2016 Esri User
Climate Risk Visualization for Adaptation Planning and Emergency Response
 Climate Risk Visualization for Adaptation Planning and Emergency Response NCR Flood Fact Finding Workshop Ricardo Saavedra ricardo@vizonomy.com Social Media, Mobile, and Big Data St. Peter s Basilica,
Information for File # MMJ; Trunk Highway (TH) 7 / Louisiana Ave. Interchange Project
 7 / Louisiana Ave. Interchange Project") Information for File # 2013-00531-MMJ; Trunk Highway (TH) 7 / Louisiana Ave. Interchange Project Applicant: City of St. Louis Park Corps Contact: Melissa Jenny Address: U.S. Army Corps of Engineers Attn:
Information for File # 2013-00531-MMJ; Trunk Highway (TH) 7 / Louisiana Ave. Interchange Project Applicant: City of St. Louis Park Corps Contact: Melissa Jenny Address: U.S. Army Corps of Engineers Attn:
Tropical Update. 11 AM EDT Wednesday, October 10, 2018 Hurricane Michael, Hurricane Leslie & Tropical Storm Nadine, Caribbean Low (40%)
") Tropical Update 11 AM EDT Wednesday, October 10, 2018 Hurricane Michael, Hurricane Leslie & Tropical Storm Nadine, Caribbean Low (40%) This update is intended for government and emergency response officials,
Tropical Update 11 AM EDT Wednesday, October 10, 2018 Hurricane Michael, Hurricane Leslie & Tropical Storm Nadine, Caribbean Low (40%) This update is intended for government and emergency response officials,
Preliminary Data Release for the Humboldt Bay Sea Level Rise Vulnerability Assessment: Humboldt Bay Sea Level Rise Inundation Mapping
 Preliminary Data Release for the Humboldt Bay Sea Level Rise Vulnerability Assessment: Humboldt Bay Sea Level Rise Inundation Mapping Prepared by: Jeff Anderson, Northern Hydrology & Engineering (jeff@northernhydrology.com)
Like other coastal cities, Honolulu s
 Worst-Case Scenarios: Flooding and Evacuation Plans in Honolulu Karl Kim, Pradip Pant, Eric Yamashita Like other coastal cities, Honolulu s long-term viability depends on how well it can adapt to climate
MACo Briefing General Assembly of Maryland
 MACo Briefing General Assembly of Maryland House Environment & Transportation Committee 1/22/2019 Introduction to Maryland Counties Maryland has 23 counties plus Baltimore City (which is legally both a
A HURRICANE IS COMING. Presented by Atiba Upchurch Broward Emergency Management Division
 A HURRICANE IS COMING Presented by Atiba Upchurch Broward Emergency Management Division Mission Statement To safeguard the lives and property of the people of Broward County from major hazards and emergencies
Flooding Performance Indicator Summary. Performance indicator: Flooding impacts on riparian property for Lake Ontario and the Upper St.
 Flooding Performance Indicator Summary Performance indicator: Flooding impacts on riparian property for Lake Ontario and the Upper St. Lawrence River Technical Workgroup: Coastal TWG Research by: Baird
What is 511? Need for 511 Services. Development & Deployment of Regional Road and Weather Information Supporting 511 Traveler Services
 Development & Deployment of Regional Road and Weather Information Supporting 511 Traveler Services Leon F. Osborne University of North Dakota Regional Weather Information Center Grand Forks, ND David L.