7.5-year global trends in GOME cloud cover and humidity - a signal of climate change? Institut für Umweltphysik, Uni-Heidelberg, Germany
|
|
|
- Nathaniel Weaver
- 6 years ago
- Views:
Transcription
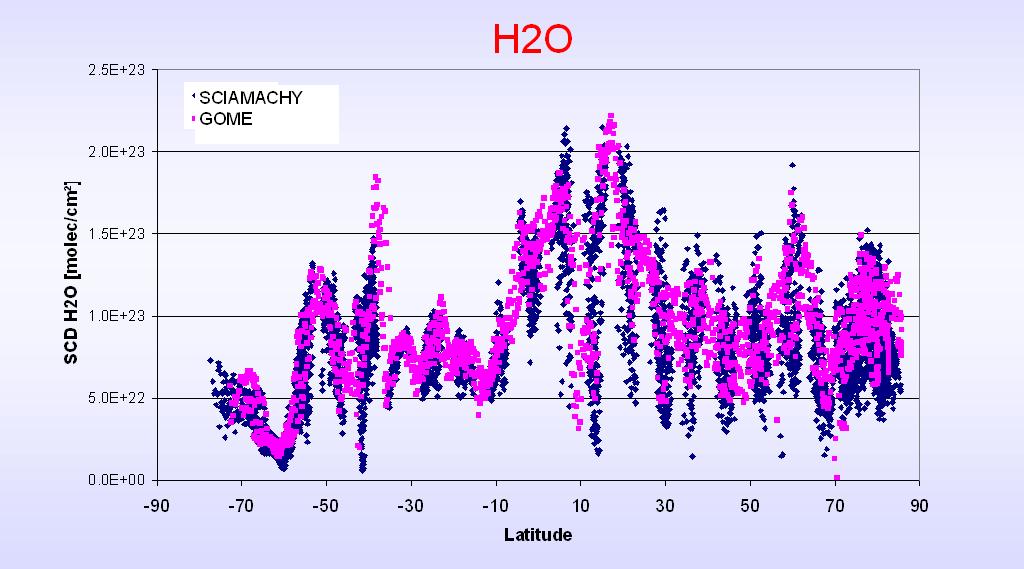
 GOME observations of H2O and clouds Comparison to other")
1 7.5-year global trends in GOME cloud cover and humidity - a signal of climate change? T. Wagner, S. Beirle, M. Grzegorski, S. Sanghavi, U. Platt Institut für Umweltphysik, Uni-Heidelberg, Germany The Greenhouse effect and the role of water vapor (feedback) GOME observations of H2O and clouds Comparison to other satellite sensors Results & Conclusions


 BrO")
2 Global Maps derived from GOME / SCIAMACHY NO2 VCD (S. Beirle, IUP Heidelberg) SO2 SCD (M.F. Khokhar, IUP Heidelberg) SCIAMACHY, 2003/04 GOME HCHO VCD (T. Marbach, IUP Heidelberg) BrO VCD (J. Hollwedel, IUP Heidelberg) 1997 GOME GOME

3 CH4 from SCIAMACHY C. Frankenberg, IUP Heidelberg CO2 CH4 CH4 columns are normalised with respect to CO2 columns Aug-Nov 2003 Together with KNMI team: Science-paper, March 2005

4 H2O VCD from GOME Jan Feb 1996
5 Greenhouse effect, historical remarks: Joseph Fourier, 1827: Greenhouse effect: Earth is relatively transparent to solar radiation, but highly absorbant to thermal radiation. => Increase of the temperature of the earth s surface John Tyndal, 1861: Role of trace gases, especially H2O: Not O2 or N2 are responsibel, but trace gases, predominantly H2O and CO2...they serve as a blanket, more necessary to the vegetable life of England than clothing is to man
6 Greenhouse effect, historical remarks: S. Arrhenius, 1896: Anthropogenic greenhouse effect, On the influence of carbonic acid in the air upon the temperature of the ground T. Chamberlain, 1905: Water vapor feedback: Water vapor, confessedly the greatest thermal absorbent in the atmosphere, is dependent on temperature for its amount, and if another agent, as CO2, not so dependent, raises the temperature of the surface, it calles into function a certain amount of water vapor which further absorbs heat, raises the temperature and calls for more vapor...

7 Illustration of the greenhouse effect:

8 Some more details:

9 Relative contributions of the different trace gases on the natural greenhouse effect: 63.5% 22.5% 7.2% 4.2% 2.7%
10 Spatial dependence of the H2O greenhouse effect 15 35% Altitude % 17.5% 20% 0 10% Latitude Held & Soden, 2000
11 Vertical scheme of the greenhouse effect: -At Ze the atmosphere gets transparent for IR emission -Lapse rate Γ = 0.65K/100m Tropopause Ts = Te + Γ * Ze([CO2]) Altitude Ze 1x CO2 Temperature Te = 255K Ts
12 Vertical scheme of the greenhouse effect: -At Ze the atmosphere gets transparent for IR emission -Lapse rate Γ = 0.65K/100m Tropopause Altitude Ze Ze 1x CO2 Ts = Te + Γ * Ze([CO2]) 2x CO2 Doubling of the CO2 concentration results in: (no H2O feedback) Ze = 150 m Ts = 1K E = 4W/m² Temperature Te = 255K Ts Ts

13 Anthropogenic influence on the greenhouse effect: UK Meteorological Office IPCC, 2001
14 Water vapor feedback Numbers for an assumed doubling of the CO2 concentration
15 Clausius Clapeyron: Dependence of the H2O partial pressure on temperature H2O partial pressure [hpa] Temperature [ C] Fractional change of H2O partial pressure is proportional to T -2 : A 1K change at 200K (300K) results in a change of 15% (6%)
16 IPCC on water vapor feedback: 1990: The best understood feedback, intuitively to understand 1992: No compelling evidence that water vapor feedback is anything other than positive although difficulties with upper tropospheric water vapor 1995: Feedback from redistribution of water vapor remains substantial source of uncertatinties in climate models especially feedback from the tropical upper troposphere

17 Temperature response to a doubling of CO2 for different feedback strengths Held & Soden, 2000
18 -if lapse rate Γ const? -if relative humidity const? => Two main questions: Tropopause A) How does atmospheric humidity react to a change in surface temperature? Altitude Ze Ze Ts = Te + Γ * Ze([CO2]) 1x CO2 2x CO2 Temperature Te = 255K Ts B) How does atmospheric temperature profile react to a change in surface temperature? (especially in tropical upper tropospere)
 -large scale subsidence")
19 How is tropical free tropospheric humidity controlled? -convective updraft (small areas) -large scale subsidence Lindzen, 1991
20 Richard S. Lindzen, 1991: Some coolness concerning global warming T: altitude: humidity: T:
21 Reality seems to be more complex: -Mixing occurs at various atmospheric levels -relative humidity stays almost constant -Main question: Does relative humidity stays constant when climate changes?
. Clouds also can reflect energy to space and can cool the climate.")
22 Clouds can absorb IR and warm the climate (which is warmer - cloudy nights or clear ones?). Clouds also can reflect energy to space and can cool the climate.
23 Cloud forcing strongly depends on cloud height: General rule: low clouds cool, high clouds warm -Main question: Does cloud amount and/or distribution change when climate changes?
24 Such questions have been addressed in previous studies: -dependence on season and location (using seasonal cycle) -dependence on ENSO -dependece on atmospheric cooling due to Pinatubo eruption -Here we investigate the dependence for monthly and yearly mean values during the period temporal variations -spatial variations

25 Decrease of temperature and atmospheric humidity after the Pinatubo eruption a test case for the investigation of the water vapor feedback Soden et al., 2002
26 GOME covers the years , here we investigate the period The amplitude of the temperature changes is -0.3K for yearly averages Up to -2.1K for monthly averages Temperature anomaly [K]

27 Trends of surface-near temperatures, nasa.gov/data/u pdate/gistemp

28 Role of transport:

29 -humidity is remote controlled, especially over the continents
30 What can Satellite observations contribute? Global coverage: -Investigation of spatial patterns -Averages over large areas (e.g. Tropics) Long time series -correlation with temperature evolution Water vapor observations in different spectral ranges: - Microwave (SSM/I) - thermal IR (TOVS) - Visible Spectral range (GOME / SCIA)
31 Advantages in the microwave and IR-Spektral range: SSM/I: High temporal and spatial resolution and coverage (except oceans) High accuracy No cloud interference TOVS: (limited) vertical resolution
32 Advantages of GOME/SCIAMACHY-H2O-observations High sensitivity for the whole atmospheric column High precission Similar sensitivity over land and ocean global coverage Data retrieval is not depending on additional or a-priori information

33 GOME & SCIAMACHY-viewing geometry

34 GOME & SCIAMACHY-Spectral regions
35 Set Atmospheric of Atmospheric Trace Abosrbers gases analysed Identified in satellite GOME Spectra spectra at the Satellite Group at the Institut für Umweltphysik O 4 O 3 UV OClO H 2 O HCHO O 2 Intensity [arbitrary units 1E+16 1E+14 1E+12 1E+10 1E+08 Satellite group: Wavelength [nm] SO 2 NO 2 BrO O 3 vis
36 Optical density H2O O2 O4 GOME, , 08:30 UT SZA: 33, Lat: 5, Long 31 Raw Spectrum Ring residual Analysis Details: Wavelength range: nm Shift and squeeze: spectra linked to sun spectrum. Reference spectra: O2: Hitran, 273 K H2O: Hitran, 280 K O4: Greenblatt, 293 K Ring: calculated from sun spectrum ( ) Wavelength [nm]
37
38 Radiative transport corrections A): Zenit Geometrical elongation of the absorption path due to sun elevation Direktlicht- Beobachtungen SZA The final water vapor product:: Vertical column density (VCD): vertically integrated H2O-concentration

39 Radiative transport corrections B): Correction of changing sensitivity due to -clouds - aerosols - surface albedo
40 Radiative transport corrections C): Influence of spatial inhomogeneities inside the (large) ground pixel 40 km 320 km
41 -Our H2O data product is based on measured AMF (from molecular (O2) or dimer (O4) absorption) a) The concentrations of both absorbers are known and almost constant b) The influence of radiative transport variations is similar as for H2O 2 VCD H 2O = = SCD SCD O 2 H O VCD O 2 SCD H AMF 2 O O 2

42 Especially for trend studies it is important to minimise the influence of clouds => selection of mostly clear skies: Only measurements for O2 absorption between 80% and 95% of the maximum value are used Average of the H2O VCD all observations only clear sky observations

![molec/cm ] 1.5 1 0.](/docs-images/80/80946636/images/43-1.jpg "5 0 5 4 3 2 1 0 Total column")
43 Vergleich der H2O VCD für April 1997 SSM/I 2 6 GOME H2O VCD [1023 molec/cm ] Total column precipitable water [g/cm ]
 15. 4.")
44 Correlation of GOME and SSMI H2O VCD (over ocean only) April 1997
 O2-observations - clouds shield part of the O2 profile - depends on brightness and cloud altitude - high")
45 Two cloud data sets derived from GOME: A) Intensity-based (HICRU-Algorithm, Michael Grzegorski, IUP Heidelberg) - clouds are bright - almost inependent on cloud altitude B) O2-observations - clouds shield part of the O2 profile - depends on brightness and cloud altitude - high precission


46 Average cloud cover HICRU cloud fraction O2 cloud cover

![molec/cm²] 0 0.5 1 1.5 2 2.](/docs-images/80/80946636/images/47-1.jpg "5 0 1 2 3 4 5 6 7 Total column")
47 Influence of ENSO on the H2O VCD January 1997 January 1998 H2O VCD [1023 molec/cm²] Total column precipitable water vapor [g/cm²]


48 Relative anomaly of the H2O VCD during El-Nino (average of Oct Mar 1998 compared to average over the same period of the yaers 1996/97, 1998/99, 1999/2000, 2000/01)


49 Relative anomaly of the O2 and HICRU cloud cover during El-Nino HICRU O2


50 Relative anomalies during different years H2O HICRU O2

 90 60 30 0 30")

51 GOME H2O VCD as a function of time and latitude (mean values over one month and 10 latitude) H 2 O VCD [10 22 molec/cm²] Precipitable water [g/cm²]
52 Manthly mean H2O VCDs for the whole globe, and for the northern and southern hemisphere 1.4E E H2O VCD [molec/cm] 1.0E E E E E+22 SH NH Global Precipitable water [g/cm²] 0.0E+00 Jan.96 Dez.96 Jan.98 Jan.99 Jan.00 Jan.01 Jan.02 Jan.03 0
53 Trend patterns H2O VCD T [K]
54 Trend patterns H2O VCD T [K]
55 Trend patterns H2O VCD T [K]


56 Trend patterns H2O VCD T [K]
57 Temporal evolution of the H2O VCD over Germany Winter: strong decrease (-15%) Summer: strong increase (+13%) 1.2E E E E E E+22 H2O over Germany Winter: -14.6% Spring: -4.2% Summer: +12.6% Autumn: +4.8% 0.0E+00 Jan. 96 Jan. 97 Jan. 98 Jan. 99 Jan. 00 Jan. 01 Jan. 02 Jan. 03 Jan. 04
58 For the correlation of monthly data anomalies with respect to the long year monthly mean values are calculated: Tropical (30 S to 0 N) H2O VCD H2O VCD [molec/cm²] 1.32E E E E E E+23 tropical average Trop_-30 bis+30 tropical_h2o_anomaly 2.4E E E+22 9E+21 4E+21-1E+21 H2O anomaly [molec/cm²] 1.02E+23-6E Time
59 Evolution of globally averaged anomalies of temperature and H2O VCD E E E+21 Temperature anomaly [K] E+21 1.E+21 0.E+00-1.E+21 H2O anomaly [molec/cm²] E temp_anomaly H2O_anomaly -3.E Time -4.E+21
60 Evolution of tropical anomalies of temperature and H2O VCD 6.00E E+21 Trop_3030_H2O_anomaly Trop_-30 bis E H2O anomaly [molec/cm²] 3.00E E E E E temperature anomaly [K] -2.00E E E Jan. 96 Jan. 97 Jan. 98 Jan. 99 Jan. 00 Jan. 01 Jan. 02 Jan. 03
61 Correlation of globally and yearly averaged values H2O VCD 8.6E E+22 Average H2O VCD [molec/cm²] 8.5E E E E E E E+22 y = 10.0E+21x E+21 R 2 = Temperature anomaly [K]
62 Correlation of globally and monthly averaged values H2O VCD 4E+21 Anomaly of the H2O VCD [molec/cm²] 2E+21 0E+00-2E+21-4E+21 y = 7.4E+21x - 2.8E+21 R 2 = Temperature anomaly [K]
63 Correlation of tropical monthly averaged values H2O VCD 7E+21 H2O VCD anomaly [molec/cm²] 5E+21 3E+21 1E+21-1E+21-3E+21-5E+21 y = 9.6E+21x - 3.2E+21 R 2 = Temperature anomaly [K]
64 What can we learn from the tropical H2O trends? It seems that relative humidity stays constant when climate changes. Similar conclusion from study of temperature decrease after Pinatubo eruption (Soden et al., 2002) 7E+21 H2O VCD anomaly [molec/cm²] 5E+21 3E+21 1E+21-1E+21-3E+21-5E+21 y = 9.6E+21x - 3.2E+21 R 2 = Temperature anomaly [K] => Strong positive water vapor feedback

65
66 Conclusions 1: Temporal and spatial patterns of 1997/1998 El Nino are clearly visible in H2O and cloud data, for H2O significant changes even in mid and high latitude H2O and cloud trends are strongly variable, overall H2O increases by about 2.9±0.5% percent from For clouds no significant trend was identified (O2 cloud cover: 1.5 ±1.5%, HICRU cloud cover: ±2%) Over oceans trend patterns of H2O VCD are mostly correlated with temperature trends
67 Conclusions 2: Temporal variations of the H2O VCD are closely related to temperature changes: -globally averaged the H2O VCDs increase by about 9 to 12% per K -tropical H2O VCDs increase by about 8% per K The increase in the tropics indicates that relative humidity stays constant, indicating a very effective, positive water vapor feedback overlap of about 1 year between SCIAMACHY and GOME => continuation of the time series
Trace gases, aerosols & clouds analysed from GOME, SCIAMACHY and GOME-2. Recommendations for TROPOMI. Thomas Wagner. Satellite Group Mainz Heidelberg
 MPI Mainz Germany Trace gases, aerosols & clouds analysed from GOME, SCIAMACHY and GOME-2. Recommendations for TROPOMI. Thomas Wagner Satellite Group Mainz Heidelberg with contributions from: Uni- Heidelberg
Global long term data sets of the atmospheric H 2 O VCD and of cloud properties derived from GOME and SCIAMACHY
 Global long term data sets of the atmospheric H 2 O VCD and of cloud properties derived from GOME and SCIAMACHY Summary A contribution to subproject ACCENT-TROPOSAT-2 (AT2), Task Group 1 Thomas Wagner,
Atmospheric Measurements from Space
 Atmospheric Measurements from Space MPI Mainz Germany Thomas Wagner Satellite Group MPI Mainz Part 1: Basics Break Part 2: Applications Part 1: Basics of satellite remote sensing Why atmospheric satellite
Longtime Satelite Observation of Atmospheric Trace Gases
 Longtime Satelite Observation of Atmospheric Trace Gases T. Wagner, S. Beirle, C. v. Friedeburg, M. Grzegorski, J. Hollwedel, S. Kühl, S. Kraus, W. Wilms-Grabe, M. Wenig, U. Platt Institut für Umweltphysik,
Long term DOAS measurements at Kiruna
 Long term DOAS measurements at Kiruna T. Wagner, U. Frieß, K. Pfeilsticker, U. Platt, University of Heidelberg C. F. Enell, A. Steen, Institute for Space Physics, IRF, Kiruna 1. Introduction Since 1989
Support to H 2 O column retrieval algorithms for GOME-2
 Support to H 2 O column retrieval algorithms for GOME-2 O3M-SAF Visiting Scientist Activity Final Report 18.09.2011 Thomas Wagner, Kornelia Mies MPI für Chemie Joh.-Joachim-Becher-Weg 27 D-55128 Mainz
WATER VAPOUR RETRIEVAL FROM GOME DATA INCLUDING CLOUDY SCENES
 WATER VAPOUR RETRIEVAL FROM GOME DATA INCLUDING CLOUDY SCENES S. Noël, H. Bovensmann, J. P. Burrows Institute of Environmental Physics, University of Bremen, FB 1, P. O. Box 33 4 4, D 28334 Bremen, Germany
Diffuser plate spectral structures and their influence on GOME slant columns
 Diffuser plate spectral structures and their influence on GOME slant columns A. Richter 1 and T. Wagner 2 1 Insitute of Environmental Physics, University of Bremen 2 Insitute of Environmental Physics,
Lecture Outlines PowerPoint. Chapter 16 Earth Science 11e Tarbuck/Lutgens
 Lecture Outlines PowerPoint Chapter 16 Earth Science 11e Tarbuck/Lutgens 2006 Pearson Prentice Hall This work is protected by United States copyright laws and is provided solely for the use of instructors
Long-Term Time Series of Water Vapour Total Columns from GOME, SCIAMACHY and GOME-2
 Graphics: ESA Graphics: ESA Graphics: ESA Long-Term Time Series of Water Vapour Total Columns from GOME, SCIAMACHY and GOME-2 S. Noël, S. Mieruch, H. Bovensmann, J. P. Burrows Institute of Environmental
Understanding Climate Feedbacks Using Radiative Kernels
 Understanding Climate Feedbacks Using Radiative Kernels Brian Soden Rosenstiel School for Marine and Atmospheric Science University of Miami Overview of radiative kernels Recent advances in understanding
Relation of atmospheric humidity and cloud properties to surface-near temperatures derived from GOME satellite observations
 Relation of atmospheric humidity and cloud properties to surface-near temperatures derived from GOME satellite observations Thomas Wagner 1, Steffen Beirle 1, Tim Deutschmann 2, Michael Grzegorski 2, Ulrich
CHARACTERIZATION OF VEGETATION TYPE USING DOAS SATELLITE RETRIEVALS
 CHARACTERIZATION OF VEGETATION TYPE USING DOAS SATELLITE RETRIEVALS Thomas Wagner, Steffen Beirle, Michael Grzegorski and Ulrich Platt Institut für Umweltphysik, University of Heidelberg, Germany ABSTRACT.
Introduction to Climate ~ Part I ~
 2015/11/16 TCC Seminar JMA Introduction to Climate ~ Part I ~ Shuhei MAEDA (MRI/JMA) Climate Research Department Meteorological Research Institute (MRI/JMA) 1 Outline of the lecture 1. Climate System (
Energy Systems, Structures and Processes Essential Standard: Analyze patterns of global climate change over time Learning Objective: Differentiate
 Energy Systems, Structures and Processes Essential Standard: Analyze patterns of global climate change over time Learning Objective: Differentiate between weather and climate Global Climate Focus Question
Extremes of Weather and the Latest Climate Change Science. Prof. Richard Allan, Department of Meteorology University of Reading
 Extremes of Weather and the Latest Climate Change Science Prof. Richard Allan, Department of Meteorology University of Reading Extreme weather climate change Recent extreme weather focusses debate on climate
Chapter 11 Lecture Outline. Heating the Atmosphere
 Chapter 11 Lecture Outline Heating the Atmosphere They are still here! Focus on the Atmosphere Weather Occurs over a short period of time Constantly changing Climate Averaged over a long period of time
El Niño induced anomalies in global data sets of total column precipitable water and cloud cover derived from GOME on ERS-2
 JOURNAL OF GEOPHYSICAL RESEARCH, VOL. 110,, doi:10.1029/2005jd005972, 2005 El Niño induced anomalies in global data sets of total column precipitable water and cloud cover derived from GOME on ERS-2 T.
Fluid Circulation Review. Vocabulary. - Dark colored surfaces absorb more energy.
 Fluid Circulation Review Vocabulary Absorption - taking in energy as in radiation. For example, the ground will absorb the sun s radiation faster than the ocean water. Air pressure Albedo - Dark colored
Description of the MPI-Mainz H2O retrieval (Version 5.0, March 2011) Thomas Wagner, Steffen Beirle, Kornelia Mies
 Thomas Wagner, Steffen Beirle, Kornelia Mies") Description of the MPI-Mainz HO retrieval (Version 5., March ) Thomas Wagner, Steffen Beirle, Kornelia Mies Contact: Thomas Wagner MPI for Chemistry Joh.-Joachim-Becher-Weg 7 D-558 Mainz Germany Phone:
Description of the MPI-Mainz HO retrieval (Version 5., March ) Thomas Wagner, Steffen Beirle, Kornelia Mies Contact: Thomas Wagner MPI for Chemistry Joh.-Joachim-Becher-Weg 7 D-558 Mainz Germany Phone:
Understanding the Greenhouse Effect
 EESC V2100 The Climate System spring 200 Understanding the Greenhouse Effect Yochanan Kushnir Lamont Doherty Earth Observatory of Columbia University Palisades, NY 1096, USA kushnir@ldeo.columbia.edu Equilibrium
Prentice Hall EARTH SCIENCE. Tarbuck Lutgens
 Prentice Hall EARTH SCIENCE Tarbuck Lutgens Chapter 17 The Atmosphere: Structure and Temperature 17.1 Atmosphere Characteristics Composition of the Atmosphere Weather is constantly changing, and it refers
BIRA-IASB, Brussels, Belgium: (2) KNMI, De Bilt, Netherlands.
 KNMI, De Bilt, Netherlands.") Tropospheric CH 2 O Observations from Satellites: Error Budget Analysis of 12 Years of Consistent Retrieval from GOME and SCIAMACHY Measurements. A contribution to ACCENT-TROPOSAT-2, Task Group 1 I. De
Tropospheric CH 2 O Observations from Satellites: Error Budget Analysis of 12 Years of Consistent Retrieval from GOME and SCIAMACHY Measurements. A contribution to ACCENT-TROPOSAT-2, Task Group 1 I. De
Longtime Satelite Observation of Atmospheric Trace Gases
 Longtime Satelite Observation of Atmospheric Trace Gases T. Wagner, S. Beirle, C. v. Friedeburg, M. Grzegorski, J. Hollwedel, S. Kühl, S. Kraus, W. Wilms-Grabe, M. Wenig, U. Platt Institut für Umweltphysik,
CLIMATE AND CLIMATE CHANGE MIDTERM EXAM ATM S 211 FEB 9TH 2012 V1
 CLIMATE AND CLIMATE CHANGE MIDTERM EXAM ATM S 211 FEB 9TH 2012 V1 Name: Student ID: Please answer the following questions on your Scantron Multiple Choice [1 point each] (1) The gases that contribute to
1. The frequency of an electromagnetic wave is proportional to its wavelength. a. directly *b. inversely
 CHAPTER 3 SOLAR AND TERRESTRIAL RADIATION MULTIPLE CHOICE QUESTIONS 1. The frequency of an electromagnetic wave is proportional to its wavelength. a. directly *b. inversely 2. is the distance between successive
Lecture 2: Global Energy Cycle
 Lecture 2: Global Energy Cycle Planetary energy balance Greenhouse Effect Vertical energy balance Solar Flux and Flux Density Solar Luminosity (L) the constant flux of energy put out by the sun L = 3.9
Regents Earth Science Unit 7: Water Cycle and Climate
 Regents Earth Science Unit 7: Water Cycle and Climate Name Section Coastal and Continental Temperature Ranges Lab # Introduction: There are large variations in average monthly temperatures among cities
A Review of Soden et al: Global Cooling After the Eruption of Mount Pinatubo: A Test of Climate Feedback by Water Vapor.
 Suvi Flagan ESE/Ge 148a A Review of Soden et al: Global Cooling After the Eruption of Mount Pinatubo: A Test of Climate Feedback by Water Vapor. By: BJ Soden, RT Wetherald, GL Stenchikov, and A Robock.
Satellite remote sensing of NO 2
 Satellite remote sensing of NO 2 views from outside Steffen Beirle Satellite Group MPI Mainz UV-vis satellite instruments Current nadir UV/vis satellite instruments: GOME 1/2, SCIAMACHY, OMI Nadir: probing
Lecture 9: Climate Sensitivity and Feedback Mechanisms
 Lecture 9: Climate Sensitivity and Feedback Mechanisms Basic radiative feedbacks (Plank, Water Vapor, Lapse-Rate Feedbacks) Ice albedo & Vegetation-Climate feedback Cloud feedback Biogeochemical feedbacks
Improving S5P NO 2 retrievals
 Institute of Environmental Physics and Remote Sensing IUP/IFE-UB Department 1 Physics/Electrical Engineering Improving S5P NO 2 retrievals ESA ATMOS 2015 Heraklion June 11, 2015 Andreas Richter, A. Hilboll,
Factors That Affect Climate
 Factors That Affect Climate Factors That Affect Climate Latitude As latitude (horizontal lines) increases, the intensity of solar energy decreases. The tropical zone is between the tropic of Cancer and
The Atmosphere. Importance of our. 4 Layers of the Atmosphere. Introduction to atmosphere, weather, and climate. What makes up the atmosphere?
 The Atmosphere Introduction to atmosphere, weather, and climate Where is the atmosphere? Everywhere! Completely surrounds Earth February 20, 2010 What makes up the atmosphere? Argon Inert gas 1% Variable
Evidence from Satellite Data for Export phenomena
 Evidence from Satellite Data for Export phenomena A contribution to subproject ESPORT-E2 T. Wagner, S. Beirle, C. Frankenberg, C. v. Friedeburg, M. Grzegorski, J. Hollwedel, S. Kühl, M. F. A. Khokhar,
SCIAMACHY Carbon Monoxide Lessons learned. Jos de Laat, KNMI/SRON
 SCIAMACHY Carbon Monoxide Lessons learned Jos de Laat, KNMI/SRON A.T.J. de Laat 1, A.M.S. Gloudemans 2, I. Aben 2, M. Krol 2,3, J.F. Meirink 4, G. van der Werf 5, H. Schrijver 2, A. Piters 1, M. van Weele
Meteorology B Wright State Invite Team Name Team # Student Members: &
 1 Meteorology B Team Name Team # Student Members: & Raw Score: / 126 Rank: Part I. Multiple Choice. Answer the following questions by selecting the best answer. 2 points each. 1. All of the following are
Recent Climate History - The Instrumental Era.
 2002 Recent Climate History - The Instrumental Era. Figure 1. Reconstructed surface temperature record. Strong warming in the first and late part of the century. El Ninos and major volcanic eruptions are
Will a warmer world change Queensland s rainfall?
 Will a warmer world change Queensland s rainfall? Nicholas P. Klingaman National Centre for Atmospheric Science-Climate Walker Institute for Climate System Research University of Reading The Walker-QCCCE
Climate Feedbacks from ERBE Data
 Climate Feedbacks from ERBE Data Why Is Lindzen and Choi (2009) Criticized? Zhiyu Wang Department of Atmospheric Sciences University of Utah March 9, 2010 / Earth Climate System Outline 1 Introduction
The Planck Blackbody Equation and Atmospheric Radiative Transfer
 The Planck Blackbody Equation and Atmospheric Radiative Transfer Roy Clark Ventura Photonics There appears to be a lot of confusion over the use of the terms blackbody absorption and equilibrium in the
Lecture 3: Global Energy Cycle
 Lecture 3: Global Energy Cycle Planetary energy balance Greenhouse Effect Vertical energy balance Latitudinal energy balance Seasonal and diurnal cycles Solar Flux and Flux Density Solar Luminosity (L)
Prentice Hall EARTH SCIENCE
 Prentice Hall EARTH SCIENCE Tarbuck Lutgens Chapter 21 Climate 21.1 Factors That Affect Climate Factors That Affect Climate Latitude As latitude increases, the intensity of solar energy decreases. The
The Canadian Climate Model 's Epic Failure November 2016
 The Canadian Climate Model 's Epic Failure November 2016 By: Ken Gregory The Canadian Centre for Climate Modeling and Analysis located at the University of Victoria in British Columbia submitted five runs
3. Carbon Dioxide (CO 2 )
") 3. Carbon Dioxide (CO 2 ) Basic information on CO 2 with regard to environmental issues Carbon dioxide (CO 2 ) is a significant greenhouse gas that has strong absorption bands in the infrared region and
3. Carbon Dioxide (CO 2 ) Basic information on CO 2 with regard to environmental issues Carbon dioxide (CO 2 ) is a significant greenhouse gas that has strong absorption bands in the infrared region and
Climate Modeling Research & Applications in Wales. John Houghton. C 3 W conference, Aberystwyth
 Climate Modeling Research & Applications in Wales John Houghton C 3 W conference, Aberystwyth 26 April 2011 Computer Modeling of the Atmosphere & Climate System has revolutionized Weather Forecasting and
Let s make a simple climate model for Earth.
 Let s make a simple climate model for Earth. What is the energy balance of the Earth? How is it controlled? ó How is it affected by humans? Energy balance (radiant energy) Greenhouse Effect (absorption
Data and formulas at the end. Exam would be Weds. May 8, 2008
 ATMS 321: Science of Climate Practice Mid Term Exam - Spring 2008 page 1 Atmospheric Sciences 321 Science of Climate Practice Mid-Term Examination: Would be Closed Book Data and formulas at the end. Exam
Meteorology Practice Test
 Meteorology Practice Test 1. Transition zones between two air masses of different densities are called what? 2. A front occurs when a cold air mass replaces a warmer one. 3. A front occurs when a warm
,Solar Energy, Greenhouse effect, Convection.notebook October 31, 2016
 Essential Question: How is weather created? What is Solar Energy? The driving source of energy for Earth. 1. Heats Earth's land, water, and air. 2. Causes movement in the atmosphere. Key Topics: The sun
Simulated Radiances for OMI
 Simulated Radiances for OMI document: KNMI-OMI-2000-004 version: 1.0 date: 11 February 2000 author: J.P. Veefkind approved: G.H.J. van den Oord checked: J. de Haan Index 0. Abstract 1. Introduction 2.
Remote Sensing of Atmospheric Trace Gases Udo Frieß Institute of Environmental Physics University of Heidelberg, Germany
 Remote Sensing of Atmospheric Trace Gases Udo Frieß Institute of Environmental Physics University of Heidelberg, Germany CREATE Summer School 2013 Lecture B, Wednesday, July 17 Remote Sensing of Atmospheric
RETRIEVAL OF STRATOSPHERIC TRACE GASES FROM SCIAMACHY LIMB MEASUREMENTS
 RETRIEVAL OF STRATOSPHERIC TRACE GASES FROM SCIAMACHY LIMB MEASUREMENTS Jānis Puķīte (1,2), Sven Kühl (1), Tim Deutschmann (1), Walburga Wilms-Grabe (1), Christoph Friedeburg (3), Ulrich Platt (1), and
Monitoring of trace gas emissions from space: tropospheric abundances of BrO, NO 2, H 2 CO, SO 2, H 2 O, O 2, and O 4 as measured by GOME
 Monitoring of trace gas emissions from space: tropospheric abundances of BrO, NO 2, H 2 CO, SO 2, H 2 O, O 2, and O 4 as measured by GOME T. Wagner, S. Beirle, C. v.friedeburg, J. Hollwedel, S. Kraus,
Lecture 4 Air Temperature. Measuring Temperature. Measuring Temperature. Surface & Air Temperature. Environmental Contrasts 3/27/2012
 Lecture 4 Air Temperature Geo210 An Introduction to Physical Geography Temperature Concepts and Measurement Temperature the average kinetic energy (motion) of molecules of matter Temperature Scales Fahrenheit
Weather Forecasts and Climate AOSC 200 Tim Canty. Class Web Site: Lecture 27 Dec
 Weather Forecasts and Climate AOSC 200 Tim Canty Class Web Site: http://www.atmos.umd.edu/~tcanty/aosc200 Topics for today: Climate Natural Variations Feedback Mechanisms Lecture 27 Dec 4 2018 1 Climate
Prentice Hall EARTH SCIENCE
 Prentice Hall EARTH SCIENCE Tarbuck Lutgens Chapter 21 Climate 21.1 Factors That Affect Climate Factors That Affect Climate Latitude As latitude increases, the intensity of solar energy decreases. The
HEATING THE ATMOSPHERE
 HEATING THE ATMOSPHERE Earth and Sun 99.9% of Earth s heat comes from Sun But
March was 3rd warmest month in satellite record
 April 4, 2016 Vol. 25, No. 12 For Additional Information: Dr. John Christy, (256) 961-7763 john.christy@nsstc.uah.edu Dr. Roy Spencer, (256) 961-7960 roy.spencer@nsstc.uah.edu Global Temperature Report:
Lecture 4: Radiation Transfer
 Lecture 4: Radiation Transfer Spectrum of radiation Stefan-Boltzmann law Selective absorption and emission Reflection and scattering Remote sensing Importance of Radiation Transfer Virtually all the exchange
Radiation in climate models.
 Lecture. Radiation in climate models. Objectives:. A hierarchy of the climate models.. Radiative and radiative-convective equilibrium.. Examples of simple energy balance models.. Radiation in the atmospheric
Torben Königk Rossby Centre/ SMHI
 Fundamentals of Climate Modelling Torben Königk Rossby Centre/ SMHI Outline Introduction Why do we need models? Basic processes Radiation Atmospheric/Oceanic circulation Model basics Resolution Parameterizations
FORCING ANTHROPOGENIC
 NATURAL CLIMATIC FORCING Earth-Sun orbital relationships, changing landsea distribution (due to plate tectonics), solar variability & VOLCANIC ERUPTIONS vs. ANTHROPOGENIC FORCING Human-Enhanced GH Effect,
UV-visible observations of atmospheric O 4 absorptions using direct moonlight and zenith-scattered sunlight for clear-sky and cloudy sky conditions
 JOURNAL OF GEOPHYSICAL RESEARCH, VOL. 107, NO. D20, 4424, doi:10.1029/2001jd001026, 2002 UV-visible observations of atmospheric O 4 absorptions using direct moonlight and zenith-scattered sunlight for
The Atmosphere: Structure and Temperature
 Chapter The Atmosphere: Structure and Temperature Geologists have uncovered evidence of when Earth was first able to support oxygenrich atmosphere similar to what we experience today and more so, take
Applications of the SEVIRI window channels in the infrared.
 Applications of the SEVIRI window channels in the infrared jose.prieto@eumetsat.int SEVIRI CHANNELS Properties Channel Cloud Gases Application HRV 0.7 Absorption Scattering
The Structure and Motion of the Atmosphere OCEA 101
 The Structure and Motion of the Atmosphere OCEA 101 Why should you care? - the atmosphere is the primary driving force for the ocean circulation. - the atmosphere controls geographical variations in ocean
Chapter 11 Case Studies and Study Guide: The Atmosphere, Weather and Climate
 Chapter 11 Case Studies and Study Guide: The Atmosphere, Weather and Climate Case Study: The 2007 Western U.S. Freeze In January 2007, an Arctic low pressure system dipped unusually far west, causing record
What is Climate? Understanding and predicting climatic changes are the basic goals of climatology.
 What is Climate? Understanding and predicting climatic changes are the basic goals of climatology. Climatology is the study of Earth s climate and the factors that affect past, present, and future climatic
CHAPTER 6 Air-Sea Interaction Pearson Education, Inc.
 CHAPTER 6 Air-Sea Interaction Chapter Overview The atmosphere and the ocean are one independent system. Earth has seasons because of the tilt on its axis. There are three major wind belts in each hemisphere.
Investigation of the effects of horizontal gradients of trace gases, aerosols and clouds on the validation of tropospheric TROPOMI products (TROPGRAD)
") Investigation of the effects of horizontal gradients of trace gases, aerosols and clouds on the validation of tropospheric TROPOMI products (TROPGRAD) T. Wagner, J. Remmers, S. Beirle, Y. Wang MPI for
Investigation of the effects of horizontal gradients of trace gases, aerosols and clouds on the validation of tropospheric TROPOMI products (TROPGRAD) T. Wagner, J. Remmers, S. Beirle, Y. Wang MPI for
Change of Dew Point Temperature and Density of Saturated Water Vapor with High and its Impact on Cloud Cover
 IOSR Journal of Engineering (IOSRJEN) ISSN (e): 2250-3021, ISSN (p): 2278-8719 Vol. 06, Issue 01 (January. 2016), V1 PP 06-13 www.iosrjen.org Change of Dew Point Temperature and Density of Saturated Water
Climate Variability Natural and Anthropogenic
 Climate Variability Natural and Anthropogenic Jim Renwick NIWA Climate Research j.renwick@niwa.co.nz Climate equilibrium and climate forcings Natural forcings Anthropogenic forcings Feedbacks Natural variability
Overview on UV-Vis satellite work
 Overview on UV-Vis satellite work Where we are and what possible directions are? M. Van Roozendael Belgian Institute for Space Aeronomy ACCENT AT-2 Follow up meeting, MPI Mainz, Germany, 22-23 June 2009
Lecture 2: Global Energy Cycle
 Lecture 2: Global Energy Cycle Planetary energy balance Greenhouse Effect Selective absorption Vertical energy balance Solar Flux and Flux Density Solar Luminosity (L) the constant flux of energy put out
Solar Flux and Flux Density. Lecture 2: Global Energy Cycle. Solar Energy Incident On the Earth. Solar Flux Density Reaching Earth
 Lecture 2: Global Energy Cycle Solar Flux and Flux Density Planetary energy balance Greenhouse Effect Selective absorption Vertical energy balance Solar Luminosity (L) the constant flux of energy put out
2. Energy Balance. 1. All substances radiate unless their temperature is at absolute zero (0 K). Gases radiate at specific frequencies, while solids
. Gases radiate at specific frequencies, while solids") I. Radiation 2. Energy Balance 1. All substances radiate unless their temperature is at absolute zero (0 K). Gases radiate at specific frequencies, while solids radiate at many Click frequencies, to edit
I. Radiation 2. Energy Balance 1. All substances radiate unless their temperature is at absolute zero (0 K). Gases radiate at specific frequencies, while solids radiate at many Click frequencies, to edit
COURSE CLIMATE SCIENCE A SHORT COURSE AT THE ROYAL INSTITUTION
 COURSE CLIMATE SCIENCE A SHORT COURSE AT THE ROYAL INSTITUTION DATE 4 JUNE 2014 LEADER CHRIS BRIERLEY Course Outline 1. Current climate 2. Changing climate 3. Future climate change 4. Consequences 5. Human
Earth s Energy Budget: How Is the Temperature of Earth Controlled?
 1 NAME Investigation 2 Earth s Energy Budget: How Is the Temperature of Earth Controlled? Introduction As you learned from the reading, the balance between incoming energy from the sun and outgoing energy
Dynamical. regions during sudden stratospheric warming event (Case study of 2009 and 2013 event)
") Dynamical Coupling between high and low latitude regions during sudden stratospheric warming event (Case study of 2009 and 2013 event) Vinay Kumar 1,S. K. Dhaka 1,R. K. Choudhary 2,Shu-Peng Ho 3,M. Takahashi
Dynamical Coupling between high and low latitude regions during sudden stratospheric warming event (Case study of 2009 and 2013 event) Vinay Kumar 1,S. K. Dhaka 1,R. K. Choudhary 2,Shu-Peng Ho 3,M. Takahashi
Why build a climate model
 Climate Modeling Why build a climate model Atmosphere H2O vapor and Clouds Absorbing gases CO2 Aerosol Land/Biota Surface vegetation Ice Sea ice Ice sheets (glaciers) Ocean Box Model (0 D) E IN = E OUT
NATURAL CLIMATIC FORCING Part II
 TOPIC #12 NATURAL CLIMATIC FORCING Part II (p 72 in Class Notes) Today we will focus on the third main driver of NATURAL CLIMATIC FORCING: 1) ATRONOMICAL FORCING 2) SOLAR FORCING 3) VOLCANIC FORCING VOLCANIC
Meteorology Pretest on Chapter 2
 Meteorology Pretest on Chapter 2 MULTIPLE CHOICE 1. The earth emits terrestrial radiation a) only at night b) all the time c) only during winter d) only over the continents 2. If an imbalance occurs between
Course Outline CLIMATE SCIENCE A SHORT COURSE AT THE ROYAL INSTITUTION. 1. Current climate. 2. Changing climate. 3. Future climate change
 COURSE CLIMATE SCIENCE A SHORT COURSE AT THE ROYAL INSTITUTION DATE 4 JUNE 2014 LEADER CHRIS BRIERLEY Course Outline 1. Current climate 2. Changing climate 3. Future climate change 4. Consequences 5. Human
Global warming and Extremes of Weather. Prof. Richard Allan, Department of Meteorology University of Reading
 Global warming and Extremes of Weather Prof. Richard Allan, Department of Meteorology University of Reading Extreme weather climate change Recent extreme weather focusses debate on climate change Can we
A) usually less B) dark colored and rough D) light colored with a smooth surface A) transparency of the atmosphere D) rough, black surface
 usually less B) dark colored and rough D) light colored with a smooth surface A) transparency of the atmosphere D) rough, black surface") 1. Base your answer to the following question on the diagram below which shows two identical houses, A and B, in a city in North Carolina. One house was built on the east side of a factory, and the other
1. Base your answer to the following question on the diagram below which shows two identical houses, A and B, in a city in North Carolina. One house was built on the east side of a factory, and the other
Simulation of UV-VIS observations
 Simulation of UV-VIS observations Hitoshi Irie (JAMSTEC) Here we perform radiative transfer calculations for the UV-VIS region. In addition to radiance spectra at a geostationary (GEO) orbit, air mass
Climate Dynamics (PCC 587): Feedbacks & Clouds
: Feedbacks & Clouds") Climate Dynamics (PCC 587): Feedbacks & Clouds DARGAN M. W. FRIERSON UNIVERSITY OF WASHINGTON, DEPARTMENT OF ATMOSPHERIC SCIENCES DAY 6: 10-14-13 Feedbacks Climate forcings change global temperatures directly
Climate Dynamics (PCC 587): Feedbacks & Clouds DARGAN M. W. FRIERSON UNIVERSITY OF WASHINGTON, DEPARTMENT OF ATMOSPHERIC SCIENCES DAY 6: 10-14-13 Feedbacks Climate forcings change global temperatures directly
Warming Earth and its Atmosphere The Diurnal and Seasonal Cycles
 Warming Earth and its Atmosphere The Diurnal and Seasonal Cycles Or, what happens to the energy received from the sun? First We Need to Understand The Ways in Which Heat Can be Transferred in the Atmosphere
Detection of ship NO 2 emissions over Europe from satellite observations
 Detection of ship NO 2 emissions over Europe from satellite observations Huan Yu DOAS seminar 24 April 2015 Ship Emissions to Atmosphere Reporting Service (SEARS project) Outline Introduction Shipping
Key Feedbacks in the Climate System
 Key Feedbacks in the Climate System With a Focus on Climate Sensitivity SOLAS Summer School 12 th of August 2009 Thomas Schneider von Deimling, Potsdam Institute for Climate Impact Research Why do Climate
Climate Models & Climate Sensitivity: A Review
 Climate Models & Climate Sensitivity: A Review Stroeve et al. 2007, BBC Paul Kushner Department of Physics, University of Toronto Recent Carbon Dioxide Emissions 2 2 0 0 0 0 7 6 x x Raupach et al. 2007
Diagnosis of Relative Humidity Changes in a Warmer Climate Using Tracers of Last Saturation
 Diagnosis of Relative Humidity Changes in a Warmer Climate Using Tracers of Last Saturation 8 March, 2011 Jonathon Wright Department of Applied Mathematics & Theoretical Physics University of Cambridge
The assimilation of AMSU and SSM/I brightness temperatures in clear skies at the Meteorological Service of Canada
 The assimilation of AMSU and SSM/I brightness temperatures in clear skies at the Meteorological Service of Canada Abstract David Anselmo and Godelieve Deblonde Meteorological Service of Canada, Dorval,
Climate changes in Finland, but how? Jouni Räisänen Department of Physics, University of Helsinki
 Climate changes in Finland, but how? Jouni Räisänen Department of Physics, University of Helsinki 19.9.2012 Outline Some basic questions and answers about climate change How are projections of climate
DOAS UV/VIS minor trace gases from SCIAMACHY
 DOAS UV/VIS minor trace gases from SCIAMACHY Rüdiger de Beek, Andreas Richter, John P. Burrows Inst. of Environm. Physics, University of Bremen, Otto-Hahn-Allee 1, D-28359 Bremen, Germany, Email: ruediger.de_beek@iup.physik.uni-bremen.de
Lecture 10: Climate Sensitivity and Feedback
 Lecture 10: Climate Sensitivity and Feedback Human Activities Climate Sensitivity Climate Feedback 1 Climate Sensitivity and Feedback (from Earth s Climate: Past and Future) 2 Definition and Mathematic
Chapter 2. Heating Earth's Surface & Atmosphere
 Chapter 2 Heating Earth's Surface & Atmosphere Topics Earth-Sun Relationships Energy, Heat and Temperature Mechanisms of Heat Transfer What happens to Incoming Solar Radiation? Radiation Emitted by the
The ocean s overall role in climate
 The ocean s overall role in climate - moderates climate in time (diurnally, annually) - redistributes heat spatially in the largescale ocean circulation - lower albedo (sea ice higher albedo) - dry atmosphere
Insolation and Temperature variation. The Sun & Insolation. The Sun (cont.) The Sun
 The Sun") Insolation and Temperature variation Atmosphere: blanket of air surrounding earth Without our atmosphere: cold, quiet, cratered place Dynamic: currents and circulation cells June 23, 2008 Atmosphere important
Insolation and Temperature variation Atmosphere: blanket of air surrounding earth Without our atmosphere: cold, quiet, cratered place Dynamic: currents and circulation cells June 23, 2008 Atmosphere important