Playing with the AnIMLs: Demonstrations of AnIML Generic Viewers. Gary W. Kramer
|
|
|
- Alberta Stewart
- 5 years ago
- Views:
Transcription


1 < AnIML > Playing with the AnIMLs: Demonstrations of AnIML Generic Viewers < / AnIML > Gary W. Kramer Biochemical Science Division National Institute of Standards and Technology
2 AnIML AnIML Provides Structures to Organize Result Data and Metadata from Simple to Complex Analytical Chemistry Experiments AnIML is the Only Analytical Data Structure to Support Fully Multidetector, Multi-dimensional, Multi-sample, Multi-step, Multisequence Analytical Procedures in a Single File Format AnIML 1.0 Supports Sample Data, Raw Analytical Data, Data- Acquisition Parameters, Processed Analytical Data, Data- Processing Parameters, Trace Forming, and Peak Tables
3 What Does AnIML Provide? AnIML Provides Data Structures to Organize the Data from any Analytical Experiment AnIML Provides Markup (or Tags) to Identify the Content of any Analytical Data

4 Some AnIML Files are Simple

5 Some AnIML Files are Complex
6 General AnIML File Organization AnIML File Header Samples Sample ID, Container, Location, & Properties Experiment Steps Technique Used Infrastructure Method Author Instrument Properties Antecedent Instrument Parameters Result Independent Dependent Measured Instrument Parameters Audit Trail Log Entry Signatures
7 How is an AnIML File Organized? The Answer is that it Depends to Some Extent on how the Writer of the AnIML File Thinks about the Experiment and the Data There are Wrong Ways, and Validator Programs should Find the Errors But, there is No Single "Right" Way Consider how Two Spectroscopists "See" an ICP-MS Instrument: The Atomic Spectroscopist Thinks of it as an Atomic Emission Spectrometer with a Fancy Detector The Mass Spectroscopist Thinks of it as a Mass Spectrometer with a Fancy Inlet System
8 Eliminating Redundancy with Templates Components of Multi-step, Multi-sequence or Multidimensional Datasets often Contain Redundant Information For Example, Each Spectrum in a Set of Spectra may Share Common Wavelength Axis Parameters or Samples may Share Common Property Descriptions AnIML Utilizes a Data Structure Called a Template to Record such Common Parameters Templates may be Referenced Subsequently in lieu of Repetitively Recording the Redundant Data In an AnIML File Templates must be Declared and Populated before being Referenced

9 What is a Sample?


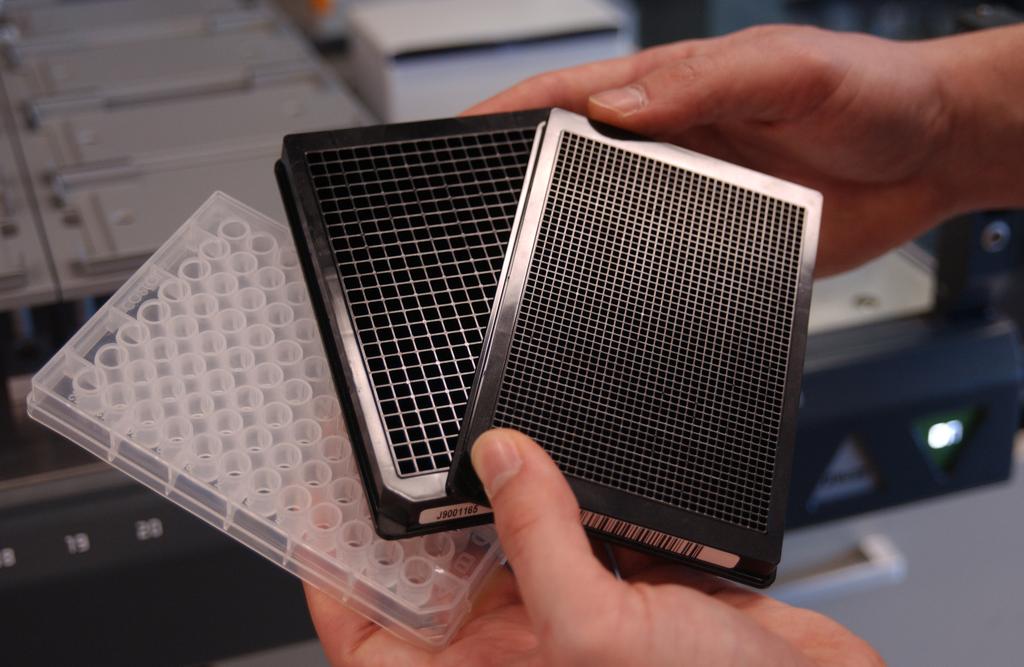


10 Today's Samples Can be Complex Racks and Arrays of Individual Vials Molded Arrays of Vials a.k.a Microplates Spotted Arrays on Glass Slides a.k.a. Microarrays Spotted Arrays Inside Microplate Wells

11 Consider a Microplate How Many Samples Does a Microplate Represent? 96 Different Samples? A Single Sample? Something in Between? AnIML does NOT Force the Answer to this Question The Answer is Up to the Writer of the AnIML File It Depends on How Scientists "See" their Data
12 Dealing with Samples Samples may be: Individual (Single Vial, Single Bottle) Containerized (Racks, Microtiter Plates, Arrays) Containerized Samples may be: Simple Vials in Rack Wells in Microtiter Plates Spots on Arrays Compound Discrete with Prescribed Coordinates Racks Microtiter Plates Spots on Arrays Non-discrete with Relative Coordinates Bands in Gels Points on Surfaces Spots on Arrays Experiment Steps may Act on: Individual Samples Individual Samples within a Container Containerized Samples as a Whole Container Sample 1 Coordinates iscontainer containertype ID Barcode Sample 2 Coordinates Sample n Coordinates
13 Analytical Data Sequences: Kinetics Time min Starting Material Wavelength nm Product AnIML Handles Data Sequences Using a Concept Called Indexing An Index may be a Sequence Number, a Variable Quantity (such as Time, Pressure, Spatial Location, or ph), or an Analytical Technique In this Example: Index Variable (Time) is the Primary Independent Axis Wavelength Variable is the Secondary Independent Axis Intensity is the Dependent Axis The Data can be Considered to be an Array of UV-Vis Spectra Indexed by Time To Generate the Kinetics Plot, the Array is Cross-Cut at the Absorbance Peak Wavelengths to Determine the Data Relating to the Starting Material and Product Concentrations
, or an Analytical Technique In this Example: Index Variable (Excitation Wavelength) is the Primary Independent Axis Emission Wavelength Variable is the Secondary Independent Axis Fluorescence")
14 Multi-Dimensional Data: Fluorescence EEM AnIML Handles Data Sequences Using an Indexing Concept An Index may be a Sequence Number, a Variable Quantity (such as Time, Pressure, Spatial Location, or ph), or an Analytical Technique In this Example: Index Variable (Excitation Wavelength) is the Primary Independent Axis Emission Wavelength Variable is the Secondary Independent Axis Fluorescence Intensity is the Dependent Axis The Data can be Considered to be an Array of Fluorescence Emission Spectra Indexed by Excitation Wavelength To Generate an Excitation Spectrum, the Array is Cross-Cut at an Emission Wavelength

 is the Secondary Independent Axis Fluorescence Intensity is the Dependent Axis The Data can be Considered to be a")
15 Multi-Dimensional Data: Spatial Fluorescence High! Signal intensity! Low! AnIML Handles Data Sequences Using an Indexing Concept An Index may be a Sequence Number, a Variable Quantity (such as Time, Pressure, Spatial Location, or ph), or an Analytical Technique In this Example: Index Variable (X-position) is the Primary Independent Axis Index Variable (Y-position) is the Secondary Independent Axis Fluorescence Intensity is the Dependent Axis The Data can be Considered to be a Spatial Array of Fluorescence Emission Intensities Mark Schena
16 Holmium Oxide UV-Vis Spectrum AnIML File AnIML File Header Sample Set Sample & Sample Properties Reference & Reference Properties Experiment Step Set UV-Vis Technique Infrastructure Sample ID Method Author Instrument Properties Result Independent - Wavelength Auto Increment Value Set Start 700 nm by -1 nm Dependent - Absorbance Encoded Value Set Audit Trail Log Entry
17 p-chloroaniline IR AnIML File AnIML File Header Sample Set Sample & Sample Properties Experiment Step Set IR Technique Infrastructure Sample ID Method Author Instrument Properties Result Dependent - Transmittance Individual Value Set Independent - Wavelength Auto Increment Set Start 400 cm -1 by 2 cm -1 Audit Trail Log Entry Signature Set Signatures
18 LC-UV (PDA) AnIML file AnIML File Header Sample Set Sample & Sample Properties Experiment Step Set Template (UV-Vis Time Course) Independent - Time Individual Value Set UV-Vis Time Course Dependent Intensity Encoded Value Set Chromatography Technique Infrastructure Method Result Individual Value Set Time = 0.0 Experiment Step Set Template UV-Vis Technique ***Infrastructure Method Result Independent - Wavelength Encoded Value Set UV-Vis Infrastructure Result ParentDatapointReference Value = 0.01 Dependent - Intensity Encoded Value Set. Encoded Value Set UV-Vis Infrastructure Result ParentDatapointReference Value = 2.00 Dependent - Intensity Encoded Value Set
BIOLIGHT STUDIO IN ROUTINE UV/VIS SPECTROSCOPY
 BIOLIGHT STUDIO IN ROUTINE UV/VIS SPECTROSCOPY UV/Vis Spectroscopy is a technique that is widely used to characterize, identify and quantify chemical compounds in all fields of analytical chemistry. The
3) In CE separation is based on what two properties of the solutes? (3 pts)
 In CE separation is based on what two properties of the solutes? (3 pts)") Final Exam Chem 311 Fall 2002 December 16 Name 1) (3 pts) In GC separation is based on the following two properties of the solutes a) polarity and size b) vapor pressure and molecular weight c) vapor pressure
Final Exam Chem 311 Fall 2002 December 16 Name 1) (3 pts) In GC separation is based on the following two properties of the solutes a) polarity and size b) vapor pressure and molecular weight c) vapor pressure
Chromatography & instrumentation in Organic Chemistry
 Chromatography & instrumentation in Organic Chemistry What is Chromatography? Chromatography is a technique for separating mixtures into their components in order to analyze, identify, purify, and/or quantify
Partial Energy Level Diagrams
 Partial Energy Level Diagrams 460 nm 323 nm 610 nm 330 nm 819 nm 404 nm 694 nm 671 nm 589 / 590 nm 767 / 769 nm Lithium Sodium Potassium Gas Mixtures Maximum Temperatures, C Air-Coal Gas 1825 Air-Propane
Reflection = EM strikes a boundary between two media differing in η and bounces back
 Reflection = EM strikes a boundary between two media differing in η and bounces back Incident ray θ 1 θ 2 Reflected ray Medium 1 (air) η = 1.00 Medium 2 (glass) η = 1.50 Specular reflection = situation
Chapter 18. Fundamentals of Spectrophotometry. Properties of Light
 Chapter 18 Fundamentals of Spectrophotometry Properties of Light Electromagnetic Radiation energy radiated in the form of a WAVE caused by an electric field interacting with a magnetic field result of
Infrared Spectroscopy: Identification of Unknown Substances
 Infrared Spectroscopy: Identification of Unknown Substances Suppose a white powder is one of the four following molecules. How can they be differentiated? H N N H H H H Na H H H H H A technique that is
HPLC. High Performance Liquid Chromatography (HPLC) Harris Chapter 25
 Harris Chapter 25") High Performance Liquid Chromatography (HPLC) Harris Chapter 25 12/1/2005 Chem 253 - Chapter 25 1 HPLC Separation of nonvolatile or thermally unstable compounds. If the analyte/sample can be found to be
High Performance Liquid Chromatography (HPLC) Harris Chapter 25 12/1/2005 Chem 253 - Chapter 25 1 HPLC Separation of nonvolatile or thermally unstable compounds. If the analyte/sample can be found to be
FLAME PHOTOMETRY AIM INTRODUCTION
 FLAME PHOTOMETRY AIM INTRODUCTION Atomic spectroscopy is based on the absorption, emission or fluorescence process of light by atoms or elementary ions. Information for atomic scale is obtained in two
Chemistry Instrumental Analysis Lecture 18. Chem 4631
 Chemistry 4631 Instrumental Analysis Lecture 18 Instrumentation Radiation sources Hollow cathode lamp Most common source Consist of W anode and a cathode sealed in a glass tube filled with Ne or Ar. Hollow
Behavior and Energy States of Photogenerated Charge Carriers
 S1 Behavior and Energy States of Photogenerated Charge Carriers on Pt- or CoOx-loaded LaTiO2N Photocatalysts: Time-resolved Visible to mid-ir Absorption Study Akira Yamakata, 1,2* Masayuki Kawaguchi, 1
Understanding Your Spectra Module. Agilent OpenLAB CDS ChemStation Edition
 Understanding Your Spectra Module Agilent OpenLAB CDS ChemStation Edition Notices Agilent Technologies, Inc. 1994-2012, 2013 No part of this manual may be reproduced in any form or by any means (including
GS Analysis of Microarray Data
 GS01 0163 Analysis of Microarray Data Keith Baggerly and Kevin Coombes Section of Bioinformatics Department of Biostatistics and Applied Mathematics UT M. D. Anderson Cancer Center kabagg@mdanderson.org
Handling Human Interpreted Analytical Data. Workflows for Pharmaceutical R&D. Presented by Peter Russell
 Handling Human Interpreted Analytical Data Workflows for Pharmaceutical R&D Presented by Peter Russell 2011 Survey 88% of R&D organizations lack adequate systems to automatically collect data for reporting,
SEAMLESS INTEGRATION OF MASS DETECTION INTO THE UV CHROMATOGRAPHIC WORKFLOW
 SEAMLESS INTEGRATION OF MASS DETECTION INTO THE UV CHROMATOGRAPHIC WORKFLOW Paula Hong, John Van Antwerp, and Patricia McConville Waters Corporation, Milford, MA, USA Historically UV detection has been
GS Analysis of Microarray Data
 GS01 0163 Analysis of Microarray Data Keith Baggerly and Kevin Coombes Section of Bioinformatics Department of Biostatistics and Applied Mathematics UT M. D. Anderson Cancer Center kabagg@mdanderson.org
3590/ Laboratory
 3590/3550 - Laboratory Time: Monday to Thursday 2:30 5:30 Location: 318 Parker Bldg. Five two week labs must be completed. Two students per experiment. Individual lab reports, sharing same data. There
Research Equipment in the UCA Chemistry Department
 Research Equipment in the UCA Chemistry Department Varian 220 Atomic Absorption Spectrometer Atomic Absorption spectroscopy is used to measure the amount of a metal ion present in a solution. It is particularly
IR Biotyper. Innovation with Integrity. Microbial typing for real-time epidemiology FT-IR
 IR Biotyper Microbial typing for real-time epidemiology Innovation with Integrity FT-IR IR Biotyper - Proactive hospital hygiene and infection control Fast, easy-to-apply and economical typing methods
Supporting Information. for
 Supporting Information for Near-Infrared Fluorescent Turn-On Probe with a Remarkable Large Stokes Shift for Imaging Selenocysteine in Living Cells and Animals Weiyong Feng, Meixing Li, Yao Sun, and Guoqiang
two slits and 5 slits
 Electronic Spectroscopy 2015January19 1 1. UV-vis spectrometer 1.1. Grating spectrometer 1.2. Single slit: 1.2.1. I diffracted intensity at relative to un-diffracted beam 1.2.2. I - intensity of light
Emission of Light & Atomic Models 1
 Emission of Light & Atomic Models 1 Objective At the end of this activity you should be able to: o Explain what photons are, and be able to calculate their energies given either their frequency or wavelength.
Ziessel a* Supporting Information (75 pages) Table of Contents. 1) General Methods S2
 Table of Contents. 1) General Methods S2") S1 Chemistry at Boron: Synthesis and Properties of Red to Near-IR Fluorescent Dyes based on Boron Substituted Diisoindolomethene Frameworks Gilles Ulrich, a, * Sebastien Goeb a, Antoinette De Nicola a,
S1 Chemistry at Boron: Synthesis and Properties of Red to Near-IR Fluorescent Dyes based on Boron Substituted Diisoindolomethene Frameworks Gilles Ulrich, a, * Sebastien Goeb a, Antoinette De Nicola a,
Varian Galaxie Chromatography Data System for Preparative HPLC
 Varian Galaxie Chromatography Data System for Preparative HPLC By Gary Burce Varian, Inc. 2700 Mitchell Drive, Walnut Creek, CA 95498 USA Abstract Galaxie is an ideal chromatography data system for the
Session #1: Theoretical background and computer simulations of molecular vibrations.
 Raman Spectroscopy Session #1: Theoretical background and computer simulations of molecular vibrations. Goals: Understand the origin of the Raman effect. Understand the vibrational normal modes of molecules.
Quick Review. 1. Kinetic Molecular Theory. 2. Average kinetic energy and average velocity. 3. Graham s Law of Effusion. 4. Real Gas Behavior.
 Quick Review 1. Kinetic Molecular Theory. 2. Average kinetic energy and average velocity. 3. Graham s Law of Effusion. 4. Real Gas Behavior. Emission spectra Every element has a unique emission spectrum
4. How can fragmentation be useful in identifying compounds? Permits identification of branching not observed in soft ionization.
 Homework 9: Chapters 20-21 Assigned 12 April; Due 17 April 2006; Quiz on 19 April 2006 Chap. 20 (Molecular Mass Spectroscopy) Chap. 21 (Surface Analysis) 1. What are the types of ion sources in molecular
Ultraviolet-Visible Spectroscopy
 Ultraviolet-Visible Spectroscopy Introduction to UV-Visible Absorption spectroscopy from 160 nm to 780 nm Measurement of transmittance Conversion to absorbance * A=-logT=εbc Measurement of transmittance
CHARACTERIZATION of NANOMATERIALS KHP
 CHARACTERIZATION of NANOMATERIALS Overview of the most common nanocharacterization techniques MAIN CHARACTERIZATION TECHNIQUES: 1.Transmission Electron Microscope (TEM) 2. Scanning Electron Microscope
Light carries energy. Lecture 5 Understand Light. Is light. Light as a Particle. ANSWER: Both.
 Light carries energy Lecture 5 Understand Light Reading: Chapter 6 You feel energy carried by light when light hits your skin. Energy Conservation: Radiation energy will be given to molecules making your
atomic absorption spectroscopy general can be portable and used in-situ preserves sample simpler and less expensive
 Chapter 9: End-of-Chapter Solutions 1. The following comparison provides general trends, but both atomic absorption spectroscopy (AAS) and atomic absorption spectroscopy (AES) will have analyte-specific
CHROMATOGRAPHY. The term "chromatography" is derived from the original use of this method for separating yellow and green plant pigments.
 CHROMATOGRAPHY The term "chromatography" is derived from the original use of this method for separating yellow and green plant pigments. THEORY OF CHROMATOGRAPHY: Separation of two sample components in
New Developments in Raman Spectroscopic Analysis
 New Developments in Raman Spectroscopic Analysis Mike Kayat B&W Tek, Inc 19 Shea Way Newark, DE 19713 United States of America +1 302 368 7824 mikek@bwtek.com 1 Overview Raman spectroscopy is now an established
MassHunter Software Overview
 MassHunter Software Overview 1 Qualitative Analysis Workflows Workflows in Qualitative Analysis allow the user to only see and work with the areas and dialog boxes they need for their specific tasks A
Supplementary Materials for
 Supplementary Materials for Colour-Tunable Fluorescent Multiblock Micelles Zachary M. Hudson, David J. Lunn, Mitchell A. Winnik,* Ian Manners* *To whom correspondence should be addressed. E-mail: mwinnik@chem.utoronto.ca
Spectroscopy Problem Set February 22, 2018
 Spectroscopy Problem Set February, 018 4 3 5 1 6 7 8 1. In the diagram above which of the following represent vibrational relaxations? 1. Which of the following represent an absorbance? 3. Which of following
Ultraviolet-Visible and Infrared Spectrophotometry
 Ultraviolet-Visible and Infrared Spectrophotometry Ahmad Aqel Ifseisi Assistant Professor of Analytical Chemistry College of Science, Department of Chemistry King Saud University P.O. Box 2455 Riyadh 11451
LC-MS Based Metabolomics
 LC-MS Based Metabolomics Analysing the METABOLOME 1. Metabolite Extraction 2. Metabolite detection (with or without separation) 3. Data analysis Metabolite Detection GC-MS: Naturally volatile or made volatile
Analytical Technologies in Biotechnology Prof. Dr. Ashwani K. Sharma Department of Biotechnology Indian Institute of Technology, Roorkee
 Analytical Technologies in Biotechnology Prof. Dr. Ashwani K. Sharma Department of Biotechnology Indian Institute of Technology, Roorkee Module - 6 Spectroscopic Techniques Lecture - 6 Atomic Spectroscopy
Chapter 17: Fundamentals of Spectrophotometry
 Chapter 17: Fundamentals of Spectrophotometry Spectroscopy: the science that deals with interactions of matter with electromagnetic radiation or other forms energy acoustic waves, beams of particles such
Evaluating Labsphere s new UV-2000
 Ciba Grenzach GmbH Optical Spectroscopy Sabrina Siegle Dr. Wolfgang Schlenker Tel. +49 76 24 / 12-28 13 E-mail wolfgang.schlenker@ciba.com May 26, 9 Evaluating Labsphere s new UV- Abstract Labsphere s
Telescopes... Light Buckets
 Telescopes... Light Buckets Now that we have an understanding of what light is and why it s important to astronomy, what tools are required to study light from distant objects? The telescope is the tool
Clinical Chemistry (CHE221) Professor Hicks Week 7. Endpoint vs Kinetic Techniques. Instrumentation and Assay techniques
 Professor Hicks Week 7. Endpoint vs Kinetic Techniques. Instrumentation and Assay techniques") Clinical Chemistry (CHE221) Professor Hicks Week 7 Instrumentation and Assay techniques Endpoint vs Kinetic Techniques two different approaches to analyzing for a substance Endpoint methods use all the
Clinical Chemistry (CHE221) Professor Hicks Week 7 Instrumentation and Assay techniques Endpoint vs Kinetic Techniques two different approaches to analyzing for a substance Endpoint methods use all the
UV-Vis optical fiber assisted spectroscopy in thin films and solutions
 UV-Vis optical fiber assisted spectroscopy in thin films and solutions Description UV-Visible absorption and transmission spectra provide fundamental information for all experiments related to the attenuation
Electronic Supplementary Information
 Electronic Supplementary Information Surfactant-free single-nano-sized colloidal Cu nanoparticles for use as an active catalyst of Ullmann-coupling reaction Yuto Isomura, a Takashi Narushima, b Hideya
Practice Problems on Chromophores
 hromophores.1 Practice Problems on hromophores 1. Which one of the following compounds is visibly colored? 2. Which one of the following molecules is most likely to be colored? a 3 S H H H (H 3 ) 2 H H
Wavelength Optimization Review. ELM; January 26, 2004
 Wavelength Optimization Review ELM; January 26, 2004 Optimization of a red fluorophore with a small Stokes shift For this demo, I chose a fluorophore with Ex/Em somewhere in mid 600 s Small Stokes shift
IR SPECTROSCOPY FOR BONDING SURFACE CONTAMINATION CHARACTERIZATION
 IR SPECTROSCOPY FOR BONDING SURFACE CONTAMINATION CHARACTERIZATION INTRODUCTION Lee H. Pearson Thiokol Corporation Advanced Technology Brigham City, Utah 8432-77 Organic contaminants such as hydrocarbons
Particle Analysis of Environmental Swipe Samples
 IAEA-SM-367/10/07 Particle Analysis of Environmental Swipe Samples D. DONOHUE, S. VOGT, A. CIURAPINSKI, F. RUEDENAUER, M. HEDBERG Safeguards Analytical Laboratory International Atomic Energy Agency Vienna,
Chapter 17: Fundamentals of Spectrophotometry
 Chapter 17: Fundamentals of Spectrophotometry Spectroscopy: the science that deals with interactions of matter with electromagnetic radiation or other forms energy acoustic waves, beams of particles such
1 WHAT IS SPECTROSCOPY?
 1 WHAT IS SPECTROSCOPY? 1.1 The Nature Of Electromagnetic Radiation Anyone who has been sunburnt will know that light packs a punch: in scientific terms, it contains considerable amounts of energy. All
Fingerprinting the Stars Lab (Sarah Hansen & Monica Valluri)
") Fingerprinting the Stars Lab (Sarah Hansen & Monica Valluri) Introduction Every element produces a unique fingerprint of spectral lines. By identifying the spectral features in stellar spectra, we can
Fingerprinting the Stars Lab (Sarah Hansen & Monica Valluri) Introduction Every element produces a unique fingerprint of spectral lines. By identifying the spectral features in stellar spectra, we can
The Fundamentals of Spectroscopy: Theory BUILDING BETTER SCIENCE AGILENT AND YOU
 The Fundamentals of Spectroscopy: Theory BUILDING BETTER SCIENCE AGILENT AND YOU 1 Agilent is committed to the educational community and is willing to provide access to company-owned material. This slide
Electromagnetic Radiation and Scientific Instruments. PTYS April 1, 2008
 Electromagnetic Radiation and Scientific Instruments PTYS 206-2 April 1, 2008 Announcements Deep Impact 6 PM Wednesday Night Pizza, no beer Watch at home if you can t watch here. It will be discussed in
Ultraviolet-Visible and Infrared Spectrophotometry
 Ultraviolet-Visible and Infrared Spectrophotometry Ahmad Aqel Ifseisi Assistant Professor of Analytical Chemistry College of Science, Department of Chemistry King Saud University P.O. Box 2455 Riyadh 11451
AUTOMATED CHROMATOGRAPHY SYSTEMS. Featuring EZ Prep
 AUTOMATED CHROMATOGRAPHY SYSTEMS Featuring EZ Prep CombiFlash EZ Prep built on a strong history of chromatography innovations The CombiFlash EZ Prep system is the latest innovation from Teledyne Isco.
PhET Simulation Exploration Models of the Hydrogen Atom
 Name Period Date PhET Simulation Exploration Models of the Hydrogen Atom http://phet.colorado.edu/simulations/sims.php?sim=models_of_the_hydrogen_atom Tie to Planck and Quanta Overview One of the most
Chemistry 524--Final Exam--Keiderling May 4, :30 -?? pm SES
 Chemistry 524--Final Exam--Keiderling May 4, 2011 3:30 -?? pm -- 4286 SES Please answer all questions in the answer book provided. Calculators, rulers, pens and pencils are permitted. No open books or
Utilizing ELSD and MS as Secondary Detectors for Prep HPLC and Flash Chromatography. Tips and Techniques to Optimize ELSD and MS based Purification
 Utilizing ELSD and MS as Secondary Detectors for Prep HPLC and Flash Chromatography Tips and Techniques to Optimize ELSD and MS based Purification Utilizing ELSD and MS as Secondary Detectors for Prep
PAPER No. 12: ORGANIC SPECTROSCOPY MODULE No. 7: Instrumentation for IR spectroscopy
 KNOW MORE Web links https://en.wikipedia.org/wiki/infrared_ http://hiq.lindegas.com/en/analytical_methods/infrared_/non_dispersive_infrared.html http://blamp.sites.truman.edu/files/2012/11/322-ir-and-ftir.pdf
OES - Optical Emission Spectrometer 2000
 OES - Optical Emission Spectrometer 2000 OES-2000 is used to detect the presence of trace metals in an analyte. The analyte sample is introduced into the OES-2000 as an aerosol that is carried into the
Chem 310 rd. 3 Homework Set Answers
 -1- Chem 310 rd 3 Homework Set Answers 1. A double line labeled S 0 represents the _ground electronic_ state and the _ground vibrational_ state of a molecule in an excitation state diagram. Light absorption
Basics of UV-Visible Spectroscopy *
 OpenStax-CNX module: m34525 1 Basics of UV-Visible Spectroscopy * Brittany L. Oliva-Chatelain Andrew R. Barron This work is produced by OpenStax-CNX and licensed under the Creative Commons Attribution
Instrumental Limitations for High Absorbance Measurements in Noise
 TECHNICAL NOTE Instrumental Limitations for High Absorbance Measurements in Noise UV/Vis/NIR Spectroscopy Author: Jeffrey L. Taylor, Ph.D. PerkinElmer, Inc. Shelton, CT Spectrophotometer Energy Using a
Lab 11: Must what goes in be the same as what comes out? Spectroscopy & Fluorescence in Chlorophyll.
 Lab 11: Must what goes in be the same as what comes out? Spectroscopy & Fluorescence in Chlorophyll. Introduction to Fluorescence: Fluorescence is one of the possible mechanisms for emission of light by
Introduction to Pharmaceutical Chemical Analysis
 Introduction to Pharmaceutical Chemical Analysis Hansen, Steen ISBN-13: 9780470661222 Table of Contents Preface xv 1 Introduction to Pharmaceutical Analysis 1 1.1 Applications and Definitions 1 1.2 The
DETERMINATION OF RELATIVE FLUORESCENCE QUANTUM YIELD USING THE AGILENT CARY ECLIPSE
 FOOD ANALYSIS DETERMINATION OF RELATIVE FLUORESCENCE QUANTUM YIELD USING THE AGILENT CARY ECLIPSE Solutions for Your Analytical Business Markets and Applications Programs Authors Sangeetha Ramesan Co-Authors
Fluorescence Visual Gel-separation of Dansylated BSA-protected Gold-Nanoclusters
 Fluorescence Visual Gel-separation of Dansylated BSA-protected Gold-Nanoclusters (Electronic Supporting Information) Hong-Wei Li, a,b Kelong Ai b and Yuqing Wu a * Experimental Section All chemicals were
Spectroscopy of Various Light Sources: The Interactions between Light and Matter ASTR 170B1, Spring 2017, Lab #2. 1 Introduction.
 Spectroscopy of Various Light Sources: The Interactions between Light and Matter ASTR 170B1, Spring 2017, Lab #2 DUE IN CLASS ON Thursday Sept 28! You CAN work in a group of 2, but you need only turn in
Atomic Spectra. d sin θ = mλ (1)
") Atomic Spectra Objectives: To measure the wavelengths of visible light emitted by atomic hydrogen and verify that the measured wavelengths obey the empirical Rydberg formula. To observe emission spectra
Atomic Spectra Objectives: To measure the wavelengths of visible light emitted by atomic hydrogen and verify that the measured wavelengths obey the empirical Rydberg formula. To observe emission spectra
John Ellison University of California, Riverside. Quarknet 2008 at UCR
 Cosmic Rays John Ellison University of California, Riverside Quarknet 2008 at UCR 1 What are Cosmic Rays? Particles accelerated in astrophysical sources incident on Earth s atmosphere Possible sources
Microwave-Assisted Synthesis of BSA-Protected Small Gold. Nanoclusters and Their Fluorescence-Enhanced Sensing of Silver(Ι) Ions
 Ions") Microwave-Assisted Synthesis of BSA-Protected Small Gold Nanoclusters and Their Fluorescence-Enhanced Sensing of Silver(Ι) Ions (Supporting Information) Yuan Yue, a,b Tian-Ying Liu, a Hong-Wei Li,* a Zhongying
Microwave-Assisted Synthesis of BSA-Protected Small Gold Nanoclusters and Their Fluorescence-Enhanced Sensing of Silver(Ι) Ions (Supporting Information) Yuan Yue, a,b Tian-Ying Liu, a Hong-Wei Li,* a Zhongying
Chemistry 524--Final Exam--Keiderling Dec. 12, pm SES
 Chemistry 524--Final Exam--Keiderling Dec. 12, 2002 --4-8 pm -- 238 SES Please answer all questions in the answer book provided. Calculators, rulers, pens and pencils are permitted plus one 8.5 x 11 sheet
Laboratory Exercise: Chromatographic Separation
 CHEM 109 Introduction to Chemistry Revision 1.0 Laboratory Exercise: Chromatographic Separation As we have discussed, chromatographic separations employ a system with two phases of matter; a mobile phase
Chemistry Lecture #25: Emission Spectra
 Chemistry Lecture #25: Emission Spectra We ve learned that electrons orbit the nucleus. We ve also learned that photons are a form of electromagnetic energy that has a frequency and wavelength. In today
Chem 454 instrumental Analysis Exam 1 February 6 th, 2008
 Chem 454 instrumental Analysis Exam 1 February 6 th, 2008 1 Name: 1] A glass electrode was immersed into a solution of ph 4.33 gave a response of 677.1 mv. This electrode was used to measure a sample solution
IntelliCal FAQ Revised 9/27/12
 IntelliCal FAQ Revised 9/27/12 IntelliCal Intelligent spectral calibration routine from Princeton Instruments, available with 64-bit LightField data acquisition software. Q. What is IntelliCal? Figure
P O G I L E L E C T R O N E N E R G Y A N D L I G H T
 South Pasadena Honors Chemistry Name 9 Atomic Structure Period Date Why? P O G I L E L E C T R O N E N E R G Y A N D L I G H T How does light reveal the behavior of electrons in an atom? From fireworks
HORIBA SPECTROFLUOROMETER CALIBRATION
 HORIBA SPECTROFLUOROMETER CALIBRATION Purpose of this Instrument: Essential tool for characterizing the relationship between absorbed and emitted photos at specified wavelengths. Location: 381 Chemistry
On the Polyol Synthesis of Silver Nanostructures: Glycolaldehyde as a Reducing Agent
 Supporting Information for: On the Polyol Synthesis of Silver Nanostructures: Glycolaldehyde as a Reducing Agent Sara E. Skrabalak, Benjamin J. Wiley, Munho Kim, Eric V. Formo and Younan Xia* Other Analytical
Jasco V-670 absorption spectrometer
 Laser Spectroscopy Labs Jasco V-670 absorption spectrometer Operation instructions 1. Turn ON the power switch on the right side of the spectrophotometer. It takes about 5 minutes for the light source
Product Descriptions and Offerings
 Product Descriptions and Offerings Teledyne Leeman Labs is a leading innovator of analytical instrumentation for elemental analysis. Laboratories in industries ranging from environmental science, oil and
Supporting Information
 Electronic Supplementary Material (ESI) for RSC Advances. This journal is The Royal Society of Chemistry 214 Supporting Information Rapid and sensitive detection of acrylic acid using a novel fluorescence
An insulin-sensing sugar-based fluorescent hydrogel
 Supplementary Information An insulin-sensing sugar-based fluorescent hydrogel Sankarprasad Bhuniya and Byeang yean Kim* ational Research Laboratory, Department of Chemistry, Division of Molecular and Life
Laboratory Exercise. Atomic Spectra A Kirchoff Potpourri
 1 Name: Laboratory Exercise Atomic Spectra A Kirchoff Potpourri Purpose: To examine the atomic spectra from several gas filled tubes and understand the importance of spectroscopy to astronomy. Introduction
Open the Beer s Law Lab simulation on your laptop or tablet:
 Name: BEER S LAW LAB Open the Beer s Law Lab simulation on your laptop or tablet: https://goo.gl/uwyi7p 1. Explore the controls in the Concentration screen of this sim for a few minutes. 2. Can the cation
Ionization Methods in Mass Spectrometry at the SCS Mass Spectrometry Laboratory
 Ionization Methods in Mass Spectrometry at the SCS Mass Spectrometry Laboratory Steven L. Mullen, Ph.D. Associate Director SCS Mass Spectrometry Laboratory Contact Information 31 oyes Laboratory (8:00-5:00
Lecture- 08 Emission and absorption spectra
 Atomic and Molecular Absorption Spectrometry for Pollution Monitoring Dr. J R Mudakavi Department of Chemical Engineering Indian Institute of Science, Bangalore Lecture- 08 Emission and absorption spectra
ACD/Labs Software Impurity Resolution Management. Presented by Peter Russell
 ACD/Labs Software Impurity Resolution Management Presented by Peter Russell Impurity Resolution Process Chemists Method Development Specialists Toxicology Groups Stability Groups Analytical Chemists 7/8/2016
High photostability and enhanced fluorescence of gold nanoclusters by silver doping-supporting information
 High photostability and enhanced fluorescence of gold nanoclusters by silver doping-supporting information Size measurements Figure S1 P2 FTIR measurements Figure S2 P2 XPS measurements Figure S3 P3 Photo-physical
Reference literature. (See: CHEM 2470 notes, Module 8 Textbook 6th ed., Chapters )
") September 17, 2018 Reference literature (See: CHEM 2470 notes, Module 8 Textbook 6th ed., Chapters 13-14 ) Reference.: https://slideplayer.com/slide/8354408/ Spectroscopy Usual Wavelength Type of Quantum
September 17, 2018 Reference literature (See: CHEM 2470 notes, Module 8 Textbook 6th ed., Chapters 13-14 ) Reference.: https://slideplayer.com/slide/8354408/ Spectroscopy Usual Wavelength Type of Quantum
Pre-Lab Exercises Lab 2: Spectroscopy
 Pre-Lab Exercises Lab 2: Spectroscopy 1. Which color of visible light has the longest wavelength? Name Date Section 2. List the colors of visible light from highest frequency to lowest frequency. 3. Does
Spectrophotometry. Introduction
 Spectrophotometry Spectrophotometry is a method to measure how much a chemical substance absorbs light by measuring the intensity of light as a beam of light passes through sample solution. The basic principle
Electronic Excitation by UV/Vis Spectroscopy :
 SPECTROSCOPY Light interacting with matter as an analytical tool III Pharm.D Department of Pharmaceutical Analysis SRM College Of Pharmacy,Katankulathur Electronic Excitation by UV/Vis Spectroscopy : X-ray:
Chromatography 1 of 26 Boardworks Ltd 2016
 Chromatography 1 of 26 Boardworks Ltd 2016 Chromatography 2 of 26 Boardworks Ltd 2016 What is chromatography? 3 of 26 Boardworks Ltd 2016 Different instrumental methods can be used to analyse and identify
EXPERIMENT 09 OBSERVATION OF SPECTRA
 EXPERIMENT 09 OBSERVATION OF SPECTRA INTRODUCTION: In physics, as in very other area of study, one of the most valuable questions a student can learn to ask is, How do they know that? Thus, when you read
VALLIAMMAI ENGINEERING COLLEGE SRM Nagar, Kattankulathur
 VALLIAMMAI ENGINEERING COLLEGE SRM Nagar, Kattankulathur 603 203 DEPARTMENT OF ELECTRONICS AND INSTRUMENTATION ENGINEERING QUESTION BANK V SEMESTER EI6501 Analytical Instruments Regulation 2013 Academic
1. Cyclic voltammetry involves the measurement of a diffusion controlled at an electrode in which the is controlled. (4 points)
") Chem 454 First Exam Feb. 20, 2002 1. Cyclic voltammetry involves the measurement of a diffusion controlled at an electrode in which the is controlled. (4 points) 2. (5 points) A. Sketch a cyclic voltammogram
Chem 454 First Exam Feb. 20, 2002 1. Cyclic voltammetry involves the measurement of a diffusion controlled at an electrode in which the is controlled. (4 points) 2. (5 points) A. Sketch a cyclic voltammogram
Skoog Chapter 6 Introduction to Spectrometric Methods
 Skoog Chapter 6 Introduction to Spectrometric Methods General Properties of Electromagnetic Radiation (EM) Wave Properties of EM Quantum Mechanical Properties of EM Quantitative Aspects of Spectrochemical
3 - Atomic Absorption Spectroscopy
 3 - Atomic Absorption Spectroscopy Introduction Atomic-absorption (AA) spectroscopy uses the absorption of light to measure the concentration of gas-phase atoms. Since samples are usually liquids or solids,