The Accuracy of Network Visualizations. Kevin W. Boyack SciTech Strategies, Inc.
|
|
|
- Gabriella Anthony
- 5 years ago
- Views:
Transcription
1 The Accuracy of Network Visualizations Kevin W. Boyack SciTech Strategies, Inc.
2 Overview Science mapping history Conceptual Mapping Early Bibliometric Maps Recent Bibliometric Maps Summary of Improvements Progress in Measuring Accuracy Accuracy of Relatedness Measures Accuracy of Maps Frontier issues How to increase accuracy further?
3 Science Mapping History : Conceptual maps Done by hand : Early bibliometric maps Using ISI database on citing-cited behavior in articles Method was limited by computer hardware, software and measures : Rapid improvements in bibliometric mappings Computer memory Dimensional reduction algorithms Improvements in measures Focus on accuracy


4 Conceptual Map: Bernal, 1939 John D. Bernal was a world renowned physicist, a historian of science, and a sociologist of science. He is considered to have produced one of the first maps of science. Bernal, J.D. (1939). The Social Function of Science. London: Routledge & Kegan Ltd.
 H. J. T. Ellingham, \"Divisions of Natural Science and Technology,\" Royal Society Scientific Information Conference, 21 June to 2 July 1948 London: Burlington House, 1948.")
5 Conceptual Map: Ellingham, 1948 Ellingham s Relations Between the Branches of Natural Science and Technology with an overlay of Abstracts or Groups of Abstracts Covering A Very Wide Field (1948) H. J. T. Ellingham, "Divisions of Natural Science and Technology," Royal Society Scientific Information Conference, 21 June to 2 July 1948 London: Burlington House, 1948.
6 Link Types Direct links (real network) can be binary network or weighted network Indirect links (implied network) combinatorial nature makes this matrix very large always a weighted network A Co-citation Bibliographic B 6
7 Early Bibliometric Mapping: ISI, 1974 Paradigm map of science Hierarchical clustering of scientific references Node size reflects numbers of references Links show relationships between clusters Griffith, B. C., Small, H. G., Stonehill, J. A., Dey, S., Structure of scientific literatures. 2. Toward a macrostructure and microstructure for science, Science Studies, 4 (1974)

8 Institute for Scientific Information. (1981). ISI atlas of science: Biochemistry and molecular biology, 1978/80, Institute for Scientific Information, Philadelphia, PA. Early Bibliometric Mapping: ISI, 1981
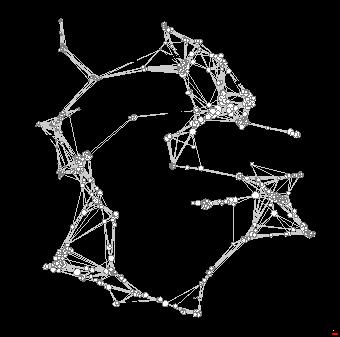
9 Early Bibliometric Mapping: ISI, ,720 highly cited reference papers in a four-nested-level map Triangulation process used for layout at the fourth level High disciplinary bias due to thresholding Small, H., Visualizing science by citation mapping, Journal of the American Society for Information Science, 50 (1999)
10 Summary: Early Bibliometric Mapping Technical Barriers Costly (mainframes used to deal with 1MM x 1MM matrices) Limitations in visualization software Best method (MDS) could only handle 100 nodes Limitations in clustering algorithms Forced to use single link clustering results Maximum cluster size was expected to be ~100 papers Results were not consistent with assumptions (huge clusters appeared) No methods for measuring accuracy/quality were developed High costs resulted in very little experimentation in methods


11 Recent Improvements
12 Improvements: 2000 Reference paper map linked to a journal map ~500k papers clustered into ~38K paradigms ~5000 journals clustered into ~700 disciplines Improvement: Using hierarchical clustering of journals Linking paper clusters to journal clusters Klavans, R. (2000). Presented at the Sackler Symposium on Mapping Science, 2003, Irvine, CA
13 Improvements: 2003 Journal map 7000 journals (different similarity measures) Improvement: First approach to measure the accuracy of different maps Boyack, K. W., Klavans, R., & Börner, K. (2005). Mapping the backbone of science. Scientometrics 64(3),
14 Improvements: 2004 Journal map 7000 journals Improvement: Increased accuracy by excluding multidisciplinary journals More intuitive macro-structure by using multiple levels of clustering Boyack, K. W., Klavans, R., & Börner, K. (2007). Mapping the structure and evolution of chemistry research. ISSI 2007.
. Using detailed maps of science to identify potential collaborations.")
15 Improvements: 2005 Journal map 8500 journals / proceedings Improvement: Added in the ISI proceedings database Boyack, K. W. (2007). Using detailed maps of science to identify potential collaborations. ISSI 2007.
. Thought leadership: A new indicator for national and institutional comparison.")
16 Improvements: 2005 Reference paper map 820,000 highly cited reference papers Improvement: Replication of circle of science using different data, measures and visualization algorithms Klavans, R. & Boyack, K. W. (2008, forthcoming). Thought leadership: A new indicator for national and institutional comparison. Scientometrics.


.")

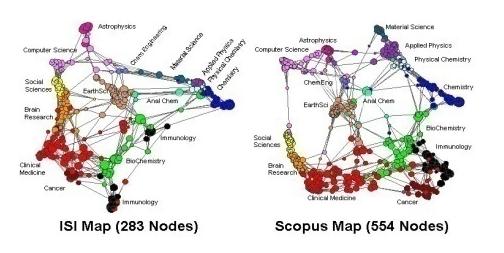
17 Improvements: 2006 Reference paper maps ~800k highly cited reference papers two different databases and years Improvement: Replication of methodology Comparison of databases Klavans, R. & Boyack, K. W. (2007). Is there a convergent structure of science? A comparison of maps from the ISI and Scopus databases. ISSI 2007.
 http://www.mapofscience.")
18 Improvements: 2007 Journal Map 16,000 Journals into 554 disciplines Improvements: greater accuracy by using the surface of a sphere Radial projection replicates circle of science Mercator projection views the entire surface Klavans, R. (2007, unpublished)


 http://www.")
19 Improvements: 2007 Journal map linked to paradigm map linked to paper map 16,000 journals into 554 disciplines 2,160,000 highly cited references into 40,000 paradigms 4,870,000 Papers ( ) assigned to 40,000 paradigms Improvements: Details for each of the disciplines Paradigm networks for every 1 paradigm assigned to a discipline there are approximately 5 related paradigms Paper level maps show performance nodes are highly cited references edges are assigned current papers Klavans, R. (2007, unpublished)
20 Summary: Improvements Protocols for measuring accuracy Experiment: New measures that generate more accurate maps Experiment: New algorithms that generate more accurate maps Experiment: Tradeoffs between accuracy and other factors Continue experimenting until Either one reaches convergence Or alternatives become clearly differentiated New measures of strength Network strength vs. Isolated strength Publication leadership vs. Thought leadership
21 Progress in Measuring Accuracy Journal Maps Local accuracy Regional accuracy Text & citations Lessons learned Paper-Level Maps Local accuracy Disciplinary bias Lessons learned


22 Hierarchical Mapping Process
23 Methodological Limitation VxOrd is most applicable where local conditions dominate over far-flung or global conditions A journal network is a multidimensional system However, each journal only cares about its local environment (ask a journal editor how many journals she considers as competitors) Pruning of the network (rather than thresholding) is appropriate Pruning (removing all but the top 10 edges per node) retains nodes, does not preserve degree, does preserve macrostructure, provides visual separability Thresholding (removing edges under a certain weight) removes nodes, preserves relative degree, leads to over-aggregation
24 Example: Journal Maps Same Data ISI SCIE & SSCI file year different similarity metrics 5 Inter-citation (raw counts, cosine, Jaccard, Pearson, RF Average) 3 Co-citation (raw counts, Pearson, modified cosine)

.")

25 Accuracy of Journal Maps Local Accuracy The journal that is closest to you is assigned to the same disciplinary category using a gold standard (the ISI disciplinary classification system). Regional Accuracy Clusters of journals correspond to the gold standard (the ISI disciplinary clasification system).
 Accuracy vs.")
.")
26 Journal Maps: Local Accuracy ISI category structure used as basis for comparison Similarity measures Similarity pairs ordered by value, pairs assigned a 1/0 binary score (same category?) Accuracy vs. coverage curves were generated for each similarity measure After VxOrd After VxOrd based on distances in layout rather than similarity values Results after layout using VxOrd were more accurate than the raw measures Klavans, R., & Boyack, K. W. (2006). Identifying a better measure of relatedness for mapping science. Journal of the American Society for Information Science and Technology 57(2),
27 Computing Mutual Information Use method of Gibbons and Roth (Genome Research v. 12, pp , 2002) K-means clustering (MATLAB) for each graph layout 3 different k-means runs at 100, 125, 150, 175, 200, 225, 250 clusters Quality metric (mutual information) calculated as MI(X,Y) = H(X) + H(Y) H(X,Y) where H = - P i log 2 P i P i are the probabilities of each [cluster, category] combination X (known ISI category assignments), Y (k-means cluster assignments) Z-score (indicates distance from randomness, Z=0=random) Z = (MI real MI random )/ S random MI random and S random vary with number of clusters, calculated from 5000 random solutions

. Mapping the backbone of science.")
28 Journal Maps: Regional Accuracy ISI category structure used as basis for comparison Layouts clustered (k-means) with different numbers of clusters Resulting cluster memberships were compared to actual structure using entropy/ mutual information method Increasing Z-score indicates increasing distance from a random solution Most similarity measures are within several percent of each other Boyack, K. W., Klavans, R., & Börner, K. (2005). Mapping the backbone of science. Scientometrics 64(3),

29 Journal Maps: Citations vs. Text Can keywords or controlled vocabularies compete with citations? Data: ~3300 Medline journals covered by ISI Citation data from ISI MeSH terms from Scopus Computed accuracy/ coverage curves for similarity measures using citations, MeSH, and a combination Some MeSH and combined measures do as well as citation measures Boyack & Klavans (2007, unpublished).
30 Journal Maps: Citations vs. Text Better text analysis/extraction is needed Our results with MeSH are encouraging, BUT MeSH is a standardized vocabulary assigned by a select group of human indexers in one field (medicine) of science Would a non-standard vocabulary do as well? Accurate (automatic) labeling is another issue
31 Journal Maps: Lessons Learned Clear tradeoff between coverage and accuracy. Pearson correlation is more accurate for low levels of coverage and is not scalable to hundreds of thousands of items. K50 (normalized cosine) is the most accurate overall measure of journal:journal relatedness for higher levels of coverage. Data reduction (e.g. VxOrd) actually increases accuracy! Combining text & citations can increase accuracy. Further work needed. Best practice: Use distance measure from the 2 dimensional (x,y) map generated by VxOrd using K50 as the input journal:journal measure of relatedness. Coverage ~90% still maintains high enough levels of accuracy.
32 Accuracy of Paper Maps Local accuracy The paper that is closest to you is assigned to the same disciplinary category using a gold standard (the ISI disciplinary classification system). Disciplinary bias What threshold is necessary to generate acceptable levels of disciplinary bias?

 70% K50 (aggregated) K50 (paper) RawFreq (aggregated) RawFreq")
33 Paper Maps: Local Accuracy Two maps (current and reference), two measures (raw and modified cosine-k50), two aggregation levels (edge-cutting levels) Paper pairs ordered by distance on the map, pairs assigned a 1/0 binary score (same ISI category?) 60% Local Local Accuracy Accuracy (%yes) 70% K50 (aggregated) RawFreq (aggregated) K50 (paper) RawFreq (paper) % Coverage Local Accuracy (Current Papers) Accuracy vs. coverage curves were generated for all 2x2x2 cases K50 measures have high accuracy at high coverage 60% Local Accuracy (%yes) 70% K50 (aggregated) K50 (paper) RawFreq (aggregated) RawFreq (paper) % Coverage Klavans, R. & Boyack K. W. (2006). Quantitative evaluation of large maps of science. Scientometrics 68(3), Local Accuracy (Reference Papers)
![Paper Maps: Disciplinary Bias Small [1999] presented a more linear map of science, but also reported high disciplinary bias.](/docs-images/89/97528113/images/34-3.jpg "Disciplinary bias is due to using a high citation threshold for selecting reference papers.")
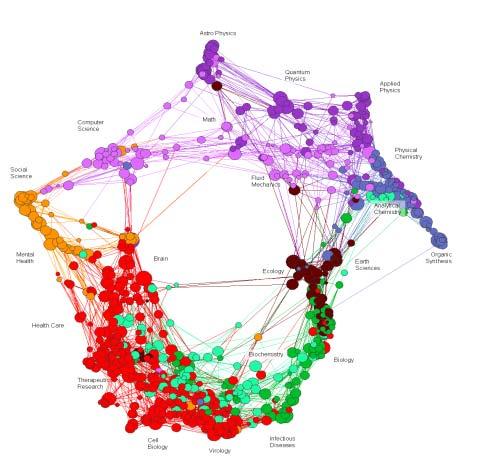
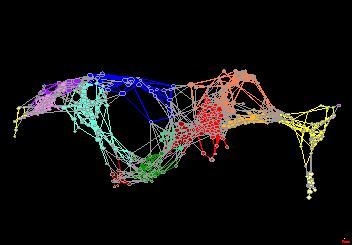
34 Paper Maps: Disciplinary Bias Small [1999] presented a more linear map of science, but also reported high disciplinary bias. Disciplinary bias is due to using a high citation threshold for selecting reference papers. Klavans & Boyack [2007], using the same ISI database with much lower thresholds, suggest that there is a strong link between economics and physics going through the disciplines that are under-represented by Small [1999]. Missing link due to high thresholds Small, H., Visualizing science by citation mapping, Journal of the American Society for Information Science, 50 (1999) Klavans, R. & Boyack, K. W. (2007). Is there a convergent structure of science? A comparison of maps from the ISI and Scopus databases. ISSI 2007.
![Paper Maps: Disciplinary Bias Small [1999] presented a more linear map of science, but also reported high disciplinary bias.](/docs-images/89/97528113/images/35-0.jpg "Disciplinary bias is due to using a high citation threshold for selecting reference papers.")
![Boyack [2007], also using a lower thresholds and including the proceedings database, suggests that the missing link between economics and physics goes through the disciplines that were](/docs-images/89/97528113/images/35-3.jpg "under-represented by Small [1999]. Math Social Sciences CS Engineering Earth Sciences Psych Brain Physics Chemistry Biology Missing link due to high thresholds Therapeutic Medicine Virology Small, H.")
35 Paper Maps: Disciplinary Bias Small [1999] presented a more linear map of science, but also reported high disciplinary bias. Disciplinary bias is due to using a high citation threshold for selecting reference papers. Boyack [2007], also using a lower thresholds and including the proceedings database, suggests that the missing link between economics and physics goes through the disciplines that were under-represented by Small [1999]. Math Social Sciences CS Engineering Earth Sciences Psych Brain Physics Chemistry Biology Missing link due to high thresholds Therapeutic Medicine Virology Small, H., Visualizing science by citation mapping, Journal of the American Society for Information Science, 50 (1999) Boyack, K. W. (2007). Using detailed maps of science to identify potential collaborations. ISSI 2007.
 RawFreq (aggregated) K50 (paper) K50 (aggregated) K50 (modified cosine) measure of paper-paper relatedness generates the lowest levels of disciplinary")
36 Paper Maps: Disciplinary Bias Disciplinary bias reported by Small is very high. Disciplinary bias, using the new methodologies developed by SciTech Strategies is very low. Disciplinary Bias Small[1999] RawFreq (paper) RawFreq (aggregated) K50 (paper) K50 (aggregated) K50 (modified cosine) measure of paper-paper relatedness generates the lowest levels of disciplinary bias. Number of Reference Papers Klavans, R. & Boyack K. W. (2006). Quantitative evaluation of large maps of science. Scientometrics 68(3),
37 Paper Maps: Lessons Learned Clear tradeoff between disciplinary bias and accuracy. Choosing lower thresholds creates more accurate maps. Choosing lower thresholds requires the use of algorithms that can handle square matrices that have millions (not thousands) or rows. K50 (modified cosine) remains the most accurate, scalable measure of relatedness. Best practice: Use the lowest reasonable thresholds; K50 as the measure of paper-paper relatedness to generate x,y coordinates using VxOrd, and then use the distance measure from the coordinates map.
38 Frontier Issues Is there convergence? How can network science help?


39 Is there Convergence Yet? 2000 ISI Disciplinary Map 2003 ISI Paradigm Map 2004 Scopus Paradigm Map UCSD Disciplinary Map Scimago: 2000 ISI Co-category Map U. Wash: 2004 ISI Disciplinary Map

40 Is there Convergence Yet?
41 Is there Convergence Yet?

42 Is there Convergence Yet?
43 Maybe Not Scimago: 2004 ISI Co-category Map PFNet Vargas-Quesada, B. & Moya-Anegón, F. (2007). Visualizing the Structure of Science. Springer.
44 How can Network Science Help? Adopt methods for measuring accuracy Yes that means citing the information science literature! Improved dimension reduction algorithms Including methods to test/compare accuracy of these algorithms (e.g. VAST) Improvements in force-directed algorithms Scalability and speed Solution of the multi-point problem Allow actors to have n positions Euclidean space? or perhaps Riemann space? Compare accuracy of solutions using different topological assumptions
45 Smart Coarsening 200k 200k


46 Real-time Clustering

47


48 Places & Spaces: Mapping Science a science exhibit that introduces people to maps of sciences, their makers and users. Exhibit Curators: Dr. Katy Börner & Deborah MacPherson 48
49 Final Thoughts We are adamant about the accuracy of network visualization. We hope others will join us in this effort The community identification work in physics and network science is part of this, but needs to go further in validation Thanks for listening!!
Towards Effective KM Tools
 Towards Effective KM Tools Dr. Katy Börner Cyberinfrastructure for Network Science Center, Director Information Visualization Laboratory, Director School of Library and Information Science Indiana University,
Locating an Astronomy and Astrophysics Publication Set in a Map of the Full Scopus Database
 Locating an Astronomy and Astrophysics Publication Set in a Map of the Full Scopus Database Kevin W. Boyack 1 1 kboyack@mapofscience.com SciTech Strategies, Inc., 8421 Manuel Cia Pl NE, Albuquerque, NM
Mapping the Structure and Evolution of Chemistry Research
 Mapping the Structure and Evolution of Chemistry Research Kevin W. Boyack *, Katy Börner ** and Richard Klavans *** * kboyack@mapofscience.com * Sandia National Laboratories, P.O. Box 5800, MS-1316, Albuquerque,
Historical Perspectives and Recent Advances in Mapping the Sciences
 Historical Perspectives and Recent Advances in Mapping the Sciences UCGIS Summer Meeting, June 22, 2009 Kevin W. Boyack SciTech Strategies, Inc. http://www.mapofscience.com/ Acknowledgments Gene Garfield
Mapping of Science. Bart Thijs ECOOM, K.U.Leuven, Belgium
 Mapping of Science Bart Thijs ECOOM, K.U.Leuven, Belgium Introduction Definition: Mapping of Science is the application of powerful statistical tools and analytical techniques to uncover the structure
Design and Update of a Classification System: The UCSD Map of Science
 Design and Update of a Classification System: The UCSD Map of Science Networks and Complex Systems Talk Series Indiana University, Bloomington, IN Sept 10,2012 Overview Motivation Design Validation Application
Creation of a highly detailed, dynamic, global model and map of science
 Creation of a highly detailed, dynamic, global model and map of science Kevin W. Boyack * and Richard Klavans ** * kboyack@mapofscience.com SciTech Strategies, Inc., Albuquerque, NM 87122 (USA) ** rklavans@mapofscience.com
Mapping Interdisciplinary Research Domains
 Mapping Interdisciplinary Research Domains Katy Börner School of Library and Information Science katy@indiana.edu Presentation at the Parmenides Center for the Study of Thinking, Island of Elba, Italy
Software survey: VOSviewer, a computer program for bibliometric mapping
 Scientometrics (2010) 84:523 538 DOI 10.1007/s11192-009-0146-3 Software survey: VOSviewer, a computer program for bibliometric mapping Nees Jan van Eck Ludo Waltman Received: 31 July 2009 / Published online:
Visualization and analysis of SCImago Journal & Country Rank structure via journal clustering
 Visualization and analysis of SCImago Journal & Country Rank structure via journal clustering Antonio J. Gómez-Núñez CSIC, SCImago Research Group Associated Unit. Faculty of Communication and Documentation,
Using global mapping to create more accurate document-level maps of research fields
 Using global mapping to create more accurate document-level maps of research fields Richard Klavans a & Kevin W. Boyack b a SciTech Strategies, Inc., Berwyn, PA 19312 USA (rklavans@mapofscience.com) b
²Austrian Center of Competence for Tribology, AC2T research GmbH, Viktor-Kaplan-Straße 2-C, A Wiener Neustadt, Austria
 Bibliometric field delineation with heat maps of bibliographically coupled publications using core documents and a cluster approach - the case of multiscale simulation and modelling (research in progress)
Scientometrics as network science The hidden face of a misperceived research field. Sándor Soós, PhD
 Scientometrics as network science The hidden face of a misperceived research field Sándor Soós, PhD soossand@konyvtar.mta.hu Public understanding of scientometrics Three common misperceptions: Scientometrics
658 C.-P. Hu et al. Highlycited Indicators published by Chinese Scientific and Technical Information Institute and Wanfang Data Co., Ltd. demonstrates
 658 C.-P. Hu et al. Highlycited Indicators published by Chinese Scientific and Technical Information Institute and Wanfang Data Co., Ltd. demonstrates the basic status of LIS journals in China through
Understanding (Big) Data by Using Macroscopes
 Data by Using Macroscopes") Understanding (Big) Data by Using Macroscopes Katy Börner Cyberinfrastructure for Network Science Center, Director Information Visualization Laboratory, Director Department of Information and Library Science
Understanding (Big) Data by Using Macroscopes Katy Börner Cyberinfrastructure for Network Science Center, Director Information Visualization Laboratory, Director Department of Information and Library Science
Descriptive Data Summarization
 Descriptive Data Summarization Descriptive data summarization gives the general characteristics of the data and identify the presence of noise or outliers, which is useful for successful data cleaning
Design and Update of a Classification System: The UCSD Map of Science
 Design and Update of a Classification System: The UCSD Map of Science Katy Börner 1,2 *, Richard Klavans 3, Michael Patek 3, Angela M. Zoss 1, Joseph R. Biberstine 1, Robert P. Light 1, Vincent Larivière
Studying the emergent 'Global Brain' in large-scale co-author networks and mapping the 'Backbone of Science'
 Studying the emergent 'Global Brain' in large-scale co-author networks and mapping the 'Backbone of Science' Katy Börner & the InfoVis Lab School of Library and Information Science katy@indiana.edu Networks
Visualisation of knowledge domains in interdisciplinary research organizations
 Neversdorf, September 2010 Visualisation of knowledge domains in interdisciplinary research organizations Ismael Rafols 1,2 1 SPRU -- Science and Technology Policy Research University of Sussex, Brighton,
The Scope and Growth of Spatial Analysis in the Social Sciences
 context. 2 We applied these search terms to six online bibliographic indexes of social science Completed as part of the CSISS literature search initiative on November 18, 2003 The Scope and Growth of Spatial
Discovering Correlation in Data. Vinh Nguyen Research Fellow in Data Science Computing and Information Systems DMD 7.
 Discovering Correlation in Data Vinh Nguyen (vinh.nguyen@unimelb.edu.au) Research Fellow in Data Science Computing and Information Systems DMD 7.14 Discovering Correlation Why is correlation important?
2.6 Complexity Theory for Map-Reduce. Star Joins 2.6. COMPLEXITY THEORY FOR MAP-REDUCE 51
 2.6. COMPLEXITY THEORY FOR MAP-REDUCE 51 Star Joins A common structure for data mining of commercial data is the star join. For example, a chain store like Walmart keeps a fact table whose tuples each
Supplementary Information
 Supplementary Information For the article"comparable system-level organization of Archaea and ukaryotes" by J. Podani, Z. N. Oltvai, H. Jeong, B. Tombor, A.-L. Barabási, and. Szathmáry (reference numbers
Visualizing the Evolution of a Subject Domain: A Case Study
 Visualizing the Evolution of a Subject Domain: A Case Study Chaomei Chen Brunel University Leslie Carr Southampton University Abstract We explore the potential of information visualization techniques in
Bridging the Practices of Two Communities
 Educational Knowledge Domain Visualizations: Tools to Navigate, Understand, and Internalize the Structure of Scholarly Knowledge and Expertise Peter A. Hook http://ella.slis.indiana.edu/~pahook Mapping
Networks as vectors of their motif frequencies and 2-norm distance as a measure of similarity
 Networks as vectors of their motif frequencies and 2-norm distance as a measure of similarity CS322 Project Writeup Semih Salihoglu Stanford University 353 Serra Street Stanford, CA semih@stanford.edu
Basics of Multivariate Modelling and Data Analysis
 Basics of Multivariate Modelling and Data Analysis Kurt-Erik Häggblom 2. Overview of multivariate techniques 2.1 Different approaches to multivariate data analysis 2.2 Classification of multivariate techniques
SELECTION OF JOURNALS BASED ON THE IMPACT FACTORS: A Case Study
 DRTC Workshop on Information Management 6-8 January 1999 Paper: BB SELECTION OF JOURNALS BASED ON THE IMPACT FACTORS: A Case Study K.S. Chudamani & B.C Sandhya, JRD Tata Memorial Library, Indian Institute
A cluster analysis of scholar and journal bibliometric indicators
 A cluster analysis of scholar and journal bibliometric indicators Massimo Franceschet Department of Mathematics and Computer Science University of Udine Via delle Scienze, 206 33100 Udine (Italy) massimo.franceschet@dimi.uniud.it
In order to compare the proteins of the phylogenomic matrix, we needed a similarity
 Similarity Matrix Generation In order to compare the proteins of the phylogenomic matrix, we needed a similarity measure. Hamming distances between phylogenetic profiles require the use of thresholds for
Similarity Measures, Author Cocitation Analysis, and Information Theory
 Similarity Measures, Author Cocitation Analysis, and Information Theory Journal of the American Society for Information Science & Technology, 56(7), 2005, 769-772. Loet Leydesdorff Science & Technology
The Retraction Penalty: Evidence from the Web of Science
 Supporting Information for The Retraction Penalty: Evidence from the Web of Science October 2013 Susan Feng Lu Simon School of Business University of Rochester susan.lu@simon.rochester.edu Ginger Zhe Jin
Relational Nonlinear FIR Filters. Ronald K. Pearson
 Relational Nonlinear FIR Filters Ronald K. Pearson Daniel Baugh Institute for Functional Genomics and Computational Biology Thomas Jefferson University Philadelphia, PA Moncef Gabbouj Institute of Signal
Mapping the Structure and Diffusion of Scholarly Knowledge
 Mapping the Structure and Diffusion of Scholarly Knowledge Dr. Katy Börner Cyberinfrastructure for Network Science Center, Director Information Visualization Laboratory, Director School of Library and
Long-Distance Interdisciplinarity Leads to Higher Scientific Impact
 RESEARCH ARTICLE Long-Distance Interdisciplinarity Leads to Higher Scientific Impact Vincent Larivière 1,2 *, Stefanie Haustein 1, Katy Börner 3 1 École de bibliothéconomie et des sciences de l information,
A BASE SYSTEM FOR MICRO TRAFFIC SIMULATION USING THE GEOGRAPHICAL INFORMATION DATABASE
 A BASE SYSTEM FOR MICRO TRAFFIC SIMULATION USING THE GEOGRAPHICAL INFORMATION DATABASE Yan LI Ritsumeikan Asia Pacific University E-mail: yanli@apu.ac.jp 1 INTRODUCTION In the recent years, with the rapid
EVALUATING THE USAGE AND IMPACT OF E-JOURNALS IN THE UK
 E v a l u a t i n g t h e U s a g e a n d I m p a c t o f e - J o u r n a l s i n t h e U K p a g e 1 EVALUATING THE USAGE AND IMPACT OF E-JOURNALS IN THE UK BIBLIOMETRIC INDICATORS FOR CASE STUDY INSTITUTIONS
Interdisciplinarity: Its Bibliometric Evaluation and Its Influence in Research Outputs
 SciSIP PI Conference, Washington, DC, Sep., 2012 Interdisciplinarity: Its Bibliometric Evaluation and Its Influence in Research Outputs Alan Porter Georgia Tech & Search Technology, Inc. alan.porter@isye.gatech.edu
Data Mining. CS57300 Purdue University. Bruno Ribeiro. February 8, 2018
 Data Mining CS57300 Purdue University Bruno Ribeiro February 8, 2018 Decision trees Why Trees? interpretable/intuitive, popular in medical applications because they mimic the way a doctor thinks model
CS425: Algorithms for Web Scale Data
 CS: Algorithms for Web Scale Data Most of the slides are from the Mining of Massive Datasets book. These slides have been modified for CS. The original slides can be accessed at: www.mmds.org Customer
Mapping research topics using word-reference co-occurrences: A method and an exploratory case study
 Jointly published by Akadémiai Kiadó, Budapest Scientometrics, Vol. 68, No. 3 (2006) 377 393 and Springer, Dordrecht Mapping research topics using word-reference co-occurrences: A method and an exploratory
CS570 Introduction to Data Mining
 CS570 Introduction to Data Mining Department of Mathematics and Computer Science Li Xiong Data Exploration and Data Preprocessing Data and Attributes Data exploration Data pre-processing Data cleaning
Classification and Regression Trees
 Classification and Regression Trees Ryan P Adams So far, we have primarily examined linear classifiers and regressors, and considered several different ways to train them When we ve found the linearity
The focus of this study is whether evolutionary medicine can be considered a distinct scientific discipline.
 The purpose of this study is to characterize trends in the application of evolutionary biology in health and disease. The focus of this study is whether evolutionary medicine can be considered a distinct
Types and Levels of Team (Network) Analysis
 Analysis") Types and Levels of Team (Network) Analysis Dr. Katy Börner Cyberinfrastructure for Network Science Center, Director Information Visualization Laboratory, Director School of Library and Information Science
Types and Levels of Team (Network) Analysis Dr. Katy Börner Cyberinfrastructure for Network Science Center, Director Information Visualization Laboratory, Director School of Library and Information Science
CS246 Final Exam. March 16, :30AM - 11:30AM
 CS246 Final Exam March 16, 2016 8:30AM - 11:30AM Name : SUID : I acknowledge and accept the Stanford Honor Code. I have neither given nor received unpermitted help on this examination. (signed) Directions
Modern Information Retrieval
 Modern Information Retrieval Chapter 8 Text Classification Introduction A Characterization of Text Classification Unsupervised Algorithms Supervised Algorithms Feature Selection or Dimensionality Reduction
Modern Information Retrieval
 Modern Information Retrieval Chapter 8 Text Classification Introduction A Characterization of Text Classification Unsupervised Algorithms Supervised Algorithms Feature Selection or Dimensionality Reduction
Is the Relationship between Numbers of References and Paper Lengths the Same for All Sciences?
 Is the Relationship between Numbers of References and Paper Lengths the Same for All Sciences? Helmut A. Abt Kitt Peak National Observatory, Box 26732, Tucson, AZ 85726-6732, USA; e-mail: abt@noao.edu
An Efficient Algorithm for Protein-Protein Interaction Network Analysis to Discover Overlapping Functional Modules
 An Efficient Algorithm for Protein-Protein Interaction Network Analysis to Discover Overlapping Functional Modules Ying Liu 1 Department of Computer Science, Mathematics and Science, College of Professional
Faculty Working Paper Series
 Faculty Working Paper Series No. 2, October 2007 A Bibliometric Note on Isserman s Panegyric Statistics Nikias Sarafoglou Items in this collection are copyrighted, with all rights reserved and chosen by
A New Space for Comparing Graphs
 A New Space for Comparing Graphs Anshumali Shrivastava and Ping Li Cornell University and Rutgers University August 18th 2014 Anshumali Shrivastava and Ping Li ASONAM 2014 August 18th 2014 1 / 38 Main
Decision Trees. CS57300 Data Mining Fall Instructor: Bruno Ribeiro
 Decision Trees CS57300 Data Mining Fall 2016 Instructor: Bruno Ribeiro Goal } Classification without Models Well, partially without a model } Today: Decision Trees 2015 Bruno Ribeiro 2 3 Why Trees? } interpretable/intuitive,
The detection of hot regions in the geography of science. A visualization approach by using density maps
 The detection of hot regions in the geography of science A visualization approach by using density maps Lutz Bornmann$, Ludo Waltman $ Max Planck Society, Hofgartenstr. 8, 80539 Munich, Germany Centre
Reductionist View: A Priori Algorithm and Vector-Space Text Retrieval. Sargur Srihari University at Buffalo The State University of New York
 Reductionist View: A Priori Algorithm and Vector-Space Text Retrieval Sargur Srihari University at Buffalo The State University of New York 1 A Priori Algorithm for Association Rule Learning Association
CS246 Final Exam, Winter 2011
 CS246 Final Exam, Winter 2011 1. Your name and student ID. Name:... Student ID:... 2. I agree to comply with Stanford Honor Code. Signature:... 3. There should be 17 numbered pages in this exam (including
Comprehensive support for quantitation
 Comprehensive support for quantitation One of the major new features in the current release of Mascot is support for quantitation. This is still work in progress. Our goal is to support all of the popular
Clustering. Genome 559: Introduction to Statistical and Computational Genomics Elhanan Borenstein. Some slides adapted from Jacques van Helden
 Clustering Genome 559: Introduction to Statistical and Computational Genomics Elhanan Borenstein Some slides adapted from Jacques van Helden Gene expression profiling A quick review Which molecular processes/functions
Vectors and their uses
 Vectors and their uses Sharon Goldwater Institute for Language, Cognition and Computation School of Informatics, University of Edinburgh DRAFT Version 0.95: 3 Sep 2015. Do not redistribute without permission.
Journal Impact Factor Versus Eigenfactor and Article Influence*
 Journal Impact Factor Versus Eigenfactor and Article Influence* Chia-Lin Chang Department of Applied Economics National Chung Hsing University Taichung, Taiwan Michael McAleer Econometric Institute Erasmus
Knowledge Integration and Diffusion: Measures and Mapping of Diversity and Coherence
 Knowledge Integration and Diffusion: Measures and Mapping of Diversity and Coherence Ismael Rafols (i.rafols@ingenio.upv.es) Ingenio (CSIC-UPV), Universitat Politècnica de València, València (Spain) &
Two problems to be solved. Example Use of SITATION. Here is the main menu. First step. Now. To load the data.
 Two problems to be solved Example Use of SITATION Mark S. Daskin Department of IE/MS Northwestern U. Evanston, IL 1. Minimize the demand weighted total distance (or average distance) Using 10 facilities
Chapter 1, Section 1 Exploring Geography
 Chapter 1, Section 1 Exploring Geography (Pages 19 22) Setting a Purpose for Reading Think about these questions as you read: What are the physical and human features geographers study? How do geographers
Mapping the Iranian ISI papers on Nanoscience and Nanotechnology: a citation analysis approach
 Malaysian Journal of Library & Information Science, Vol.14, no.3, Dec 2009: 95-107 Mapping the Iranian ISI papers on Nanoscience and Nanotechnology: a citation analysis approach ABSTRACT Roya Baradar 1,
Domain Maps: Purposes, History, Parallels with Cartography, and Applications
 Domain Maps: Purposes, History, Parallels with Cartography, and Applications Peter A. Hook Indiana University, School of Law, 211 South Indiana Ave., Bloomington, IN 47405 USA {pahook@indiana.edu} Abstract
MATH STUDENT BOOK. 6th Grade Unit 9
 MATH STUDENT BOOK 6th Grade Unit 9 Unit 9 Integers and Transformations MATH 609 Integers and Transformations 1. INTEGERS 5 INTEGERS 6 COMPARING AND ORDERING INTEGERS 12 ABSOLUTE VALUE 16 COORDINATE PLANE
Knowledge Domain Visualizations: Tools to Navigate, Understand, and Internalize the Structure of Scholarly Knowledge and Expertise
 Knowledge Domain Visualizations: Tools to Navigate, Understand, and Internalize the Structure of Scholarly Knowledge and Expertise SLIS An Emerging Field of Information Cartography Peter A. Hook, J.D.,
Recommendation Systems
 Recommendation Systems Popularity Recommendation Systems Predicting user responses to options Offering news articles based on users interests Offering suggestions on what the user might like to buy/consume
Outline of mathematics From Wikipedia, the free encyclopedia
 Page 1 of 8 Outline of mathematics From Wikipedia, the free encyclopedia The following outline is provided as an overview of and topical guide to mathematics: Mathematics is a field of study that investigates
Application of Indirect Race/ Ethnicity Data in Quality Metric Analyses
 Background The fifteen wholly-owned health plans under WellPoint, Inc. (WellPoint) historically did not collect data in regard to the race/ethnicity of it members. In order to overcome this lack of data
Clustering. Genome 373 Genomic Informatics Elhanan Borenstein. Some slides adapted from Jacques van Helden
 Clustering Genome 373 Genomic Informatics Elhanan Borenstein Some slides adapted from Jacques van Helden The clustering problem The goal of gene clustering process is to partition the genes into distinct
Environmental Chemistry through Intelligent Atmospheric Data Analysis (EnChIlADA): A Platform for Mining ATOFMS and Other Atmospheric Data
: A Platform for Mining ATOFMS and Other Atmospheric Data") Environmental Chemistry through Intelligent Atmospheric Data Analysis (EnChIlADA): A Platform for Mining ATOFMS and Other Atmospheric Data Katie Barton, John Choiniere, Melanie Yuen, and Deborah Gross
Environmental Chemistry through Intelligent Atmospheric Data Analysis (EnChIlADA): A Platform for Mining ATOFMS and Other Atmospheric Data Katie Barton, John Choiniere, Melanie Yuen, and Deborah Gross
DATA SOURCES AND INPUT IN GIS. By Prof. A. Balasubramanian Centre for Advanced Studies in Earth Science, University of Mysore, Mysore
 DATA SOURCES AND INPUT IN GIS By Prof. A. Balasubramanian Centre for Advanced Studies in Earth Science, University of Mysore, Mysore 1 1. GIS stands for 'Geographic Information System'. It is a computer-based
RaRE: Social Rank Regulated Large-scale Network Embedding
 RaRE: Social Rank Regulated Large-scale Network Embedding Authors: Yupeng Gu 1, Yizhou Sun 1, Yanen Li 2, Yang Yang 3 04/26/2018 The Web Conference, 2018 1 University of California, Los Angeles 2 Snapchat
MIDDLE GRADES MATHEMATICS
 MIDDLE GRADES MATHEMATICS Content Domain Range of Competencies l. Number Sense and Operations 0001 0002 17% ll. Algebra and Functions 0003 0006 33% lll. Measurement and Geometry 0007 0009 25% lv. Statistics,
Mathematical Tools for Neuroscience (NEU 314) Princeton University, Spring 2016 Jonathan Pillow. Homework 8: Logistic Regression & Information Theory
 Princeton University, Spring 2016 Jonathan Pillow. Homework 8: Logistic Regression & Information Theory") Mathematical Tools for Neuroscience (NEU 34) Princeton University, Spring 206 Jonathan Pillow Homework 8: Logistic Regression & Information Theory Due: Tuesday, April 26, 9:59am Optimization Toolbox One
Mathematical Tools for Neuroscience (NEU 34) Princeton University, Spring 206 Jonathan Pillow Homework 8: Logistic Regression & Information Theory Due: Tuesday, April 26, 9:59am Optimization Toolbox One
UVA CS 4501: Machine Learning
 UVA CS 4501: Machine Learning Lecture 21: Decision Tree / Random Forest / Ensemble Dr. Yanjun Qi University of Virginia Department of Computer Science Where are we? è Five major sections of this course
Agilent MassHunter Profinder: Solving the Challenge of Isotopologue Extraction for Qualitative Flux Analysis
 Agilent MassHunter Profinder: Solving the Challenge of Isotopologue Extraction for Qualitative Flux Analysis Technical Overview Introduction Metabolomics studies measure the relative abundance of metabolites
LCA_Distal_LTB Stata function users guide (Version 1.1)
") LCA_Distal_LTB Stata function users guide (Version 1.1) Liying Huang John J. Dziak Bethany C. Bray Aaron T. Wagner Stephanie T. Lanza Penn State Copyright 2017, Penn State. All rights reserved. NOTE: the
LCA_Distal_LTB Stata function users guide (Version 1.1) Liying Huang John J. Dziak Bethany C. Bray Aaron T. Wagner Stephanie T. Lanza Penn State Copyright 2017, Penn State. All rights reserved. NOTE: the
CS249: ADVANCED DATA MINING
 CS249: ADVANCED DATA MINING Clustering Evaluation and Practical Issues Instructor: Yizhou Sun yzsun@cs.ucla.edu May 2, 2017 Announcements Homework 2 due later today Due May 3 rd (11:59pm) Course project
Radiology, nuclear medicine, and medical imaging: A bibliometric study in Iran
 Radiology, nuclear medicine, and medical imaging: A bibliometric study in Iran Navid Medical Imaging Systems Lab, Research Center for Molecular and Cellular Imaging (RCMCI), Tehran University of Medical
Journal of Informetrics
 Journal of Informetrics 5 (2011) 146 166 Contents lists available at ScienceDirect Journal of Informetrics journal homepage: www.elsevier.com/locate/joi An approach for detecting, quantifying, and visualizing
Foundations 5 Curriculum Guide
 1. Review: Natural Numbers...3 2. Reading and Writing Natural Numbers...6 3. Lines, Rays, and Line Segments...8 4. Comparing Natural Numbers... 12 5. Rounding Numbers... 15 6. Adding Natural Numbers...
How do we analyze and visualize science?
 Analysis and Visualization of Science Angela Zoss, M.S. Research Assistant, Cyberinfrastructurefor Network Science Center Doctoral Student, School of Library and Information Science Indiana University,
Prediction of Citations for Academic Papers
 000 001 002 003 004 005 006 007 008 009 010 011 012 013 014 015 016 017 018 019 020 021 022 023 024 025 026 027 028 029 030 031 032 033 034 035 036 037 038 039 040 041 042 043 044 045 046 047 048 049 050
Pseudocode for calculating Eigenfactor TM Score and Article Influence TM Score using data from Thomson-Reuters Journal Citations Reports
 Pseudocode for calculating Eigenfactor TM Score and Article Influence TM Score using data from Thomson-Reuters Journal Citations Reports Jevin West and Carl T. Bergstrom November 25, 2008 1 Overview There
Communities Via Laplacian Matrices. Degree, Adjacency, and Laplacian Matrices Eigenvectors of Laplacian Matrices
 Communities Via Laplacian Matrices Degree, Adjacency, and Laplacian Matrices Eigenvectors of Laplacian Matrices The Laplacian Approach As with betweenness approach, we want to divide a social graph into
Missouri Educator Gateway Assessments
 Missouri Educator Gateway Assessments June 2014 Content Domain Range of Competencies Approximate Percentage of Test Score I. Number and Operations 0001 0002 19% II. Algebra and Functions 0003 0006 36%
On the map: Nature and Science editorials
 Scientometrics (2011) 86:99 112 DOI 10.1007/s11192-010-0205-9 On the map: Nature and Science editorials Cathelijn J. F. Waaijer Cornelis A. van Bochove Nees Jan van Eck Received: 9 February 2010 / Published
Computational Biology Course Descriptions 12-14
 Computational Biology Course Descriptions 12-14 Course Number and Title INTRODUCTORY COURSES BIO 311C: Introductory Biology I BIO 311D: Introductory Biology II BIO 325: Genetics CH 301: Principles of Chemistry
Machine Learning - MT Clustering
 Machine Learning - MT 2016 15. Clustering Varun Kanade University of Oxford November 28, 2016 Announcements No new practical this week All practicals must be signed off in sessions this week Firm Deadline:
Coercive Journal Self Citations, Impact Factor, Journal Influence and Article Influence
 Coercive Journal Self Citations, Impact Factor, Journal Influence and Article Influence Chia-Lin Chang Department of Applied Economics Department of Finance National Chung Hsing University Taichung, Taiwan
Lecture 7: DecisionTrees
 Lecture 7: DecisionTrees What are decision trees? Brief interlude on information theory Decision tree construction Overfitting avoidance Regression trees COMP-652, Lecture 7 - September 28, 2009 1 Recall:
CS 6375 Machine Learning
 CS 6375 Machine Learning Decision Trees Instructor: Yang Liu 1 Supervised Classifier X 1 X 2. X M Ref class label 2 1 Three variables: Attribute 1: Hair = {blond, dark} Attribute 2: Height = {tall, short}
Applying cluster analysis to 2011 Census local authority data
 Applying cluster analysis to 2011 Census local authority data Kitty.Lymperopoulou@manchester.ac.uk SPSS User Group Conference November, 10 2017 Outline Basic ideas of cluster analysis How to choose variables
Big-Geo-Data EHR Infrastructure Development for On-Demand Analytics
 Big-Geo-Data EHR Infrastructure Development for On-Demand Analytics Sohayla Pruitt, MA Senior Geospatial Scientist Duke Medicine DUHS DHTS EIM HIRS Page 1 Institute of Medicine, World Health Organization,
Science Maps. Different Datasets Different Analyses and Visualizations Different User Groups
 Identifying Overlap, Gaps and Emerging Research Areas Using Multi-Level Science Maps Katy Börner Cyberinfrastructure for Network Science Center, Director Information Visualization Laboratory, Director
Statistical Analysis of Network Data
 Statistical Analysis of Network Data Lecture 1 Network Mapping & Characterization Eric D. Kolaczyk Dept of Mathematics and Statistics, Boston University kolaczyk@bu.edu Setting Context Introduction Over
Feature Engineering, Model Evaluations
 Feature Engineering, Model Evaluations Giri Iyengar Cornell University gi43@cornell.edu Feb 5, 2018 Giri Iyengar (Cornell Tech) Feature Engineering Feb 5, 2018 1 / 35 Overview 1 ETL 2 Feature Engineering
Alexander Klippel and Chris Weaver. GeoVISTA Center, Department of Geography The Pennsylvania State University, PA, USA
 Analyzing Behavioral Similarity Measures in Linguistic and Non-linguistic Conceptualization of Spatial Information and the Question of Individual Differences Alexander Klippel and Chris Weaver GeoVISTA