Zone A Modeling (What Makes A Equal Approximate, Adequate, or Awesome)
|
|
|
- Marcus Parsons
- 6 years ago
- Views:
Transcription

1 Zone A Modeling (What Makes A Equal Approximate, Adequate, or Awesome) ASFPM 2016 GRAND RAPIDS CONFERENCE Kevin Donnelly, P.E., GISP, PMP, CFM June 23, 2016
2 Agenda 1 Introduction 2 Flood Hazard Analysis and Mapping Process 3 Study of Uncertainty 4 Benefit Cost Analysis 5 Conclusions
3 1 Introduction Great Minds Impact of Flood Hazard Modeling Parameters on Base Flood Elevation (BFE) and Floodplain Top Width (Including Calculation of Return on Investment (ROI) for Selected Input Variables), FEMA, February 29, 2016 Goals 1. Review uncertainty in flood hazard mapping 2. Analyze sensitivity to changes in hydraulic analysis variables 3. Analyze the Return On Investment (ROI) in refining hydraulic variables Summary of Findings plus added insights/thoughts
 Soumya Sagarika (Atkins) FEMA Rick")
4 Credits STARR II Mike DePue (Atkins) Ferrin Affleck (Atkins) Soumya Sagarika (Atkins) FEMA Rick Sacbibit
5 Zone A Flood Hazard Mapping Approximate, Base Level Special Flood Hazard Area (SFHA) 1% Base Flood Elevations, not mapped flood profiles, floodways
6 Zone A - Musts Must be cost effective - ~900,000 miles Must be defendable (model backed) Must make choices that impact cost and accuracy
7 Zone A Choices Terrain Source Modeling Approach Hydrology Hydraulics 1D steady, 1D unsteady, 2D Assumptions & Parameters


8 2 - Flood Hazard Analysis and Mapping Process Elevation Data Terrain Data Bathymetry Data Hydrology Data Rainfall Runoff Models Flood Frequency Analysis Regression Equations Hydraulic Analysis Contraction/Expansion Friction Loss Cross Section Geometry Flood Hazard Map
9 Elevation and Terrain Data THE most important factor in determining BFEs and the extent of flooding accuracy of flood hazard maps in riverine areas found by multiple studies. Cook and Merwade (2009) found that the average width and area of inundation for a 30 m DEM are more that 25% higher compared to the that produced by using LIDAR. Solution terrain standards for regulatory mapping.
10 Hydrology Flood Frequency Analysis gage analysis Regression Equations flow function of drainage area and (maybe) other parameters, derived from gages Rainfall Runoff Models hydrologic simulations Solution 1%- and 1%+ flood profiles Upper and lower bounds of predictive error (84% limit) WSEL changes to in NC NRC study (2009)
11 Hydraulics Model choices Type 1D, steady or unsteady 2D Software HEC-RAS, Flo-2D, SWMM, ICPR, MIKE, etc. Parameters N values Expansion/Contraction Coefficients Approach Bridges Bathymetry Solution Study Types? Detailed, Limited Detailed, Approximate, FOA/LSAE

12 3 Study of Uncertainty Isolate single variable and test impact on 1% elevations and width Test 30 streams - all HEC-RAS 1D steady flow models
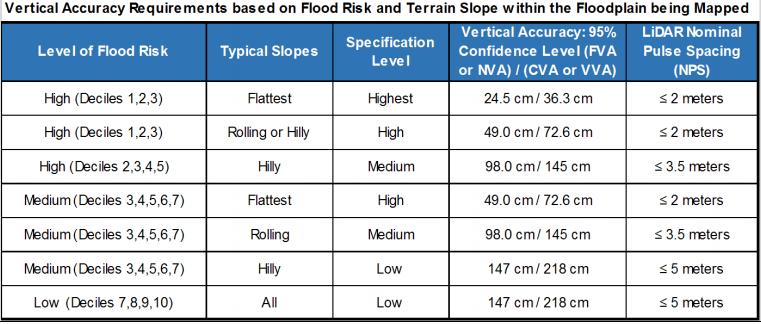
13 Terrain Divide country into 3 equal distributions of slope High Hilly Medium Rolling Low Flat Terrain categories are used to define vertical accuracy requirements per FEMA SID #43 Compute average slope for HUC-12 basins
14 Terrain

15 Slope-Based Terrain Map of US
16 List of Studied Streams Terrain Category Stream Name Length (miles) of structures Discharge (cfs ) FEMA Region Hilly Cedar ,608 RX Deschutes (D2) ,568 RX Rogue River ,413 RX Sandy River ,721 RX Stoneway Wash RIX Washogal River ,939 RX
17 List of Studied Streams Terrain Category Stream Name Length (miles) of structures Discharge (cfs ) FEMA Region Rolling American Wash ,151 RIX Big Cotton Indian Creek ,923 RIV Camp Creek ,263 RIV Hazel Creek ,504 RIV Indian Creek ,827 RVII Kelly Creek RX Little Butte Creek ,680 RX Little Mud Creek ,155 RIV Mint Wash ,311 RIX Pumphouse Wash ,963 RIX Reeves Creek ,941 RIV Camp Creek ,263 RIV Hazel Creek ,504 RIV
18 List of Studied Streams Terrain Category Stream Name Length (miles) of structures Discharge (cfs) FEMA Region Flat 7th Avenue Creek RV 7th Avenue Creek Trib RV Deschutes (D1) ,891 RX Mid Br Clinton River ,808 RV rth Fork Teton ,243 RX Paint Creek ,714 RV Plumb Brook RV Walnut Creek ,246 RVII West Branch Walnut River ,222 RVII West Branch Walnut River Overflow ,345 RVII Whitewater Creek ,951 RVII
19 Testing Approach Isolate single variable and test impact on 1% elevations and width Test 30 streams - all HEC-RAS 1D steady flow models Base models all prepared for Zone AE mapping Surveyed channels Surveyed structures Overbank from LiDAR/2-4 contours Variable Manning s N Values from NLCD or Aerial Imagery


20 Testing Approach - Parameters 1. Channel Bathymetry Surveyed DEM (LiDAR or 24 contours)
21 Testing Approach - Parameters 2. Structure Modeling Surveyed Assumed Structures as Weirs Structures
22 Testing Approach - Parameters 3. Manning s Roughness Horizontal Variation NLCD or Aerial Imagery Bank-Channel-Bank (BCB) NLCD Averaged over each bank and channel One Value Assumed or averaged from NLCD Banks at end of cross sections
23 Parameter Modifications Scenarios Run. Bathymetry Source Structure Approach Manning s Approach 1 (Base) Surveyed bathymetry Surveyed structures Horizontal Variation 2 DEM terrain only Surveyed structures Horizontal Variation 3 DEM terrain only Assumed structures Horizontal Variation 4 DEM terrain only Structures as weirs Horizontal Variation 5 DEM terrain only structures Horizontal Variation 6 DEM terrain only structures Bank-channel-bank 7 DEM terrain only structures One value 8 DEM terrain only Assumed structures Bank-channel-bank 9 DEM terrain only Assumed structures One value
24 General Results Summary of BFE Comparison to the Run 1 Terrain Difference (feet WSEL) Run 2 Bath. Surv. Struc. Horiz. Var. Run 3 Bath. Assm. Struc. Horiz. Var. Run 4 Bath. Weir Struc. Horiz. Var. Run 5 Bath. Struc. Horiz. Var. Run 6 Bath. Struc. Bank- Channel -Bank (BCB) Run 7 Bath. Struc. One n Run 8 Bath. Assm. Struc. Bank- Channel- Bank (BCB) Run 9 Bath. Assm. Struc. One n Average Hilly Maximum Std. Dev Average Rolling Maximum Std. Dev Average Flat Maximum Std. Dev
25 General Results Summary of Top Width Comparison to the Run 1 Terrain Difference (feet top width) Run 2 Bath. Surv. Struc. Horiz. Var. Run 3 Bath. Assm. Struc. Horiz. Var. Run 4 Bath. Weir Struc. Horiz. Var. Run 5 Bath. Struc. Horiz. Var. Run 6 Bath. Struc. BCB Run 7 Bath. Struc. One n Run 8 Bath. Assm. Struc. BCB Run 9 Bath. Assm. Struc. One n Average Hilly Maximum Std. Dev Average Rolling Maximum Std. Dev Average Flat Maximum Std. Dev
26 General Results Distribution of BFE Change vs. Base Condition (Run 1) Hilly Terrain Change in Base Flood Elebvation (ft) Channel Geometry Representation Assumed structures Structures as weirs structures structures and BCB mannings structures, one mannings Assumed structures, BCB Manning Assumed structures, One Mannings Hydraulic Model Type Average
27 General Results Distribution of BFE Change vs. Base Condition (Run 1) Rolling Terrain Change in Base Flood Elebvation (ft) Channel Geometry Representation Assumed structures Structures as weirs structures structures and BCB mannings structures, one mannings Assumed structures, BCB Manning Assumed structures, One Mannings Hydraulic Model Type
28 General Results Distribution of BFE Change vs. Base Condition (Run 1) Flat Terrain Change in Base Flood Elebvation (ft) Channel Geometry Representation Assumed structures Structures as weirs structures structures and BCB mannings structures, one mannings Assumed structures, BCB Manning Assumed structures, One Mannings Hydraulic Model Type


29 Parameter-Specific Results Channel Bathymetry Terrain Difference caused by removing bathymetry BFE change (ft) Top Width Change (ft) Average Hilly Maximum Std. Dev Average Rolling Maximum Std. Dev Average Flat Maximum Std. Dev
 Structures as weirs")


30 Parameter-Specific Results Structures Terrain Hilly Difference Assumed structures BFE Change (ft) Structures as weirs structures Assumed structures Top Width Change (ft) Structures as weirs Average Maximum , Std. Dev structures Very Stream Specific Taller structures caused higher variability Average Rolling Maximum , ,280.1 Std. Dev Average Flat Maximum , ,295.2 Std. Dev
 Bank-Channel- Bank (BCB) Comparable Horizontal Assm. Variation Struc. RunStruc. One Value Assm. Struc. Bank-channelbank structures 5 6 Average 0.1 0.1 3.")

31 Parameter-Specific Results Manning s N Value Terrain Hilly Rolling Flat Difference BFE Change (ft) Bank-Channel- One Value Bank (BCB) Struc. Run Assm.. Struc. Manning s Approach Struc. Structure Assm. Approach Struc. Struc. Top Width Change (ft) Bank-Channel- Bank (BCB) Comparable Horizontal Assm. Variation Struc. RunStruc. One Value Assm. Struc. Bank-channelbank structures 5 6 Average One value Maximum Bank-channelbank Assumed Std. Dev structures Average One 0.8 value Maximum Std. Dev Average Maximum Std. Dev
32 4 Benefit Cost Analysis Relative Return On Investment (ROI) Process Determine Total Cost Length * Unit Cost Determine Total Loss Unit Loss = Total Loss in Census Block/Block Area Total Loss = Unit Loss * Floodplain Area Determine the ROI Index Identify two scenarios to compare Calculate the change in total loss and total cost between the 2 scenarios ROI Index = ABS(Change in Total Loss/Change in Total Cost)
33 ROI Index Intended to help decision making Indicates which change in approach yields the largest change in estimated losses per dollar spent. Higher ROI Index = Greater ROI for given stream Value of ROI Index less important than comparison with that of another parameter on the same stream.
34 Typical Unit Costs used in ROI Index Run Channel Bathymetry Run Description Structures Approach Manning s Approach Comparable Type of Study Estimated average cost per mile 1 Surveyed Surveyed Structures Horizontal Variation Detailed $9,333 2 DEM only Surveyed Structures Horizontal Variation Limited Detail w/ Structures $4,366 3 DEM only Assumed Structures Horizontal Variation Approximate (High) $1,000 4 DEM only Structures as weirs Horizontal Variation Approx. (Medium/Low) 5 DEM only structures Horizontal Variation Approximate (Low) $250 6 DEM only structures Bank-channel-bank Approximate (Low) $150 7 DEM only structures One value FOA/LSAE $32 8 DEM only Assumed Structures Bank-channel-bank 9 DEM only Assumed Structures One value Approximate (Medium) Approximate (Medium/Low) $500 $667 $550
35 ROI Index Hilly Terrain Parameter Runs Compared Parameter Change ROI Index Bathymetry 2 to 1 Upgrade from DEM terrain only to surveyed bathymetry Structure 3 to 2 Upgrade from assumed structures to surveyed structures 4 to 3 Upgrade from structures as weir to assumed structures 5 to 4 Upgrade from no structures to structures as weirs Manning s 6 to 5 Upgrade from bank-channelbank to horizontal variation 7 to 6 Upgrade from one manning s n value to bank-channel-bank Average = 1.9 Std. Dev. = 2.2 Average = 5.9 Std. Dev. = 12.6 Average = 42.9 Std. Dev. = 92.2 Average = 6.3 Std. Dev. = 15.0 Average = 8.1 Std. Dev. = 12.8 Average = Std. Dev. = 242.4
36 ROI Index Rolling Terrain Parameter Runs Compared Parameter Change ROI Index Bathymetry 2 to 1 Upgrade from DEM terrain only to surveyed bathymetry Structure 3 to 2 Upgrade from assumed structures to surveyed structures 4 to 3 Upgrade from structures as weir to assumed structures 5 to 4 Upgrade from no structures to structures as weirs Manning s 6 to 5 Upgrade from bank-channelbank to horizontal variation 7 to 6 Upgrade from one manning s n value to bank-channel-bank Average = 0.1 Std. Dev. = 0.2 Average = 0.1 Std. Dev. = 0.3 Average = 1.7 Std. Dev. = 3.8 Average = 3.5 Std. Dev. = 7.3 Average = 3.7 Std. Dev. = 3.6 Average = 72.2 Std. Dev. = 153.3
37 ROI Index Flat Terrain Parameter Runs Compared Parameter Change ROI Index Bathymetry 2 to 1 Upgrade from DEM terrain only to surveyed bathymetry Structure 3 to 2 Upgrade from assumed structures to surveyed structures 4 to 3 Upgrade from structures as weir to assumed structures 5 to 4 Upgrade from no structures to structures as weirs Manning s 6 to 5 Upgrade from bank-channelbank to horizontal variation 7 to 6 Upgrade from one manning s n value to bank-channel-bank Average = 0.4 Std. Dev. = 0.3 Average = 0.4 Std. Dev. = 0.5 Average = 12.1 Std. Dev. = 31.6 Average = 23.4 Std. Dev. = 64.7 Average = 4.5 Std. Dev. = 4.8 Average = 26.0 Std. Dev. = 27.3
38 5 - Conclusions Results show sensitivity of the BFE and top width to model parameters should be considered when selecting a modeling method Type of terrain affects the uncertainty of a model Sensitivity of the BFE is more prominent in hilly areas Sensitivity of the top width is more prominent in flat areas Upgrading from single Manning s N method provides high ROI, larger impact than adding structures Benefits of improving structure modeling depends on terrain
39 5 - Conclusions Method of modeling should ideally consider: the present and future characteristics of the area being mapped topographical factors hydraulic factors population growth land available for development economic value of structures As conditions change, different variables dominate the potential for variation in BFE and top width, and indirectly influence the ROI of modeling investments.


40 Decision chart by terrain and variable type
41 Observations Decision guides can add logic to modeling choices Need to decide what is more important: BFE or Flood Zone ROI Index may not be the best way to evaluate improvements in quality but factors in inherent risk of the streams location
42 References Cook, A., Merwade, V., (2009), Effect of topographic data, geometric configuration and modeling approach on flood inundation mapping, Journal of Hydrology, Volume 377, Issues 1 2, 20 October 2009, Pages , ISSN , FEMA, (2014b), Guidance for Flood Risk Analysis and Mapping, First Order Approximation, Issued vember 14, 27 pp. FEMA, (2015), Guidance: General Hydraulic Analysis, Issued vember 2016 FEMA (2016) Impact of Flood Hazard Modeling Parameters on Base Flood Elevation (BFE) and Floodplain Top Width, Issued February 29, Jung, Y., & Merwade, V. (2015). Estimation of uncertainty propagation in flood inundation mapping using a 1 D hydraulic model. Hydrological Processes, 29(4),
43 Questions?
YELLOWSTONE RIVER FLOOD STUDY REPORT TEXT
 YELLOWSTONE RIVER FLOOD STUDY REPORT TEXT TECHNICAL REPORT Prepared for: City of Livingston 411 East Callender Livingston, MT 59047 Prepared by: Clear Creek Hydrology, Inc. 1627 West Main Street, #294
ASFPM - Rapid Floodplain Mapping
 ASFPM - Nicole Cominoli Hydraulic Engineer USACE - Omaha District mary.n.cominoli@usace.army.mil June 3, 2015 US Army Corps of Engineers Mitigation = Risk Informed Decisions 2 The National Flood Insurance
Base Level Engineering FEMA Region 6
 Base Level Engineering Over the past five years, has been evaluating its investment approach and data preparation work flow to establish an efficient and effective change in operation, generating an approach
LOMR SUBMITTAL LOWER NEHALEM RIVER TILLAMOOK COUNTY, OREGON
 LOMR SUBMITTAL LOWER NEHALEM RIVER TILLAMOOK COUNTY, OREGON Prepared for: TILLAMOOK COUNTY DEPARTMENT OF COMMUNITY DEVELOPMENT 1510-B THIRD STREET TILLAMOOK, OR 97141 Prepared by: 10300 SW GREENBURG ROAD,
LOMR SUBMITTAL LOWER NESTUCCA RIVER TILLAMOOK COUNTY, OREGON
 LOMR SUBMITTAL LOWER NESTUCCA RIVER TILLAMOOK COUNTY, OREGON Prepared for: TILLAMOOK COUNTY DEPARTMENT OF COMMUNITY DEVELOPMENT 1510-B THIRD STREET TILLAMOOK, OR 97141 Prepared by: 10300 SW GREENBURG ROAD,
ARMSTRONG COUNTY, PA
 ARMSTRONG COUNTY, PA Revised Preliminary DFIRM Mapping March 31, 2013 Kevin Donnelly, P.E., CFM GG3, Greenhorne & O Mara, Inc. Presentation Agenda Armstrong County DFIRM Overview - June 25, 2010 DFIRM
GREENE COUNTY, PA. Revised Preliminary DFIRM Mapping FEMA. Kevin Donnelly, P.E., CFM GG3, Greenhorne & O Mara, Inc. April 10, 2013
 GREENE COUNTY, PA Revised Preliminary DFIRM Mapping April 10, 2013 Kevin Donnelly, P.E., CFM GG3, Greenhorne & O Mara, Inc. Presentation Agenda Greene County DFIRM Overview September 30, 2010 DFIRM Countywide
UPPER COSUMNES RIVER FLOOD MAPPING
 UPPER COSUMNES RIVER FLOOD MAPPING DRAFT BASIC DATA NARRATIVE FLOOD INSURANCE STUDY SACRAMENTO COUTY, CALIFORNIA Community No. 060262 November 2008 Prepared By: CIVIL ENGINEERING SOLUTIONS, INC. 1325 Howe
Out with the Old, In with the New: Implementing the Results of the Iowa Rapid Floodplain Modeling Project
 Out with the Old, In with the New: Implementing the Results of the Iowa Rapid Floodplain Modeling Project Traci Tylski, E.I., CFM Hydraulics Engineer USACE - Omaha District Traci.M.Tylski@USACE.army.mil
Appendix E Guidance for Shallow Flooding Analyses and Mapping
 Appendix E Guidance for Shallow Flooding Analyses and Mapping E.1 Introduction Different types of shallow flooding commonly occur throughout the United States. Types of flows that result in shallow flooding
Dealing with Zone A Flood Zones. Topics of Discussion. What is a Zone A Floodplain?
 Dealing with Zone A Flood Zones Topics of Discussion Overview of Zone A Floodplains Permitting Development in Zone A Floodplains Estimating Flood Elevations in Zone A Flood Insurance Implications Letters
New Service Provided by State Agency in Oregon: Base Flood Elevation Determinations
 New Service Provided by State Agency in Oregon: Base Flood Elevation Determinations Jed Roberts, MS, CFM Flood Mapping Coordinator Oregon Department of Geology and Mineral Industries (DOGAMI) About DOGAMI
PENNSYLVANIA DEPARTMENT OF TRANSPORTATION ENGINEERING DISTRICT 3-0
 PENNSYLVANIA DEPARTMENT OF TRANSPORTATION ENGINEERING DISTRICT 3-0 LYCOMING COUNTY S.R.15, SECTION C41 FINAL HYDROLOGIC AND HYDRAULIC REPORT STEAM VALLEY RUN STREAM RELOCATION DATE: June, 2006 REVISED:
Issue 44: Phase II & III H&H Issues Date: 07/03/2006 Page 1
 Background Phase I of the NCFMP studies have primarily focused on the coastal plain and sandhills physiographic regions in of the State. Phase II and III study areas will focus on the piedmont, foothills,
Riverine Modeling Proof of Concept
 Technical Team Meeting Riverine Modeling Proof of Concept Version 2 HEC-RAS Open-water Flow Routing Model April 15-17, 2014 Prepared by R2 Resource Consultants, Brailey Hydrologic, Geovera, Tetra Tech,
Section 4: Model Development and Application
 Section 4: Model Development and Application The hydrologic model for the Wissahickon Act 167 study was built using GIS layers of land use, hydrologic soil groups, terrain and orthophotography. Within
Flood Event Analysis to Estimate the Avoided Damages Due to Flood Improvement Projects & Voluntary Buyout Program
 Flood Event Analysis to Estimate the Avoided Damages Due to Flood Improvement Projects & Voluntary Buyout Program Ataul Hannan, P.E., CFM Planning Division Director Harris County Flood Control District
Applying GIS to Hydraulic Analysis
 Texas A&M University Department of Civil Engineering CVEN689 Applications of GIS to Civil Engineering Instructor: Francisco Olivera, Ph.D., P.E. Applying GIS to Hydraulic Analysis Lim, Chae Kwan April
Risk Identification using Hazus
 Risk Identification using Hazus City of Boston, Suffolk County, MA Dave Shortman, GISP, CFM 6/21/2016 Agenda Objective Project Location Hazus Overview Hazus Level 2 Risk Assessment Comparison and Reporting
Using NFHL Data for Hazus Flood Hazard Analysis: An Exploratory Study
 Andrea M. Jackman, Ph.D. ASFPM June 3, 2015 Using NFHL Data for Hazus Flood Hazard Analysis: An Exploratory Study What is Hazus? Hazus is FREE software distributed by FEMA Risk MAP which models structural
Floodplain Modeling and Mapping Using The Geographical Information Systems (GIS) and Hec-RAS/Hec-GeoRAS Applications. Case of Edirne, Turkey.
 and Hec-RAS/Hec-GeoRAS Applications. Case of Edirne, Turkey.") Floodplain Modeling and Mapping Using The Geographical Information Systems (GIS) and Hec-RAS/Hec-GeoRAS Applications. Case of Edirne, Turkey. Fuad Hajibayov *1, Basak Demires Ozkul 1, Fatih Terzi 1 1 Istanbul
Floodplain Modeling and Mapping Using The Geographical Information Systems (GIS) and Hec-RAS/Hec-GeoRAS Applications. Case of Edirne, Turkey. Fuad Hajibayov *1, Basak Demires Ozkul 1, Fatih Terzi 1 1 Istanbul
Flood Insurance Study
 Flood Insurance Study Grant County, Arkansas Status Meeting November 17, 2010, 2pm Grant County OES/EOC 130 Grant 74, Sheridan, AR 72150 1 Presentation Overview Introduction FEMA Risk MAP Update Study
Beaver Creek Corridor Design and Analysis. By: Alex Previte
 Beaver Creek Corridor Design and Analysis By: Alex Previte Overview Introduction Key concepts Model Development Design Accuracy Conclusion Refresh v = Beaver Creek Site = Wittenberg Introduction Low head
Pequabuck River Flooding Study and Flood Mitigation Plan The City of Bristol and Towns of Plainville and Plymouth, CT
 Pequabuck River Flooding Study and Flood Mitigation Plan The City of Bristol and Towns of Plainville and Plymouth, CT Raymond Rogozinski and Maged Aboelata The City of Bristol and Towns of Plainville and
Vulnerability of Flood Hazard in Selected Ayeyarwady Delta Region, Myanmar
 Vulnerability of Flood Hazard in Selected Ayeyarwady Delta Region, Myanmar Khin Thandar Win Department of Civil Engineering Nilar Aye Department of Civil Engineering Kyaw Zaya Htun Department of Remote
Determination of flood risks in the yeniçiftlik stream basin by using remote sensing and GIS techniques
 Determination of flood risks in the yeniçiftlik stream basin by using remote sensing and GIS techniques İrfan Akar University of Atatürk, Institute of Social Sciences, Erzurum, Turkey D. Maktav & C. Uysal
3.11 Floodplains Existing Conditions
 Other stormwater control practices may be needed to mitigate water quality impacts. In addition to detention facilities, other practices such as vegetated basins/buffers, infiltration basins, and bioswales
Semester Project Final Report. Logan River Flood Plain Analysis Using ArcGIS, HEC-GeoRAS, and HEC-RAS
 Semester Project Final Report Logan River Flood Plain Analysis Using ArcGIS, HEC-GeoRAS, and HEC-RAS Kedric Curtis, Josh Hogge, Jordan Jarrett, Jared Justensen May 6, 2016 CEE 6190 GIS for Civil Engineers
Probabilistic Evaluation of a Meandering Low-Flow Channel. February 24 th, UMSRS
 Probabilistic Evaluation of a Meandering Low-Flow Channel February 24 th, 2014 2014 UMSRS 1 2 acknowledgments Low- Flow Channel (LFC) overview Proposed Diversion Channel collects runoff from: The Rush
Flood Hazard Inundation Mapping. Presentation. Flood Hazard Mapping
 Flood Hazard Inundation Mapping Verne Schneider, James Verdin, and JeradBales U.S. Geological Survey Reston, VA Presentation Flood Hazard Mapping Requirements Practice in the United States Real Time Inundation
Objectives: After completing this assignment, you should be able to:
 Data Analysis Assignment #1 Evaluating the effects of watershed land use on storm runoff Assignment due: 21 February 2013, 5 pm Objectives: After completing this assignment, you should be able to: 1) Calculate
NAVAJO NATION PROFILE
 NAVAJO NATION PROFILE Largest land based area and federally recognized tribe in the United States Over 27,000 square miles (or 17.2 million acres with a population of over 300,000 people. Covers Arizona,
International Journal Of Scientific & Engineering Research, Volume 7, Issue 7, July ISSN
 International Journal Of Scientific & Engineering Research, Volume 7, Issue 7, July-2016 709 FLOOD MITIGATION STUDY IN ADAYAR RIVER USING MIKE-FLOOD Vidyapriya.V a and Ramalingam. M b a Research scholar,
Las Colonias Subdivision September 2010 Flood Study
 Las Colonias Subdivision September 2010 Flood Study Curtis Beitel, P.E., CFM Scott Muchard, P.E. Project Engineer William Badini, CFM Senior Meteorologist Location Map Background Los Colonias Subdivision
GIS Techniques for Floodplain Delineation. Dean Djokic
 GIS Techniques for Floodplain Delineation Dean Djokic (ddjokic@esri.com) Content What is a floodplain? How to get a floodplain? What can GIS do for floodplain modeling? Simple GIS techniques for floodplain
Rapid Flood Mapping Using Inundation Libraries
 Rapid Flood Mapping Using Inundation Libraries Jude Kastens, Kevin Dobbs, James Halgren, Katherine Balster 2017 ASFPM Conference May 3, 2017 5 mi Kansas River Valley between Manhattan and Topeka Email:
USGS Flood Inundation Mapping of the Suncook River in Chichester, Epsom, Pembroke and Allenstown, New Hampshire
 USGS Flood Inundation Mapping of the Suncook River in Chichester, Epsom, Pembroke and Allenstown, New Hampshire NH Water & Watershed Conference Robert Flynn, USGS NH-VT Water Science Center March 23, 2012
INFLOW DESIGN FLOOD CONTROL SYSTEM PLAN 40 C.F.R. PART PLANT YATES ASH POND 2 (AP-2) GEORGIA POWER COMPANY
 GEORGIA POWER COMPANY") INFLOW DESIGN FLOOD CONTROL SYSTEM PLAN 40 C.F.R. PART 257.82 PLANT YATES ASH POND 2 (AP-2) GEORGIA POWER COMPANY EPA s Disposal of Coal Combustion Residuals from Electric Utilities Final Rule (40 C.F.R.
INFLOW DESIGN FLOOD CONTROL SYSTEM PLAN 40 C.F.R. PART 257.82 PLANT YATES ASH POND 2 (AP-2) GEORGIA POWER COMPANY EPA s Disposal of Coal Combustion Residuals from Electric Utilities Final Rule (40 C.F.R.
ELEVATION. The Base Map
 ELEVATION The Base Map Basic Elevation Types: Points X, Y, Z Irregular distribution Cumbersome Typical sources Lidar Stereo photography Ground survey ASCII, LAS formats Basic Elevation Types: Contour Lines
Effects of input DEM data spatial resolution on Upstream Flood modeling result A case study in Willamette river downtown Portland
 Effects of input DEM data spatial resolution on Upstream Flood modeling result A case study in Willamette river downtown Portland By Hue Duong GEOG 593 Fall 2015 Digital Terrain Analysis Photo: Anh Duc
Extreme Phenomena in Dobrogea - Floods and Droughts
 Extreme Phenomena in Dobrogea - Floods and Droughts PhD eng. Carmen Maftei Ovidius University of Constanta (Partner no 4) OUTLINES Introduction Study area Drought Floods Conclusion What is the problem?
Leveraging new models and data to improve flood stage forecast. Improving Flood Stage Forecasting in the Feather River Watershed. September 11 th 2015
 Leveraging new models and data to improve flood stage forecast Improving Flood Stage Forecasting in the Feather River Watershed September 11 th 2015 Mitch Russo, P.E. (DWR) Ashok Bathulla, P.E., CFM (GEI)
Flood Inundation Mapping
 KU GIS Day 2009 November 18, 2009 Flood Inundation Mapping Wendy L. Pearson NOAA s National Weather Service Central Region Headquarters Kansas City, Missouri Flood Inundation Mapping Objectives: Overview
TRWD Upper Trinity River Flood Operations Decision Support System
 TRWD Upper Trinity River Flood Operations Decision Support System TFMA 2012 Fall Conference Rockwall, Texas September 20, 2012 Presented by: Andrew Ickert, PE, CFM & Craig Ottman, PE, CFM (Halff Associates,
Debris Flow Modeling & Regulations in Aspen, Colorado
 TETRA TECH River, Costal ASFPM & Engineering May 2017 Group Ft Collins Debris Flow Modeling & Regulations in Aspen, Colorado Dai Thomas, PhD, PE Andrew Earles, PhD, PE Wright Water Engineers Jim O Brien,
TSEGI WASH 50% DESIGN REPORT
 TSEGI WASH 50% DESIGN REPORT 2/28/2014 Daniel Larson, Leticia Delgado, Jessica Carnes I Table of Contents Acknowledgements... IV 1.0 Project Description... 1 1.1 Purpose... 1 Figure 1. Erosion of a Headcut...
VOLUME 3 OF 3 FAIRFIELD COUNTY, OHIO AND INCORPORATED AREAS COMMUNITY NAME NUMBER COMMUNITY NAME NUMBER
 VOLUME 3 OF 3 FAIRFIELD COUNTY, OHIO AND INCORPORATED AREAS COMMUNITY NAME NUMBER COMMUNITY NAME NUMBER AMANDA, VILLAGE OF * 390688 PICKERINGTON, CITY OF 390162 BALTIMORE, VILLAGE OF 390159 PLEASANTVILLE,
USGS Hydrography Overview. May 9, 2018
 + 1 USGS Hydrography Overview May 9, 2018 + 2 The National Geospatial Program Provides the geospatial baseline of the Nation s topography, natural landscape and built environment through The National Map,
FLOOD RISK MAPPING AND ANALYSIS OF THE M ZAB VALLEY, ALGERIA
 River Basin Management IX 69 FLOOD RISK MAPPING AND ANALYSIS OF THE M ZAB VALLEY, ALGERIA AMEL OUCHERIF & SAADIA BENMAMAR National Polytechnic School of Algiers, Algeria ABSTRACT To contribute to flood
FLOOD HAZARD AND RISK ASSESSMENT IN MID- EASTERN PART OF DHAKA, BANGLADESH
 FLOOD HAZARD AND RISK ASSESSMENT IN MID- EASTERN PART OF DHAKA, BANGLADESH Muhammad MASOOD MEE07180 Supervisor: Prof. Kuniyoshi TAKEUCHI ABSTRACT An inundation simulation has been done for the mid-eastern
District-Wide Approach to Water Resource Modeling
 District-Wide Approach to Water Resource Modeling Water Resources Conference October 16, 2012 Phil Belfiori, RCWD Chris Otterness, HEI Mike Lawrence, HEI Overview Rice Creek Watershed District Approximately
Chapter 5 CALIBRATION AND VERIFICATION
 Chapter 5 CALIBRATION AND VERIFICATION This chapter contains the calibration procedure and data used for the LSC existing conditions model. The goal of the calibration effort was to develop a hydraulic
Results of the Sava River Model
 Results of the Sava River Model Jamie G. James, P.E. Nashville District September 2010 US Army Corps of Engineers BUILDING STRONG Discussion Outline Study Goals Model Limitations HEC-RAS Model Results
REMOTE SENSING AND GEOSPATIAL APPLICATIONS FOR WATERSHED DELINEATION
 REMOTE SENSING AND GEOSPATIAL APPLICATIONS FOR WATERSHED DELINEATION Gaurav Savant (gaurav@engr.msstate.edu) Research Assistant, Department of Civil Engineering, Lei Wang (lw4@ra.msstate.edu) Research
4 th Joint Project Team Meeting for Sentinel Asia 2011
 A Revisit on the Structural Flood Mitigation Measure with the Application of Remote Sensing and GIS in Gin River Basin, Sri Lanka 4 th Joint Project Team Meeting for Sentinel Asia 2011 Geoinformatics Center
LOCATED IN INDIAN RIVER COUNTY PREPARED FOR S.J.R.W.M.D. AND F.W.C.D. DECEMBER, 2003 Updated 2007 Updated May 2014 PREPARED BY
 FELLSMERE WATER CONTROL DISTRICT EAST MASTER DRAINAGE PLAN AND STORMWATER HYDROLOGIC ANALYSIS OF THE GRAVITY DRAINAGE SYSTEM LOCATED BETWEEN THE EAST BOUNDARY, LATERAL U, THE MAIN CANAL, AND DITCH 24 LOCATED
Corps Involvement in FEMA s Map Modernization Program
 HH&C Tri-Service Infrastructure Conference 2-5 August 2005 - St. Louis Corps Involvement in FEMA s Map Modernization Program Kate White, PhD, PE (CEERD-RN) John Hunter, PE (CELRN) Mark Flick (CELRN) FEMA
Pompton Lakes Dam Downstream Effects of the Floodgate Facility. Joseph Ruggeri Brian Cahill Michael Mak Andy Bonner
 Pompton Lakes Dam Downstream Effects of the Joseph Ruggeri Brian Cahill Michael Mak Andy Bonner ASFPM 2013: Overview Page 2 Overview Page 3 Overview Page 4 Overview Page 5 Overview - Historical Pompton
Bushkill Creek 3 rd Street Dam Removal Analysis
 Bushkill Creek 3 rd Street Dam Removal Analysis HEC HMS Runoff and Routing Model Stephen Beavan, Melanie DeFazio, David Gold, Peter Mara and Dan Moran CE 421: Hydrology Fall 2010 December 15, 2010 Contents
Flood zoning estimation and river management by using HEC-RAS and GIS model
 Int. J. Energ. Water Resour., 1(1): 13-18, Winter 2017 IRSEN, IAU Flood zoning estimation and river management by using HEC-RAS and GIS model A.R. Mardookhpour*, H. Jamasbi Department of Civil Engineering,
Technical Memorandum No
 Pajaro River Watershed Study in association with Technical Memorandum No. 1.2.10 Task: Evaluation of Four Watershed Conditions - Sediment To: PRWFPA Staff Working Group Prepared by: Gregory Morris and
TOWN OF FORT KENT, MAINE AROOSTOOK COUNTY
 TOWN OF FORT KENT, MAINE AROOSTOOK COUNTY PRELIMINARY: 01/07/2013 Federal Emergency Management Agency COMMUNITY NUMBER 230019V000A NOTICE TO FLOOD INSURANCE STUDY USERS Communities participating in the
FLOODPLAIN MAPPING OF RIVER KRISHNANA USING HEC-RAS MODEL AT TWO STREACHES NAMELY KUDACHI AND UGAR VILLAGES OF BELAGAVI DISTRICT, KARNATAKA
 FLOODPLAIN MAPPING OF RIVER KRISHNANA USING HEC-RAS MODEL AT TWO STREACHES NAMELY KUDACHI AND UGAR VILLAGES OF BELAGAVI DISTRICT, KARNATAKA Sandhyarekha 1, A. V. Shivapur 2 1M.tech Student, Dept. of and
Kevin Zytkovicz, Hydrographer Minnesota DNR, Stream Habitat Program Salam Murtada, P.E., CFM, Floodplain Hydrologist Minnesota DNR, Land Use Unit
 REDUCING LOCALIZED IMPACTS TO RIVER SYSTEMS THROUGH PROPER GEOMORPHIC SIZING OF ON-CHANNEL AND FLOODPLAIN OPENINGS AT ROAD/RIVER INTERSECTIONS Kevin Zytkovicz, Hydrographer Minnesota DNR, Stream Habitat
CENTRAL TEXAS HILL COUNTRY FLOOD
 CENTRAL TEXAS HILL COUNTRY FLOOD Term project report DECEMBER 7, 2018 UNIVERSITY OF TEXAS AT AUSTIN CE394K: GIS in Water Resources Engineering RIFAAI Mohamed Talha Table of Contents Introduction... 3 Context...
L OWER N OOKSACK R IVER P ROJECT: A LTERNATIVES A NALYSIS A PPENDIX A: H YDRAULIC M ODELING. PREPARED BY: LandC, etc, LLC
 L OWER N OOKSACK R IVER P ROJECT: A LTERNATIVES A NALYSIS A PPENDIX A: H YDRAULIC M ODELING PREPARED BY: LandC, etc, LLC TABLE OF CONTENTS 1 Introduction... 1 2 Methods... 1 2.1 Hydraulic Model... 1 2.2
HEC & GIS Modeling of the Brushy Creek HEC & GIS Watershed Modeling of the
 HEC & GIS Modeling of the Brushy Creek HEC & GIS Watershed Modeling of the By Cassandra Fagan 5, December 2014 http://ubcwatershedstudy.ursokr.com/images/ Contents Introduction... 3 Figure 1: 24-hour rainfall
JOURNAL OF ENVIRONMENTAL HYDROLOGY The Electronic Journal of the International Association for Environmental Hydrology VOLUME
 JOURNAL OF ENVIRONMENTAL HYDROLOGY The Electronic Journal of the International Association for Environmental Hydrology VOLUME 18 2010 REDUCED CHANNEL CONVEYANCE ON THE WICHITA RIVER AT WICHITA FALLS, TEXAS,
URBAN AREA HYDROLOGY AND FLOOD MODELLING
 URBAN AREA HYDROLOGY AND FLOOD MODELLING Flood hazard mapping Rengifo Ortega, Jenny Hagen & Péter Borsányi People need space, so do rivers 2 so do rivers http://www.dagbladet.no/2015/09/02/nyheter/innenriks/flom/royken/40924357/
Integrated Watershed Modeling of the Mystic River: Developing the Right Tools for Climate Change Preparedness
 Integrated Watershed Modeling of the Mystic River: Developing the Right Tools for Climate Change Preparedness David Bedoya, PhD, PE Yovanni Cataño-Lopera, PhD, PE Nicholas Stepina, PE Date Presentation
Engineering Hydrology (ECIV 4323) CHAPTER FOUR. Stream flow measurement. Instructors: Dr. Yunes Mogheir Dr. Ramadan Al Khatib
 CHAPTER FOUR. Stream flow measurement. Instructors: Dr. Yunes Mogheir Dr. Ramadan Al Khatib") Engineering Hydrology (ECIV 4323) CHAPTER FOUR Stream flow measurement Instructors: Dr. Yunes Mogheir Dr. Ramadan Al Khatib -١ 4.1 Introduction - Surface water hydrology deals with the movement of water
Engineering Hydrology (ECIV 4323) CHAPTER FOUR Stream flow measurement Instructors: Dr. Yunes Mogheir Dr. Ramadan Al Khatib -١ 4.1 Introduction - Surface water hydrology deals with the movement of water
Technical Memorandum. To: From: Copies: Date: 10/19/2017. Subject: Project No.: Greg Laird, Courtney Moore. Kevin Pilgrim and Travis Stroth
 Technical Memorandum To: From: Greg Laird, Courtney Moore Kevin Pilgrim and Travis Stroth 5777 Central Avenue Suite 228 Boulder, CO 80301 www.otak.com Copies: [Electronic submittal] Date: 10/19/2017 Subject:
Field Observations and One-Dimensional Flow Modeling of Summit Creek in Mack Park, Smithfield, Utah
 Intermountain Center for River Rehabilitation and Restoration, Utah State University 31 July 2018 Field Observations and One-Dimensional Flow Modeling of Summit Creek in Mack Park, Smithfield, Utah I.
Local Flood Hazards. Click here for Real-time River Information
 Local Flood Hazards Floods of the White River and Killbuck Creek are caused by runoff from general, and/or intense rainfall. Other areas of flooding concern are from the Boland Ditch and Pittsford Ditch.
Muhammad Rezaul Haider (A ). Date of Submission: Course No.: CEE 6440, Fall 2016.
. Date of Submission: Course No.: CEE 6440, Fall 2016.") Use of ArcGIS to extract river geometry as an input to HECRAS model and inundation mapping for the Lower Colorado River (LCR), Texas from Highway 183 to Bastrop. Muhammad Rezaul Haider (A 02196036). Date
Use of ArcGIS to extract river geometry as an input to HECRAS model and inundation mapping for the Lower Colorado River (LCR), Texas from Highway 183 to Bastrop. Muhammad Rezaul Haider (A 02196036). Date
ISSN Vol.03,Issue.10 May-2014, Pages:
 www.semargroup.org, www.ijsetr.com ISSN 2319-8885 Vol.03,Issue.10 May-2014, Pages:2187-2191 YIN YIN HTWE 1, AYE AYE THANT 2 1 Dept of Civil Engineering, Mandalay Technological University, Mandalay, Myanmar,
Tom Ballestero University of New Hampshire. 1 May 2013
 Tom Ballestero University of New Hampshire 1 May 2013 1 Hydrology 2 Basic Hydrology Low flows most common Flows that fill the stream to the banks and higher are much less common Filling the stream to the
Ground Water Protection Council 2017 Annual Forum Boston, Massachusetts. Ben Binder (303)
") Ground Water Protection Council 2017 Annual Forum Boston, Massachusetts Protecting Groundwater Sources from Flood Borne Contamination Ben Binder (303) 860-0600 Digital Design Group, Inc. The Problem Houston
Ground Water Protection Council 2017 Annual Forum Boston, Massachusetts Protecting Groundwater Sources from Flood Borne Contamination Ben Binder (303) 860-0600 Digital Design Group, Inc. The Problem Houston
Breaking the 5 Mile per Hour Barrier: Automated Mapping Using a Normal Depth Calculation
 Breaking the 5 Mile per Hour Barrier: Automated Mapping Using a Normal Depth Calculation Jeffrey T. Shafer, P.E. and James R. Williams, P.E. Nebraska Department of Natural Resources Introduction In 1998,
High-Gradient Streams
 Chapter 4 Surface Processes Section 4 High-Gradient Streams What Do You See? Learning Outcomes In this section, you will Use models and real-time streamflow data to understand the characteristics of highgradient
Monte Carlo Simulations for Probabilistic Flood Hazard Assessment
 Monte Carlo Simulations for Probabilistic Flood Hazard Assessment Jemie Dababneh, Ph.D., P.E., 1 and Mark Schwartz, P.E. 1 1 RIZZO Associates, Monroeville, Pennsylvania Presentation to PSA 2017 International
Floodplain modeling. Ovidius University of Constanta (P4) Romania & Technological Educational Institute of Serres, Greece
 Romania & Technological Educational Institute of Serres, Greece") Floodplain modeling Ovidius University of Constanta (P4) Romania & Technological Educational Institute of Serres, Greece Scientific Staff: Dr Carmen Maftei, Professor, Civil Engineering Dept. Dr Konstantinos
Floodplain modeling Ovidius University of Constanta (P4) Romania & Technological Educational Institute of Serres, Greece Scientific Staff: Dr Carmen Maftei, Professor, Civil Engineering Dept. Dr Konstantinos
National Flood Insurance Program
 National Flood Insurance Program Base Flood Elevations in Zone A Streams Surveyor Training Presented by Thomas F. Smith, PE, PLS January 14, 2019 1 1 FEMA Region III Mitigation Division Floodplain Management
Hydraulic Modeling of the Missoula Ice Dam Failure. Christopher R. Goodell, P.E., D.WRE WEST Consultants, Salem, OR
 Hydraulic Modeling of the Missoula Ice Dam Failure Christopher R. Goodell, P.E., D.WRE WEST Consultants, Salem, OR 1 Introduction 10-40 thousand years ago during the last ice age Image courtesy gis4geomorphology.com
Flood Modeling using Gis and LiDAR of Padada River in Southeastern Philippines
 Flood Modeling using Gis and LiDAR of Padada River in Southeastern Philippines Joseph E. Acosta 2, Ryan Keath L. De Leon 1, Judy Rose D. Hollite 1, Richard M. Logronio 1 and Genelin Ruth James 1 1 LiDAR
MISSOURI LiDAR Stakeholders Meeting
 MISSOURI LiDAR Stakeholders Meeting East-West Gateway June 18, 2010 Tim Haithcoat Missouri GIO Enhanced Elevation Data What s different about it? Business requirements are changing.fast New data collection
Designing a Dam for Blockhouse Ranch. Haley Born
 Designing a Dam for Blockhouse Ranch Haley Born CE 394K GIS in Water Resources Term Paper Fall 2011 Table of Contents Introduction... 1 Data Sources... 2 Precipitation Data... 2 Elevation Data... 3 Geographic
Flow regime, floodplain inundation and floodplain waterbody connectivity at Congaree National Park
 Flow regime, floodplain inundation and floodplain waterbody connectivity at Congaree National Park John Kupfer Dept. of Geography Univ. of South Carolina Kimberly Meitzen Duke University Nature Conservancy
Technical Memorandum No Sediment Model
 Pajaro River Watershed Study in association with Technical Memorandum No. 1.2.9 Sediment Model Task: Development of Sediment Model To: PRWFPA Staff Working Group Prepared by: Gregory Morris and Elsie Parrilla
Closed duct flows are full of fluid, have no free surface within, and are driven by a pressure gradient along the duct axis.
 OPEN CHANNEL FLOW Open channel flow is a flow of liquid, basically water in a conduit with a free surface. The open channel flows are driven by gravity alone, and the pressure gradient at the atmospheric
GRAPEVINE LAKE MODELING & WATERSHED CHARACTERISTICS
 GRAPEVINE LAKE MODELING & WATERSHED CHARACTERISTICS Photo Credit: Lake Grapevine Boat Ramps Nash Mock GIS in Water Resources Fall 2016 Table of Contents Figures and Tables... 2 Introduction... 3 Objectives...
Development of a Fluvial Erosion Hazard Mitigation Program for Indiana
 Development of a Fluvial Erosion Hazard Mitigation Program for Indiana Indiana Watersheds Webinar Series October 12,2011 Robert Barr Center for Earth and Environmental Science Department of Earth Sciences
CE 394K.3 GIS in Water Resources Midterm Quiz Fall There are 5 questions on this exam. Please do all 5. They are of equal credit.
 Name: CE 394K.3 GIS in Water Resources Midterm Quiz Fall 2000 There are 5 questions on this exam. Please do all 5. They are of equal credit. 1. The ArcView Geographic Information System can display different
D. MATHEMATICAL MODEL AND SIMULATION
 D. MATHEMATICAL MODEL AND SIMULATION D - i TABLE OF CONTENTS D.1 Objective of Model Development... D - 1 D.2 Selection of Software... D - 1 D.3 General Steps of Simulation by MOUSE... D - 1 D.4 Cases of
A GIS-based Approach to Watershed Analysis in Texas Author: Allison Guettner
 Texas A&M University Zachry Department of Civil Engineering CVEN 658 Civil Engineering Applications of GIS Instructor: Dr. Francisco Olivera A GIS-based Approach to Watershed Analysis in Texas Author:
MASON COUNTY, MICHIGAN
 MASON COUNTY, MICHIGAN (ALL JURISDICTIONS) MASON COUNTY Community Community Community Community Name Number Name Number AMBER, TOWNSHIP OF 261271 LOGAN, TOWNSHIP OF 260811 BRANCH, TOWNSHIP OF 261272 LUDINGTON,
Evaluation and Incorporation of USACE HEC-RAS Model of Chicago Waterway System into the Development of the North Branch DWP
 M E M O R A N D U M Evaluation and Incorporation of USACE HEC-RAS Model of Chicago Waterway System into the Development of the North Branch DWP TO: FROM: Joseph Spradling, PE, HDR Steven Vassos, PE, FluidClarity
New Mapping, Recent Events What do we know? June 9, 2011
 New Mapping, Recent Events What do we know? June 9, 2011 e FEMA Mapping Process Current Flood Insurance Rate Maps (FIRMs) or Floodplain Maps date back to the early 1970 s. The District contracted with
3D Elevation Program, Lidar in Missouri. West Central Regional Advanced LiDAR Workshop Ray Fox
 3D Elevation Program, Lidar in Missouri West Central Regional Advanced LiDAR Workshop Ray Fox National Enhanced Elevation Assessment (Dewberry, 2011) Sponsored by the National Digital Elevation Program
Innovated Technological Trends in Highways. Flood Modelling & Evaluation of Impacts on Infrastructure
 Innovated Technological Trends in Highways Flood Modelling & Evaluation of Impacts on Infrastructure Dr. Waheed Uddin Professor and Director CAIT University of Mississippi Contributions from: CAIT and