Processing RADS Data LAXMIKANT DHAGE COAS OREGON STATE UNIVERSITY
|
|
|
- Spencer Walsh
- 6 years ago
- Views:
Transcription

1 Processing RADS Data LAXMIKANT DHAGE COAS OREGON STATE UNIVERSITY 1
2 Declaration I hereby declare that the work incorporated in this project is original and carried out at the College of Oceanic and Atmospheric Sciences, Oregon State University. LAXMIKANT DHAGE B Tech 6th Semester Department of Mechanical Engineering Indian Institute of Technology, Guwahati. 2
3 Certificate This is to certify that this project is an authentic record of the research carried out by Mr. Laxmikant Dhage under my supervision and guidance at COAS, OSU. COAS, OSU. Dr. Ted Strub 22 July 2010 Professor 104 COAS Admin Bldg College of Oceanic & Atmos. Sciences Oregon State University 3
4 Table of Contents Declaration Certificate Acknowledgements Summary of work 1. Introduction 2. Methods 3. Results and Figures 4. References 4
5 Acknowledgements It is my pleasure and privilege to express my deep gratitude to Prof. P. Ted Strub for giving me the opportunity to carry out the project under his guidance. I owe much to Ms. Corinne James, Research Associate for helping me throughout the period of this project. Lastly, I thank my parents, and family members for their moral support and constant encouragement without which the work carried, would not have been possible. LAXMIKANT DHAGE B Tech 6th semester Department of Mechanical Engineering IIT Guwahati. 5
6 Summary of Work Our main emphasis was on creating a precise processing strategy on RADS database and obtain smooth Sea Level Anomaly field. Methodology involves editing of each and every corrective field with some specific sequential steps. We looked carefully into each and every data field which is involved in the construction of Sea Level Anomaly. These steps involve applying respective limits, removing outliers and smoothing with weighted moving average. Finally smooth SLA is interpolated into standard grid points. We removed the spatial and time series average from the grided SLA data so that deviation from mean can be observed clearly. We started our work with pass 28 off Oregon coast and then implemented similar processing steps for other passes. Processed Sea Level Anomaly data is used to study seasonal oceanic variations. We plotted monthly mean of 7 years Jason 1 satellite data for all of those passes. 6

7 Introduction Altimetry is a technique for measuring height. Satellite altimetry measures the time taken by a radar pulse to travel from the satellite antenna to the surface and back to the satellite receiver. Combined with precise satellite location data, altimetry measurements yield sea-surface heights. Altimetry satellites basically determine the distance or range from the satellite to a target surface by measuring the satellite-to-surface round-trip time of a radar pulse. The return yields information on the global distribution and variability of sea surface height, ocean swell amplitude and scalar wind speed. The shape of the return yields significant wave height and the magnitude yields the scalar wind speed. If the satellite orbit is precisely determined and the range is corrected for a variety of atmospheric, ocean surface and solid earth factors, then these measurements allow determination of changes in sea surface height (SSH) due to tides, geostrophic currents and other oceanographic phenomenon to an accuracy of 2-3 cm. Several different frequencies are used for radar altimeters. Each frequency band has its advantages and disadvantages: sensitivity to atmospheric 7
8 perturbations for Ku-band, better observation of ice, rain, coastal zones, land masses... for Ka-band. The principal objective is to measure the range R from satellite to the sea surface. The pulse interacts with the rough sea surface and part of the incident radiation reflects back to the altimeter. The range R from satellite to mean sea level is estimated from round -trip travel time by ( Ŕ - ΔRj ), where Ŕ= c t/2, range computed neglecting refraction based upon the free space speed of light c ΔRj, j=1,... are corrections for various components of atmospheric refraction and for biases. Now range is transformed to a fixed coordinate system by precision orbit determination of height H of the satellite relative to to a specified reference ellipsoid approximation of the geoid. Then it is converted to the height h of the sea surface relative to the reference ellipsoid by h= H - R = H - ( Ŕ - ΔRj ) Accurate estimation of R and H are not sufficient for oceanographic applications of altimeter range measurements. The above sea surface height h is the superposition of a number of geophysical effects. In addition to the dynamic effect of oceanographic currents, h is affected by undulation of geoid hg, tidal variations ht and the ocean surface response ha to atmospheric pressure loading. The dynamic sea surface height is thus estimated as hd = h - hg - ht - ha = H - ( Ŕ - ΔRj ) - hg - ht - ha 8
9 Altimeter Noise: The presence of water vapor, dry gases and free electrons in the atmosphere reduces the propagation speed of radar pulse. Additional biases in the range estimates are introduced by non Gaussian distribution of the wave field. Failure to account for the effects of the atmospheric refraction and sea-state bias introduce errors in the range measurements that are more than an order of magnitude larger than 1 cm. Therefore these corrections must be applied to transform the round-trip travel time into a range estimate with high degree of accuracy required for oceanographic applications of altimeter data. Atmospheric sources of error Dry troposphere: The dry tropospheric range delay varies with the amount of atmospheric mass between sensor and the surface or equivalently with sea level pressure. Correction for this delay use the surface pressure fields produced by ECMWF. For JASON1 based on the ECMWF rms pressure accuracy of 3 mbar, the associated range error is 7 mm. Wet troposphere: The wet tropospheric range correction is designed to correct the observed altimetric sea-surface elevations for the propagation delay caused by atmospheric water vapor and cloud liquid water. Although it is smaller than the corresponding `dry tropospheric range correction,' the wet correction is more complex, with possibly rapid variations in both time and space. The correction can vary from just a few millimeters in dry, cold air to more than 40 cm in hot, wet air. Ionospheric Free Electrons: Ionospheric refraction of altimetric radar signals is determined by the dielectric properties of the upper atmosphere associated with presence of free electrons. The ionospheric range derived from dual-frequency altimeters has an error about 5 mm. Sea-state bias: It is generated by ocean swell and mainly consists of electromagnetic (EM) bias and tracker or skewness bias. The sum of these two is called as sea-state bias. Skewness bias can be reduced by post processing, however EM bias cannot be further reduced. 9
10 Electromagnetic bias: It refers to the apparent depression of the mean sea level generated by interaction of the radar pulses with the physical wave properties. In an ocean swell field, EM bias occurs because the troughs of even pure sinusoidal waves are better reflector than the crests, so that the mean reflecting surface is depressed below mean sea level. Tracker or skewness bias: In the calculation the algorithm assumes that the wave amplitude has a Gaussian distribution. Because the actual waveform is non-gaussian or skewed, the tracker generates an additional negative offset. This is an instrument error and can be reduced by post processing. Error in orbit determination: At short time scale, uncertainties in the satellite orbital position are the largest source of range error. Orbit errors divide into single pass errors, which are associated with a single range estimate, and the error associated with monthly or greater time scale averages over spatial scales of few hundred kilometers. Environmental Sources of uncertainty In addition to the height changes generated by geostrophic flows, sea surface height is also physically altered by ocean tides and the inverse barometer effect. Tides are generated by the relative motion of Earth, moon and sun; the inverse barometer effect is the surface response to spatially variable changes in sea level pressure. Tides: Ocean tides occur at specific discrete frequencies. Tide produce elevation changes 1-3m, and except for very large ocean waves are the largest contributor to ocean surface variability. Given the tidal models,most of the tidal signals can be removed from the altimeter range retrieval, which greatly improves the accuracy of geostrophic height retrieval. Inverse barometer: Atmospheric pressure exert a downward force on sea surface. Spatial and temporal variations of this force are compensated at least partially by variations of the sea surface elevation. These variations of the sea surface elevation are unrelated to sea surface topographic features associated with geostrophic currents and therefore must be removed to obtain accurate estimates of the dynamic sea surface height hd. The inverse 10
11 barometer correction works well over the open ocean, but breaks down in small marginal seas and in the western boundary currents. Although the inverse barometer and dry troposphere corrections are both functions of sea level pressure, they differ fundamentally. The dry troposphere correction yields an electromagnetic range delay independent of surface displacement; inverse barometer effect is a physical surface displacement. Similar to the dry troposphere correction, the inverse barometer effect is removed using ECMWF surface pressure fields. The error in this correction is about 3 cm. RADS DATA: The rads data base consists of one metafile and one or more data files per satellite pass. Ascending passes have odd numbers, descending passes have even numbers. The data files contain the binary data. The meta files describe the contents for example data type,units,creation history etc. of the data in one data file. There is only one metafile for each pass. The data files are grouped in one directory for each cycle. These cycle directories are then grouped into one directory for each mission phase, which are finally part of one directory per satellite. To read and manipulate the data, the standard netcdf tools, like ncdump (that comes with netcdf package), GMT(Generic Mapping Tools),nco(NetCDF Operators) can be used. 11
12 Methods We started processing by selection of valid ocean data. STEPS 1] Initially we sort out the appropriate data by applying maximum and minimum limits on specific data fields. For the construction of sea level anomaly all fields with a positive option number described in Remko manual are checked against respective limits. Data field with factor 0 means that a correction is neither added nor subtracted from sea surface height,but may be considered as an edit criterion in the construction of sea level anomaly. However a negative option means that the data field is not used for creation of the sea level anomaly,nor for its editing. Following are the limits of all the data fields having positive option number mentioned in Remko manual. (all values are in m) Altitude: >= & <= Range: >= & <= Wet_tropo: >=.6 & <=0 Ionosphere: >=.40 & <=.40 Ocean Tide: >= 5 & <=5 Dry_tropo: >= 2.4 & <= 2.1 Inv_baro_mog2d: >= 1.0 & <=1.0 Solid_tide: >= 1.0 & <=1.0 Ocean_Tide_got47: >= 5 & <=5 Load_Tide_got47: >= 5 & <=5 Pole_Tide: >= 0.1 & <=0.1 Sea_State_Bias_cls: >= 1.0 & <=1.0 Mss_dnsc08: >= 200 & <=200 Refframe: >= 1.0 & <=1.0 Sig_Wave_Height: >=0 & <=8 Back_Scatter_Coeff: >=6 & <=27 Wind_speed: >=0 & <=30 Sigma_Range: >=0 & <=.4 Sigma_SWH: >=0 & <=2.1 No_avg_measurements: >=15.5 & <=
13 2] Now appropriate flags are turned on so that bad data can be eliminated. To select the appropriate flags we looked into each and every flag. There are total 16 flags. 1) Hardware Status 0=OK,1=bad 2) Satellite on track 0=OK, 1=suspect 3) Continental ice 0=no, 1=yes 4) Quality of dual frequency ionosphere 0=OK, 1=bad 5) Altimeter land flag 0=water, 1=land 6) Altimeter Ocean/Non Ocean Flag 0=ocean, 1=non-ocean 7) Radiometer land Flag 1=land, 0=water 8) Corruption of Altimeter measurements 0=OK, 1=rain or ice 9) Corruption of Radiometer measurements 0=OK, 1=rain or ice 10) Quality of the 23.8/22/18.7 Ghz Brightness temperature 0=OK, 1=bad 11) Quality of the 36.5/37/34.0 Ghz Brightness temperature 0=OK, 1=bad 12) Quality of range estimate: 0=OK, 1=suspect 13) Quality of the wave height measurements 0=OK, 1=suspect 14) Quality of backscatter coefficient estimate/wind speed measurements 0=OK, 1=suspect 15) Tracking mode 0=OK, 1=coarse,acquisition 16) Quality of orbit 13
14 0=OK, 1=degraded We turned on the following flags: 4) Quality of dual frequency ionosphere 7) Radiometer land Flag 8) Corruption of Altimeter measurements 9) Corruption of Radiometer measurements 10) Quality of the 23.8/22/18.7 Ghz Brightness temperature 11) Quality of the 36.5/37/34.0 Ghz Brightness temperature 12) Quality of range estimate 13) Quality of the wave height measurements 14) Quality of backscatter coefficient estimate/wind speed measurements 15) Tracking mode 16) Quality of orbit Then a precise Editing strategy is used. First we did impose an editing criteria both on altimeter measurements and on the correction terms. 3] After applying the maximum and minimum limits and appropriate flags turned on the behavior of all the corrective terms are analyzed along track. Abrupt changes are assumed to be associated with erroneous data. Outliers are removed by means of 3 sigma standard deviation filter (sigma is the standard deviation of along track data). Either we can remove only outlier points or both outliers and their adjoining neighbors as sometimes adjoining neighbors may contain erroneous data. This strategy rejects much more data than the classical one, even if the altimeter measurement is useful. 4] Thus in the next step, all the corrective terms are recomputed using French loess filter. While performing this step we made sure that if there is no data continuously for two points on either side or both sides then we should neglect that outlier instead of regaining the data point by French Loess. The above step insures that we don t extrapolate the data anywhere. 5] Once all the corrective fields are edited, we formed the SLA. There is one multiplication factor for the correction, corresponding to each data field. When its factor is +1 a data field should be added to the sea surface 14
15 height, when -1 it will be subtracted. When any of the fields fails due to limits or flags or 3 sigma deviation filter, no sea level anomaly is created at that point. SLA= Altitude range Wet_tropo Dry_tropo Ionosphere Solid Tide Ocean Tide Load Tide Pole Tide Sea State Bias Mean Sea Surface. In the end, the created sea level anomaly is checked against specific limits(-5m to 5m). Now we can either apply similar 2 steps on formed SLA or directly project SLA into standard CTOH grids. Application of similar steps on SLA field(step 3,4 ): The similar two steps are applied on formed SLA once again. I] Outliers are removed by means of 3 sigma standard deviation filter (sigma is the standard deviation of along track data). II] Removed outliers are regained by French Loess. Projection of SLA field on standard CTOH grids: There were 2 ways : 1] Simply linear interpolating into CTOH grids without using French Loess We projected SLA field on standard CTOH grid points using linear interpolation. Here we made sure that we don t interpolate the data points where there is no data on both sides for approximately around 14 km from standard CTOH grid point. 2] Doing it in a single step(projecting while smoothing) using French loess French Loess Filter: French Loess just uses the weights to compute a weighted average. The weighting function is different than traditionally used loess weighting function: 15
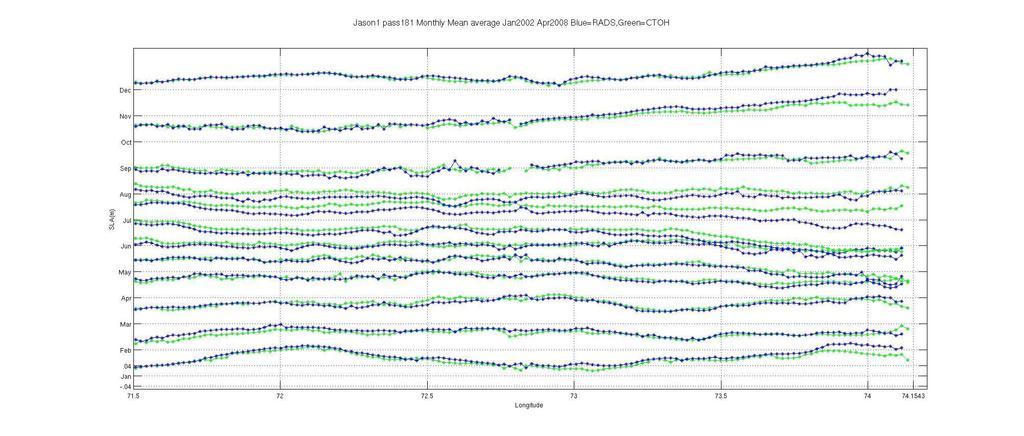
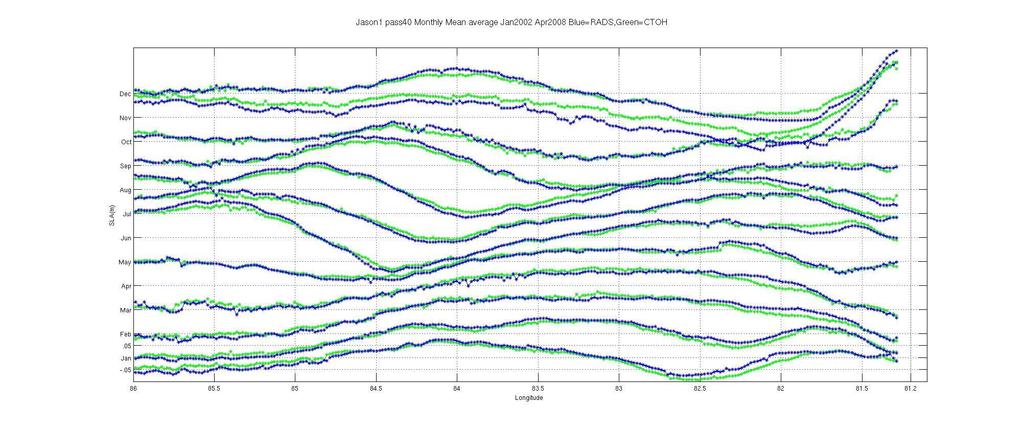
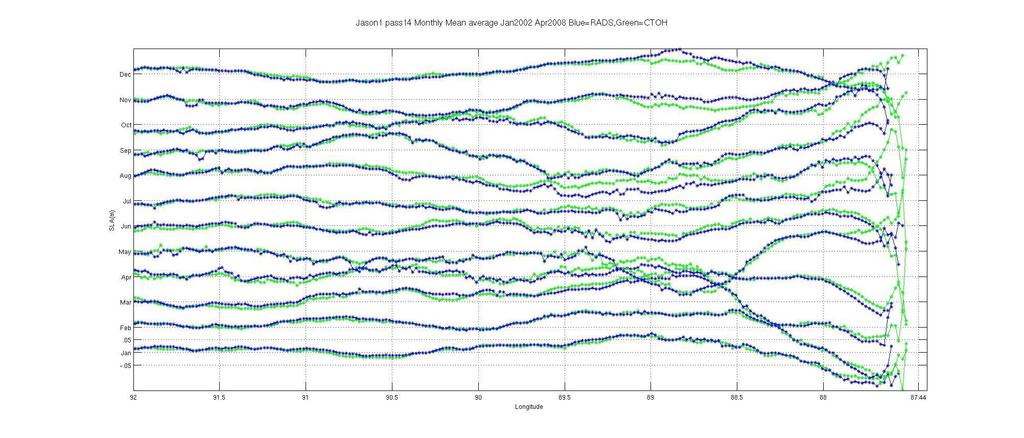
16 (1 q^3)^3 where q is the distance/half span. Here they use q = ( distance / half span)^2. French loess filter assumes equal distances between each consecutive standard grid points( 7 km). To make it more accurate we calculated actual distance from the points on standard grid to the RADS grid points and then weights are computed using RADS points which fall within the range of approximately 20 km from the estimating standard grid point.the weight function is as follows: lx=actual distance/21; q=lx*lx ; weight=(1 q^3)^3; Next step is to calculate weighted moving average using those RADS points. So at each of the standard grid point smoothed data is computed by weighted moving average( French Loess) instead of just linear interpolation. Removing spatial and time series averages: To eliminate the bias, two degree off shore spatial average of Sea Level Anomaly is removed from SLA field. Also after computing SLA for all the cycles consisting of standard grid points, time series average corresponding to each grid point is removed. Monthly mean of Sea Level Anomaly: Now finally, this processed and grided sea level anomaly field is used to study the seasonal variation. We plotted monthly mean average of approximately 7 years grided SLA field data for different passes. While plotting we made sure that if there is no data for greater than 30% the point is left blank instead of taking mean. 16
17 Results & Conclusions We observed some large scale dynamics for the passes of east coast of India compared to those for the west coast. For example pass no. 192,116 and 40 showed consistent high dynamics. For the months Jan to Apr we observed northward flow for approximately 50 km off shore and then southward flow form approximately 50 km off shore to km off shore.there was a sudden change in the direction of flow when we looked at mean SLA for the month of May i.e. near shore flow turned from northwards to southwards and flow for approximately from 50 km offshore to km off shore also changed its direction from southward to Northward. This change in flow direction was consistent in almost all the passes of east coast of India. During the post Mansoon months i.e. from Oct. to Dec, instead of two regions i.e. approximately 50 km off shore and from 50 km off shore to 200 to 300 km offshore having different flow directions, we observed southward flow for both of the regions. Although west coast didn t show much dynamics but there was some pattern in flow directions for pre Mansoon (Feb-May) Mansoon (Jun-Sep) and post Mansoon (Oct- Jan) seasons. For the pre mansoon season we didn t observe significant dynamics but we observed gradually northward flow when we enter Mansoon season from May. During Mansoon season flow was Northward and it starts gradually changing its direction towards southward as we enter into post Mansoon season. We observed strong northward flow during months of Ju- 17
18 ly, Aug and Sep for almost all the west coast passes. For the post Mansoon Season we observed southward flow for all the west coast psses. 18

19 Figures 19
20 20
21 Above figure involves Smoothing SLA with French loess along with each corrections where as following figure involves only smoothing of every correc- 21
22 tion not the final SLA 22


23 Following are some plots of monthly mean SLA data fields. 23

24 24

25 25

26 26
27 References Chelton, D. B., J. C. Ries, B. J. Haines, L. Fu, and P. S. Callahan: Satellite altimetry, in Satellite Altimetry and Earth Sciences, L. Fu and A. Cazenave, eds. San Diego: Academic Press, Seelye Martin: An Introduction to Ocean Remote Sensing: Cambridge University Press RADS version 3.1 User Manual and Format Specification: Remko Scharro, May
Active microwave systems (2) Satellite Altimetry * the movie * applications
 Satellite Altimetry * the movie * applications") Remote Sensing: John Wilkin wilkin@marine.rutgers.edu IMCS Building Room 211C 732-932-6555 ext 251 Active microwave systems (2) Satellite Altimetry * the movie * applications Altimeters (nadir pointing
Remote Sensing: John Wilkin wilkin@marine.rutgers.edu IMCS Building Room 211C 732-932-6555 ext 251 Active microwave systems (2) Satellite Altimetry * the movie * applications Altimeters (nadir pointing
P. Cipollini, H. Snaith - A short course on Altimetry. Altimetry 2 - Data processing (from satellite height to sea surface height)
") P. Cipollini, H. Snaith - A short course on Altimetry Altimetry 2 - Data processing (from satellite height to sea surface height) 1 2 Satellite height to sea surface height The altimeter measures the altitude
P. Cipollini, H. Snaith - A short course on Altimetry Altimetry 2 - Data processing (from satellite height to sea surface height) 1 2 Satellite height to sea surface height The altimeter measures the altitude
DERIVATION OF SEA LEVEL ANOMALY USING SATELLITE ALTIMETER. Ami Hassan Md Din, Kamaludin Mohd Omar
 DERIVATION OF SEA LEVEL ANOMALY USING SATELLITE ALTIMETER Ami Hassan Md Din, Kamaludin Mohd Omar Faculty of Geoinformation Science and Engineering Universiti Teknologi Malaysia Skudai, Johor E-mail: amihassan@utm.my
Presented at the FIG Congress 2018, May 6-11, 2018 in Istanbul, Turkey
 Presented at the FIG Congress 2018, May 6-11, 2018 in Istanbul, Turkey Paper ID: 9253 (Peer Review) By: Amalina Izzati Abdul Hamid, Ami Hassan Md Din & Kamaludin Mohd Omar Geomatic Innovation Research
S3 Product Notice Altimetry
 S3 Product Notice Altimetry Mission Sensor Product S3-A SRAL / MWR LAND L2 NRT, STC and NTC Product Notice ID Issue/Rev Date Version 1.0 Preparation S3A.PN-STM-L2L.06 04-April-2018 This Product Notice
Coastal Altimetry Workshop February 5-7, Supported by NOAA (Stan Wilson) NASA (Eric Lindstrom, Lee Fu)
 NASA (Eric Lindstrom, Lee Fu)") Coastal Altimetry Workshop February 5-7, 2008 Organized by: Laury Miller, Walter Smith: NOAA/NESDIS Ted Strub, Amy Vandehey: CIOSS/COAS/OSU With help from many of you! Supported by NOAA (Stan Wilson) NASA
Coastal Altimetry Workshop February 5-7, 2008 Organized by: Laury Miller, Walter Smith: NOAA/NESDIS Ted Strub, Amy Vandehey: CIOSS/COAS/OSU With help from many of you! Supported by NOAA (Stan Wilson) NASA
S3-A Land and Sea Ice Cyclic Performance Report. Cycle No Start date: 21/04/2017. End date: 18/05/2017
 PREPARATION AND OPERATIONS OF THE MISSION PERFORMANCE CENTRE (MPC) FOR THE COPERNICUS SENTINEL-3 MISSION Cycle No. 017 Start date: 21/04/2017 End date: 18/05/2017 Ref. S3MPC.UCL.PR.08-017 Contract: 4000111836/14/I-LG
Geophysical Correction Application in Level 2 CryoSat Data Products
 ESRIN-EOP-GQ / IDEAS IDEAS-VEG-IPF-MEM-1288 Version 2.0 29 July 2014 Geophysical Correction Application in Level 2 CryoSat Data Products TABLE OF CONTENTS 1 INTRODUCTION... 3 1.1 Purpose and Scope... 3
Near Real-Time Alongtrack Altimeter Sea Level Anomalies: Options. Corinne James and Ted Strub Oregon State University. Motivation
 Near Real-Time Alongtrack Altimeter Sea Level Anomalies: Options Corinne James and Ted Strub Oregon State University Motivation Modelers want easy access to alongtrack SSHA, SLA or ADT, with enough explanations
New retrieval algorithm for the wet tropospheric correction of altimetry missions
 New retrieval algorithm for the wet tropospheric correction of altimetry missions A. Rahmani, E. Obligis and L. Eymard CLS/LOCEAN MicroRad Conference March 2008 Page n 1/13 Introduction Altimeters are
Validation Report: WP5000 Regional tidal correction (Noveltis)
") Consortium Members ESA Cryosat Plus for Oceans Validation Report: WP5000 Regional tidal correction (Noveltis) Reference: Nomenclature: CLS-DOS-NT-14-083 CP4O-WP5000-VR-03 Issue: 2. 0 Date: Jun. 20, 14
Consortium Members ESA Cryosat Plus for Oceans Validation Report: WP5000 Regional tidal correction (Noveltis) Reference: Nomenclature: CLS-DOS-NT-14-083 CP4O-WP5000-VR-03 Issue: 2. 0 Date: Jun. 20, 14
CryoSat Monthly Quality Report #93
 9th May 2018-7th June 2018 Author(s): CryoSat Quality Control Team (Telespazio UK) IDEAS+-VEG-OQC-REP-2987 17 July 2018 AMENDMENT RECORD SHEET The Amendment Record Sheet below records the history and issue
S3-A Land and Sea Ice Cyclic Performance Report. Cycle No Start date: 30/09/2017. End date: 27/10/2017
 PREPARATION AND OPERATIONS OF THE MISSION PERFORMANCE CENTRE (MPC) FOR THE COPERNICUS SENTINEL-3 MISSION Start date: 30/09/2017 End date: 27/10/2017 Ref. S3MPC.UCL.PR.08-023 Contract: 4000111836/14/I-LG
ON THE ACCURACY OF CURRENT MEAN SEA SURFACE MODELS FOR THE USE WITH GOCE DATA
 ON THE ACCURACY OF CURRENT MEAN SEA SURFACE MODELS FOR THE USE WITH GOCE DATA Ole B. Andersen 1, M-.H., Rio 2 (1) DTU Space, Juliane Maries Vej 30, Copenhagen, Denmark (2) CLS, Ramon St Agne, France ABSTRACT
Sentinel-3A Product Notice STM L2 Marine (NRT, STC and NTC)
") Sentinel-3A Product Notice STM L2 Marine (NRT, STC and NTC) Mission Sensor Product S3-A SRAL/MWR L2 NRT STC and NTC (Marine Products) Product Notice ID S3A.PN-STM-L2M.01 EUM/OPS-SEN3/DOC/16/893228 Issue
Sentinel-3A Product Notice STM L2 Marine (NRT, STC and NTC) Mission Sensor Product S3-A SRAL/MWR L2 NRT STC and NTC (Marine Products) Product Notice ID S3A.PN-STM-L2M.01 EUM/OPS-SEN3/DOC/16/893228 Issue
Aquarius Data Release V2.0 Validation Analysis Gary Lagerloef, Aquarius Principal Investigator H. Kao, ESR And Aquarius Cal/Val Team
 Aquarius Data Release V2.0 Validation Analysis Gary Lagerloef, Aquarius Principal Investigator H. Kao, ESR And Aquarius Cal/Val Team Analysis period: Sep 2011-Dec 2012 SMOS-Aquarius Workshop 15-17 April
Supplementary material to Challenges in Coastal Satellite Radar Altimetry
 Supplementary material to Challenges in Coastal Satellite Radar Altimetry Published 30 June 2009 Jérôme Benveniste, European Space Agency Center for Earth Observation (ESRIN), Frascati, Italy Stefano Vignudelli,
A two-season impact study of the Navy s WindSat surface wind retrievals in the NCEP global data assimilation system
 A two-season impact study of the Navy s WindSat surface wind retrievals in the NCEP global data assimilation system Li Bi James Jung John Le Marshall 16 April 2008 Outline WindSat overview and working
Sentinel-3A Product Notice STM L2 Marine ( Spring-2018 Reprocessing Campaign )
") Sentinel-3A Product Notice STM L2 Marine ( Spring-2018 Reprocessing Campaign ) Mission Sensor Product S3-A SRAL/MWR L2 NTC (Marine Reprocessed Dataset from Spring-2018 Reprocessing Campaign ) Product Notice
Sentinel-3A Product Notice STM L2 Marine ( Spring-2018 Reprocessing Campaign ) Mission Sensor Product S3-A SRAL/MWR L2 NTC (Marine Reprocessed Dataset from Spring-2018 Reprocessing Campaign ) Product Notice
1 The satellite altimeter measurement
 1 The satellite altimeter measurement In the ideal case, a satellite altimeter measurement is equal to the instantaneous distance between the satellite s geocenter and the ocean surface. However, an altimeter
Exploiting radar power to study oceans and climate: the rise and prospects of satellite altimetry
 Exploiting radar power to study oceans and climate: the rise and prospects of satellite altimetry Paolo Cipollini National Oceanography Centre, Southampton, UK with contributions by Peter Challenor, Ian
Comparison of Mean Sea Surface Data For Oceanography
 Universität Stuttgart Geodätisches Institut Comparison of Mean Sea Surface Data For Oceanography Studienarbeit im Studiengang Geodäsie und Geoinformatik an der Universität Stuttgart Naomi Zimmermann Stuttgart,
SSS retrieval from space Comparison study using Aquarius and SMOS data
 44 th International Liège Colloquium on Ocean Dynamics 7-11 May 2012 SSS retrieval from space Comparison study using Aquarius and SMOS data Physical Oceanography Department Institute of Marine Sciences
Jason-1 orbit comparison : POE-E versus POE-D. L. Zawadzki, M. Ablain (CLS)
") Jason-1 orbit comparison : versus POE-D L. Zawadzki, M. Ablain (CLS) Jason-1 orbit comparison : versus POE-D Objectives Evaluate orbit for Jason-1 (by comparison to POE-D standard) Observe and analyse
Jason-1 orbit comparison : versus POE-D L. Zawadzki, M. Ablain (CLS) Jason-1 orbit comparison : versus POE-D Objectives Evaluate orbit for Jason-1 (by comparison to POE-D standard) Observe and analyse
COMBINING ALTIMETRY AND HYDROGRAPHY FOR GEODESY
 COMBINING ALTIMETRY AND HYDROGRAPHY FOR GEODESY Helen M. Snaith, Peter G. Challenor and S Steven G. Alderson James Rennell Division for Ocean Circulation and Climate, Southampton Oceanography Centre, European
China France. Oceanography S A T. The CFOSAT project. e l l i t e. C. Tison (1), D. Hauser (2), A. Mouche (3) CNES, France (2)
, D. Hauser (2), A. Mouche (3) CNES, France (2)") China France The CFOSAT project C. Tison (1), D. Hauser (2), A. Mouche (3) (1) CNES, France (2) OVSQ, CNRS, LATMOS-IPSL, France (3) IFREMER, LOS, France celine.tison@cnes.fr Oceanography S A T e l l i
China France The CFOSAT project C. Tison (1), D. Hauser (2), A. Mouche (3) (1) CNES, France (2) OVSQ, CNRS, LATMOS-IPSL, France (3) IFREMER, LOS, France celine.tison@cnes.fr Oceanography S A T e l l i
PREDICTION AND MONITORING OF OCEANIC DISASTERS USING MICROWAVE REMOTE SENSING TECHNIQUES
 PREDICTION AND MONITORING OF OCEANIC DISASTERS USING MICROWAVE REMOTE SENSING TECHNIQUES O P N Calla International Centre for Radio Science, OM NIWAS A-23, Shastri Nagar, Jodhpur-342 003 Abstract The disasters
Study of Sea Level Variation of Exclusive Economic Zone of Malaysia. Universiti Teknologi Malaysia Skudai, Johor
 Study of Sea Level Variation of Exclusive Economic Zone of Malaysia Kamaludin Omar 1, Shahrum Ses 1, Marc Naeije 2, Mohamad Asrul Mustafar 1 1 Faculty of Geoinformation Science and Engineering Universiti
Interannual trends in the Southern Ocean sea surface temperature and sea level from remote sensing data
 RUSSIAN JOURNAL OF EARTH SCIENCES, VOL. 9, ES3003, doi:10.2205/2007es000283, 2007 Interannual trends in the Southern Ocean sea surface temperature and sea level from remote sensing data S. A. Lebedev 1,2
Sentinel 3A Product Notice STM L2 Marine
 Sentinel 3A Product Notice STM L2 Marine Mission Sensor Product S3 A SRAL/MWR L2 NRT, STC and NTC (Marine Products) Product Notice ID EUM/OPS SEN3/DOC/16/893228 Issue Date 23 March 2018 Version Preparation
Satellite ALTimetry. SALT applications and use of data base for SE-Asia region. SEAMERGES kick-off meeting, Bangkok, Thailand.
 Satellite ALTimetry SALT applications and use of data base for SE-Asia region SEAMERGES kick-off meeting, Bangkok, Thailand Marc Naeije 4 March 2004 1 Faculty of Aerospace Engineering DEOS/AS SEAMERGES
Merged sea-ice thickness product from complementary L-band and altimetry information
 Merged sea-ice thickness product from complementary L-band and altimetry information Contributors AWI Team Stefan Hendricks Robert Ricker Stephan Paul University Hamburg Team Lars Kaleschke Xiangshan Tian-Kunze
Developing Vicarious Calibration for Microwave Sounding Instruments using Lunar Radiation
 CICS Science Meeting, College Park, 2017 Developing Vicarious Calibration for Microwave Sounding Instruments using Lunar Radiation Hu(Tiger) Yang Contributor: Dr. Jun Zhou Nov.08, 2017 huyang@umd.edu Outline
The Malaysian Seas: Variation of Sea Level Observed by Tide Gauges and Satellite Altimetry. Universiti Teknologi Malaysia Skudai, Johor
 The Malaysian Seas: Variation of Sea Level Observed by Tide Gauges and Satellite Altimetry Kamaludin Omar 1, Shahrum Ses 1, Marc Naeije 2, Mohamad Asrul Mustafar 1 1 Faculty of Geoinformation Science and
Satellite Oceanography and Applications 2: Altimetry, scatterometry, SAR, GRACE. RMU Summer Program (AUGUST 24-28, 2015)
") Satellite Oceanography and Applications 2: Altimetry, scatterometry, SAR, GRACE RMU Summer Program (AUGUST 24-28, 2015) Altimetry 2 Basic principles of satellite altimetry Altimetry: the measurements of
Satellite Oceanography and Applications 2: Altimetry, scatterometry, SAR, GRACE RMU Summer Program (AUGUST 24-28, 2015) Altimetry 2 Basic principles of satellite altimetry Altimetry: the measurements of
Ice sheet mass balance from satellite altimetry. Kate Briggs (Mal McMillan)
") Ice sheet mass balance from satellite altimetry Kate Briggs (Mal McMillan) Outline Background Recap 25 year altimetry record Recap Measuring surface elevation with altimetry Measuring surface elevation
Ice sheet mass balance from satellite altimetry Kate Briggs (Mal McMillan) Outline Background Recap 25 year altimetry record Recap Measuring surface elevation with altimetry Measuring surface elevation
Studies of Austfonna ice cap (Svalbard) using radar altimetry with other satellite techniques
 using radar altimetry with other satellite techniques") 15 Years of progress in Radar Altimetry Symposium Ocean surface topography science team (OSTST) International Doris Service (IDS) Workshop, Argo Workshop 13-18 March 2006, Venice, Italy Alexei V. Kouraev,
15 Years of progress in Radar Altimetry Symposium Ocean surface topography science team (OSTST) International Doris Service (IDS) Workshop, Argo Workshop 13-18 March 2006, Venice, Italy Alexei V. Kouraev,
Enhancing predictability of the Loop Current variability using Gulf of Mexico Hycom
 Enhancing predictability of the Loop Current variability using Gulf of Mexico Hycom Matthieu Le Hénaff (1) Villy Kourafalou (1) Ashwanth Srinivasan (1) Collaborators: O. M. Smedstad (2), P. Hogan (2),
VALIDATION OF ALTIMETER SIGNIFICANT WAVE HEIGHT USING WAVE GAUGE MEASUREMENT IN PACITAN COASTAL WATERS, EAST JAVA, INDONESIA
 VALIDATION OF ALTIMETER SIGNIFICANT WAVE HEIGHT USING WAVE GAUGE MEASUREMENT IN PACITAN COASTAL WATERS, EAST JAVA, INDONESIA *Yati Muliati, **Andojo Wurjanto, *** Widodo S. Pranowo * Institut Teknologi
Sentinel-3 A STM (Altimetry) Disclaimer
 Disclaimer") Sentinel-3 A STM (Altimetry) Disclaimer The following table summarises the evolutions of the processing baseline used to process S3-A altimetry data since July 2016, end of commissioning phase. Reference
Sentinel-3 A STM (Altimetry) Disclaimer The following table summarises the evolutions of the processing baseline used to process S3-A altimetry data since July 2016, end of commissioning phase. Reference
Understanding the Differences between LS Algorithms and Sequential Filters
 Understanding the Differences between LS Algorithms and Sequential Filters In order to perform meaningful comparisons between outputs from a least squares (LS) orbit determination algorithm and orbit determination
Interpretation of Polar-orbiting Satellite Observations. Atmospheric Instrumentation
 Interpretation of Polar-orbiting Satellite Observations Outline Polar-Orbiting Observations: Review of Polar-Orbiting Satellite Systems Overview of Currently Active Satellites / Sensors Overview of Sensor
SSH retrieval in the ice covered Arctic Ocean: from waveform classification to regional sea level maps
 ESA Climate Change Initiative SSH retrieval in the ice covered Arctic Ocean: from waveform classification to regional sea level maps CLS LEGOS PML Arctic SIE status 2 nd lowest on record with 4.14 10 6
Stability in SeaWinds Quality Control
 Ocean and Sea Ice SAF Technical Note Stability in SeaWinds Quality Control Anton Verhoef, Marcos Portabella and Ad Stoffelen Version 1.0 April 2008 DOCUMENTATION CHANGE RECORD Reference: Issue / Revision:
SNOW DEPTH AND SURFACE CONDITIONS OF AUSTFONNA ICE CAP (SVALBARD) USING FIELD OBSERVATIONS AND SATELLITE ALTIMETRY
 USING FIELD OBSERVATIONS AND SATELLITE ALTIMETRY") SNOW DEPTH AND SURFACE CONDITIONS OF AUSTFONNA ICE CAP (SVALBARD) USING FIELD OBSERVATIONS AND SATELLITE ALTIMETRY Alexei Kouraev (1,2), Benoît Legrésy (1), Frédérique Rémy (1), Andrea Taurisano (3,4),
SNOW DEPTH AND SURFACE CONDITIONS OF AUSTFONNA ICE CAP (SVALBARD) USING FIELD OBSERVATIONS AND SATELLITE ALTIMETRY Alexei Kouraev (1,2), Benoît Legrésy (1), Frédérique Rémy (1), Andrea Taurisano (3,4),
Satellite Altimetry and Earth Sciences
 Satellite Altimetry and Earth Sciences Satellite Altimetry and Earth Sciences This is Volume 69 in the INTERNATIONAL GEOPHYSICS SERIES A series of monographs and textbooks Edited by RENATA DMOWSKA, JAMES
Coastal Altimetry: recent developments and proposed use in the Agulhas region. Paolo Cipollini (NOCS, UK)
") Coastal Altimetry: recent developments and proposed use in the Agulhas region Paolo Cipollini (NOCS, UK) Coastal altimetry - the concept Satellite altimetry has been designed for the open ocean 15 years
Coastal Altimetry: recent developments and proposed use in the Agulhas region Paolo Cipollini (NOCS, UK) Coastal altimetry - the concept Satellite altimetry has been designed for the open ocean 15 years
Sea level changes around Thailand
 Final symposium 27 May Bangkok, Thailand Sea level changes around Thailand Marc Naeije Contents GEO2TECDI- SONG: measuring sea level around Thailand Concept of satellite altimetry Concept of tide gauges
Use of Geophysical Software for Interpretation of Ice-Penetrating Radar Data and Mapping of Polar Ice Sheets
 Use of Geophysical Software for Interpretation of Ice-Penetrating Radar Data and Mapping of Polar Ice Sheets Alex O. Martinez University of Kansas 2335 Irving Hill Road Lawrence, KS 66045-7612 http://cresis.ku.edu
CRYOSAT CYCLIC REPORT
 CRYOSAT CYCLIC REPORT CYCLE #14 12TH NOVEMBER 2011 11TH DECEMBER 2011 Prepared by/ préparé par CryoSat IDEAS Team Reference/ réference Issue/ édition 1 Revision/ révision 0 Date of issue/ date d édition
GLAS Atmospheric Products User Guide November, 2008
 GLAS Atmospheric Products User Guide November, 2008 Overview The GLAS atmospheric measurements utilize a dual wavelength (532 nm and 1064 nm) transmitting laser to obtain backscattering information on
Correcting Microwave Precipitation Retrievals for near- Surface Evaporation
 Correcting Microwave Precipitation Retrievals for near- Surface Evaporation The MIT Faculty has made this article openly available. Please share how this access benefits you. Your story matters. Citation
Ocean Vector Winds in Storms from the SMAP L-Band Radiometer
 International Workshop on Measuring High Wind Speeds over the Ocean 15 17 November 2016 UK Met Office, Exeter Ocean Vector Winds in Storms from the SMAP L-Band Radiometer Thomas Meissner, Lucrezia Ricciardulli,
Inter-tropical Convergence Zone (ITCZ) analysis using AIRWAVE retrievals of TCWV from (A)ATSR series and potential extension of AIRWAVE to SLSTR
 analysis using AIRWAVE retrievals of TCWV from (A)ATSR series and potential extension of AIRWAVE to SLSTR") Inter-tropical Convergence Zone (ITCZ) analysis using AIRWAVE retrievals of TCWV from (A)ATSR series and potential extension of AIRWAVE to SLSTR Enzo Papandrea (SERCO, CNR-ISAC, Enzo.Papandrea@serco.com)
Inter-tropical Convergence Zone (ITCZ) analysis using AIRWAVE retrievals of TCWV from (A)ATSR series and potential extension of AIRWAVE to SLSTR Enzo Papandrea (SERCO, CNR-ISAC, Enzo.Papandrea@serco.com)
Thoughts on Sun-Synchronous* Altimetry
 Thoughts on Sun-Synchronous* Altimetry R. D. Ray NASA Goddard Space Flight Center 14 March 2007 * Yes, a sun-synchronous wide swath is still sun-synch! Whatʼs so bad about sun-synchronous altimetry? For
HY-2A Satellite User s Guide
 National Satellite Ocean Application Service 2013-5-16 Document Change Record Revision Date Changed Pages/Paragraphs Edit Description i Contents 1 Introduction to HY-2 Satellite... 1 2 HY-2 satellite data
Product Validation Report Polar Ocean
 Product Validation Report Polar Ocean Lars Stenseng PVR, Version 1.0 July 24, 2014 Product Validation Report - Polar Ocean Lars Stenseng National Space Institute PVR, Version 1.0, Kgs. Lyngby, July 24,
Data Short description Parameters to be used for analysis SYNOP. Surface observations by ships, oil rigs and moored buoys
 3.2 Observational Data 3.2.1 Data used in the analysis Data Short description Parameters to be used for analysis SYNOP Surface observations at fixed stations over land P,, T, Rh SHIP BUOY TEMP PILOT Aircraft
TIDE GAUGE AND SATELLITE ALTIMETRY INTEGRATION FOR STORM SURGE PREDICTION
 TIDE GAUGE AND SATELLITE ALTIMETRY INTEGRATION FOR STORM SURGE PREDICTION Ole B. Andersen 1, Y. Cheng 1, X. Deng 2, M. Steward 2 and Z. Gharinerat 2 (1) DTU Space, Elektrovej bldg. 328 Lyngny, Denmark
Developing Coastal Ocean Forecasting Systems and Their Applications
 Developing Coastal Ocean Forecasting Systems and Their Applications Xiaochun Wang a,b LASG/IAP, CAS, July 23, 2010 Contributions from: JPL Yi Chao, John Farrara, Peggy Li, Zhijin Li, Quoc Vu, Hongchun
TECH NOTE. New Mean Sea Surface for the CryoSat-2 L2 SAR Chain. Andy Ridout, CPOM, University College London
 TECH NOTE Subject : From : To : New Mean Sea Surface for the CryoSat-2 L2 SAR Chain Andy Ridout, CPOM, University College London Tommaso Parrinello, CryoSat Mission Manager, ESRIN Date : 30 th June 2014
GLOBAL WAVEFORM SHAPE ANALYSIS FOR THE DETECTION AND MONITORING OF EPHEMERAL SURFACE WATER
 GLOBAL WAVEFORM SHAPE ANALYSIS FOR THE DETECTION AND MONITORING OF EPHEMERAL SURFACE WATER Dowson, M. (1), Berry, P.A.M. (1), Freeman, J.A. (1) (1) De Montfort University EAPRS Lab, De Montfort University,
Remote Sensing and GIS. Microwave Remote Sensing and its Applications
 Subject Paper No and Title Module No and Title Module Tag Geology Remote Sensing and GIS Microwave Remote Sensing and its Applications RS & GIS XVII Principal Investigator Co-Principal Investigator Co-Principal
Atmospheric Water Vapor and Geoid Measurements in the Open Ocean with GPS
 Atmospheric Water Vapor and Geoid Measurements in the Open Ocean with GPS Christian Rocken, James Johnson, Teresa Van Hove, Tetsuya Iwabuchi COSMIC Program Office, University Corporation for Atmospheric
Comparison of Sea Surface Heights Observed by TOPEX Altimeter with Sea Level Data at Chichijima
 Journal of Oceanography Vol. 52, pp. 259 to 273. 1996 Comparison of Sea Surface Heights Observed by TOPEX Altimeter with Sea Level Data at Chichijima NAOTO EBUCHI 1 and KIMIO HANAWA 2 1 Center for Atmospheric
Inter comparison of wave height observations from buoy and altimeter with numerical prediction
 Indian Journal of Geo-Marine Sciences Vol. 43(7), July 2014, pp. 1347-1351 Inter comparison of wave height observations from buoy and altimeter with numerical prediction S. A. Sannasiraj 1*, M. Kalyani
Orbit and Transmit Characteristics of the CloudSat Cloud Profiling Radar (CPR) JPL Document No. D-29695
 JPL Document No. D-29695") Orbit and Transmit Characteristics of the CloudSat Cloud Profiling Radar (CPR) JPL Document No. D-29695 Jet Propulsion Laboratory California Institute of Technology Pasadena, CA 91109 26 July 2004 Revised
Orbit and Transmit Characteristics of the CloudSat Cloud Profiling Radar (CPR) JPL Document No. D-29695 Jet Propulsion Laboratory California Institute of Technology Pasadena, CA 91109 26 July 2004 Revised
Tsunami Detection from Space using GNSS Reflections
 Tsunami Detection from Space using GNSS Reflections R. Stosius, G. Beyerle, A. Helm, A. Hoechner, and J. Wickert Nat. Hazards Earth Syst. Sci., 10, 1359 1372, 2010 1 Tsunami Detection from Space Global
The MSC Beaufort Wind and Wave Reanalysis
 The MSC Beaufort Wind and Wave Reanalysis Val Swail Environment Canada Vincent Cardone, Brian Callahan, Mike Ferguson, Dan Gummer and Andrew Cox Oceanweather Inc. Cos Cob, CT, USA Introduction: History
RETRIEVING EXTREME LOW PRESSURE WITH ALTIMETRY
 RETRIEVING EXTREME LOW PRESSURE WITH ALTIMETRY L. Carrère (1), F. Mertz (1), J. Dorandeu (1), Y. Quilfen (2), Chung-Chi Lin (3) (1) CLS, 8-10 rue Hérmès, 31520 Ramonville St Agne (France) Email:lcarrere@cls.fr
Spectral Albedos. a: dry snow. b: wet new snow. c: melting old snow. a: cold MY ice. b: melting MY ice. d: frozen pond. c: melting FY white ice
 Spectral Albedos a: dry snow b: wet new snow a: cold MY ice c: melting old snow b: melting MY ice d: frozen pond c: melting FY white ice d: melting FY blue ice e: early MY pond e: ageing ponds Extinction
Ocean data assimilation for reanalysis
 Ocean data assimilation for reanalysis Matt Martin. ERA-CLIM2 Symposium, University of Bern, 14 th December 2017. Contents Introduction. On-going developments to improve ocean data assimilation for reanalysis.
The ICESat 2 Mission Laser altimetry of ice, clouds and land elevation
 OSTM SWT San Diego October 2011 The ICESat 2 Mission Laser altimetry of ice, clouds and land elevation and also ocean, coastal, and continental waters Charon Birkett, ESSIC/UMD on behalf of T. Markus,
Sami Alhumaidi, Ph.D. Prince Sultan Advanced Technology Institute King Saud University Radar Symposium, Riyadh December 9, 2014
 Anomalous Wave Propagation and its Adverse Effects on Military Operations Sami Alhumaidi, Ph.D. Prince Sultan Advanced Technology Institute King Saud University Radar Symposium, Riyadh December 9, 2014
D2.1 Product Validation Plan (PVP)
") Consortium Members ESA Sea Level CCI D2.1 Product Validation Plan (PVP) Reference: Nomenclature: CLS-DOS-NT-10-278 SLCCI-PVP-005 Issue: 1. 1 Date: Oct. 11, 11 CLS-DOS-NT-10-278 SLCCI-PVP-005 Issue 1.1
Consortium Members ESA Sea Level CCI D2.1 Product Validation Plan (PVP) Reference: Nomenclature: CLS-DOS-NT-10-278 SLCCI-PVP-005 Issue: 1. 1 Date: Oct. 11, 11 CLS-DOS-NT-10-278 SLCCI-PVP-005 Issue 1.1
State of Passive Microwave Polar Stereographic Products. Walt Meier and polar stereographic product team
 State of Passive Microwave Polar Stereographic Products Walt Meier and polar stereographic product team State of PM PS datasets NRT Tb and sea ice running nominally after many issues (see subsequent slides)
Evaluation of the impact of atmospheric pressure loading modeling on GNSS data analysis
 Evaluation of the impact of atmospheric pressure loading modeling on GNSS data analysis R. Dach a, J. Böhm b, S. Lutz a, and P. Steigenberger c a Astronomical Institute, University of Bern, Bern, Switzerland
Observations of Arctic snow and sea ice thickness from satellite and airborne surveys. Nathan Kurtz NASA Goddard Space Flight Center
 Observations of Arctic snow and sea ice thickness from satellite and airborne surveys Nathan Kurtz NASA Goddard Space Flight Center Decline in Arctic sea ice thickness and volume Kwok et al. (2009) Submarine
THE OPEN UNIVERSITY OF SRI LANKA
 THE OPEN UNIVERSITY OF SRI LANKA Extended Abstracts Open University Research Sessions (OURS 2017) 16 th & 17 th November, 2017 The Open University of Sri Lanka - 2017 All rights reserved. No part of this
2 nd Tidal and Water Level Working Group Meeting
 2 nd Tidal and Water Level Working Group Meeting Norwegian Hydrographic Service, Stavanger, Norway 27 29 April 2010 Vertical Offshore Reference Framework (VORF) Chris Jones United Kingdom Hydrographic
ASCAT B OCEAN CALIBRATION AND WIND PRODUCT RESULTS
 ASCAT B OCEAN CALIBRATION AND WIND PRODUCT RESULTS Jeroen Verspeek 1, Ad Stoffelen 1, Anton Verhoef 1, Marcos Portabella 2, Jur Vogelzang 1 1 KNMI, Royal Netherlands Meteorological Institute, De Bilt,
Eddy Shedding from the Kuroshio Bend at Luzon Strait
 Journal of Oceanography, Vol. 60, pp. 1063 to 1069, 2004 Short Contribution Eddy Shedding from the Kuroshio Bend at Luzon Strait YINGLAI JIA* and QINYU LIU Physical Oceanography Laboratory and Ocean-Atmosphere
Lake level variations from satellite radar altimetry with retracking of multi-leading edge
 Lake level variations from satellite radar altimetry with retracking of multi-leading edge Shirzad Roohi (shirzad.roohi@gis.uni-stuttgart.de) and Nico Sneeuw University of Stuttgart, Germany Institute
A New Satellite Wind Climatology from QuikSCAT, WindSat, AMSR-E and SSM/I
 A New Satellite Wind Climatology from QuikSCAT, WindSat, AMSR-E and SSM/I Frank J. Wentz (presenting), Lucrezia Ricciardulli, Thomas Meissner, and Deborah Smith Remote Sensing Systems, Santa Rosa, CA Supported
Assimilation of ASCAT soil wetness
 EWGLAM, October 2010 Assimilation of ASCAT soil wetness Bruce Macpherson, on behalf of Imtiaz Dharssi, Keir Bovis and Clive Jones Contents This presentation covers the following areas ASCAT soil wetness
Name Period 4 th Six Weeks Notes 2013 Weather
 Name Period 4 th Six Weeks Notes 2013 Weather Radiation Convection Currents Winds Jet Streams Energy from the Sun reaches Earth as electromagnetic waves This energy fuels all life on Earth including the
F O U N D A T I O N A L C O U R S E
 F O U N D A T I O N A L C O U R S E December 6, 2018 Satellite Foundational Course for JPSS (SatFC-J) F O U N D A T I O N A L C O U R S E Introduction to Microwave Remote Sensing (with a focus on passive
Recent improvements on the wave forecasting system of Meteo-France: modeling and assimilation aspects
 Recent improvements on the wave forecasting system of Meteo-France: modeling and assimilation aspects L. Aouf and J-M. Lefèvre Division Marine et Océanographie, Météo-France 13 th International workshop
GCOM-W1 now on the A-Train
 GCOM-W1 now on the A-Train GCOM-W1 Global Change Observation Mission-Water Taikan Oki, K. Imaoka, and M. Kachi JAXA/EORC (& IIS/The University of Tokyo) Mini-Workshop on A-Train Science, March 8 th, 2013
Improving the initialisation of our operational shelf-seas models
 Improving the initialisation of our operational shelf-seas models Robert King James While, Matt Martin, Dan Lean, Jennie Waters, Enda O Dea, Jenny Graham NPOP May 2018 Contents 1. Recent history developments
Performance of the Mixed-Pixel Retrieval Algorithm for Coastal Path Delay
 Performance of the Mixed-Pixel Retrieval Algorithm for Coastal Path Delay Shannon Brown Jet Propulsion Laboratory Shannon.T.Brown@jpl.nasa.gov 1 Mixed Pixel PD Algorithm Mixed-pixel algorithm is statistical
Name Period Part I: INVESTIGATING OCEAN CURRENTS: PLOTTING BUOY DATA
 Name Period Part I: INVESTIGATING OCEAN CURRENTS: PLOTTING BUOY DATA INTRODUCTION: Ocean currents are like huge rivers in the sea. They carry drifting organisms, vital dissolved chemical nutrients and
A Factor of 2-4 Improvement in Marine Gravity and Predicted Bathymetry from CryoSat, Jason-1, and Envisat Radar Altimetry: Arctic and Coastal Regions
 DISTRIBUTION STATEMENT A. Approved for public release; distribution is unlimited. A Factor of 2-4 Improvement in Marine Gravity and Predicted Bathymetry from CryoSat, Jason-1, and Envisat Radar Altimetry:
Improved Fields of Satellite-Derived Ocean Surface Turbulent Fluxes of Energy and Moisture
 Improved Fields of Satellite-Derived Ocean Surface Turbulent Fluxes of Energy and Moisture First year report on NASA grant NNX09AJ49G PI: Mark A. Bourassa Co-Is: Carol Anne Clayson, Shawn Smith, and Gary
Ocean currents from altimetry
 Ocean currents from altimetry Pierre-Yves LE TRAON - CLS - Space Oceanography Division Gamble Workshop - Stavanger,, May 2003 Introduction Today: information mainly comes from in situ measurements ocean
Sea Level Variability in the East Coast of Male, Maldives
 Sea Level Variability in the East Coast of Male, Maldives K.W. Indika 1 *, E.M.S. Wijerathne 2, G. W. A. R. Fernando 3, S.S.L.Hettiarachchi 4 1 National Aquatics Resources Research and Development Agency,
COMPARISON OF SATELLITE DERIVED OCEAN SURFACE WIND SPEEDS AND THEIR ERROR DUE TO PRECIPITATION
 COMPARISON OF SATELLITE DERIVED OCEAN SURFACE WIND SPEEDS AND THEIR ERROR DUE TO PRECIPITATION A.-M. Blechschmidt and H. Graßl Meteorological Institute, University of Hamburg, Hamburg, Germany ABSTRACT
Active rain-gauge concept for liquid clouds using W-band and S-band Doppler radars
 Active rain-gauge concept for liquid clouds using W-band and S-band Doppler radars Leyda León-Colón *a, Sandra L. Cruz-Pol *a, Stephen M. Sekelsky **b a Dept. of Electrical and Computer Engineering, Univ.
Corrections to Scatterometer Wind Vectors For Precipitation Effects: Using High Resolution NEXRAD and AMSR With Intercomparisons
 Corrections to Scatterometer Wind Vectors For Precipitation Effects: Using High Resolution NEXRAD and AMSR With Intercomparisons David E. Weissman Hofstra University Hempstead, New York 11549 Svetla Hristova-Veleva
Coastal Altimetry Data Handbook Issue 2.0, 02 September 2014
 Coastal Altimetry Data Handbook Issue 2.0, 02 September 2014 Edited by the Coastal & Marine Research Centre, University College Cork DOCUMENT DETAILS Author Paolo Cipollini, Rory Scarrott, Helen Snaith