Name Period Part I: INVESTIGATING OCEAN CURRENTS: PLOTTING BUOY DATA
|
|
|
- Mervin Poole
- 6 years ago
- Views:
Transcription
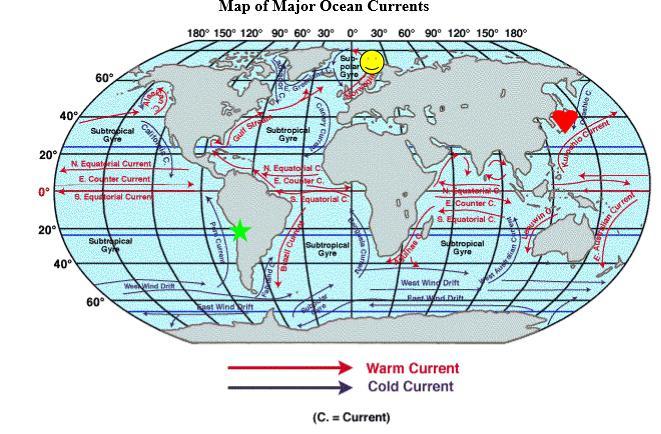
1 Name Period Part I: INVESTIGATING OCEAN CURRENTS: PLOTTING BUOY DATA INTRODUCTION: Ocean currents are like huge rivers in the sea. They carry drifting organisms, vital dissolved chemical nutrients and pollutants with them as they flow. Surface currents effect the biological productivity of the ocean and also help determine our climate by moving hot and cold water masses around. Currents are also important for ships traveling at sea that can move with or against the flow. In this investigation we will consider one important way that scientists gather information about the location and strength of ocean currents. The data below are from drifter buoys in the North Pacific Ocean. Released into the ocean, the buoys float with the currents and take measurements of the water with built-in instruments. They are tracked by satellites in orbits far above Earth and transmit data several times a day. The floater at the top of the buoy sits at the surface of the water and holds an antenna for sending data to a satellite above. Drogues well below the surface cause the ocean currents to take the buoy along instead of the surface wind The buoy also holds electronic instruments for measuring sea surface temperatures (SST), submergence, irradiance (for sunlight) and barometric pressure. At the top is another device for measuring temperature and conductivity (used to calculate salinity). PROCEDURES: Longitudes degrees on the left (west) side of the diagram are East Longitudes (positive numbers); longitudes 180 to 80 on the right (east) side of the diagram are West Longitudes (negative numbers). North Latitudes are in the upper half of the map and South Latitudes are in the lower half of the map. Label the numbers on the map as N and S latitudes and E and W longitudes. Use the longitude and latitude data below to plot the position of each buoy location during the year. Next, connect the locations with different color lines for each buoy and draw an arrow to show the direction of motion. ANALYSIS OF DATA: 1- Refer to a map of surface currents. What are the names of the surface currents that moved the buoys whose courses you plotted? (a) Buoy (b) Buoy (c) Buoy The currents plotted are all part of the North Pacific gyre, a clockwise-moving current that redistributes heat in the North Pacific. (a) What is the name of the current that moves water past the coast of California? (b) Do you think it carries warm or cold water past the coast of California? 3- Sometimes drifting buoys stop transmitting their data to orbiting satellites. (a) List several possibilities as to what might happen to a buoy drifting in the Pacific Ocean to interrupt its data stream. (b) How might these things be avoided? ACADEMIC CHALLENGE-- GEOGRAPHIC AND MATH EXTENSIONS: 4- Using a more detailed map or an atlas showing the Pacific Ocean with a distance scale, calculate approximately how far each buoy travelled overall during the months studied. 5- (a) How far did each buoy drift between February and March? (b) What was the speed of the current moving each buoy in kilometers per day? (c) miles per day? (d) kilometers per hour? (e) miles per hour? 6- Based on your calculations, rank the three surface currents according to their speed. 7- Based on your calculation for the California Current, how long would it take for plankton drifting off the coast of San Francisco to reach Santa Monica Bay? Part II-INVESTIGATING OCEAN CURRENTS AND CLIMATE Climate can be defined as the long term behavior of weather over time, including the average and extreme conditions for a region. Surface currents affect climate by moving cold and warm water around the globe. In general, currents carry warm water from the tropics toward the poles and bring cold water back toward the equator. A surface current warms or cools the air above it, influencing the climate of the land near the coast. Winds pick up moisture as they blow across warm water currents. This often brings mild rainy weather to the coastal regions. In contrast, cold water currents cool the air above them and since cold air has less of an ability to hold moisture than warm air, these currents tend to bring cool, dry weather to adjacent land areas. Fog is often found along the land sea borders where cold ocean currents exist. An example is the west coast of South America where fog is found off the coast and the driest desert in the world, the Atacama, exists!
2 A climograph is a special type of graph that displays the monthly average precipitation and temperature for an area over the course of a year. By studying climographs, you can see how precipitation and temperature differ from one community to another. Procedure: 1.) Look at the map of major ocean currents and write a prediction describing the climate you would expect of each place listed below. (The symbols are to help locate the cities on the world map.) a.) Arica, Chile (along the Peru Current) b.) Trondhiem, Norway (along the Norwegian Current) c.) Tokyo, Japan along the (Kuroshio Current) 2.) Using the climate data from Fact Sheet A, create a climograph for each city listed. Use a line graph for temperature and a bar graph for precipitation on the same graph. 3.) Answer the analysis questions below a.) Examine your climographs. What is the difference between the highest and lowest temperatures in the climograph for each city? b.) Which city is in a desert? How can you tell? c.) d.) Take a closer look at the Arica, Chile climograph. What can you tell about the seasons and the months? How is this related to the hemisphere where Arica is located? Is there a relationship between the temperature of the ocean current and the coastal climate? e.) f.) Is there a relationship between the direction of the ocean current and the coastal climate? In general, on which side of the ocean basins are the cold currents? Warm currents? g.) What can you infer about the climate of each region by reviewing these climographs?
3
4
5 Part I- BUOY DATA Buoy no Position day Latitude Longitude Feb Mar Apr May June July Aug Sept Nov Dec Feb Mar Apr May June July Aug Sept Oct Nov Dec Feb Mar Apr May June July Aug Sept Oct Nov Dec
Adopt a Drifter Lesson Plan by Mary Cook, Middle School Science Teacher, Ahlf Jr. High School, Searcy, Arkansas
 Adopt a Drifter Lesson Plan by Mary Cook, Middle School Science Teacher, Ahlf Jr. High School, Searcy, Arkansas Do Ocean Surface Currents Influence Climate? Objectives Students will construct climographs
Real World Globes Investigating Surface Currents around the Globe Authored by Ryan Glaubke, Graduate Student at Old Dominion University, Norfolk, VA
 Real World Globes Investigating Surface Currents around the Globe Authored by Ryan Glaubke, Graduate Student at Old Dominion University, Norfolk, VA Purpose: - To practice basic plotting techniques using
Warm Up Vocabulary Check
 Warm Up Vocabulary Check Surface current Coriolis Effect global winds upwelling Gulf Stream deep current climate El Nino convection current continental deflection 1.The apparent curving of the path of
Global Climates. Name Date
 Global Climates Name Date No investigation of the atmosphere is complete without examining the global distribution of the major atmospheric elements and the impact that humans have on weather and climate.
LAB J - WORLD CLIMATE ZONES
 Introduction LAB J - WORLD CLIMATE ZONES The objective of this lab is to familiarize the student with the various climates around the world and the climate controls that influence these climates. Students
4.3 Climate (6.3.3) Explore this Phenomena. The same sun shines on the entire Earth. Explain why these two areas have such different climates.
 Explore this Phenomena. The same sun shines on the entire Earth. Explain why these two areas have such different climates.") Explore this Phenomena The same sun shines on the entire Earth. 4.3 Climate (6.3.3) Explain why these two areas have such different climates. 89 6.3.3 Climate Develop and use a model to show how unequal
Explore this Phenomena The same sun shines on the entire Earth. 4.3 Climate (6.3.3) Explain why these two areas have such different climates. 89 6.3.3 Climate Develop and use a model to show how unequal
Activity #2 - Major Ocean Surface Currents
 Activity #2 - Major Ocean Surface Currents Concepts # 3 & 6 # 3 Atmospheric cells and ocean gyres redistribute heat from low to high latitudes, which influences climate, weather, and ocean temperature.
1 What Is Climate? TAKE A LOOK 2. Explain Why do areas near the equator tend to have high temperatures?
 CHAPTER 17 1 What Is Climate? SECTION Climate BEFORE YOU READ After you read this section, you should be able to answer these questions: What is climate? What factors affect climate? How do climates differ
Physical Features of Monsoon Asia. 192 Unit 7 Teachers Curriculum Institute 60 N 130 E 140 E 150 E 60 E 50 N 160 E 40 N 30 N 150 E.
 50 N 60 E 70 E 80 E 90 E 100 E 60 N 110 E 120 E 130 E 140 E 150 E 50 N 160 E 40 N 40 N 30 N 60 E 30 N 150 E Tropic of Cancer 20 N Tropic of Cancer 20 N 10 N 10 N 0 Equator 0 Equator 10 S 10 S 0 500 1,000
Weather & Ocean Currents
 Weather & Ocean Currents Earth is heated unevenly Causes: Earth is round Earth is tilted on an axis Earth s orbit is eliptical Effects: Convection = vertical circular currents caused by temperature differences
How Warm Is the Ocean?
 Currents and Sea Surface Temperature By Steven Moore, Jennifer Vuturo-Brady, and Hedley Bond Guiding Question Learning Objectives How do ocean currents impact seasonal sea surface temperatures? Students
Global Weather Trade Winds etc.notebook February 17, 2017
 Global Weather 1 north pole northern hemisphere equator southern hemisphere south pole 2 We have seasons because of the Earth's tilt The seasons are opposite in the northern and southern hemispheres winter
Average temperature ( F) World Climate Zones. very cold all year with permanent ice and snow. very cold winters, cold summers, and little rain or snow
 World Climate Zones. very cold all year with permanent ice and snow. very cold winters, cold summers, and little rain or snow") P r e v i e w Look carefully at the climagraph of Mumbai, India. What is the wettest month (or months) in Mumbai? What is the driest month (or months) in Mumbai? What effects might this city s climate
P r e v i e w Look carefully at the climagraph of Mumbai, India. What is the wettest month (or months) in Mumbai? What is the driest month (or months) in Mumbai? What effects might this city s climate
1 What Is Climate? TAKE A LOOK 2. Explain Why do areas near the equator tend to have high temperatures?
 CHAPTER 17 1 What Is Climate? SECTION Climate BEFORE YOU READ After you read this section, you should be able to answer these questions: What is climate? What factors affect climate? How do climates differ
Ocean Boundary Currents Guiding Question: How do western boundary currents influence climate and ocean productivity?
 Name: Date: TEACHER VERSION: Suggested Student Responses Included Ocean Boundary Currents Guiding Question: How do western boundary currents influence climate and ocean productivity? Introduction The circulation
2. Can you describe how temperature and dissolved solids changes the density of water?
 Unit 4: Oceanography LT 4.1 Density: I can explain the role density plays to help form some currents. #1 Yes I can: 1. Can you explain what density is and how you calculate it? 2. Can you describe how
World geography 3200/3202 Unit 2 review
 World geography 3200/3202 Unit 2 review 1. Does this statement use the terms revolve & rotate correctly? "Saturn revolves on its axis while several moons rotate around it." 2. Does this statement use the
Regents Earth Science Unit 7: Water Cycle and Climate
 Regents Earth Science Unit 7: Water Cycle and Climate Name Section Coastal and Continental Temperature Ranges Lab # Introduction: There are large variations in average monthly temperatures among cities
Third Grade Math and Science DBQ Weather and Climate/Representing and Interpreting Charts and Data
 Third Grade Math and Science DBQ Weather and Climate/Representing and Interpreting Charts and Data A document based question (DBQ) is an authentic assessment where students interact with content related
LAB 19. Lab 19. Differences in Regional Climate: Why Do Two Cities Located at the Same Latitude and Near a Body of Water Have Such Different Climates?
 Lab Handout Lab 19. Differences in Regional Climate: Why Do Two Cities Located at the Same Latitude and Near a Body of Water Have Such Different Climates? Introduction Weather describes the current atmospheric
Global Wind Patterns
 Name: Earth Science: Date: Period: Global Wind Patterns 1. Which factor causes global wind patterns? a. changes in the distance between Earth and the Moon b. unequal heating of Earth s surface by the Sun
Energy and Seasons A B1. 9. Which graph best represents the general relationship between latitude and average surface temperature?
 Energy and Seasons A B1 1. Which type of surface absorbs the greatest amount of electromagnetic energy from the Sun? (1) smooth, shiny, and light colored (2) smooth, shiny, and dark colored (3) rough,
Bell Work. REVIEW: Our Planet Earth Page 29 Document A & B Questions
 9.12.16 Bell Work REVIEW: Our Planet Earth Page 29 Document A & B Questions Intro to Climate & Weather https://www.youtube.com/watch?v=vhgyoa70q7y Weather vs. Climate Video Climate & Weather 3.1 Weather
L.O Students will learn about factors that influences the environment
 Name L.O Students will learn about factors that influences the environment Date 1. At the present time, glaciers occur mostly in areas of A) high latitude or high altitude B) low latitude or low altitude
Climate.tgt, Version: 1 1
 Name: Key Concepts Choose the letter of the best answer. (5 points each) 1. 2. 3. 4. 5. 6. 7. 8. 9. 10. Date: A city located in the middle of North America experiences extreme temperature changes during
General Oceanography Geology 105 Expedition #17 Tracking Drifter Buoys See Due Date in Greensheet or in Module Area of Canvas
 General Oceanography Name Geology 105 Expedition #17 Tracking Drifter Buoys See Due Date in Greensheet or in Module Area of Canvas Expedition Objective: Students will apply a scientific approach to study
4 Forecasting Weather
 CHAPTER 16 4 Forecasting Weather SECTION Understanding Weather BEFORE YOU READ After you read this section, you should be able to answer these questions: What instruments are used to forecast weather?
Ocean Currents and Climate
 Ocean Currents and Climate Ocean water contains streamlike movements of water called ocean currents. Currents are influenced by a number of factors, including weather, the Earth's rotation, and the position
4 Forecasting Weather
 CHAPTER 2 4 Forecasting Weather SECTION Understanding Weather BEFORE YOU READ After you read this section, you should be able to answer these questions: What instruments are used to forecast weather? How
3) What is the difference between latitude and longitude and what is their affect on local and world weather and climate?
 What is the difference between latitude and longitude and what is their affect on local and world weather and climate?") www.discoveryeducation.com 1) Describe the difference between climate and weather citing an example of each. Describe how water (ocean, lake, river) has a local effect on weather and climate and provide
www.discoveryeducation.com 1) Describe the difference between climate and weather citing an example of each. Describe how water (ocean, lake, river) has a local effect on weather and climate and provide
Third Grade Math and Science DBQ Weather and Climate/Representing and Interpreting Charts and Data - Teacher s Guide
 Third Grade Math and Science DBQ Weather and Climate/Representing and Interpreting Charts and Data - Teacher s Guide A document based question (DBQ) is an authentic assessment where students interact with
Ocean Circulation. In partnership with Dr. Zafer Top
 Ocean Circulation In partnership with Dr. Zafer Top Samantha Hampton Honors Science December 15, 2014 Ocean Circulation is the large scale movement of waters in the ocean basins. Dr. Zafer Top studies
Chapter 1 Section 2. Land, Water, and Climate
 Chapter 1 Section 2 Land, Water, and Climate Vocabulary 1. Landforms- natural features of the Earth s land surface 2. Elevation- height above sea level 3. Relief- changes in height 4. Core- most inner
Website Lecture 3 The Physical Environment Part 1
 Website http://websites.rcc.edu/halama Lecture 3 The Physical Environment Part 1 1 Lectures 3 & 4 1. Biogeochemical Cycling 2. Solar Radiation 3. The Atmosphere 4. The Global Ocean 5. Weather and Climate
Page 1. Name:
 Name: 1) As the difference between the dewpoint temperature and the air temperature decreases, the probability of precipitation increases remains the same decreases 2) Which statement best explains why
UNIVERSITY OF CAMBRIDGE INTERNATIONAL EXAMINATIONS International General Certificate of Secondary Education
 www.xtremepapers.com UNIVERSITY OF CAMBRIDGE INTERNATIONAL EXAMINATIONS International General Certificate of Secondary Education *2678444144* ENVIRONMENTAL MANAGEMENT 0680/02 Paper 2 May/June 2008 1 hour
Homework. Oceanography and Climate Review due Friday Feb 12 th (test day!!)
") Homework Oceanography and Climate Review due Friday Feb 12 th (test day!!) Learning Targets I can define the term climate and explain the factors that influence the climate of an area. I can identify the
Homework Oceanography and Climate Review due Friday Feb 12 th (test day!!) Learning Targets I can define the term climate and explain the factors that influence the climate of an area. I can identify the
About places and/or important events Landmarks Maps How the land is, hills or flat or mountain range Connected to maps World Different countries
 What do you think you know about geography? About places and/or important events Landmarks Maps How the land is, hills or flat or mountain range Connected to maps World Different countries What do you
Seasons, Global Wind and Climate Study Guide
 Seasons, Global Wind and Climate Study Guide Seasons 1. Know what is responsible for the change in seasons on Earth. 2. Be able to determine seasons in the northern and southern hemispheres given the position
Name: Climate Date: EI Niño Conditions
 Name: Date: Base your answers to questions 1 and 2 on the maps and the passage below. The maps show differences in trade wind strength, ocean current direction, and water temperature associated with air-pressure
Temperature Variation on Earth. Goal: Explain our atmosphere s interaction with the Sun s radiation
 Temperature Variation on Earth Goal: Explain our atmosphere s interaction with the Sun s radiation Review: What happens to Solar Radiation? 50%- absorbed by land & sea 20%- absorbed by atmosphere and clouds
Studying the Ocean Using Live Data
 Studying the Ocean Using Live Data Overview The Argo buoy project is a major oceanographic study that harnesses the power of automated unmanned buoys traveling the world s oceans (http://www.argo.ucsd.edu/).
TILT, DAYLIGHT AND SEASONS WORKSHEET
 TILT, DAYLIGHT AND SEASONS WORKSHEET Activity Description: Students will use a data table to make a graph for the length of day and average high temperature in Utah. They will then answer questions based
Website Lecture 3 The Physical Environment Part 1
 Website http://websites.rcc.edu/halama Lecture 3 The Physical Environment Part 1 1 Lectures 3 & 4 1. Biogeochemical Cycling 2. Solar Radiation 3. The Atmosphere 4. The Global Ocean 5. Weather and Climate
March was 3rd warmest month in satellite record
 April 4, 2016 Vol. 25, No. 12 For Additional Information: Dr. John Christy, (256) 961-7763 john.christy@nsstc.uah.edu Dr. Roy Spencer, (256) 961-7960 roy.spencer@nsstc.uah.edu Global Temperature Report:
b. The boundary between two different air masses is called a.
 NAME Earth Science Weather WebQuest Part 1. Air Masses 1. Find out what an air mass is. http://okfirst.mesonet.org/train/meteorology/airmasses.html a. What is an air mass? An air mass is b. The boundary
World Geography Chapter 3
 World Geography Chapter 3 Section 1 A. Introduction a. Weather b. Climate c. Both weather and climate are influenced by i. direct sunlight. ii. iii. iv. the features of the earth s surface. B. The Greenhouse
PART II. Physical Landscape Chapters 2 5 CLIMATE CLIMATE STUDYING CLIMATE R E M I N D E R S. PART II: People and their Physical Environment 10/26/2017
 R E M I N D E R S Two required essays are due by Nov. 13, 2017. (A third may be used for extra credit in place of a Think Geographically essay.) ESSAY TOPIS (choose any two): ontributions of a noted geographer,
Contents. Section 1: Climate Factors. Section 2: Climate Types. Section 3: Climate Effects
 Contents Section 1: Climate Factors 1. Weather or Climate?.... 2 2. Elements of Climate.... 4 3. Factors Affecting Climate.... 10 4. Comparing Climates.... 15 5. Quiz 1.... 20 Section 2: Climate Types
Lesson IV. TOPEX/Poseidon Measuring Currents from Space
 Lesson IV. TOPEX/Poseidon Measuring Currents from Space The goal of this unit is to explain in detail the various measurements taken by the TOPEX/Poseidon satellite. Keywords: ocean topography, geoid,
Factors that Affect Climate
 Factors that Affect Climate What is climate? Climate is the average weather conditions over a long period of time Includes average temperatures and precipitation, wind patterns, humidity, air pressure
Monthly Long Range Weather Commentary Issued: February 15, 2015 Steven A. Root, CCM, President/CEO
 Monthly Long Range Weather Commentary Issued: February 15, 2015 Steven A. Root, CCM, President/CEO sroot@weatherbank.com JANUARY 2015 Climate Highlights The Month in Review During January, the average
2014 Meteorology Summary
 2014 Meteorology Summary New Jersey Department of Environmental Protection AIR POLLUTION AND METEOROLOGY Meteorology plays an important role in the distribution of pollution throughout the troposphere,
Lesson Adaptation Activity: Analyzing and Interpreting Data
 Lesson Adaptation Activity: Analyzing and Interpreting Data Related MA STE Framework Standard: 3-ESS2-1. Use graphs and tables of local weather data to describe and predict typical weather during a particular
Unit 2 Meteorology Test **Please do not write on this test** 5. El Nino & La Nina 6. Photosynthesis 7. Coriolis Effect 8.
 Matching (2 points each) 1. weather 2. climate 3. Greenhouse Effect 4. Convection Unit 2 Meteorology Test **Please do not write on this test** 5. El Nino & La Nina 6. Photosynthesis 7. Coriolis Effect
... Asia. Based on Bloom s Taxonomy. Human & Movement. Location Place. Regions. Environment. Interactions
 ... Asia Location Place Human & Environment Interactions Movement Regions LEVEL 1 Knowledge Match Show or Label List Information Recall Details (5Ws + H) Find Information LEVEL 2 Comprehension LEVEL 3
2. What causes these weather changes?
 Weather Table of Contents Essential Questions... 1 Vocabulary... 2 Weather Symbols... 5 Bringing the Rain to Kapiti Plain... 7 Weather Instruments... 8 Weather Forecasting... 13 Essential Questions 1.
Making a Climograph: GLOBE Data Explorations
 Making a Climograph: A GLOBE Data Exploration Purpose Students learn how to construct and interpret climographs and understand how climate differs from weather. Overview Students calculate and graph maximum
PART II. Physical Landscape Chapters 2 5 CLIMATE CLIMATE STUDYING CLIMATE R E M I N D E R S. PART II: People and their Physical Environment 10/19/2017
 R E M I N D E R S Two required essays are due by Nov. 13, 2017. (A third may be used for extra credit in place of a Think Geographically essay.) ESSAY TOPIS (choose any two): ontributions of a noted geographer,
Mid-latitude Cyclones & Air Masses
 Lab 9 Mid-latitude Cyclones & Air Masses This lab will introduce students to the patterns of surface winds around the center of a midlatitude cyclone of low pressure. The types of weather associated with
Satellites, Weather and Climate Module??: Polar Vortex
 Satellites, Weather and Climate Module??: Polar Vortex SWAC Jan 2014 AKA Circumpolar Vortex Science or Hype? Will there be one this year? Today s objectives Pre and Post exams What is the Polar Vortex
Climate vs. Weather. Weather: Short term state of the atmosphere. Climate: The average weather conditions in an area over a long period of time
 Weather and Climate Climate vs. Weather Weather: Short term state of the atmosphere. Temperature, humidity, cloud cover, precipitation, winds, visibility, air pressure, air pollution, etc Climate: The
Climate Classification Chapter 7
 Climate Classification Chapter 7 Climate Systems Earth is extremely diverse No two places exactly the same Similarities between places allow grouping into regions Climates influence ecosystems Why do we
Weather Atmospheric condition in one place during a limited period of time Climate Weather patterns that an area typically experiences over a long
 Weather Atmospheric condition in one place during a limited period of time Climate Weather patterns that an area typically experiences over a long period of time Many factors influence weather & climate
Grade 9 Geography Chapter 11 - Climate Connections
 Grade 9 Geography Chapter 11 - Climate Connections 1. Define: Weather. 2. In what way has weather affected your activities in the last two weeks? 3. Define: Climate. 4. Canada s climate is a function of
2016 Meteorology Summary
 2016 Meteorology Summary New Jersey Department of Environmental Protection AIR POLLUTION AND METEOROLOGY Meteorology plays an important role in the distribution of pollution throughout the troposphere,
Go With the Flow From High to Low Investigating Isobars
 Go With the Flow From High to Low Investigating Isobars Science 10 Mrs. Purba Air Masses The air over a warm surface can be heated, causing it to rise above more dense air. The result is the formation
Can buoys predict hurricanes? Objectives Students will be able to: track drifter buoys determine the course of the gulf stream current
 Drifters Can buoys predict hurricanes? Objectives Students will be able to: track drifter buoys determine the course of the gulf stream current Materials computers with Internet access Student Worksheet
Elementary Social Studies Content Area Assessment Task. Winter 2010 EDUC 203
 1 Elementary Social Studies Content Area Assessment Task Winter 2010 EDUC 203 Students: Fourth grade class in Watsonville, CA. Approximately 90% Latino, primarily of Mexicandescent. About 80% participate
1. Which weather map symbol is associated with extremely low air pressure? A) B) C) D) 2. The diagram below represents a weather instrument.
 B) C) D) 2. The diagram below represents a weather instrument.") 1. Which weather map symbol is associated with extremely low air pressure? 2. The diagram below represents a weather instrument. Which weather variable was this instrument designed to measure? A) air pressure
1. Which weather map symbol is associated with extremely low air pressure? 2. The diagram below represents a weather instrument. Which weather variable was this instrument designed to measure? A) air pressure
Weather Atmospheric condition in one place during a limited period of time Climate Weather patterns that an area typically experiences over a long
 Weather Atmospheric condition in one place during a limited period of time Climate Weather patterns that an area typically experiences over a long period of time Many factors influence weather & climate
What a Hurricane Needs to Develop
 Weather Weather is the current atmospheric conditions, such as air temperature, wind speed, wind direction, cloud cover, precipitation, relative humidity, air pressure, etc. 8.10B: global patterns of atmospheric
Name Class Date. 2. What is the average weather condition in an area over a long period of time called? a. winter b. temperature c. climate d.
 Skills Worksheet Directed Reading B Section: What Is Climate? CLIMATE VS. WEATHER 1. What kind of conditions vary from day to day? a. climate b. weather c. latitude d. biome 2. What is the average weather
Over the course of this unit, you have learned about different
 70 People and Weather TA L K I N G I T O V E R Over the course of this unit, you have learned about different aspects of earth s weather and atmosphere. Atmospheric scientists, climatologists, hydrologists,
Stream Discharge and the Water Budget
 Regents Earth Science Unit 6: Water Cycle & Climate Name: Lab # Stream Discharge and the Water Budget Introduction: The United States Geological Survey (USGS) measures and publishes values for the daily
Tropical Moist Rainforest
 Tropical or Lowlatitude Climates: Controlled by equatorial tropical air masses Tropical Moist Rainforest Rainfall is heavy in all months - more than 250 cm. (100 in.). Common temperatures of 27 C (80 F)
Grade 6 Standard 2 Unit Test Astronomy
 Grade 6 Standard 2 Unit Test Astronomy Multiple Choice 1. Why does the air temperature rise in the summer? A. We are closer to the sun. B. The air becomes thicker and more dense. C. The sun s rays are
Weather Systems Study Guide:
 Weather Systems Study Guide: 1. Draw a diagram of Earth s water cycle and label each part. 2. Explain how the water cycle works. 3. What happens in the troposphere and stratosphere? Atmosphere Level What
Climate versus Weather
 Climate versus Weather What is climate? Climate is the average weather usually taken over a 30-year time period for a particular region and time period. Climate is not the same as weather, but rather,
DEPARTMENT OF EARTH & CLIMATE SCIENCES Name SAN FRANCISCO STATE UNIVERSITY Nov 29, ERTH 360 Test #2 200 pts
 DEPARTMENT OF EARTH & CLIMATE SCIENCES Name SAN FRANCISCO STATE UNIVERSITY Nov 29, 2018 ERTH 360 Test #2 200 pts Each question is worth 4 points. Indicate your BEST CHOICE for each question on the Scantron
1 What Is Climate? TAKE A LOOK 2. Explain Why do areas near the equator tend to have high temperatures?
 CHAPTER 3 1 What Is Climate? SECTION Climate BEFORE YOU READ After you read this section, you should be able to answer these questions: What is climate? What factors affect climate? How do climates differ
Name Date Class. growth rings of trees, fossilized pollen, and ocean. in the northern hemisphere.
 Lesson Outline LESSON 2 A. Long-Term Cycles 1. A(n) climate cycle takes much longer than a lifetime to complete. a. To learn about long-term climate cycles, scientists study natural records, such as growth
Weather and Climate A B1
 Weather and Climate A B1 1. What causes the Coriolis effect? (1) Earth s tilt on its axis (2) the spin of Earth on its axis (3) the orbital motion of the Moon around Earth (4) the orbital motion of Earth
Which graph best shows the relationship between intensity of insolation and position on the Earth's surface? A) B) C) D)
 B) C) D)") 1. The hottest climates on Earth are located near the Equator because this region A) is usually closest to the Sun B) reflects the greatest amount of insolation C) receives the most hours of daylight D)
1. The hottest climates on Earth are located near the Equator because this region A) is usually closest to the Sun B) reflects the greatest amount of insolation C) receives the most hours of daylight D)
Appendix B Lesson 1: What Is Weather Exit Ticket
 Appendix B Lesson 1: What Is Weather Exit Ticket Name Date Period What is Weather? Exit Ticket List 3 things that you learned during the demonstrations today. What are two questions that you still have?
4 Changes in Climate. TAKE A LOOK 2. Explain Why is more land exposed during glacial periods than at other times?
 Name Class CHAPTER 3 Date Climate 4 Changes in Climate SECTION National Science Education Standards BEFORE YOU READ After you read this section, you should be able to answer these questions: ES 1k, 2a
CLIMATE CLIMATE STUDYING CLIMATE. PART II: People and their 3/20/2018. GEOG 101 Part II People and their Physical Environment R E M I N D E R S
 Two required essays are due by March 27, 2018. (A third may be used for extra credit in place of a Think Geographically essay.) ESSAY TOPIS (choose any two): ontributions of a noted geographer, earth scientist
GRADE 6 GEOGRAPHY TERM 1 LATITUDE AND LONGITUDE (degrees)
") 1 GRADE 6 GEOGRAPHY TERM 1 LATITUDE AND LONGITUDE (degrees) Contents Lines of Latitude... 2 Lines of Longitude... 3 The hemispheres of The Earth... 4 Finding countries and cities on a map using latitude
1 GRADE 6 GEOGRAPHY TERM 1 LATITUDE AND LONGITUDE (degrees) Contents Lines of Latitude... 2 Lines of Longitude... 3 The hemispheres of The Earth... 4 Finding countries and cities on a map using latitude
Name: OBJECTIVES: By the end of today s lesson, you will be able to
 7 th Grade Science Unit: Water s Cycles and Patterns Lesson: WCP 20 Name: Date: Monday, September 28, 2015 Homeroom: OBJECTIVES: By the end of today s lesson, you will be able to SWBAT Describe the three
MAST ACADEMY OUTREACH. WOW (Weather on Wheels)
") MAST ACADEMY OUTREACH MIDDLE SCHOOL PROGRAM Adventures Aboard WOW (Weather on Wheels) On-Site Highlights Packet MAST Academy Maritime and Science Technology High School Miami-Dade County Public Schools
MAST ACADEMY OUTREACH MIDDLE SCHOOL PROGRAM Adventures Aboard WOW (Weather on Wheels) On-Site Highlights Packet MAST Academy Maritime and Science Technology High School Miami-Dade County Public Schools
AOSC 200 Tim Canty. Class Web Site: Topics for today: Air Masses. Fronts. Lecture 19 Apr
 Air Masses AOSC 200 Tim Canty Class Web Site: http://www.atmos.umd.edu/~tcanty/aosc200 Topics for today: Air Masses Fronts Lecture 19 Apr 11 2019 1 Today s Weather Map http://www.wpc.ncep.noaa.gov/#page=sfc
Weather History on the Bishop Paiute Reservation
 Weather History on the Bishop Paiute Reservation -211 For additional information contact Toni Richards, Air Quality Specialist 76 873 784 toni.richards@bishoppaiute.org Updated 2//214 3:14 PM Weather History
What is the difference between Weather and Climate?
 What is the difference between Weather and Climate? Objective Many people are confused about the difference between weather and climate. This makes understanding the difference between weather forecasts
Science Standard 1: Students analyze monthly precipitation and temperature records, displayed in bar charts, collected in metric units (mm).
.") Title: Precipitation Patterns across the Globe NSF GK-12 Fellow: Terry Legg Type of Lesson: STEM Grade Level(s): 4 th - 7 th grade This activity can be tailored to older, more advanced students by having
Title: Precipitation Patterns across the Globe NSF GK-12 Fellow: Terry Legg Type of Lesson: STEM Grade Level(s): 4 th - 7 th grade This activity can be tailored to older, more advanced students by having
Ch. 3: Weather Patterns
 Ch. 3: Weather Patterns Sect. 1: Air Mass & Fronts Sect. 2: Storms Sect. 3: Predicting the Weather Sect. 4: Weather forecasters use advanced technologies Ch. 3 Weather Fronts and Storms Objective(s) 7.E.1.3
Ocean Currents Student Activity Book
 Ocean Currents Student Activity Book I. Introduction Ocean currents influence the weather in coastal areas. They also influence sailing vessels. Though they visibly affect many people's lives, they are
Weather Studies Introduction to Atmospheric Science
 Weather Studies Introduction to Atmospheric Science American Meteorological Society Chapter 1 Monitoring The Weather Credit: This presentation was prepared for AMS by Michael Leach, Professor of Geography
NEWHAM BRIDGE PRIMARY SCHOOL FOUNDATION SUBJECTS CURRICULUM AND ASSESSMENT DOCUMENT GEOGRAPHY
 NEWHAM BRIDGE PRIMARY SCHOOL FOUNDATION SUBJECTS CURRICULUM AND ASSESSMENT DOCUMENT GEOGRAPHY Y1 Geography Curriculum Y1 Geography A.R.E Locational language: hills, beach, forest, town, country, address,
The Global Scope of Climate. The Global Scope of Climate. Keys to Climate. Chapter 8
 The Global Scope of Climate Chapter 8 The Global Scope of Climate In its most general sense, climate is the average weather of a region, but except where conditions change very little during the course
Weather and Climate Summary and Forecast December 2017 Report
 Weather and Climate Summary and Forecast December 2017 Report Gregory V. Jones Linfield College December 5, 2017 Summary: November was relatively cool and wet from central California throughout most of