EXAM # 2. Total 100. Please show all work! Problem Points Grade. STAT 301, Spring 2013 Name
|
|
|
- Darlene Fowler
- 6 years ago
- Views:
Transcription
1 STAT 301, Spring 2013 Name Lec 1, MWF 9:55 - Ismor Fischer Discussion Section: Please circle one! TA: Shixue Li (M 4:35) / 312 (M 12:05) / 315 (T 4:00) Xinyu Song (M 2:25) / 316 (T 12:05) Yi Liu 314 (M 3:30) EXAM # 2 Please show all work! Problem Points Grade Total 100
2 1. A hexagonal dartboard consists of six equally-sized regions, each of which bears a score X, as shown. In a typical game, a blindfolded player throws a dart at random, which lands inside one of the regions. Answer each of the following. Show all work! (a) Suppose the game is played indefinitely (in principle). Below, construct the corresponding probability table and clearly labeled probability histogram for the variable X. (10 pts) x f(x) (b) Calculate the expected value of X, as well its variance. (8 pts) Suppose the game is independently played n = 3 times, resulting in an outcome in the form of an ordered triple of scores (X 1, X 2, X 3 ). (c) Explicitly list the outcomes that correspond to the event (6 pts) E = All three scores are identical = { and calculate its probability P(E). (d) Let the sum of the three scores be denoted by Y = X 1 + X 2 + X 3. What is the expected value of the random variable Y? Hint: Use part (b). (2 pts) (e) Suppose that, if the sum of the three scores is exactly equal to 30, the player wins a prize. With what probability will this occur? (4 pts)
3 2. Three of the most commonly used variables in human studies are age, sex, and race. Suppose the Venn diagram below shows the demographic breakdown of a certain population. Answer each of the following; assume independent outcomes within each intersection. Show all work! Adult Male White Suppose a random sample of n = 10 individuals is to be selected from this population. (6 pts ea) (a) Set up BUT DO NOT EVALUATE an expression for the probability of exactly 6 boys. (b) Set up BUT DO NOT EVALUATE an expression for the probability of exactly 6 whites. (c) Set up BUT DO NOT EVALUATE an expression for the probability of exactly 6 white boys. (d) Calculate the probability that the sample contains at least one boy (i.e., one or more). (e) Calculate the probability that if ten boys are selected, they are all white. That is, the probability of ten white boys, given ten boys.
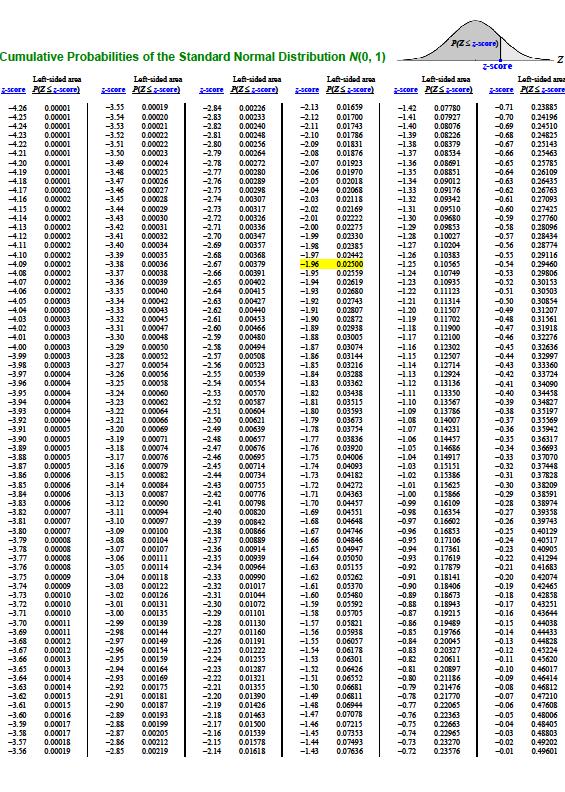
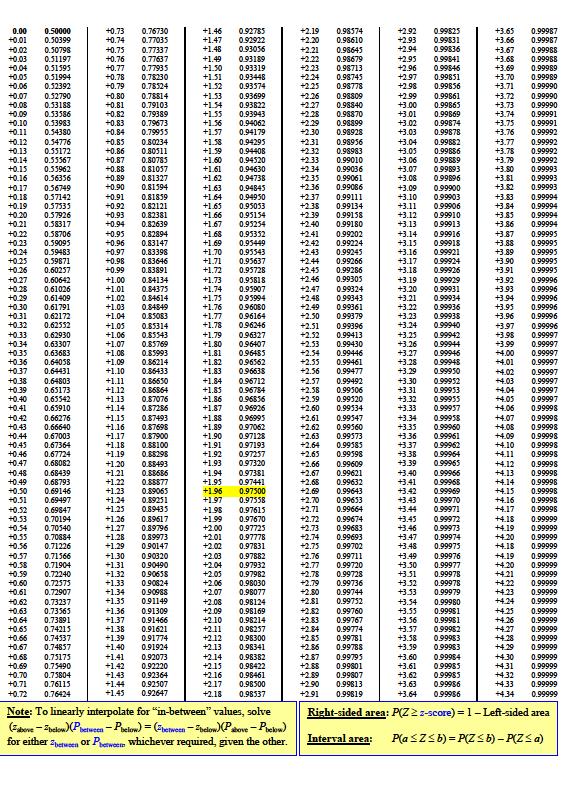
4 3. Assume it is known that the variable X = Age at first birth in a certain population of women is normally distributed, with mean µ = 30.0 years, and standard deviation σ = 4.0 years, i.e., X ~ N(30, 4). Answer each of the following. Show all work! (a) Suppose that an individual woman is to be randomly selected from this population. Calculate the probability that her age at first birth is older than or equal to 31 years. (3 pts) (b) Suppose that a random sample of n = 100 women is to be selected from this population. Calculate the probability that the mean age at first birth is older than or equal to 31 years. (5 pts) Suppose it is also known that the ages X of several other populations are normally distributed with the same standard deviation σ = 4.0 years, but each perhaps with a significantly different mean µ. In each case, a sample of n = 100 women is randomly selected for formal hypothesis testing at the α =.05 level. Answer the following for each of the scenarios described in (c), (d), (e), and (f) below. Show all work! Calculate the p-value of the sample. (Tip: Draw a diagram; use (b) when possible.) (3 pts) Can the null hypothesis formally be rejected in favor of the alternative hypothesis? Why? (2 pts) Is the result considered to be statistically significant (Yes / No)? (3 pts) If yes, does the sample provide strong, moderate, or weak statistical evidence that the mean age is significantly different from 30 years? In addition, is the mean age significantly younger or older than 30 years? If no, are there any informal conclusions that are suggested by this analysis, and if so, what? (c) Null hypothesis H 0 : µ = 30 versus Alternative hypothesis H A : µ 30; sample mean age x = 30.8 years. (d) Null hypothesis H 0 : µ = 30 versus Alternative hypothesis H A : µ 30; sample mean age x = 31.0 years. (e) Null hypothesis H 0 : µ 30 versus Alternative hypothesis H A : µ > 30; sample mean age x = 31.0 years. (f) Null hypothesis H 0 : µ 30 versus Alternative hypothesis H A : µ > 30; sample mean age x = 29.0 years.
5


6
7 One Sample POPULATION PARAMETER Null Hypothesis H 0 : θ = θ 0 SAMPLE STATISTIC Point Estimate ˆ θ = f(x 1,, x n ) Mean 2 H 0 : µ = µ 0 ˆµ = x = x i n Proportion H 0 : π = π 0 ˆ π (= p) = X n, where X = # Successes CRITICAL VALUE (2-sided) 1 n 30: t n 1, α /2 or z α /2 n < 30: t n 1, α /2 only MARGIN OF ERROR = product of these two factors: Any n: STANDARD ERROR (estimate) 2 s / n n 30 : z α /2 ~ N(0, 1) n 30 also, nπ 15 and n(1 π) 15: For Confidence Interval: ˆ π (1 ˆ π) n n < 30: Use X ~ Bin(n,π). For Acceptance Region, p-value: (not explicitly covered) π (1 π ) n 0 0 Two Independent Samples Two Paired Samples 3 Null Hypothesis H 0 : θ 1 θ 2 = 0 Point Estimate ˆ θ ˆ θ 1 2 Means 2 H 0 : µ 1 µ 2 = 0 x1 x2 Proportions H 0 : π 1 π 2 = 0 ˆ π ˆ 1 π2 CRITICAL VALUE (2-sided) 1 n 1, n 2 30: t + α or z α /2 n1 n2 2, / 2 n 1, n 2 < 30: Is σ 1 2 = σ 2 2? Informal: 1/4 < s 1 2 /s 2 2 < 4? Yes t n1+ n2 2, α / 2 No Satterwaithe s Test n 1, n 2 30 : z α /2 (or use Chi-squared Test) n 1, n 2 < 30: Fisher s Exact Test (not explicitly covered) STANDARD ERROR (estimate) 2 n 1, n 2 30: s 2 1 / n 1 + s 2 2 / n 2 n 1, n 2 < 30: 2 s pooled 1 / n / n 2 where s pooled 2 = (n 1 1) s (n 2 1) s 2 2 n 1 + n 2 2 n 1, n 2 30 also, (see criteria above): For Confidence Interval: ˆ π (1 ˆ π ) n + ˆ π (1 ˆ π ) n For Acceptance Region, p-value: ˆ π where pooled (1 ˆ π ) 1 n + 1 n pooled 1 2 ˆ π pooled = (X 1 + X 2 ) / (n 1 + n 2 ) k samples (k 2) Null Hypothesis H 0 : θ 1 = θ 2 = = θ k Independent Dependent (not covered) Means H 0 : µ 1 = µ 2 = = µ k F-test (ANOVA) Repeated Measures, Blocks Proportions H 0 : π 1 = π 2 = = π k Chi-squared Test Other techniques 1 For 1-sided hypothesis tests, replace α /2 by α. 2 For Mean(s): If normality is established, use the true standard error if known either σ / n or σ 2 2 / n σ / n with the Z-distribution. If normality is not established, then use a transformation, or a nonparametric Wilcoxon Test on the median(s). 3 For Paired Means: Apply the appropriate one sample test to the pairwise differences D = X Y. For Paired Proportions: Apply McNemar s Test, a matched version of the 2 2 Chi-squared Test.
TA: Sheng Zhgang (Th 1:20) / 342 (W 1:20) / 343 (W 2:25) / 344 (W 12:05) Haoyang Fan (W 1:20) / 346 (Th 12:05) FINAL EXAM
 / 342 (W 1:20) / 343 (W 2:25) / 344 (W 12:05) Haoyang Fan (W 1:20) / 346 (Th 12:05) FINAL EXAM") STAT 301, Fall 2011 Name Lec 4: Ismor Fischer Discussion Section: Please circle one! TA: Sheng Zhgang... 341 (Th 1:20) / 342 (W 1:20) / 343 (W 2:25) / 344 (W 12:05) Haoyang Fan... 345 (W 1:20) / 346 (Th
STAT 301, Fall 2011 Name Lec 4: Ismor Fischer Discussion Section: Please circle one! TA: Sheng Zhgang... 341 (Th 1:20) / 342 (W 1:20) / 343 (W 2:25) / 344 (W 12:05) Haoyang Fan... 345 (W 1:20) / 346 (Th
A3. Statistical Inference Hypothesis Testing for General Population Parameters
 Appendix / A3. Statistical Inference / General Parameters- A3. Statistical Inference Hypothesis Testing for General Population Parameters POPULATION H 0 : θ = θ 0 θ is a generic parameter of interest (e.g.,
5-1. For which functions in Problem 4-3 does the Central Limit Theorem hold / fail?
 Ismor Fischer, 8/1/008 Stat 541 / 5-9 5.3 Problems 5-1. For which functions in Problem 4-3 does the Central Limit Theorem hold / fail? 5-. Refer to Problem 4-9. (a) Suppose that a random sample of n =
Swarthmore Honors Exam 2012: Statistics
 Swarthmore Honors Exam 2012: Statistics 1 Swarthmore Honors Exam 2012: Statistics John W. Emerson, Yale University NAME: Instructions: This is a closed-book three-hour exam having six questions. You may
Ismor Fischer, 11/5/ # tablets AM probability PM probability
 Ismor Fischer, 11/5/017 4.4-1 4.4 Problems 1. Patient noncompliance is one of many potential sources of bias in medical studies. Consider a study where patients are asked to take tablets of a certain medication
" M A #M B. Standard deviation of the population (Greek lowercase letter sigma) σ 2
 σ 2") Notation and Equations for Final Exam Symbol Definition X The variable we measure in a scientific study n The size of the sample N The size of the population M The mean of the sample µ The mean of the
Notation and Equations for Final Exam Symbol Definition X The variable we measure in a scientific study n The size of the sample N The size of the population M The mean of the sample µ The mean of the
Analysis of variance (ANOVA) Comparing the means of more than two groups
 Comparing the means of more than two groups") Analysis of variance (ANOVA) Comparing the means of more than two groups Example: Cost of mating in male fruit flies Drosophila Treatments: place males with and without unmated (virgin) females Five treatments
Analysis of variance (ANOVA) Comparing the means of more than two groups Example: Cost of mating in male fruit flies Drosophila Treatments: place males with and without unmated (virgin) females Five treatments
STAT 501 EXAM I NAME Spring 1999
 STAT 501 EXAM I NAME Spring 1999 Instructions: You may use only your calculator and the attached tables and formula sheet. You can detach the tables and formula sheet from the rest of this exam. Show your
Stat 135 Fall 2013 FINAL EXAM December 18, 2013
 Stat 135 Fall 2013 FINAL EXAM December 18, 2013 Name: Person on right SID: Person on left There will be one, double sided, handwritten, 8.5in x 11in page of notes allowed during the exam. The exam is closed
Unit II Quiz Question Sampler 2.086/2.090 Fall 2012
 Unit II Quiz Question Sampler 2.86/2.9 Fall 212 You may refer to the text and other class materials as well as your own notes and scripts. For Quiz 2 (on Unit II) you will need a calculator (for arithmetic
16.400/453J Human Factors Engineering. Design of Experiments II
 J Human Factors Engineering Design of Experiments II Review Experiment Design and Descriptive Statistics Research question, independent and dependent variables, histograms, box plots, etc. Inferential
Master s Written Examination - Solution
 Master s Written Examination - Solution Spring 204 Problem Stat 40 Suppose X and X 2 have the joint pdf f X,X 2 (x, x 2 ) = 2e (x +x 2 ), 0 < x < x 2
Ismor Fischer, 2/27/2018 Solutions / 3.5-1
 Ismor Fischer, 2/27/2018 Solutions / 3.5-1 3.5 1. Let events A = Live to age 60, B = Live to age 70, C = Live to age 80 ; note that event C is a subset of B, and that B is a subset of A, i.e., they are
Non-parametric (Distribution-free) approaches p188 CN
 approaches p188 CN") Week 1: Introduction to some nonparametric and computer intensive (re-sampling) approaches: the sign test, Wilcoxon tests and multi-sample extensions, Spearman s rank correlation; the Bootstrap. (ch14
Week 1: Introduction to some nonparametric and computer intensive (re-sampling) approaches: the sign test, Wilcoxon tests and multi-sample extensions, Spearman s rank correlation; the Bootstrap. (ch14
EXAM 3 Math 1342 Elementary Statistics 6-7
 EXAM 3 Math 1342 Elementary Statistics 6-7 Name Date ********************************************************************************************************************************************** MULTIPLE
DETAILED CONTENTS PART I INTRODUCTION AND DESCRIPTIVE STATISTICS. 1. Introduction to Statistics
 DETAILED CONTENTS About the Author Preface to the Instructor To the Student How to Use SPSS With This Book PART I INTRODUCTION AND DESCRIPTIVE STATISTICS 1. Introduction to Statistics 1.1 Descriptive and
MATH Notebook 3 Spring 2018
 MATH448001 Notebook 3 Spring 2018 prepared by Professor Jenny Baglivo c Copyright 2010 2018 by Jenny A. Baglivo. All Rights Reserved. 3 MATH448001 Notebook 3 3 3.1 One Way Layout........................................
ORF 245 Fundamentals of Engineering Statistics. Final Exam
 Princeton University Department of Operations Research and Financial Engineering ORF 245 Fundamentals of Engineering Statistics Final Exam May 22, 2008 7:30pm-10:30pm PLEASE DO NOT TURN THIS PAGE AND START
Lecture 7: Hypothesis Testing and ANOVA
 Lecture 7: Hypothesis Testing and ANOVA Goals Overview of key elements of hypothesis testing Review of common one and two sample tests Introduction to ANOVA Hypothesis Testing The intent of hypothesis
Survey on Population Mean
 MATH 203 Survey on Population Mean Dr. Neal, Spring 2009 The first part of this project is on the analysis of a population mean. You will obtain data on a specific measurement X by performing a random
Chapter 18 Resampling and Nonparametric Approaches To Data
 Chapter 18 Resampling and Nonparametric Approaches To Data 18.1 Inferences in children s story summaries (McConaughy, 1980): a. Analysis using Wilcoxon s rank-sum test: Younger Children Older Children
FINAL EXAM PLEASE SHOW ALL WORK!
 STAT 311, Fall 015 Name Discussion Section: Please circle one! LEC 001 TR 11:00AM-1:15PM FISCHER, ISMOR LEC 00 TR 9:30-10:45AM FISCHER, ISMOR DIS 311 W 1:0-:10PM Zhang, ilin DIS 31 W 1:0-:10PM Li, iaomao
*Karle Laska s Sections: There is no class tomorrow and Friday! Have a good weekend! Scores will be posted in Compass early Friday morning
 STATISTICS 100 EXAM 3 Spring 2016 PRINT NAME (Last name) (First name) *NETID CIRCLE SECTION: Laska MWF L1 Laska Tues/Thurs L2 Robin Tu Write answers in appropriate blanks. When no blanks are provided CIRCLE
Salt Lake Community College MATH 1040 Final Exam Fall Semester 2011 Form E
 Salt Lake Community College MATH 1040 Final Exam Fall Semester 011 Form E Name Instructor Time Limit: 10 minutes Any hand-held calculator may be used. Computers, cell phones, or other communication devices
1. (Rao example 11.15) A study measures oxygen demand (y) (on a log scale) and five explanatory variables (see below). Data are available as
 A study measures oxygen demand (y) (on a log scale) and five explanatory variables (see below). Data are available as") ST 51, Summer, Dr. Jason A. Osborne Homework assignment # - Solutions 1. (Rao example 11.15) A study measures oxygen demand (y) (on a log scale) and five explanatory variables (see below). Data are available
ST 51, Summer, Dr. Jason A. Osborne Homework assignment # - Solutions 1. (Rao example 11.15) A study measures oxygen demand (y) (on a log scale) and five explanatory variables (see below). Data are available
n i n T Note: You can use the fact that t(.975; 10) = 2.228, t(.95; 10) = 1.813, t(.975; 12) = 2.179, t(.95; 12) =
 = 2.228, t(.95; 10) = 1.813, t(.975; 12) = 2.179, t(.95; 12) =") MAT 3378 3X Midterm Examination (Solutions) 1. An experiment with a completely randomized design was run to determine whether four specific firing temperatures affect the density of a certain type of brick.
MAT 3378 3X Midterm Examination (Solutions) 1. An experiment with a completely randomized design was run to determine whether four specific firing temperatures affect the density of a certain type of brick.
CIVL /8904 T R A F F I C F L O W T H E O R Y L E C T U R E - 8
 CIVL - 7904/8904 T R A F F I C F L O W T H E O R Y L E C T U R E - 8 Chi-square Test How to determine the interval from a continuous distribution I = Range 1 + 3.322(logN) I-> Range of the class interval
Introduction to Nonparametric Statistics
 Introduction to Nonparametric Statistics by James Bernhard Spring 2012 Parameters Parametric method Nonparametric method µ[x 2 X 1 ] paired t-test Wilcoxon signed rank test µ[x 1 ], µ[x 2 ] 2-sample t-test
Comparison of Two Population Means
 Comparison of Two Population Means Esra Akdeniz March 15, 2015 Independent versus Dependent (paired) Samples We have independent samples if we perform an experiment in two unrelated populations. We have
CBA4 is live in practice mode this week exam mode from Saturday!
 Announcements CBA4 is live in practice mode this week exam mode from Saturday! Material covered: Confidence intervals (both cases) 1 sample hypothesis tests (both cases) Hypothesis tests for 2 means as
ORF 245 Fundamentals of Engineering Statistics. Final Exam
 Princeton University Department of Operations Research and Financial Engineering ORF 45 Fundamentals of Engineering Statistics Final Exam May 15, 009 1:30pm-4:30pm PLEASE DO NOT TURN THIS PAGE AND START
EXAM # 3 PLEASE SHOW ALL WORK!
 Stat 311, Summer 2018 Name EXAM # 3 PLEASE SHOW ALL WORK! Problem Points Grade 1 30 2 20 3 20 4 30 Total 100 1. A socioeconomic study analyzes two discrete random variables in a certain population of households
LHS Algebra Pre-Test
 Your Name Teacher Block Grade (please circle): 9 10 11 12 Course level (please circle): Honors Level 1 Instructions LHS Algebra Pre-Test The purpose of this test is to see whether you know Algebra 1 well
The Chi-Square Distributions
 MATH 03 The Chi-Square Distributions Dr. Neal, Spring 009 The chi-square distributions can be used in statistics to analyze the standard deviation of a normally distributed measurement and to test the
Unit 1 Review of BIOSTATS 540 Practice Problems SOLUTIONS - Stata Users
 BIOSTATS 640 Spring 2017 Review of Introductory Biostatistics STATA solutions Page 1 of 16 Unit 1 Review of BIOSTATS 540 Practice Problems SOLUTIONS - Stata Users #1. The following table lists length of
(a) The density histogram above right represents a particular sample of n = 40 practice shots. Answer each of the following. Show all work.
 The density histogram above right represents a particular sample of n = 40 practice shots. Answer each of the following. Show all work.") . Target Practice. An archer is practicing hitting the bull s-eye of the target shown below left. For any point on the target, define the continuous random variable D = (signed) radial distance to the
. Target Practice. An archer is practicing hitting the bull s-eye of the target shown below left. For any point on the target, define the continuous random variable D = (signed) radial distance to the
, 0 x < 2. a. Find the probability that the text is checked out for more than half an hour but less than an hour. = (1/2)2
2") Math 205 Spring 206 Dr. Lily Yen Midterm 2 Show all your work Name: 8 Problem : The library at Capilano University has a copy of Math 205 text on two-hour reserve. Let X denote the amount of time the text
Math 205 Spring 206 Dr. Lily Yen Midterm 2 Show all your work Name: 8 Problem : The library at Capilano University has a copy of Math 205 text on two-hour reserve. Let X denote the amount of time the text
CHAPTER 10. Regression and Correlation
 CHAPTER 10 Regression and Correlation In this Chapter we assess the strength of the linear relationship between two continuous variables. If a significant linear relationship is found, the next step would
STAT Section 3.4: The Sign Test. The sign test, as we will typically use it, is a method for analyzing paired data.
 STAT 518 --- Section 3.4: The Sign Test The sign test, as we will typically use it, is a method for analyzing paired data. Examples of Paired Data: Similar subjects are paired off and one of two treatments
Name: Exam 2 Solutions. March 13, 2017
 Department of Mathematics University of Notre Dame Math 00 Finite Math Spring 07 Name: Instructors: Conant/Galvin Exam Solutions March, 07 This exam is in two parts on pages and contains problems worth
STA 303 H1S / 1002 HS Winter 2011 Test March 7, ab 1cde 2abcde 2fghij 3
 STA 303 H1S / 1002 HS Winter 2011 Test March 7, 2011 LAST NAME: FIRST NAME: STUDENT NUMBER: ENROLLED IN: (circle one) STA 303 STA 1002 INSTRUCTIONS: Time: 90 minutes Aids allowed: calculator. Some formulae
Psych 10 / Stats 60, Practice Problem Set 5 (Week 5 Material) Part 1: Power (and building blocks of power)
 Part 1: Power (and building blocks of power)") Psych 10 / Stats 60, Practice Problem Set 5 (Week 5 Material) Part 1: Power (and building blocks of power) 1. A researcher plans to do a two-tailed hypothesis test with a sample of n = 100 people and a
Psych 10 / Stats 60, Practice Problem Set 5 (Week 5 Material) Part 1: Power (and building blocks of power) 1. A researcher plans to do a two-tailed hypothesis test with a sample of n = 100 people and a
MATH ELEMENTARY STATISTICS SPRING 2013 ANSWERS TO SELECTED EVEN PROBLEMS & PRACTICE PROBLEMS, UNIT 1
 MATH 10043 ELEMENTARY STATISTICS SPRING 2013 ANSWERS TO SELECTED EVEN PROBLEMS & PRACTICE PROBLEMS, UNIT 1 1.3 (2) Qualitative data are values assigning items to non-numeric categories; quantitative data
Math 58. Rumbos Fall More Review Problems Solutions
 Math 58. Rumbos Fall 2008 1 More Review Problems Solutions 1. A particularly common question in the study of wildlife behavior involves observing contests between residents of a particular area and intruders.
Chapter 12 - Lecture 2 Inferences about regression coefficient
 Chapter 12 - Lecture 2 Inferences about regression coefficient April 19th, 2010 Facts about slope Test Statistic Confidence interval Hypothesis testing Test using ANOVA Table Facts about slope In previous
STAT 525 Fall Final exam. Tuesday December 14, 2010
 STAT 525 Fall 2010 Final exam Tuesday December 14, 2010 Time: 2 hours Name (please print): Show all your work and calculations. Partial credit will be given for work that is partially correct. Points will
Comparison of Two Samples
 2 Comparison of Two Samples 2.1 Introduction Problems of comparing two samples arise frequently in medicine, sociology, agriculture, engineering, and marketing. The data may have been generated by observation
THE ROYAL STATISTICAL SOCIETY HIGHER CERTIFICATE
 THE ROYAL STATISTICAL SOCIETY 004 EXAMINATIONS SOLUTIONS HIGHER CERTIFICATE PAPER II STATISTICAL METHODS The Society provides these solutions to assist candidates preparing for the examinations in future
Statistics 135 Fall 2007 Midterm Exam
 Name: Student ID Number: Statistics 135 Fall 007 Midterm Exam Ignore the finite population correction in all relevant problems. The exam is closed book, but some possibly useful facts about probability
We know from STAT.1030 that the relevant test statistic for equality of proportions is:
 2. Chi 2 -tests for equality of proportions Introduction: Two Samples Consider comparing the sample proportions p 1 and p 2 in independent random samples of size n 1 and n 2 out of two populations which
UNIVERSITY OF TORONTO Faculty of Arts and Science
 UNIVERSITY OF TORONTO Faculty of Arts and Science December 2013 Final Examination STA442H1F/2101HF Methods of Applied Statistics Jerry Brunner Duration - 3 hours Aids: Calculator Model(s): Any calculator
Unit 14: Nonparametric Statistical Methods
 Unit 14: Nonparametric Statistical Methods Statistics 571: Statistical Methods Ramón V. León 8/8/2003 Unit 14 - Stat 571 - Ramón V. León 1 Introductory Remarks Most methods studied so far have been based
a) The runner completes his next 1500 meter race in under 4 minutes: <
 The runner completes his next 1500 meter race in under 4 minutes: <") I. Let X be the time it takes a runner to complete a 1500 meter race. It is known that for this specific runner, the random variable X has a normal distribution with mean μ = 250.0 seconds and standard
I. Let X be the time it takes a runner to complete a 1500 meter race. It is known that for this specific runner, the random variable X has a normal distribution with mean μ = 250.0 seconds and standard
Lecture 2: Basic Concepts and Simple Comparative Experiments Montgomery: Chapter 2
 Lecture 2: Basic Concepts and Simple Comparative Experiments Montgomery: Chapter 2 Fall, 2013 Page 1 Random Variable and Probability Distribution Discrete random variable Y : Finite possible values {y
Mathematics for Economics MA course
 Mathematics for Economics MA course Simple Linear Regression Dr. Seetha Bandara Simple Regression Simple linear regression is a statistical method that allows us to summarize and study relationships between
An Analysis of College Algebra Exam Scores December 14, James D Jones Math Section 01
 An Analysis of College Algebra Exam s December, 000 James D Jones Math - Section 0 An Analysis of College Algebra Exam s Introduction Students often complain about a test being too difficult. Are there
Lecture Slides. Elementary Statistics. by Mario F. Triola. and the Triola Statistics Series
 Lecture Slides Elementary Statistics Tenth Edition and the Triola Statistics Series by Mario F. Triola Slide 1 Chapter 13 Nonparametric Statistics 13-1 Overview 13-2 Sign Test 13-3 Wilcoxon Signed-Ranks
Chapter 7 Comparison of two independent samples
 Chapter 7 Comparison of two independent samples 7.1 Introduction Population 1 µ σ 1 1 N 1 Sample 1 y s 1 1 n 1 Population µ σ N Sample y s n 1, : population means 1, : population standard deviations N
Coimisiún na Scrúduithe Stáit State Examinations Commission. Leaving Certificate Examination Mathematics
 2015. M30 Coimisiún na Scrúduithe Stáit State Examinations Commission Leaving Certificate Examination 2015 Mathematics Paper 2 Higher Level Monday 8 June Morning 9:30 12:00 300 marks Running total Examination
Queen s University Faculty of Arts and Sciences Department of Economics Winter Economics 250 A and B: Introduction to Statistics
 Queen s University Faculty of Arts and Sciences Department of Economics Winter 2007 Economics 250 A and B: Introduction to Statistics Instructions: Term Test 1 February 7th, 2007 Read questions and instructions
Lecture Slides. Section 13-1 Overview. Elementary Statistics Tenth Edition. Chapter 13 Nonparametric Statistics. by Mario F.
 Lecture Slides Elementary Statistics Tenth Edition and the Triola Statistics Series by Mario F. Triola Slide 1 Chapter 13 Nonparametric Statistics 13-1 Overview 13-2 Sign Test 13-3 Wilcoxon Signed-Ranks
# of 6s # of times Test the null hypthesis that the dice are fair at α =.01 significance
 Practice Final Exam Statistical Methods and Models - Math 410, Fall 2011 December 4, 2011 You may use a calculator, and you may bring in one sheet (8.5 by 11 or A4) of notes. Otherwise closed book. The
Coffee Hour Problems and Solutions
 Coffee Hour Problems and Solutions Edited by Matthew McMullen Fall 01 Week 1. Proposed by Matthew McMullen. Find all pairs of positive integers x and y such that 0x + 17y = 017. Solution. By inspection,
Master s Written Examination
 Master s Written Examination Option: Statistics and Probability Spring 016 Full points may be obtained for correct answers to eight questions. Each numbered question which may have several parts is worth
Final Exam Review STAT 212
 Final Exam Review STAT 212 1/ A market researcher randomly selects 100 homeowners under 60 years of age and 200 homeowners over 60 years of age. What sampling technique was used? A. Systematic B. Convenience
Math 1040 Final Exam Form A Introduction to Statistics Fall Semester 2010
 Math 1040 Final Exam Form A Introduction to Statistics Fall Semester 2010 Instructor Name Time Limit: 120 minutes Any calculator is okay. Necessary tables and formulas are attached to the back of the exam.
This exam contains 13 pages (including this cover page) and 10 questions. A Formulae sheet is provided with the exam.
 and 10 questions. A Formulae sheet is provided with the exam.") Probability and Statistics FS 2017 Session Exam 22.08.2017 Time Limit: 180 Minutes Name: Student ID: This exam contains 13 pages (including this cover page) and 10 questions. A Formulae sheet is provided
Probability and Statistics FS 2017 Session Exam 22.08.2017 Time Limit: 180 Minutes Name: Student ID: This exam contains 13 pages (including this cover page) and 10 questions. A Formulae sheet is provided
Tribhuvan University Institute of Science and Technology 2065
 1CSc. Stat. 108-2065 Tribhuvan University Institute of Science and Technology 2065 Bachelor Level/First Year/ First Semester/ Science Full Marks: 60 Computer Science and Information Technology (Stat. 108)
SEVERAL μs AND MEDIANS: MORE ISSUES. Business Statistics
 SEVERAL μs AND MEDIANS: MORE ISSUES Business Statistics CONTENTS Post-hoc analysis ANOVA for 2 groups The equal variances assumption The Kruskal-Wallis test Old exam question Further study POST-HOC ANALYSIS
PSY 307 Statistics for the Behavioral Sciences. Chapter 20 Tests for Ranked Data, Choosing Statistical Tests
 PSY 307 Statistics for the Behavioral Sciences Chapter 20 Tests for Ranked Data, Choosing Statistical Tests What To Do with Non-normal Distributions Tranformations (pg 382): The shape of the distribution
Solutions to Final STAT 421, Fall 2008
 Solutions to Final STAT 421, Fall 2008 Fritz Scholz 1. (8) Two treatments A and B were randomly assigned to 8 subjects (4 subjects to each treatment) with the following responses: 0, 1, 3, 6 and 5, 7,
Stat 231 Exam 2 Fall 2013
 Stat 231 Exam 2 Fall 2013 I have neither given nor received unauthorized assistance on this exam. Name Signed Date Name Printed 1 1. Some IE 361 students worked with a manufacturer on quantifying the capability
Permutation Tests. Noa Haas Statistics M.Sc. Seminar, Spring 2017 Bootstrap and Resampling Methods
 Permutation Tests Noa Haas Statistics M.Sc. Seminar, Spring 2017 Bootstrap and Resampling Methods The Two-Sample Problem We observe two independent random samples: F z = z 1, z 2,, z n independently of
Exam Empirical Methods VU University Amsterdam, Faculty of Exact Sciences h, February 12, 2015
 Exam Empirical Methods VU University Amsterdam, Faculty of Exact Sciences 18.30 21.15h, February 12, 2015 Question 1 is on this page. Always motivate your answers. Write your answers in English. Only the
Topic 3: Sampling Distributions, Confidence Intervals & Hypothesis Testing. Road Map Sampling Distributions, Confidence Intervals & Hypothesis Testing
 Topic 3: Sampling Distributions, Confidence Intervals & Hypothesis Testing ECO22Y5Y: Quantitative Methods in Economics Dr. Nick Zammit University of Toronto Department of Economics Room KN3272 n.zammit
Midterm 1 and 2 results
 Midterm 1 and 2 results Midterm 1 Midterm 2 ------------------------------ Min. :40.00 Min. : 20.0 1st Qu.:60.00 1st Qu.:60.00 Median :75.00 Median :70.0 Mean :71.97 Mean :69.77 3rd Qu.:85.00 3rd Qu.:85.0
Chapter 23: Inferences About Means
 Chapter 3: Inferences About Means Sample of Means: number of observations in one sample the population mean (theoretical mean) sample mean (observed mean) is the theoretical standard deviation of the population
STA 4504/5503 Sample Exam 1 Spring 2011 Categorical Data Analysis. 1. Indicate whether each of the following is true (T) or false (F).
 or false (F).") STA 4504/5503 Sample Exam 1 Spring 2011 Categorical Data Analysis 1. Indicate whether each of the following is true (T) or false (F). (a) T In 2 2 tables, statistical independence is equivalent to a population
STA 4504/5503 Sample Exam 1 Spring 2011 Categorical Data Analysis 1. Indicate whether each of the following is true (T) or false (F). (a) T In 2 2 tables, statistical independence is equivalent to a population
STA 4504/5503 Sample Exam 1 Spring 2011 Categorical Data Analysis. 1. Indicate whether each of the following is true (T) or false (F).
 or false (F).") STA 4504/5503 Sample Exam 1 Spring 2011 Categorical Data Analysis 1. Indicate whether each of the following is true (T) or false (F). (a) (b) (c) (d) (e) In 2 2 tables, statistical independence is equivalent
STA 4504/5503 Sample Exam 1 Spring 2011 Categorical Data Analysis 1. Indicate whether each of the following is true (T) or false (F). (a) (b) (c) (d) (e) In 2 2 tables, statistical independence is equivalent
SMAM 314 Exam 42 Name
 SMAM 314 Exam 42 Name Mark the following statements True (T) or False (F) (10 points) 1. F A. The line that best fits points whose X and Y values are negatively correlated should have a positive slope.
Math st Homework. First part of Chapter 2. Due Friday, September 17, 1999.
 Math 447. 1st Homework. First part of Chapter 2. Due Friday, September 17, 1999. 1. How many different seven place license plates are possible if the first 3 places are to be occupied by letters and the
Final Exam. Math Su10. by Prof. Michael Cap Khoury
 Final Exam Math 45-0 Su0 by Prof. Michael Cap Khoury Name: Directions: Please print your name legibly in the box above. You have 0 minutes to complete this exam. You may use any type of conventional calculator,
Single Sample Means. SOCY601 Alan Neustadtl
 Single Sample Means SOCY601 Alan Neustadtl The Central Limit Theorem If we have a population measured by a variable with a mean µ and a standard deviation σ, and if all possible random samples of size
Nemours Biomedical Research Statistics Course. Li Xie Nemours Biostatistics Core October 14, 2014
 Nemours Biomedical Research Statistics Course Li Xie Nemours Biostatistics Core October 14, 2014 Outline Recap Introduction to Logistic Regression Recap Descriptive statistics Variable type Example of
2. A music library has 200 songs. How many 5 song playlists can be constructed in which the order of the songs matters?
 Practice roblems for final exam 1. A certain vault requires that an entry code be 8 characters. If the first 4 characters must be letters (repeated letters are allowed) and the last 4 characters are numeric
STAT 515 fa 2016 Lec Statistical inference - hypothesis testing
 STAT 515 fa 2016 Lec 20-21 Statistical inference - hypothesis testing Karl B. Gregory Wednesday, Oct 12th Contents 1 Statistical inference 1 1.1 Forms of the null and alternate hypothesis for µ and p....................
1. Consider a random independent sample of size 712 from a distribution with the following pdf. c 1+x. f(x) =
 =") 1. Consider a random independent sample of size 712 from a distribution with the following pdf f(x) = c 1+x 0
1. Consider a random independent sample of size 712 from a distribution with the following pdf f(x) = c 1+x 0
Lecture 5: ANOVA and Correlation
 Lecture 5: ANOVA and Correlation Ani Manichaikul amanicha@jhsph.edu 23 April 2007 1 / 62 Comparing Multiple Groups Continous data: comparing means Analysis of variance Binary data: comparing proportions
Mock Exam - 2 hours - use of basic (non-programmable) calculator is allowed - all exercises carry the same marks - exam is strictly individual
 calculator is allowed - all exercises carry the same marks - exam is strictly individual") Mock Exam - 2 hours - use of basic (non-programmable) calculator is allowed - all exercises carry the same marks - exam is strictly individual Question 1. Suppose you want to estimate the percentage of
Mock Exam - 2 hours - use of basic (non-programmable) calculator is allowed - all exercises carry the same marks - exam is strictly individual Question 1. Suppose you want to estimate the percentage of
paper 2 most likely questions May 2018 [327 marks]
![paper 2 most likely questions May 2018 [327 marks]](/thumbs/93/114436107.jpg "paper 2 most likely questions May 2018 [327 marks]") paper 2 most likely questions May 2018 [327 marks] Let f(x) = 6x2 4, for 0 x 7. e x 1a. Find the x-intercept of the graph of f. 1b. The graph of f has a maximum at the point A. Write down the coordinates
paper 2 most likely questions May 2018 [327 marks] Let f(x) = 6x2 4, for 0 x 7. e x 1a. Find the x-intercept of the graph of f. 1b. The graph of f has a maximum at the point A. Write down the coordinates
DSST Principles of Statistics
 DSST Principles of Statistics Time 10 Minutes 98 Questions Each incomplete statement is followed by four suggested completions. Select the one that is best in each case. 1. Which of the following variables
Lecture 10: Non- parametric Comparison of Loca6on. GENOME 560, Spring 2015 Doug Fowler, GS
 Lecture 10: Non- parametric Comparison of Loca6on GENOME 560, Spring 2015 Doug Fowler, GS (dfowler@uw.edu) 1 Review What do we mean by nonparametric? What is a desirable localon stalslc for ordinal data?
STAT 461/561- Assignments, Year 2015
 STAT 461/561- Assignments, Year 2015 This is the second set of assignment problems. When you hand in any problem, include the problem itself and its number. pdf are welcome. If so, use large fonts and
MATH 3200 PROBABILITY AND STATISTICS M3200FL081.1
 MATH 3200 PROBABILITY AND STATISTICS M3200FL081.1 This examination has twenty problems, of which the first seventeen are modifications of the recommended homework problems. The remaining three problems
Statistiek II. John Nerbonne using reworkings by Hartmut Fitz and Wilbert Heeringa. February 13, Dept of Information Science
 Statistiek II John Nerbonne using reworkings by Hartmut Fitz and Wilbert Heeringa Dept of Information Science j.nerbonne@rug.nl February 13, 2014 Course outline 1 One-way ANOVA. 2 Factorial ANOVA. 3 Repeated
Chapter 3 Probability Distributions and Statistics Section 3.1 Random Variables and Histograms
 Math 166 (c)2013 Epstein Chapter 3 Page 1 Chapter 3 Probability Distributions and Statistics Section 3.1 Random Variables and Histograms The value of the result of the probability experiment is called
P (A B) P ((B C) A) P (B A) = P (B A) + P (C A) P (A) = P (B A) + P (C A) = Q(A) + Q(B).
 P ((B C) A) P (B A) = P (B A) + P (C A) P (A) = P (B A) + P (C A) = Q(A) + Q(B).") Lectures 7-8 jacques@ucsdedu 41 Conditional Probability Let (Ω, F, P ) be a probability space Suppose that we have prior information which leads us to conclude that an event A F occurs Based on this information,
Lectures 7-8 jacques@ucsdedu 41 Conditional Probability Let (Ω, F, P ) be a probability space Suppose that we have prior information which leads us to conclude that an event A F occurs Based on this information,
Introduction to Statistics for the Social Sciences Review for Exam 4 Homework Assignment 27
 Introduction to Statistics for the Social Sciences Review for Exam 4 Homework Assignment 27 Name: Lab: The purpose of this worksheet is to review the material to be represented in Exam 4. Please answer
HYPOTHESIS TESTING II TESTS ON MEANS. Sorana D. Bolboacă
 HYPOTHESIS TESTING II TESTS ON MEANS Sorana D. Bolboacă OBJECTIVES Significance value vs p value Parametric vs non parametric tests Tests on means: 1 Dec 14 2 SIGNIFICANCE LEVEL VS. p VALUE Materials and
Analysis of Covariance. The following example illustrates a case where the covariate is affected by the treatments.
 Analysis of Covariance In some experiments, the experimental units (subjects) are nonhomogeneous or there is variation in the experimental conditions that are not due to the treatments. For example, a