Comparison of PROBA-V, METOP and emodis NDVI anomalies over the Horn of Africa Third Main Title Line Third Line
|
|
|
- Josephine Norton
- 5 years ago
- Views:
Transcription


1 Comparison of PROBA-V, METOP and emodis NDVI anomalies over the Horn of Africa Third Main Title Line Third Line Evaluation of PROBA-V satellite data quality Michele Meroni Felix Rembold 0 5 Report EUR 738 EN
2 European Commission Joint Research Centre Institute for Environment and Sustainability, Monitoring Agricultural Resources Unit H04 Contact information Michele Meroni Address: Joint Research Centre, Via E. Fermi 749, TP66, 6B/07, 07 Ispra (VA), Italy Tel.: JRC Science Hub Legal Notice This publication is a Technical Report by the Joint Research Centre, the European Commission s in-house science service. It aims to provide evidence-based scientific support to the European policy-making process. The scientific output expressed does not imply a policy position of the European Commission. Neither the European Commission nor any person acting on behalf of the Commission is responsible for the use which might be made of this publication. All images European Union 05 EUR 738 EN ISBN (PDF) ISSN (online) doi: 0.788/6744 European Union, 05 Reproduction is authorised provided the source is acknowledged. Abstract After 5 years of operational service, the VGT instrument has reached its end-of-life in May 04. Before this date, the PROBA-V satellite (PV) was launched in May 03 by ESA, as a gap filler, i.e., between the SPOT VGT and the future Sentinel 3 satellite, foreseen to be launched in mid-05. In order to evaluate the quality and usability for operational crop monitoring of the new PV satellite NDVI data we compared it to other moderate to low spatial resolution instruments. The analysis has been performed over the Horn of Africa using TAMSAT rainfall estimates and NDVI from METOP and MODIS instruments as term of comparison. We found large disagreement (up to more than 40% according to the proposed classification scheme) between NDVI anomaly derived from PV the one hand, and METOP or emodis on the other hand. The disagreement between METOP and emodis is lower and normally within 30%. The analysis also shows that in case of disagreement, the difference between paired anomalies is biased when PV is compared with one of the other two sensors. That is, when PV and one of the two sensors do not agree on the sign of the anomaly, it is PV indicating a positive anomaly and the other sensor a negative one in 80% of the cases. Visual inspection of anomalies support these findings and highlight the fact that this agreement has indeed operational implications. That is, PV appears to deliver a contrasting information regarding vegetation status as compared to METOP and emodis, especially in some specific dekads (e.g., dekads 5 to 8). Performing the same comparison for the year 03 when NDVI data were provided by VGT instead of PV, we confirm that major differences among the three sensors were not present and we corroborate the hypothesis that the cause of the problem is related to the use of PV NRT data with VGT LTA data to compute the anomalies. Finally, rainfall estimates time series of 04 were used as an additional and qualitative check for the observed differences. The visual inspection of rainfall anomalies suggests that the anomalies shown by PV are generally too positive while METOP and emodis are showing a better convergence with the rainfall estimates. The results of this preliminary comparison call for further analysis to understand the cause of the observed seasonality of the agreement between the PV anomalies and those of other comparable sensors (METOP and emodis). Also it is not known at the moment whether this situation is specific for the East African window or if similar patterns can also be observed in other regions of the world. Before this clarification is made and corrective actions are taken, we recommend to follow a conservative approach and use emodis or METOP for the operational monitoring of FOODSEC.
3 Table of Contents Motivation of the analysis... 4 Data, pre-processing and study area... 4 Agreement evaluation... 4 Visual inspection of anomalies... 4 Anomaly class agreement... 5 Anomaly scatterplot... 7 Decomposition of anomaly into current and LTA NDVI... 8 Comparison with rainfall anomalies... 0 VGT agreement during year Conclusions... 4 References... 4 Annex I... 5 Annex II

4 Motivation of the analysis The visual inspection of NDVI anomaly products for 04 and from different instruments (Proba-V (PV), METOP, emodis) highlighted some major differences between them. In this report we summarise the results of a systematic analysis of such difference. In order to avoid possible inconsistencies arising from the different temporal windows used to compute the LTA (Long Term Average) with the different sensors, we first computed a common LTA period (008-03) for all of them. Data, pre-processing and study area Table specifies the data used in the present analysis and summarises the basic processing applied to NDVI data before the analysis. Year of comparison 04 Target area Countries Country mask Vegetation mask Somalia, Kenya, Uganda, Sudan, South Sudan, Ethiopia, Eritrea Extracted from GAUL (S:\Actions\FOODSEC\base_data\remote_sensing\ROI IGA per Felix\HoAcountries.shp) In order to exclude desert, bare soils and other non-vegetated surfaces we used a Vegetation / No Vegetation mask from phenology algorithm of Meroni et al. (04) RS data MODIS METOP PV/VGT Anomaly LTA temporal range, Long Term Averages Smoothing Spatial resolution Seasonality Agreement evaluation Visual inspection of anomalies emodis 0-day composite (50 m resolution) resampled to km VGT/PV grid Standard METOP NDVI product at km resolution PV NDVI v.. is used for 04, SPOT-VGT for the computation of the LTA Difference NDVIi NDVI_LTAi (also called absolute difference anomaly ) for all sensors (based on length of the METOP time series) All analysis has been performed with smoothed data. PV, VGT and METOP were smoothed at JRC with the Swets algorithm, emodis was smoothed at USGS using the Swets algorithm as well km grid of METOP and PV. emodis 50 m is resampled on such grid Temporal evolution of mean NDVI by country is shown in Annex I for METOP and PV just to have an idea of the seasonality in the area. Table : Data and main preproccessing used in the analysis 4
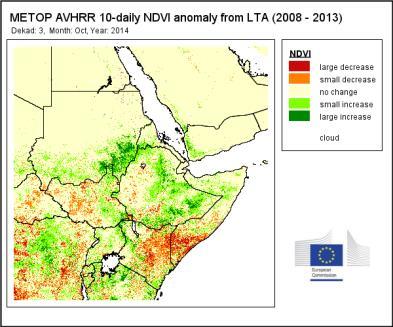
5 Annex II reports the anomaly maps for each dekad of 04. PV anomalies appear to be in average significantly more positive in both amplitude and spatial extent than those of METOP and emodis. The METOP derived maps show large areas of strong negative differences in the tropical areas (mainly DRC) not visible in the other two products. On the contrary, PV often shows positive anomalies where the other two show negative values. The differences among the products appear to increase along the year reaching a maximum in the period ranging from dekad 4 to 9. It is important to observe that during this period, the analyst would have drawn different conclusions about the status of vegetation. Anomaly class agreement In order to stress the differences between anomalies from an analyst point of view, the agreement was quantitatively evaluated using the anomaly classes of Table and by computing the occurrence of the agreement classes reported in Table 3. NDVI abs difference Label Colour < large decrease : small decrease : 0.05 no change 0.05 : 0.5 small increase > 0.5 large increase Table : Classification of absolute difference anomalies Label Condition Unacceptable mismatch sensors indicates anomaly with opposite sign ( increase vs. decrease, no matter the magnitude) Serious mismatch one sensor indicates no change and the other indicates large change (either increase or decrease ) Mismatch one sensor indicates no change and the other indicates small change (either increase or decrease ) Minor mismatch both sensors have the same sign of the anomaly ( increase or decrease ) but different magnitude ( small vs. large ) Agreement both sensors indicate in the same class Table 3: Classification of agreement of anomaly classes This classification was applied at all couples of NDVI anomalies (METOP vs. PV, METOP vs. emodis and emodis vs. PV) considering the pixels belonging to the vegetation mask. Results are reported in Table 4. 5


6 METOP vs. emodis METOP vs. PV emodis vs. PV Table 4: Temporal evolution of the agreement among anomaly classes, year 04 The agreement between METOP and PV appears to be the lowest of the three paired comparisons (METOP vs. PV, emodis vs. PV, METOP vs. emodis). When comparing PV with the two other instruments, a decrease of agreement is observed from dekad 8 to dekad 9-30 when the agreement increases again. During the period of lowest agreement (dekads 5-8), the total mismatch between anomaly classes is greater than 40% (47.5% and 4.3% with METOP and emodis, respectively). During the same period the total mismatch between METOP and emodis is 3.4%. By considering this 6
7 temporal window and only the three classes representing the highest mismatch (i.e., mismatch, serious and unacceptable mismatch ), the METOP-eMODIS shows a 9.3% mismatch whereas the couples METOP-PV and emodis-pv show 4.7 and 37.5% mismatch. Anomaly scatterplot We pooled all 36 dekads together and we analysed the overall agreement with a scatterplots of one instrument against the others. OLS (Ordinary Least Square) linear and GMRF (Geometric Mean Functional Relationship) regression models, the Agreement Coefficients (AC), the R, the agreement coefficient internally developed dfac (Dominique Fasbender, personal communication), are used here to evaluate the relationships between sensors. In addition we performed the same analysis dekad by dekad and we reported the temporal evolution of the various agreement indicators. METOP vs. emodis Overall agreement Temporal evolution of agreement METOP vs. PV emodis vs. PV Table 5: Scatterplot statistics 7
8 Although the agreement between emodis and PV is the highest according to the various agreement coefficient considered, this does not prevent the anomalies to provide different information. In fact, we expect the anomalies not only to be well correlated but we require that they do agree on the sign and magnitude. In fact, let us focus on the cases where a pair of instruments indicates opposite anomalies: one is positive and the other negative. This condition is met by the data points falling in the first and third quadrants of the scatterplots. Table 6 reports the percentages of such occurrences (first column). Table 6 reports, in case of disagreement on the sign of the anomaly, the percentages of cases having the first instrument indicating a positive (and the second a negative one), and the other way around (column two and three). Note that this exercise is rather general as the values of a pixel can disagree on the sign even if they are very close to zero. The reader interested in the % of cases where the values are diverging in sign and with a magnitude greater than 0. may refer to Table 4. % of pixel with anomaly of opposite sign (% of total number of points) % of pixel where X anomaly is + and Y is (% of pixels having opposite sign) % of pixel where X anomaly is - and Y is + (% of pixels having opposite sign) METOP (X) vs emodis (Y) METOP (X) vs. PV (Y) emodis (X) vs. PV (Y) Table 6: Analysis of the sign of the anomalies Table 6 shows that the percentage of complete sign disagreement (first column) is comparable among sensors. However, the disagreement appears to be evenly distributed in the two possible cases (first sensor positive and the other negative and the other way around) only for the couple METOP - emodis. When PV is one of the sensors of the comparison, the great majority of disagreement cases are represented by PV showing a positive anomaly and the other sensor a negative one. From the analyst point of view, this is an indication that when the anomaly of PV does not agree with that of one of the other sensors, it delivers preferentially an optimistic evaluation of vegetation status. In these conditions (see also the anomaly quick-looks for these dekads) the analyst would actually draw seriously different conclusions on vegetation status depending on the data source used. Decomposition of anomaly into current and LTA NDVI In order to investigate the possible origin of the observed differences in the anomalies, Table 7 reports the scatterplot of the smoothed NDVIs. The agreement between paired NDVIs is maximum for the couple emodis-pv and is anyhow comparable for the three couples. However, it can be observed that PV overestimates the NDVI value as compared to emodis (mean bias PV-eMODIS = 0.03). 8
 between the various sensors.")
 we observed that this is likely to be originated by a NRT PV NDVI that is generally higher (above the : line)")
9 METOP vs emodis METOP vs PV emodis vs PV Table 7: 04 NDVI scatterplots When PV anomalies are computed, the use of the LTA from VGT is likely to amplify such differences. Table 8 reports the scatterplots of the LTA NDVI (36 dekads) between the various sensors. For instance, when comparing PV with emodis we observed a general overestimation of anomalies by PV (Table 5 and Table 6). By inspecting NRT NDVI and LTA scatterplots (Table 7 and Table 8) we observed that this is likely to be originated by a NRT PV NDVI that is generally higher (above the : line) than that of emodis whereas the PV LTA NDVI is aligned with that of emodis. METOP vs emodis METOP vs PV emodis vs PV Table 8: LTA NDVI scatterplots 9
 rainfall estimates are accurate enough, and ii) an NDVI positive or negative anomalies should temporally follow (with some delay) a surplus (up to a")

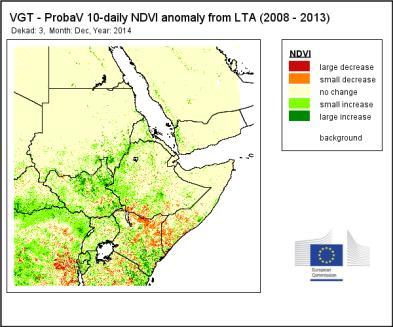
10 Comparison with rainfall anomalies In order to confirm the information provided by the NDVI, analysts often compare NDVI anomalies with the anomalies of cumulated rainfall estimates. The assumptions behind this approach are: i) rainfall estimates are accurate enough, and ii) an NDVI positive or negative anomalies should temporally follow (with some delay) a surplus (up to a defined extent) or a deficit of precipitation, respectively. We followed as similar approach to qualitatively evaluate which NDVI anomalies were in agreement with rainfall estimates. That is, relevant cumulative values of TAMSAT rainfall estimates were visually compared to NDVI anomalies from the various sources in an attempt to further test the differences by comparing them to an independent data source. Three temporal windows were used for cumulating rainfall: June-September for the comparison in the mono-modal areas, March-June and September-December for the comparison in the bimodal areas. In Table 9, such anomalies were compared to the three dekadal anomalies corresponding to the last month used for the accumulation of rainfall. 5 emodis anomaly METOP anomaly PV anomaly Rainfall anomaly
 and falling in the period of lowest agreement between NDVI anomalies,")
11 Table 9: Comparison between NDVI (emodis, METOP, PV) and rainfall anomalies (TAMSAT), first column refers to dekad number. In the comparison referring to the three dekads of September (dekads 5, 6 and 7 for NDVI; period June-September for rainfall) and falling in the period of lowest agreement between NDVI anomalies, rainfall anomalies agree to a greater extent with NDVI anomalies of emodis and METOP, while the correspondence with PV anomaly is reduced. Contrarily to the other two, PV shows a positive NDVI anomaly over large areas of negative rainfall anomaly in Ethiopia, South Sudan, Central African Republic and DRC. By looking at the agreement in the other two periods (March-June and September- December) it is possible to note that the agreement between emodis and METOP on the one hand and PV on the other follows that reported in Table 4: still low in June and improving again in December.
12 VGT agreement during year 03 In order to confirm that the observed problem is related to the use of PV for the NRT data (and the VGT for the LTA), we checked the agreement among the NDVI anomalies from the three sensors in 03, thus using VGT data only for both NRT and LTA. Comparing Table 0 with Table 4 it is possible to observe that the agreement between PV and METOP or emodis is reduced compared to the agreement between VGT and the METOP or emodis. For instance, when comparing PV and VGT to emodis, all the disagreement categories represent in average over the year the 3.8% (peak at 43.9%) in case of PV and 9.3% (peak at 8. %) in case of VGT. The occurrence of the last two classes (serious + unacceptable mismatch) is also increased when using PV instead of VGT in the comparison with emodis: PV average = 3.6% and peak = 6.7%, VGT average = 0.80% and peak =.7%.
13 METOP vs. emodis METOP vs. VGT emodis vs. VGT Table 0: Temporal evolution of the agreement among anomaly classes, year 03 3
14 Conclusions We found large disagreement (up to more than 40% according to the proposed classification scheme) between NDVI anomaly derived from PV the one hand, and METOP or emodis on the other hand. The disagreement between METOP and emodis is lower and normally within 30%. The analysis also shows that in case of disagreement, the difference between paired anomalies is biased when PV is compared with one of the other two sensors. That is, when PV and one of the two sensors do not agree on the sign of the anomaly, it is PV indicating a positive anomaly and the other sensor a negative one in 80% of the cases. Visual inspection of anomalies support these findings and highlight the fact that this agreement has indeed operational implications. That is, PV appears to deliver a contrasting information regarding vegetation status as compared to METOP and emodis, especially in some specific dekads (e.g., dekads 5 to 8). Performing the same comparison for the year 03 when NDVI data were provided by VGT instead of PV, we confirm that major differences among the three sensors were not present and we corroborate the hypothesis that the cause of the problem is related to the use of PV NRT data with VGT LTA data to compute the anomalies. Finally, rainfall estimates time series of 04 were used as an additional and qualitative check for the observed differences. The visual inspection of rainfall anomalies suggests that the anomalies shown by PV are generally too positive while METOP and emodis are showing a better convergence with the rainfall estimates. Looking at the agreement over time one is tempted to think that a temporal pattern or a seasonality does exists, with the agreement of METOP and emodis with PV being progressively reduced along the year, reaching a minimum around dekads 5-8 and then increasing again. We thought about the possible problem of the incorrect Sun- Earth distance in VGT archive (and thus in the LTA used to compute PV anomalies), however the temporal pattern of the agreement does not match that expected because of this incorrect modelling. In fact, the impact of this error should be maximum around DOY 90 ( while we observe the lowest agreement later on in the year. Also, because the differences are strongest after dekad 5 we assume that these differences are not visible or underestimated in the SPOT VGT/PROBA V intercalibration period from October 03 to May 04. The results of this preliminary comparison call for further analysis to understand the cause of the observed temporal degradation of the agreement between the PV anomalies and those of other comparable sensors (METOP and emodis). Also it is not known at the moment whether this situation is specific for the East African window or if similar patterns can also be observed in other regions of the world. Before this clarification is made and corrective actions are taken, we recommend to follow a conservative approach and use emodis or METOP for the operational monitoring of FOODSEC using NDVI anomalies. References Meroni, M., Verstraete, M.M., Rembold, F., Urbano, F., Kayitakire, F. (04), A phenologybased method to derive biomass production anomaly for food security monitoring in the Horn of Africa. International Journal of Remote Sensing, 37, 7,
15 Annex I Seasonal evolution by selected countries (under the mask) 5
16 Annex II Anomaly maps d emodis anomaly METOP anomaly PV anomaly
17
18
19
20
21
22
23 3 6 3
24 4
25 Europe Direct is a service to help you find answers to your questions about the European Union Freephone number (*): (*) Certain mobile telephone operators do not allow access to numbers or these calls may be billed. A great deal of additional information on the European Union is available on the Internet. It can be accessed through the Europa server How to obtain EU publications Our publications are available from EU Bookshop ( where you can place an order with the sales agent of your choice. The Publications Office has a worldwide network of sales agents. You can obtain their contact details by sending a fax to (35) European Commission EUR 738 EN Joint Research Centre Institute for Environment and Sustainability Title: Comparison of PROBA-V, METOP and emodis NDVI anomalies over the Horn of Africa - Evaluation of PROBA-V satellite data quality Authors: Michele Meroni, Felix Rembold Luxembourg: Publications Office of the European Union 05 5 pp..0 x 9.7 cm EUR Scientific and Technical Research series ISSN (online) ISBN (PDF) doi:0.788/6744 5

26 LB-NA-738-EN-N JRC Mission As the Commission s in-house science service, the Joint Research Centre s mission is to provide EU policies with independent, evidence-based scientific and technical support throughout the whole policy cycle. Working in close cooperation with policy Directorates-General, the JRC addresses key societal challenges while stimulating innovation through developing new methods, tools and standards, and sharing its know-how with the Member States, the scientific community and international partners. Serving society Stimulating innovation Supporting legislation doi:0.788/6744 ISBN
Drought Bulletin for the Greater Horn of Africa: Situation in June 2011
 Drought Bulletin for the Greater Horn of Africa: Situation in June 2011 Preliminary Analysis of data from the African Drought Observatory (ADO) SUMMARY The analyses of different meteorological and remote
Crop and pasture monitoring in Eritrea
 JRC SCIENTIFIC AND POLICY REPORTS Crop and pasture monitoring in Eritrea Kremti rainy season started with substantial delay Ana Pérez-Hoyos, Francois Kayitakire, Hervé Kerdiles, Felix Rembold, Olivier
Drought News August 2014
 European Drought Observatory (EDO) Drought News August 2014 (Based on data until the end of July) http://edo.jrc.ec.europa.eu August 2014 EDO (http://edo.jrc.ec.europa.eu) Page 2 of 8 EDO Drought News
GMFS South Sudan CFSAM Support Kit
 GMFS South Sudan CFSAM Support Kit version 1.0 October, 2011 Table of contents 1 Disclaimer... 1 2 General introduction... 1 3 South Sudan base maps and statistics... 2 3.1 Base map... 2 3.2 Agroecological
DUG User Guide. Version 2.1. Aneta J Florczyk Luca Maffenini Martino Pesaresi Thomas Kemper
 DUG User Guide Version 2.1 Aneta J Florczyk Luca Maffenini Martino Pesaresi Thomas Kemper 2017 i This publication is a Technical report by the Joint Research Centre (JRC), the European Commission s science
Analytical Report. Drought in the Horn of Africa February Executive summary. Geographical context. Likelihood of drought impact (LDI)
") Executive summary The current drought in the Horn of Africa is affecting especially Somalia, among other countries, in particular the central and southern regions, where most population is located. Overall,
Executive summary The current drought in the Horn of Africa is affecting especially Somalia, among other countries, in particular the central and southern regions, where most population is located. Overall,
REMOTELY SENSED INFORMATION FOR CROP MONITORING AND FOOD SECURITY
 LEARNING OBJECTIVES Lesson 4 Methods and Analysis 2: Rainfall and NDVI Seasonal Graphs At the end of the lesson, you will be able to: understand seasonal graphs for rainfall and NDVI; describe the concept
Standardization of JRC developed Nuclear Mass Spectrometry Methods with ASTM-International
 Standardization of JRC developed Nuclear Mass Spectrometry Methods with ASTM-International Revision of ASTM-1672 for the "Total Evaporation" (TE/TIMS) Method with Input from JRC-G.2/METRO Stephan Richter
The warning classification scheme of ASAP Anomaly hot Spots of Agricultural Production, v1.1
 The warning classification scheme of ASAP Anomaly hot Spots of Agricultural Production, v1.1 Technical description of warning classification system version 1.1 Michele Meroni, Felix Rembold, Ferdinando
Crop Monitoring in Europe WINTER CEREAL HARDENING IS PROGRESSING WELL. MARS BULLETIN Vol.20 No.12 (2012)
") ONLINE VERSION JRC68576 EUR 24736 EN ISSN 1831-9424 ISSN 1831-9793 Crop Monitoring in Europe MARS BULLETIN Vol.20 No.12 (2012) Issued: 17 December 2012 WINTER CEREAL HARDENING IS PROGRESSING WELL The last
ONLINE VERSION JRC68576 EUR 24736 EN ISSN 1831-9424 ISSN 1831-9793 Crop Monitoring in Europe MARS BULLETIN Vol.20 No.12 (2012) Issued: 17 December 2012 WINTER CEREAL HARDENING IS PROGRESSING WELL The last
Remote sensing monitoring of land restoration interventions in semi-arid environments
 MultiTemp 2017 Remote sensing monitoring of land restoration interventions in semi-arid environments M. Meroni 1, A. Schucknecht 1, D. Fasbender 1, F. Rembold 1, L. di Lucchio 1,5, F. Fava 2, M. Mauclaire
JRC MARS Bulletin Crop monitoring in Europe January 2016 Weakly hardened winter cereals
 Online version Issued: 25January 2016 r JRC MARS Bulletin Vol. 24 No 1 JRC MARS Bulletin Crop monitoring in Europe January 2016 Weakly hardened winter cereals A first cold spell is likely to have caused
ASSESSMENT OF DIFFERENT WATER STRESS INDICATORS BASED ON EUMETSAT LSA SAF PRODUCTS FOR DROUGHT MONITORING IN EUROPE
 ASSESSMENT OF DIFFERENT WATER STRESS INDICATORS BASED ON EUMETSAT LSA SAF PRODUCTS FOR DROUGHT MONITORING IN EUROPE G. Sepulcre Canto, A. Singleton, J. Vogt European Commission, DG Joint Research Centre,
The contribution of VEGETATION
 The contribution of VEGETATION /SPOT4 products to remote sensing applications for food security, early warning and environmental monitoring in the IGAD sub region G. Pierre, C. Crépeau, P. Bicheron, T.
IGAD Climate Prediction and Applications Centre Monthly Bulletin, August 2014
 IGAD Climate Prediction and Applications Centre Monthly Bulletin, 1. HIGHLIGHTS/ ACTUALITES Rainfall activities were mainly observed over the central parts of the northern sector and western parts of equatorial
IGAD Climate Prediction and and Applications Centre Monthly Bulletin, August May 2015
 . IGAD Climate Prediction and and Applications Centre Monthly Bulletin, August May 2015 For referencing within this bulletin, the Greater Horn of Africa (GHA) is generally subdivided into three sub-regions:
JRC MARS Bulletin Crop monitoring in Europe. January 2017 Minor frost damages so far. Improved hardening of winter cereals in central Europe
 MARS Bulletin Vol. 25 No 1 23 January 2017 1 JRC MARS Bulletin Vol. 25 No 1 Period covered: 1 December 2016-16 January 2017 Issued: 23 January 2017 JRC MARS Bulletin Crop monitoring in Europe January 2017
REMOTELY SENSED INFORMATION FOR CROP MONITORING AND FOOD SECURITY
 LEARNING OBJECTIVES Lesson 4 Methods and Analysis 2: Rainfall and NDVI Seasonal Graphs At the end of the lesson, you will be able to: understand seasonal graphs for rainfall and NDVI; describe the concept
JRC MARS Bulletin global outlook 2017 Crop monitoring European neighbourhood
 MARS Bulletin global outlook 2015-06 7r JRC MARS Bulletin global outlook 2017 Crop monitoring European neighbourhood Russia April 2017 Positive start to the season after winter dormancy The sowing campaign
JRC MARS Bulletin Crop monitoring in Europe. December 2017 Hardening of winter cereals is delayed
 MARS Bulletin Vol. 25 No 12 18 December 2017 1 JRC MARS Bulletin Vol. 25 No 12 Period covered: 1 November-12 December Issued: 18 December 2017 JRC MARS Bulletin Crop monitoring in Europe December 2017
East Africa: The 2016 Season
 HIGHLIGHTS The first growing season of 2016 (March-May, Long Rains in Kenya, Belg in Ethiopia) brought good rainfall across Ethiopia, Eritrea and Somaliland. This was a welcome reprieve for many regions
East Africa The 2015 Season (Long Rains)
") East Africa The 2015 Season (Long Rains) EAST AFRICA SEASONAL ANALYSIS - 2015 HIGHLIGHTS During March 2015, the early stages of the long rains ( Gu ) season, pronounced rainfall deficits were the norm
East Africa The 2015 Season (Long Rains) EAST AFRICA SEASONAL ANALYSIS - 2015 HIGHLIGHTS During March 2015, the early stages of the long rains ( Gu ) season, pronounced rainfall deficits were the norm
LWR Deputy: Electron probe microanalysis of a high burnup (Th,Pu)O2 fuel section
O2 fuel section") LWR Deputy: Electron probe microanalysis of a high burnup (Th,Pu)O2 fuel section Philipp Pöml Stéphane Brémier Jérôme Himbert José Ignacio Tijero Cavia 2015 EUR 27881 This publication is a Technical report
LWR Deputy: Electron probe microanalysis of a high burnup (Th,Pu)O2 fuel section Philipp Pöml Stéphane Brémier Jérôme Himbert José Ignacio Tijero Cavia 2015 EUR 27881 This publication is a Technical report
Land Management and Natural Hazards Unit --- DESERT Action 1. Land Management and Natural Hazards Unit Institute for Environment and Sustainability
 Land Management and Natural Hazards Unit --- DESERT Action 1 Monitoring Drought with Meteorological and Remote Sensing Data A case study on the Horn of Africa Paulo Barbosa and Gustavo Naumann Land Management
September 2016 No. ICPAC/02/293 Bulletin Issue October 2016 Issue Number: ICPAC/02/294 IGAD Climate Prediction and Applications Centre Monthly Bulleti
 Bulletin Issue October 2016 Issue Number: ICPAC/02/294 IGAD Climate Prediction and Applications Centre Monthly Bulletin, For referencing within this bulletin, the Greater Horn of Africa (GHA) is generally
Sudan Seasonal Monitor
 Sudan Seasonal Monitor Sudan Meteorological Authority Federal Ministry of Agriculture and Forestry Issue 5 August 2010 Summary Advanced position of ITCZ during July to most north of Sudan emerged wide
Africa RiskView MONTHLY BULLETIN JANUARY Highlights: Rainfall
 The Africa RiskView Bulletin is a monthly publication by the African Risk Capacity (ARC). ARC is a Specialised Agency of the African Union designed to improve the capacity of AU Member States to manage
new snow load and Paola EUR EN
 Towards new European snow load map Support to policies and standards for sustainable construction CROCE Pietro, FORMICHI Paolo, LANDI Filippo, MERCOGLIANO Paola BUCCHIGNANI Edoardo, DOSIO Alessandro DIMOVA
Directorate E: Sectoral and regional statistics Unit E-4: Regional statistics and geographical information LUCAS 2018.
 EUROPEAN COMMISSION EUROSTAT Directorate E: Sectoral and regional statistics Unit E-4: Regional statistics and geographical information Doc. WG/LCU 52 LUCAS 2018 Eurostat Unit E4 Working Group for Land
Development and test of the high-precision -beam monitor at the ESFRI facility ELI-NP
 Development and test of the high-precision -beam monitor at the ESFRI facility ELI-NP Göök A., Oberstedt S., Geerts W., Hambsch F.-J. Public 2017 EUR 29002 EN This publication is a Technical report by
COPERNICUS SPACE DATA OFFER FOR PUBLIC AUTHORITIES DISTRIBUTED BY ESA
 COPERNICUS SPACE DATA OFFER FOR PUBLIC AUTHORITIES DISTRIBUTED BY ESA The Copernicus Space Component Data Access (CSC-DA) service - financed by the EU and operated by ESA - grants National Public Authorities
IGAD CLIMATE PREDICTION AND APPLICATIONS CENTRE (ICPAC) UPDATE OF THE ICPAC CLIMATE WATCH REF: ICPAC/CW/NO. 24, AUGUST 2011
 UPDATE OF THE ICPAC CLIMATE WATCH REF: ICPAC/CW/NO. 24, AUGUST 2011") IGAD CLIMATE PREDICTION AND APPLICATIONS CENTRE (ICPAC) UPDATE OF THE ICPAC CLIMATE WATCH REF: ICPAC/CW/NO. 24, AUGUST 2011 SUMMARY Drought conditions have persisted over some parts of the Arid and semi-arid
IGAD CLIMATE PREDICTION AND APPLICATIONS CENTRE (ICPAC) UPDATE OF THE ICPAC CLIMATE WATCH REF: ICPAC/CW/NO. 24, AUGUST 2011 SUMMARY Drought conditions have persisted over some parts of the Arid and semi-arid
Preparation and Certification of IRMM-081a and IRMM-086 Spike Isotopic Reference Materials
 Preparation and Certification of IRMM-081a and IRMM-086 Spike Isotopic Reference Materials A. Verbruggen, R. Eykens, F. Kehoe, H. Kühn, S. Richter, Y. Aregbe EUR 22944 EN - 2007 The mission of the IRMM
I C P A C. IGAD Climate Prediction and Applications Centre Monthly Climate Bulletin, Climate Review for March 2018
 No. ICPAC/02/311 Bulletin Issue April 2018 I C P A C IGAD Climate Prediction and Applications Centre Monthly Climate Bulletin, Climate Review for March 2018 1. INTRODUCTION This bulletin reviews the March
JRC MARS Bulletin Crop monitoring in Europe January 2019
 Online version Issued: 21 January 2019 r JRC MARS Bulletin Vol. 27 No 1 JRC MARS Bulletin Crop monitoring in Europe January 2019 Continued mild winter Improved hardening of winter cereals in central and
Crop monitoring in Europe
 Online version Issued: 19 December r JRC MARS Bulletin Vol 24 No 12 JRC MARS Bulletin Crop monitoring in Europe December 2016 Delayed hardening in large parts of Europe Cold air intrusion expected after
I C P A C. IGAD Climate Prediction and Applications Centre Monthly Climate Bulletin, Climate Review for September 2017
 Bulletin Issue October 2017 I C P A C IGAD Climate Prediction and Applications Centre Monthly Climate Bulletin, Climate Review for September 2017 1. INTRODUCTION This bulletin reviews the September 2017
1. INTRODUCTION 2. HIGHLIGHTS
 Bulletin Issue January 2017 Issue Number: ICPAC/03/44 IGAD Climate Prediction and Applications Centre Seasonal Bulletin, Review for October to December (OND) Season 2016 For referencing within this bulletin,
Possible links between a sample of VHR images and LUCAS
 EUROPEAN COMMISSION EUROSTAT Directorate E: Sectoral and regional statistics Unit E-1: Farms, agro-environment and rural development CPSA/LCU/08 Original: EN (available in EN) WORKING PARTY "LAND COVER/USE
Remote Sensing products and global datasets. Joint Research Centre, European Commission
 Remote Sensing products and global datasets Joint Research Centre, European Commission Setting the stage. Needs and requirements for integrated approach(es) for land degradation assessment. in Special
I C P A C. IGAD Climate Prediction and Applications Centre Monthly Climate Bulletin, Climate Review for April 2018
 No. ICPAC/02/312 Bulletin Issue May 2018 I C P A C IGAD Climate Prediction and Applications Centre Monthly Climate Bulletin, Climate Review for April 2018 1. INTRODUCTION This bulletin reviews the April
I C P A C IGAD Climate Prediction & Applications centre
 s` I C P A C IGAD Climate Prediction & Applications centre Bulletin Issue July 2017 Issue Number: ICPAC/02/303 IGAD Climate Prediction and Applications Centre Monthly Climate Bulletin, June 2017 1. INTRODUCTION
Gamma production cross section measurements for 76Ge via (n,n'γγ) at GELINA
 at GELINA") Gamma production cross section measurements for 76Ge via (n,n'γγ) at GELINA C. Rouki, A. R. Domula*, J. C. Drohé, M. Hult, N. Nankov, A. Plompen, M. Stanoiu, K. Zuber* * Institute for Nuclear and Particle
Gamma production cross section measurements for 76Ge via (n,n'γγ) at GELINA C. Rouki, A. R. Domula*, J. C. Drohé, M. Hult, N. Nankov, A. Plompen, M. Stanoiu, K. Zuber* * Institute for Nuclear and Particle
DROUGHT ASSESSMENT USING SATELLITE DERIVED METEOROLOGICAL PARAMETERS AND NDVI IN POTOHAR REGION
 DROUGHT ASSESSMENT USING SATELLITE DERIVED METEOROLOGICAL PARAMETERS AND NDVI IN POTOHAR REGION Researcher: Saad-ul-Haque Supervisor: Dr. Badar Ghauri Department of RS & GISc Institute of Space Technology
East Africa: The 2017 Season. Somalia again on the brink of drought
 East Africa: The 2017 Season Somalia again on the brink of drought Bulletin 2017 4, Eastern Africa November 2017 Contents Highlights HIGHLIGHTS...2 MAY TO JUNE 2017...3 JULY TO SEPTEMBER 2017....4 SHORT
DROUGHT INDICES BEING USED FOR THE GREATER HORN OF AFRICA (GHA)
") DROUGHT INDICES BEING USED FOR THE GREATER HORN OF AFRICA (GHA) Christopher Oludhe IGAD Climate Prediction and Applications Centre (ICPAC) Inter-Regional Workshop on Indices and Early Warning Systems for
DROUGHT INDICES BEING USED FOR THE GREATER HORN OF AFRICA (GHA) Christopher Oludhe IGAD Climate Prediction and Applications Centre (ICPAC) Inter-Regional Workshop on Indices and Early Warning Systems for
West and East Africa The 2014 Rainfall Season
 West and East Africa The 2014 Rainfall Season Highlights SAHEL The pronounced dryness that dominated the earlier stages of the season was alleviated by good rains in August. In September, rainfall was
East Africa The 2015 Season (Long Rains)
") East Africa The 2015 Season (Long Rains) EAST AFRICA SEASONAL ANALYSIS - 2015 HIGHLIGHTS The Long Rains season in the Horn of Africa has come to an end in May. With no further rainfall until the Short
East Africa The 2015 Season (Long Rains) EAST AFRICA SEASONAL ANALYSIS - 2015 HIGHLIGHTS The Long Rains season in the Horn of Africa has come to an end in May. With no further rainfall until the Short
ICPAC. IGAD Climate Prediction and Applications Centre Monthly Bulletin, May 2017
 s` ICPAC Bulletin Issue June 2017 Issue Number: ICPAC/02/302 IGAD Climate Prediction and Applications Centre Monthly Bulletin, May 2017 For referencing within this bulletin, the Greater Horn of Africa
SUDAN METEOROLOGCIAL AUTHORITY
 SUDAN METEOROLOGCIAL AUTHORITY FAO SIFSIA-N Sudan Seasonal Monitor 1 Sudan Seasonal Monitor Sudan Meteorological Authority Federal Ministry of Agriculture and Forestry Issue 2 July 2011 Summary The movement
Land Use / Land Cover Mapping in
 Land Use / Land Cover Mapping in Eastern and Southern African Regions RCMRD Experience by 6/24/2013, Nairobi Kenya Dr. Tesfaye Korme Director of RS, GIS and Mapping, RCMRD I. About RCMRD, Its Vision and
OSS MISSION.
 GEO-CRADLE COORDINATING AND INTEGRATING STATE-OF-THE-ART EARTH OBSERVATION ACTIVITIES IN THE REGION OF NORTH OF AFRICA, MIDDLE EAST, AND BALKANS AND DEVELOPING LINKS WITH GEO RELATED INITIATIVES TOWARD
El Nino 2015 in South Sudan: Impacts and Perspectives. Raul Cumba
 El Nino 2015 in South Sudan: Impacts and Perspectives Raul Cumba El Nino 2015-2016 The El Nino Event of 2015-2016 The 2015/16 El Nino Event Officially declared in March 2015 Now approaching peak intensity
UN COPUOS 52 nd session of the Scientific and Technical Subcommittee. COPERNICUS - an European Achievement. S. Jutz Head, ESA Copernicus Space Office
 UN COPUOS 52 nd session of the Scientific and Technical Subcommittee COPERNICUS - an European Achievement S. Jutz Head, ESA Copernicus Space Office 11 Feb 2015, Vienna 1 2 What is Copernicus? European
Critical aspects in the determination of the surface in contact with foods for migration testing of kitchen utensils
 Critical aspects in the determination of the surface in contact with foods for migration testing of kitchen utensils Results from two investigations by interlaboratory comparisons organised by the European
European Drought Observatory Progress on Drought Monitoring
 European Drought Observatory Progress on Drought Monitoring Alfred de Jager Diego Magni European Commission Joint Research Centre (JRC) Disaster Risk Management Unit Outline 1. Introduction Philosophy
West and East Africa The 2014 Rainfall Season
 West and East Africa The 2014 Rainfall Season HIGHLIGHTS SAHEL The pronounced dryness that dominated the earlier stages of the season until July was alleviated by good August rainfall. In September, rainfall
Applications of multi-spectral satellite data
 Applications of multi-spectral satellite data Jochen Kerkmann EUMETSAT, Satellite Meteorologist, Training Officer Adjusted by E de Coning South African Weather Service Content 1. Why should we use RGBs?
JRC MARS Bulletin global outlook 2017 Crop monitoring European neighbourhood Turkey June 2017
 MARS Bulletin global outlook 2015-06 r JRC MARS Bulletin global outlook 2017 Crop monitoring European neighbourhood Turkey June 2017 Favourable spring conditions, but slight delay Yield forecasts for winter
Status of EUMETSAT Operational Services & EUMETCast Africa Dissemination Baseline Updates
 Status of EUMETSAT Operational Services & EUMETCast Africa Dissemination Baseline Updates Sally Wannop User Relations Manager 1 8th WMO RAIDEG meeting 1-2 November 2017 # 951881 Overview EUMETCast Overview
Sudan Seasonal Monitor 1
 Sudan Seasonal Monitor 1 Sudan Seasonal Monitor Sudan Meteorological Authority Federal Ministry of Agriculture and Forestry Issue 1 June 2011 Early and advanced movement of IFT northward, implied significant
SPI: Standardized Precipitation Index
 PRODUCT FACT SHEET: SPI Africa Version 1 (May. 2013) SPI: Standardized Precipitation Index Type Temporal scale Spatial scale Geo. coverage Precipitation Monthly Data dependent Africa (for a range of accumulation
The indicator can be used for awareness raising, evaluation of occurred droughts, forecasting future drought risks and management purposes.
 INDICATOR FACT SHEET SSPI: Standardized SnowPack Index Indicator definition The availability of water in rivers, lakes and ground is mainly related to precipitation. However, in the cold climate when precipitation
Cliff stabilisation. Adaptation Option Climate-ADAPT
 Cliff stabilisation Adaptation Option Climate-ADAPT Cover design: EEA Cover photo: EEA Layout: EEA Legal notice The contents of this publication do not necessarily reflect the official opinions of the
BOTSWANA AGROMETEOROLOGICAL MONTHLY
 Depart. Of Meteorological Services Agro-met Office P.O. Box 10100, Gaborone Tel: 3612200 Fax: 3956282/140 Corner Maaloso- Metsimothaba Road Gaborone Village Highlights: Very wet to extremely wet conditions
JRC MARS Bulletin Crop monitoring in Europe. February 2018 Frost tolerance remains weak. Winter conditions so far present no threat to winter crops
 JRC MARS Bulletin Vol. 26 No 2 Period covered: 1 January 2018-13 February 2018 Issued: 19 February 2018 JRC MARS Bulletin Crop monitoring in Europe February 2018 Frost tolerance remains weak Winter conditions
Weather and climate outlooks for crop estimates
 Weather and climate outlooks for crop estimates CELC meeting 2016-04-21 ARC ISCW Observed weather data Modeled weather data Short-range forecasts Seasonal forecasts Climate change scenario data Introduction
Status of implementation of the INSPIRE Directive 2016 Country Fiches. COUNTRY FICHE Malta
 Status of implementation of the INSPIRE Directive 2016 Country Fiches COUNTRY FICHE Malta Introduction... 1 1. State of Play... 2 1.1 Coordination... 2 1.2 Functioning and coordination of the infrastructure...
EUMETSAT Satellite Status
 EUMETSAT Satellite Status Dr. K. Dieter Klaes EUMETSAT 1 ET-SAT Meeting 4-6 April 2017, WMO, Geneva, Switzerland EUMETSAT is an intergovernmental organisation with 30 Member States and 1 Cooperating State
Status of implementation of the INSPIRE Directive 2016 Country Fiches. COUNTRY FICHE Croatia
 Status of implementation of the INSPIRE Directive 2016 Country Fiches COUNTRY FICHE Croatia Introduction... 1 1. State of Play... 2 1.1 Coordination... 2 1.2 Functioning and coordination of the infrastructure...
Intraseasonal Characteristics of Rainfall for Eastern Africa Community (EAC) Hotspots: Onset and Cessation dates. In support of;
 Hotspots: Onset and Cessation dates. In support of;") Intraseasonal Characteristics of Rainfall for Eastern Africa Community (EAC) Hotspots: Onset and Cessation dates In support of; Planning for Resilience in East Africa through Policy, Adaptation, Research
Intraseasonal Characteristics of Rainfall for Eastern Africa Community (EAC) Hotspots: Onset and Cessation dates In support of; Planning for Resilience in East Africa through Policy, Adaptation, Research
Crop monitoring in Europe
 r Online version Issued: 15 December 2014 Crop monitoring in Europe MARS Bulletin Vol. 22 No. 12 (2014) Weakly hardened crops in western and central Europe During the period of review, the western half
Geographical knowledge and understanding scope and sequence: Foundation to Year 10
 Geographical knowledge and understanding scope and sequence: Foundation to Year 10 Foundation Year 1 Year 2 Year 3 Year 4 Year 5 Year 6 Year level focus People live in places Places have distinctive features
EO4SEE - THE PATHFINDER OF OPERATIONAL SATELLITE MONITORING FOR THE REGION OF THE BLACK SEA AND CENTRAL EUROPE
 EO4SEE: Pathfinder assessment for regional high volume data access, processing and information service delivery platforms - South East Region EO4SEE - THE PATHFINDER OF OPERATIONAL SATELLITE MONITORING
Compact guides GISCO. Geographic information system of the Commission
 Compact guides GISCO Geographic information system of the Commission What is GISCO? GISCO, the Geographic Information System of the COmmission, is a permanent service of Eurostat that fulfils the requirements
Crop monitoring in Europe
 r Online version Issued: 14 December 2015 Crop monitoring in Europe MARS Bulletin Vol. 23 No. 12 (2015) Mild weather favoured crop establishment but increased risk of frost damage Temperatures since the
Time Series Analysis with SAR & Optical Satellite Data
 Time Series Analysis with SAR & Optical Satellite Data Thomas Bahr ESRI European User Conference Thursday October 2015 harris.com Motivation Changes in land surface characteristics mirror a multitude of
The Soil Atlas of the Northern Circumpolar Region
 Conference Soil, Climate Change and Biodiversity Where do we stand? Brussels, Thursday 23rd and Friday 24th September 2010 1 The Soil Atlas of the Northern Circumpolar Region Luca Montanarella European
U s i n g t h e E S A / E U M E T C A S T N a v i g a t o r s
 U s i n g t h e E S A / E U M E T C A S T N a v i g a t o r s Copernicus User Uptake Information Sessions Copernicus EU Copernicus EU Copernicus EU www.copernicus.eu I N T R O D U C T I O N O F U S E C
Measures Also Significant Factors of Flood Disaster Reduction
 Non-Structual Measures Also Significant Factors of Flood Disaster Reduction Babiaková Gabriela, Leškov ková Danica Slovak Hydrometeorological Institute, Bratislava Hydrological Forecasts and Warning Department
Preparation and Certification of IRMM1027k, Large-Sized Dried (LSD) spike
 spike") Preparation and Certification of IRMM1027k, Large-Sized Dried (LSD) spike A. Verbruggen, J Bauwens, R. Eykens, F. Kehoe, H. Kühn, U. Jacobsson, S. Richter, Y. Aregbe EUR 23539 EN - 2008 The mission of
Preparation and Certification of IRMM1027k, Large-Sized Dried (LSD) spike A. Verbruggen, J Bauwens, R. Eykens, F. Kehoe, H. Kühn, U. Jacobsson, S. Richter, Y. Aregbe EUR 23539 EN - 2008 The mission of
Analysis of Rainfall and Temperature Variability to Guide Sorghum (Sorghum Bicolar) Production in Maitsebri District, Northwestern Tigray, Ethiopia
 Production in Maitsebri District, Northwestern Tigray, Ethiopia") International Journal of Research in Environmental Science Volume 4, Issue 4, 2018, PP 27-32 ISSN No. (Online) 2454-9444 DOI: http://dx.doi.org/10.20431/2454-9444.0404004 www.arcjournals.org Analysis of
International Journal of Research in Environmental Science Volume 4, Issue 4, 2018, PP 27-32 ISSN No. (Online) 2454-9444 DOI: http://dx.doi.org/10.20431/2454-9444.0404004 www.arcjournals.org Analysis of
WATER BODIES V2 ALGORITHM
 26/03/2015 WATER BODIES V2 ALGORITHM USING PROBA-V 10 day mean composites multispectral data Water Bodies V2 PROBA-V µ-satellite, gap filler SPOT Sentinel PROBA-V S1-TOC synthesis products - full daily
JRC MARS Bulletin Crop monitoring in Europe December 2018
 Online version Issued: 17 December r JRC MARS Bulletin Vol 26 No 12 JRC MARS Bulletin Crop monitoring in Europe December 2018 Mild start of winter Colder conditions forecast expected to improve frost tolerance
ASCAT - Metop A developments, Metop B preparations & EPS-SG
 ASCAT - Metop A developments, Metop B preparations & EPS-SG Hans Bonekamp, Craig Anderson, Julia Figa & Julian Wilson Slide: 1 ASCAT Metop A - overview Instrument operating nominally (minor incident in
USGS/EROS Accomplishments and Year 3 Plans. Enhancement of the U.S. Drought Monit Through the Integration of NASA Vegetation Index Imagery
 USGS/EROS Accomplishments and Year 3 Plans Enhancement of the U.S. Drought Monit Through the Integration of NASA Vegetation Index Imagery Jesslyn Brown Team Meeting, Austin, TX, 10/6/09 U.S. Department
Comparison of MSG-SEVIRI and SPOT-VEGETATION data for vegetation monitoring over Africa
 Comparison of MSG-SEVIRI and SPOT-VEGETATION data for vegetation monitoring over Africa Bernard LACAZE CNRS UMR 8586 PRODIG Pôle Image et Campus Spatial, Université Paris Diderot Paris 7 Objectives Comparison
Status of implementation of the INSPIRE Directive 2016 Country Fiches. COUNTRY FICHE Netherlands
 Status of implementation of the INSPIRE Directive 2016 Country Fiches COUNTRY FICHE Netherlands Introduction... 1 1. State of Play... 2 1.1 Coordination... 2 1.2 Functioning and coordination of the infrastructure...
Spatial Drought Assessment Using Remote Sensing and GIS techniques in Northwest region of Liaoning, China
 Spatial Drought Assessment Using Remote Sensing and GIS techniques in Northwest region of Liaoning, China FUJUN SUN, MENG-LUNG LIN, CHENG-HWANG PERNG, QIUBING WANG, YI-CHIANG SHIU & CHIUNG-HSU LIU Department
Crisis Management and Natural Disasters Overview of JRC operational or pre-operational activities A. Annunziato, D. Al-Khudhairy
 Papagayo, Costarica 3-4 November 2009 Security Science and The Americas 1 Joint Research Centre (JRC) Crisis Management and Natural Disasters Overview of JRC operational or pre-operational activities A.
C O P E R N I C U S F O R G I P R O F E S S I O N A L S
 C O P E R N I C U S F O R G I P R O F E S S I O N A L S Downstream Applications MALTA 2017-06-26 Pascal Lory, EUROGI EU EU EU www.copernicus.eu S c o p e Identifying urban housing density: Stella Ofori-Ampofo,
Rating of soil heterogeneity using by satellite images
 Rating of soil heterogeneity using by satellite images JAROSLAV NOVAK, VOJTECH LUKAS, JAN KREN Department of Agrosystems and Bioclimatology Mendel University in Brno Zemedelska 1, 613 00 Brno CZECH REPUBLIC
Bio-optical Algorithms for European Seas
 Bio-optical Algorithms for European Seas Performance and Applicability of Neural-Net Inversion Schemes Davide D Alimonte 1, Giuseppe Zibordi 2, Jean-François Berthon 2, Elisabetta Canuti 2 and Tamito Kajiyama
Commercialisation. Lessons learned from Dutch weather market
 Commercialisation Lessons learned from Dutch weather market Where information comes together weather traffic public transport Weather, traffic and public transport. Daily actual information that influences
El Nino: Outlook VAM-WFP HQ September 2018
 El Nino: Outlook 2018 VAM-WFP HQ September 2018 El Nino Outlook September 2018 2015-16 El Nino Peak Possible evolution of an El Nino indicator (Pacific sea surface temperature anomaly) generated by a diverse
An Initial Estimate of the Uncertainty in UK Predicted Climate Change Resulting from RCM Formulation
 An Initial Estimate of the Uncertainty in UK Predicted Climate Change Resulting from RCM Formulation Hadley Centre technical note 49 David P. Rowell 6 May2004 An Initial Estimate of the Uncertainty in
Certification Report. REIMEP 18 Inter-Laboratory Comparison for the Measurement of Uranium Isotopic Ratios in Nitric Acid Solution
 Certification Report REIMEP 18 Inter-Laboratory Comparison for the Measurement of Uranium Isotopic Ratios in Nitric Acid Solution S. Richter, A. Alonso, J. Truyens, H. Kühn, A. Verbruggen, R. Wellum Institute
Status of implementation of the INSPIRE Directive 2016 Country Fiches. COUNTRY FICHE Czech Republic
 Status of implementation of the INSPIRE Directive 2016 Country Fiches COUNTRY FICHE Czech Republic Introduction... 1 1. State of Play... 2 1.1 Coordination... 2 1.2 Functioning and coordination of the
West Africa: The 2015 Season
 HIGHLIGHTS The West Africa 2015 growing season developed under an evolving El Nino event that will peak in late 2015. This region tends to have seasonal rainfall deficits in the more marginal areas during
SWIM and Horizon 2020 Support Mechanism
 SWIM and Horizon 2020 Support Mechanism Working for a Sustainable Mediterranean, Caring for our Future REG-7: Training Session #1: Drought Hazard Monitoring Example from real data from the Republic of