Modelling temporal structure (in noise and signal)
|
|
|
- Ashlynn Patterson
- 5 years ago
- Views:
Transcription
1 Modelling temporal structure (in noise and signal) Mark Woolrich, Christian Beckmann*, Salima Makni & Steve Smith FMRIB, Oxford *Imperial/FMRIB temporal noise: modelling temporal autocorrelation temporal signal: FLOBS HRF optimal basis functions temporal signal: HRF deconvolution spatiotemporally structured signal / noise: ICA functional grand-plan : integrating ICA+GLM
2 Non-independent/Autocorrelation/ Coloured FMRI noise power Coloured / autocorrelated White / independent frequency Uncorrected, this causes: Even after high-pass filtering, FMRI noise has extra power at low frequencies (positive autocorrelation or temporal smoothness) - biased stats ( increased false positives) - decreased sensitivity
3 FMRIB s Improved Linear Modelling (FILM) FILM is used to fit the GLM voxel-wise in FEAT Deals with the autocorrelation locally and uses prewhitening FILM estimates autocorrelation by looking at the residuals of the GLM fit: Y = Xβ + ɛ residuals = Y X β
4 FMRIB s Improved Linear Modelling (FILM) Power vs. freq in the residuals 1) Fit the GLM and estimate the autocorrelation on the residuals power frequency
5 FMRIB s Improved Linear Modelling (FILM) Power vs. freq in the residuals 1) Fit the GLM and estimate the autocorrelation on the residuals power frequency power 2) Spatially and spectrally smooth the data frequency
6 FMRIB s Improved Linear Modelling (FILM) Power vs. freq in the residuals 1) Fit the GLM and estimate the autocorrelation on the residuals power frequency power 2) Spatially and spectrally smooth the data power frequency 3) Construct prewhitening filter to undo autocorrelation frequency
7 FMRIB s Improved Linear Modelling (FILM) 1) Fit the GLM and estimate the autocorrelation on the residuals power frequency power 2) Spatially and spectrally smooth the data power frequency 3) Construct prewhitening filter to undo autocorrelation frequency 4) Apply filter to data and design matrix and refit power frequency
8 FMRIB s Improved Linear Modelling (FILM)

 describes the BOLD")
9 Dealing with Variations in Haemodynamics The haemodynamic responses vary between subjects and areas of the brain How do we allow haemodynamics to be flexible but remain plausible? Reminder: the haemodynamic response function (HRF) describes the BOLD response to a short burst of neural activity
 the EV temporal derivative Including the temporal derivative of an EV")

10 Temporal Derivatives A very simple approach to providing HRF variability is to include (alongside each EV) the EV temporal derivative Including the temporal derivative of an EV allows for a small shift in time of that EV This is based upon a first order Taylor series expansion EV Temporal derivative data model fit without derivative model fit with derivative
11 Using Parameterised HRFs We need to allow flexibility in the shape of the fitted HRF Parameterise HRF shape and fit shape parameters to the data Needs nonlinear fitting - HARD
12 Using Basis Sets We need to allow flexibility in the shape of the fitted HRF Parameterise HRF shape and fit shape parameters to the data We can use linear basis sets to span the space of expected HRF shapes Needs nonlinear fitting - HARD Linear fitting (use GLM) - EASY
13 How do HRF Basis Sets Work? Different linear combinations of the basis functions can be used to create different HRF shapes basis fn 1 basis fn 2 basis fn 3 HRF 1.0* + 0.3* * =
14 How do HRF Basis Sets Work? Different linear combinations of the basis functions can be used to create different HRF shapes basis fn 1 basis fn 2 basis fn 3 HRF 1.0* + 0.3* * = 0.7* * + 0.5* =
15 FMRIB s Linear Optimal Basis Set (FLOBS) Using FLOBS we can: Specify a priori expectations of parameterised HRF shapes Generate an appropriate basis set
")

16 Generating FLOBs (1) Take samples of the HRF
17 Generating FLOBs (2) Perform SVD (3) Select the top eigenvectors as the optimal basis set Canonical HRF
18 Generating FLOBs (2) Perform SVD (3) Select the top eigenvectors as the optimal basis set Canonical HRF temporal derivative

19 Generating FLOBs (2) Perform SVD (3) Select the top eigenvectors as the optimal basis set dispersion derivative Canonical HRF temporal derivative The resulting basis set can then be used in FEAT
20 Bayesian Inference Priors on HRF parameters HRF Joint posterior distribution p(a, c, m 1, m 2... Y ) BOLD FMRI data Neural Activity *A + Gaussian noise Woolrich et al., TMI, 2004
21 Bayesian Inference Priors on HRF parameters HRF Marginal posterior distribution p(a Y ) = p(a, c, m 1, m 2... Y )dcdm 1 dm 2... BOLD FMRI data Neural Activity *A + Gaussian noise Infer using MCMC Woolrich et al., TMI, 2004
22 Temporal deconvolution of FMRI timecourses Inputs are raw paradigm (stimulation and modulation ) timecourses Model based on Bilinear Dynamical Systems (Penny 2005), where modulatory input changes neural response to stimulation What s new: estimate HRF from data full Bayesian inference on model, using VB Makni, NeuroImage 2008
23 CORRECTED PROOF
24 To do the Bayes, either: MCMC (computer takes ages) Variational Bayes (maths takes ages) CORRECTED PROOF
25 To do the Bayes, either: MCMC (computer takes ages) Variational Bayes (maths takes ages) CORRECTED PROOF
26 Model-free Functional Data Analysis MELODIC Multivariate Exploratory Linear Optimised Decomposition into Independent Components decomposes data into a set of statistically independent spatial component maps and associated time courses can perform multi-subject/ multi-session analysis fully automated (incl. estimation of the number of components) inference on IC maps using alternative hypothesis testing
27 Model-free Functional Data Analysis MELODIC Multivariate Exploratory Linear Optimised Decomposition into Independent Components decomposes data into a set of statistically independent spatial component maps and associated time courses can perform multi-subject/ multi-session analysis fully automated (incl. estimation of the number of components) inference on IC maps using alternative hypothesis testing
28 EDA techniques for FMRI are mostly multivariate often provide a multivariate linear decomposition: space # maps space time Scan #k FMRI data = time # maps spatial maps Data is represented as a 2D matrix and decomposed into factor matrices (or modes)
29 Model Order Selection can estimate the model order from the Eigenspectrum of the data covariance matrix (corrected using Wishart random matrix theory) approximate the Bayesian evidence for the model order for a probabilistic PCA model (PPCA) AR 16 noise + signal Figure Laplace approximation 3: Bayesian BIC AIC Minka, TR 514 MIT Media Lab 2000
30 Probabilistic ICA GLM analysis standard ICA (unconstrained)
31 Probabilistic ICA GLM analysis probabilistic ICA

32 Probabilistic ICA GLM analysis probabilistic ICA designed to address the overfitting problem : tries to avoid generation of spurious results high spatial sensitivity and specificity
33 Applications EDA techniques can be useful to investigate the BOLD response estimate artefacts in the data find areas of activation which respond in a nonstandard way analyse data for which no model of the BOLD response is available
34 Investigate BOLD response estimated signal time course standard hrf model
35 Applications EDA techniques can be useful to investigate the BOLD response estimate artefacts in the data find areas of activation which respond in a nonstandard way analyse data for which no model of the BOLD response is available
36 slice drop-outs
37 gradient instability
38 EPI ghost
39 high-frequency noise
40 head motion
41 field inhomogeneity
42 eye-related artefacts
43 eye-related artefacts
44 eye-related artefacts Wrap around
 In either case lead to suboptimal estimates and wrong inference!")
45 Structured Noise and the GLM structured noise appears: in the GLM residuals and inflate variance estimates (more false negatives) in the parameter estimates (more false positives and/or false negatives) In either case lead to suboptimal estimates and wrong inference!

46 Structured noise and GLM Z-stats bias Correlations of the noise time courses with typical FMRI regressors can cause a shift in the histogram of the Z-statistics Thresholded maps will have wrong false-positive rate
47 Denoising FMRI before denoising 500 PE raw 300 Z raw Example: left vs right hand finger tapping !1000! PE clean RIGHT 0!10! Z clean Johansen-Berg et al. PNAS !1000! after denoising 0!10!
48 Denoising FMRI before denoising 600 PE raw 350 Z raw Example: left vs right hand finger tapping !1000! PE clean LEFT 0!10! Z clean Johansen-Berg et al. PNAS !1000! after denoising 0!10!

49 Denoising FMRI before denoising Example: left vs right hand finger tapping LEFT - RIGHT contrast Johansen-Berg et al. PNAS 2002 after denoising

50 Apparent variability McGonigle et al.: 33 Sessions under motor paradigm de-noising data by regressing out noise: reduced apparent session variability
51 Applications EDA techniques can be useful to investigate the BOLD response estimate artefacts in the data find areas of activation which respond in a nonstandard way analyse data for which no model of the BOLD response is available

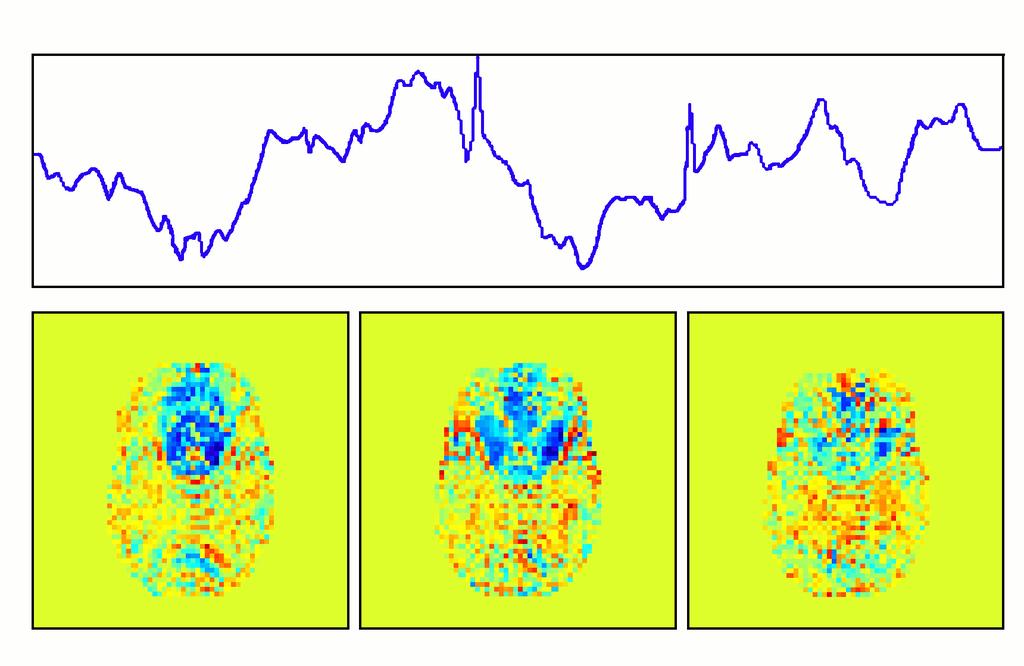
52 PICA on resting data perform ICA on null data and compare spatial maps between subjects/ scans ICA maps depict spatially localised and temporally coherent signal changes Example: ICA maps - 1 subject at 3 different sessions
53 Spatial characteristics (a) x=17 y=-73 z=-12 (b) x=-13 y=-61 z=6 (a) x=17 y=-73 z=-12 (b) x=-13 y=-61 z=6 R (c) L Medial visual cortex y=-17 x=3 x=-4 y=-29 x=45 R (d) z=33 (f) y=-29 x=1 x=5 (f) L (h) z=27 L Sensori-motor system y=6 x=-45 z=27 L R z=47 z=51 y=6 x=5 L y=-42 y=-21 R z=33 z=51 L R Auditory system x=-4 Lateral Visual Cortex L R (g) z=1.5 L y=-21 x=1 L R (e) (d) L R (e) z=1.5 y=-17 x=3 R (c) R y=-42 z=47
54 Spatial characteristics (e) x=-4 y=-29 z=33 (f) x=5 y=6 z=27 R L R L Visuospatial system Executive control (g) x=45 y=-42 z=47 (h) x=-45 y=-42 z=47 R L Visual Stream R L

55 Temporal deconvolution of ICA timecourses What are the task-related components? Use explicit time series model on the ICgenerated temporal modes (using BDS)
56 Example: BDS/ICA integration (b) (c) Estimate the mean of the posterior distribution over the neuronal response Estimate the mean of the Gaussian posterior distribution of the HRF 1 (d) 1.5 (e) 0.5 0! posterior probability of neuronal response > 0 for the IC Time (s) Assess the total model fit
57 Integrating GLM and ICA for FMRI analysis GLM β i = + Noise Data Predicted response Estimated effect


58 Integrating GLM and ICA for FMRI analysis GLM β i = + Noise Data Predicted response Estimated effect + clear conclusions on a particular question - results depend on the model
59 Integrating GLM and ICA for FMRI analysis PICA space # maps space time Scan #k FMRI data = time # maps spatial maps + Noise Data Estimated artefact time courses Estimated spatially independent maps
60 Integrating GLM and ICA for FMRI analysis PICA space # maps space time Scan #k FMRI data = time # maps spatial maps + Noise Data Estimated artefact time courses Estimated spatially independent maps + data driven and multivariate approach - no knowledge about the fmri paradigm is used - can be hard to interpret activation results
61 Integrating GLM and ICA for FMRI analysis GLM + ICA space # maps space time Scan #k FMRI data = time # maps spatial maps + Noise Data Predicted response Estimated artefact time courses Estimated spatially independent maps
62 Integrating GLM and ICA for FMRI analysis GLM + ICA space # maps space time Scan #k FMRI data = time # maps spatial maps + Noise Data Predicted response Estimated artefact time courses Estimated spatially independent maps Stimulus model-based hypothesis testing Adaptive model-free artefact modelling - e.g. stimulus correlated motion, physiological noise, networks of spontaneous neuronal activity


63 Modelled ICs Estimated HRFs 10 auditory stimulus visual stimulus Time (s) Spatial map Time course Example model free IC # maps space time # maps spatial maps Spatial map Time course
Model-free Functional Data Analysis
 Model-free Functional Data Analysis MELODIC Multivariate Exploratory Linear Optimised Decomposition into Independent Components decomposes data into a set of statistically independent spatial component
Statistical Analysis of fmrl Data
 Statistical Analysis of fmrl Data F. Gregory Ashby The MIT Press Cambridge, Massachusetts London, England Preface xi Acronyms xv 1 Introduction 1 What Is fmri? 2 The Scanning Session 4 Experimental Design
Statistical Analysis Aspects of Resting State Functional Connectivity
 Statistical Analysis Aspects of Resting State Functional Connectivity Biswal s result (1995) Correlations between RS Fluctuations of left and right motor areas Why studying resting state? Human Brain =
The General Linear Model (GLM)
") he General Linear Model (GLM) Klaas Enno Stephan ranslational Neuromodeling Unit (NU) Institute for Biomedical Engineering University of Zurich & EH Zurich Wellcome rust Centre for Neuroimaging Institute
he General Linear Model (GLM) Klaas Enno Stephan ranslational Neuromodeling Unit (NU) Institute for Biomedical Engineering University of Zurich & EH Zurich Wellcome rust Centre for Neuroimaging Institute
Modelling with Independent Components
 Oxford Centre for Functional Magnetic Resonance Imaging of the Brain (FMRIB) Department of Clinical Neurology University of Oxford Christian F Beckmann beckmann@fmriboxacuk IPAM Mathematics in Brain Imaging
Extracting fmri features
 Extracting fmri features PRoNTo course May 2018 Christophe Phillips, GIGA Institute, ULiège, Belgium c.phillips@uliege.be - http://www.giga.ulg.ac.be Overview Introduction Brain decoding problem Subject
Neuroimaging for Machine Learners Validation and inference
 GIGA in silico medicine, ULg, Belgium http://www.giga.ulg.ac.be Neuroimaging for Machine Learners Validation and inference Christophe Phillips, Ir. PhD. PRoNTo course June 2017 Univariate analysis: Introduction:
Data Analysis I: Single Subject
 Data Analysis I: Single Subject ON OFF he General Linear Model (GLM) y= X fmri Signal = Design Matrix our data = what we CAN explain x β x Betas + + how much x of it we CAN + explain ε Residuals what
Dynamic Causal Modelling for fmri
 Dynamic Causal Modelling for fmri André Marreiros Friday 22 nd Oct. 2 SPM fmri course Wellcome Trust Centre for Neuroimaging London Overview Brain connectivity: types & definitions Anatomical connectivity
Effective Connectivity & Dynamic Causal Modelling
 Effective Connectivity & Dynamic Causal Modelling Hanneke den Ouden Donders Centre for Cognitive Neuroimaging Radboud University Nijmegen Advanced SPM course Zurich, Februari 13-14, 2014 Functional Specialisation
The General Linear Model. Guillaume Flandin Wellcome Trust Centre for Neuroimaging University College London
 The General Linear Model Guillaume Flandin Wellcome Trust Centre for Neuroimaging University College London SPM Course Lausanne, April 2012 Image time-series Spatial filter Design matrix Statistical Parametric
Functional Connectivity and Network Methods
 18/Sep/2013" Functional Connectivity and Network Methods with functional magnetic resonance imaging" Enrico Glerean (MSc), Brain & Mind Lab, BECS, Aalto University" www.glerean.com @eglerean becs.aalto.fi/bml
Experimental design of fmri studies
 Experimental design of fmri studies Zurich SPM Course 2016 Sandra Iglesias Translational Neuromodeling Unit (TNU) Institute for Biomedical Engineering (IBT) University and ETH Zürich With many thanks for
Experimental design of fmri studies
 Experimental design of fmri studies Sandra Iglesias With many thanks for slides & images to: Klaas Enno Stephan, FIL Methods group, Christian Ruff SPM Course 2015 Overview of SPM Image time-series Kernel
Experimental design of fmri studies & Resting-State fmri
 Methods & Models for fmri Analysis 2016 Experimental design of fmri studies & Resting-State fmri Sandra Iglesias With many thanks for slides & images to: Klaas Enno Stephan, FIL Methods group, Christian
New Machine Learning Methods for Neuroimaging
 New Machine Learning Methods for Neuroimaging Gatsby Computational Neuroscience Unit University College London, UK Dept of Computer Science University of Helsinki, Finland Outline Resting-state networks
Mixed effects and Group Modeling for fmri data
 Mixed effects and Group Modeling for fmri data Thomas Nichols, Ph.D. Department of Statistics Warwick Manufacturing Group University of Warwick Warwick fmri Reading Group May 19, 2010 1 Outline Mixed effects
Overview of SPM. Overview. Making the group inferences we want. Non-sphericity Beyond Ordinary Least Squares. Model estimation A word on power
 Group Inference, Non-sphericity & Covariance Components in SPM Alexa Morcom Edinburgh SPM course, April 011 Centre for Cognitive & Neural Systems/ Department of Psychology University of Edinburgh Overview
Contents. Introduction The General Linear Model. General Linear Linear Model Model. The General Linear Model, Part I. «Take home» message
 DISCOS SPM course, CRC, Liège, 2009 Contents The General Linear Model, Part I Introduction The General Linear Model Data & model Design matrix Parameter estimates & interpretation Simple contrast «Take
Experimental design of fmri studies
 Methods & Models for fmri Analysis 2017 Experimental design of fmri studies Sara Tomiello With many thanks for slides & images to: Sandra Iglesias, Klaas Enno Stephan, FIL Methods group, Christian Ruff
Experimental design of fmri studies
 Experimental design of fmri studies Sandra Iglesias Translational Neuromodeling Unit University of Zurich & ETH Zurich With many thanks for slides & images to: Klaas Enno Stephan, FIL Methods group, Christian
Bayesian inference J. Daunizeau
 Bayesian inference J. Daunizeau Brain and Spine Institute, Paris, France Wellcome Trust Centre for Neuroimaging, London, UK Overview of the talk 1 Probabilistic modelling and representation of uncertainty
Event-related fmri. Christian Ruff. Laboratory for Social and Neural Systems Research Department of Economics University of Zurich
 Event-related fmri Christian Ruff Laboratory for Social and Neural Systems Research Department of Economics University of Zurich Institute of Neurology University College London With thanks to the FIL
Piotr Majer Risk Patterns and Correlated Brain Activities
 Alena My²i ková Piotr Majer Song Song Alena Myšičková Peter N. C. Mohr Peter N. C. Mohr Wolfgang K. Härdle Song Song Hauke R. Heekeren Wolfgang K. Härdle Hauke R. Heekeren C.A.S.E. Centre C.A.S.E. for
Model Comparison. Course on Bayesian Inference, WTCN, UCL, February Model Comparison. Bayes rule for models. Linear Models. AIC and BIC.
 Course on Bayesian Inference, WTCN, UCL, February 2013 A prior distribution over model space p(m) (or hypothesis space ) can be updated to a posterior distribution after observing data y. This is implemented
Signal Processing for Functional Brain Imaging: General Linear Model (2)
") Signal Processing for Functional Brain Imaging: General Linear Model (2) Maria Giulia Preti, Dimitri Van De Ville Medical Image Processing Lab, EPFL/UniGE http://miplab.epfl.ch/teaching/micro-513/ March
Signal Processing for Functional Brain Imaging: General Linear Model (2) Maria Giulia Preti, Dimitri Van De Ville Medical Image Processing Lab, EPFL/UniGE http://miplab.epfl.ch/teaching/micro-513/ March
Bayesian Analysis. Bayesian Analysis: Bayesian methods concern one s belief about θ. [Current Belief (Posterior)] (Prior Belief) x (Data) Outline
![Bayesian Analysis. Bayesian Analysis: Bayesian methods concern one s belief about θ. [Current Belief (Posterior)] (Prior Belief) x (Data) Outline](/thumbs/87/97378301.jpg "Bayesian Analysis. Bayesian Analysis: Bayesian methods concern one s belief about θ. [Current Belief (Posterior)] (Prior Belief) x (Data) Outline") Bayesian Analysis DuBois Bowman, Ph.D. Gordana Derado, M. S. Shuo Chen, M. S. Department of Biostatistics and Bioinformatics Center for Biomedical Imaging Statistics Emory University Outline I. Introduction
Bayesian Analysis DuBois Bowman, Ph.D. Gordana Derado, M. S. Shuo Chen, M. S. Department of Biostatistics and Bioinformatics Center for Biomedical Imaging Statistics Emory University Outline I. Introduction
Bayesian inference J. Daunizeau
 Bayesian inference J. Daunizeau Brain and Spine Institute, Paris, France Wellcome Trust Centre for Neuroimaging, London, UK Overview of the talk 1 Probabilistic modelling and representation of uncertainty
The General Linear Model (GLM)
") The General Linear Model (GLM) Dr. Frederike Petzschner Translational Neuromodeling Unit (TNU) Institute for Biomedical Engineering, University of Zurich & ETH Zurich With many thanks for slides & images
The General Linear Model (GLM) Dr. Frederike Petzschner Translational Neuromodeling Unit (TNU) Institute for Biomedical Engineering, University of Zurich & ETH Zurich With many thanks for slides & images
Dynamic Causal Models
 Dynamic Causal Models V1 SPC Will Penny V1 SPC V5 V5 Olivier David, Karl Friston, Lee Harrison, Andrea Mechelli, Klaas Stephan Wellcome Department of Imaging Neuroscience, ION, UCL, UK. Mathematics in
First Technical Course, European Centre for Soft Computing, Mieres, Spain. 4th July 2011
 First Technical Course, European Centre for Soft Computing, Mieres, Spain. 4th July 2011 Linear Given probabilities p(a), p(b), and the joint probability p(a, B), we can write the conditional probabilities
Computing FMRI Activations: Coefficients and t-statistics by Detrending and Multiple Regression
 Computing FMRI Activations: Coefficients and t-statistics by Detrending and Multiple Regression Daniel B. Rowe and Steven W. Morgan Division of Biostatistics Medical College of Wisconsin Technical Report
A MULTIVARIATE MODEL FOR COMPARISON OF TWO DATASETS AND ITS APPLICATION TO FMRI ANALYSIS
 A MULTIVARIATE MODEL FOR COMPARISON OF TWO DATASETS AND ITS APPLICATION TO FMRI ANALYSIS Yi-Ou Li and Tülay Adalı University of Maryland Baltimore County Baltimore, MD Vince D. Calhoun The MIND Institute
Multilevel linear modelling for FMRI group analysis using Bayesian inference
 www.elsevier.com/locate/ynimg NeuroImage 1 (004) 173 1747 Multilevel linear modelling for FMRI group analysis using Bayesian inference Mark W. Woolrich, a,b, *,1 Timothy E.J. Behrens, a,b,1 Christian F.
Group analysis. Jean Daunizeau Wellcome Trust Centre for Neuroimaging University College London. SPM Course Edinburgh, April 2010
 Group analysis Jean Daunizeau Wellcome Trust Centre for Neuroimaging University College London SPM Course Edinburgh, April 2010 Image time-series Spatial filter Design matrix Statistical Parametric Map
Statistical models for neural encoding
 Statistical models for neural encoding Part 1: discrete-time models Liam Paninski Gatsby Computational Neuroscience Unit University College London http://www.gatsby.ucl.ac.uk/ liam liam@gatsby.ucl.ac.uk
Group Analysis. Lexicon. Hierarchical models Mixed effect models Random effect (RFX) models Components of variance
 models Components of variance") Group Analysis J. Daunizeau Institute of Empirical Research in Economics, Zurich, Switzerland Brain and Spine Institute, Paris, France SPM Course Edinburgh, April 2011 Image time-series Spatial filter
Group Analysis J. Daunizeau Institute of Empirical Research in Economics, Zurich, Switzerland Brain and Spine Institute, Paris, France SPM Course Edinburgh, April 2011 Image time-series Spatial filter
Stochastic Dynamic Causal Modelling for resting-state fmri
 Stochastic Dynamic Causal Modelling for resting-state fmri Ged Ridgway, FIL, Wellcome Trust Centre for Neuroimaging, UCL Institute of Neurology, London Overview Connectivity in the brain Introduction to
What is NIRS? First-Level Statistical Models 5/18/18
 First-Level Statistical Models Theodore Huppert, PhD (huppertt@upmc.edu) University of Pittsburgh Departments of Radiology and Bioengineering What is NIRS? Light Intensity SO 2 and Heart Rate 2 1 5/18/18
MIXED EFFECTS MODELS FOR TIME SERIES
 Outline MIXED EFFECTS MODELS FOR TIME SERIES Cristina Gorrostieta Hakmook Kang Hernando Ombao Brown University Biostatistics Section February 16, 2011 Outline OUTLINE OF TALK 1 SCIENTIFIC MOTIVATION 2
Jean-Baptiste Poline
 Edinburgh course Avril 2010 Linear Models Contrasts Variance components Jean-Baptiste Poline Neurospin, I2BM, CEA Saclay, France Credits: Will Penny, G. Flandin, SPM course authors Outline Part I: Linear
Beyond Univariate Analyses: Multivariate Modeling of Functional Neuroimaging Data
 Beyond Univariate Analyses: Multivariate Modeling of Functional Neuroimaging Data F. DuBois Bowman Department of Biostatistics and Bioinformatics Center for Biomedical Imaging Statistics Emory University,
STA 4273H: Statistical Machine Learning
 STA 4273H: Statistical Machine Learning Russ Salakhutdinov Department of Statistics! rsalakhu@utstat.toronto.edu! http://www.utstat.utoronto.ca/~rsalakhu/ Sidney Smith Hall, Room 6002 Lecture 3 Linear
Wellcome Trust Centre for Neuroimaging, UCL, UK.
 Bayesian Inference Will Penny Wellcome Trust Centre for Neuroimaging, UCL, UK. SPM Course, Virginia Tech, January 2012 What is Bayesian Inference? (From Daniel Wolpert) Bayesian segmentation and normalisation
Causal modeling of fmri: temporal precedence and spatial exploration
 Causal modeling of fmri: temporal precedence and spatial exploration Alard Roebroeck Maastricht Brain Imaging Center (MBIC) Faculty of Psychology & Neuroscience Maastricht University Intro: What is Brain
An introduction to Bayesian inference and model comparison J. Daunizeau
 An introduction to Bayesian inference and model comparison J. Daunizeau ICM, Paris, France TNU, Zurich, Switzerland Overview of the talk An introduction to probabilistic modelling Bayesian model comparison
+ + ( + ) = Linear recurrent networks. Simpler, much more amenable to analytic treatment E.g. by choosing
 = Linear recurrent networks. Simpler, much more amenable to analytic treatment E.g. by choosing") Linear recurrent networks Simpler, much more amenable to analytic treatment E.g. by choosing + ( + ) = Firing rates can be negative Approximates dynamics around fixed point Approximation often reasonable
Linear recurrent networks Simpler, much more amenable to analytic treatment E.g. by choosing + ( + ) = Firing rates can be negative Approximates dynamics around fixed point Approximation often reasonable
HST 583 FUNCTIONAL MAGNETIC RESONANCE IMAGING DATA ANALYSIS AND ACQUISITION A REVIEW OF STATISTICS FOR FMRI DATA ANALYSIS
 HST 583 FUNCTIONAL MAGNETIC RESONANCE IMAGING DATA ANALYSIS AND ACQUISITION A REVIEW OF STATISTICS FOR FMRI DATA ANALYSIS EMERY N. BROWN AND CHRIS LONG NEUROSCIENCE STATISTICS RESEARCH LABORATORY DEPARTMENT
New Procedures for False Discovery Control
 New Procedures for False Discovery Control Christopher R. Genovese Department of Statistics Carnegie Mellon University http://www.stat.cmu.edu/ ~ genovese/ Elisha Merriam Department of Neuroscience University
Nonlinear reverse-correlation with synthesized naturalistic noise
 Cognitive Science Online, Vol1, pp1 7, 2003 http://cogsci-onlineucsdedu Nonlinear reverse-correlation with synthesized naturalistic noise Hsin-Hao Yu Department of Cognitive Science University of California
Course in Data Science
 Course in Data Science About the Course: In this course you will get an introduction to the main tools and ideas which are required for Data Scientist/Business Analyst/Data Analyst. The course gives an
Machine Learning. Lecture 4: Regularization and Bayesian Statistics. Feng Li. https://funglee.github.io
 Machine Learning Lecture 4: Regularization and Bayesian Statistics Feng Li fli@sdu.edu.cn https://funglee.github.io School of Computer Science and Technology Shandong University Fall 207 Overfitting Problem
Detecting fmri activation allowing for unknown latency of the hemodynamic response
 Detecting fmri activation allowing for unknown latency of the hemodynamic response K.J. Worsley McGill University J.E. Taylor Stanford University January 7, 006 Abstract Several authors have suggested
A prior distribution over model space p(m) (or hypothesis space ) can be updated to a posterior distribution after observing data y.
 (or hypothesis space ) can be updated to a posterior distribution after observing data y.") June 2nd 2011 A prior distribution over model space p(m) (or hypothesis space ) can be updated to a posterior distribution after observing data y. This is implemented using Bayes rule p(m y) = p(y m)p(m)
June 2nd 2011 A prior distribution over model space p(m) (or hypothesis space ) can be updated to a posterior distribution after observing data y. This is implemented using Bayes rule p(m y) = p(y m)p(m)
Hierarchy. Will Penny. 24th March Hierarchy. Will Penny. Linear Models. Convergence. Nonlinear Models. References
 24th March 2011 Update Hierarchical Model Rao and Ballard (1999) presented a hierarchical model of visual cortex to show how classical and extra-classical Receptive Field (RF) effects could be explained
Bayesian modelling of fmri time series
 Bayesian modelling of fmri time series Pedro A. d. F. R. Højen-Sørensen, Lars K. Hansen and Carl Edward Rasmussen Department of Mathematical Modelling, Building 321 Technical University of Denmark DK-28
Part 2: Multivariate fmri analysis using a sparsifying spatio-temporal prior
 Chalmers Machine Learning Summer School Approximate message passing and biomedicine Part 2: Multivariate fmri analysis using a sparsifying spatio-temporal prior Tom Heskes joint work with Marcel van Gerven
Principal Component Analysis
 Principal Component Analysis Introduction Consider a zero mean random vector R n with autocorrelation matri R = E( T ). R has eigenvectors q(1),,q(n) and associated eigenvalues λ(1) λ(n). Let Q = [ q(1)
Contrasts and Classical Inference
 Elsevier UK Chapter: Ch9-P3756 8-7-6 7:p.m. Page:6 Trim:7.5in 9.5in C H A P T E R 9 Contrasts and Classical Inference J. Poline, F. Kherif, C. Pallier and W. Penny INTRODUCTION The general linear model
arxiv: v2 [q-bio.qm] 21 Aug 2017
![arxiv: v2 [q-bio.qm] 21 Aug 2017](/thumbs/78/76988136.jpg "arxiv: v2 [q-bio.qm] 21 Aug 2017") Causal inference in functional Magnetic Resonance Imaging a Review of current approaches Natalia Z. Bielczyk 1,2, Sebo Uithol 1,2,3, Tim van Mourik 1,2, Martha N. Havenith 1,4, Paul Anderson 1,2, Jeffrey
Causal inference in functional Magnetic Resonance Imaging a Review of current approaches Natalia Z. Bielczyk 1,2, Sebo Uithol 1,2,3, Tim van Mourik 1,2, Martha N. Havenith 1,4, Paul Anderson 1,2, Jeffrey
! Dimension Reduction
 ! Dimension Reduction Pamela K. Douglas NITP Summer 2013 Overview! What is dimension reduction! Motivation for performing reduction on your data! Intuitive Description of Common Methods! Applications in
Granger Mediation Analysis of Functional Magnetic Resonance Imaging Time Series
 Granger Mediation Analysis of Functional Magnetic Resonance Imaging Time Series Yi Zhao and Xi Luo Department of Biostatistics Brown University June 8, 2017 Overview 1 Introduction 2 Model and Method 3
Machine learning strategies for fmri analysis
 Machine learning strategies for fmri analysis DTU Informatics Technical University of Denmark Co-workers: Morten Mørup, Kristoffer Madsen, Peter Mondrup, Daniel Jacobsen, Stephen Strother,. OUTLINE Do
1/12/2017. Computational neuroscience. Neurotechnology.
 Computational neuroscience Neurotechnology https://devblogs.nvidia.com/parallelforall/deep-learning-nutshell-core-concepts/ 1 Neurotechnology http://www.lce.hut.fi/research/cogntech/neurophysiology Recording
Optimization of Designs for fmri
 Optimization of Designs for fmri UCLA Advanced Neuroimaging Summer School August 2, 2007 Thomas Liu, Ph.D. UCSD Center for Functional MRI Why optimize? Scans are expensive. Subjects can be difficult to
A hierarchical group ICA model for assessing covariate effects on brain functional networks
 A hierarchical group ICA model for assessing covariate effects on brain functional networks Ying Guo Joint work with Ran Shi Department of Biostatistics and Bioinformatics Emory University 06/03/2013 Ying
Log Gaussian Cox Processes. Chi Group Meeting February 23, 2016
 Log Gaussian Cox Processes Chi Group Meeting February 23, 2016 Outline Typical motivating application Introduction to LGCP model Brief overview of inference Applications in my work just getting started
EEG- Signal Processing
 Fatemeh Hadaeghi EEG- Signal Processing Lecture Notes for BSP, Chapter 5 Master Program Data Engineering 1 5 Introduction The complex patterns of neural activity, both in presence and absence of external
Overview of Spatial Statistics with Applications to fmri
 with Applications to fmri School of Mathematics & Statistics Newcastle University April 8 th, 2016 Outline Why spatial statistics? Basic results Nonstationary models Inference for large data sets An example
Statistical Inference
 Statistical Inference J. Daunizeau Institute of Empirical Research in Economics, Zurich, Switzerland Brain and Spine Institute, Paris, France SPM Course Edinburgh, April 2011 Image time-series Spatial
SPIKE TRIGGERED APPROACHES. Odelia Schwartz Computational Neuroscience Course 2017
 SPIKE TRIGGERED APPROACHES Odelia Schwartz Computational Neuroscience Course 2017 LINEAR NONLINEAR MODELS Linear Nonlinear o Often constrain to some form of Linear, Nonlinear computations, e.g. visual
Hierarchical Dirichlet Processes with Random Effects
 Hierarchical Dirichlet Processes with Random Effects Seyoung Kim Department of Computer Science University of California, Irvine Irvine, CA 92697-34 sykim@ics.uci.edu Padhraic Smyth Department of Computer
Nonparametric Bayesian Methods (Gaussian Processes)
") [70240413 Statistical Machine Learning, Spring, 2015] Nonparametric Bayesian Methods (Gaussian Processes) Jun Zhu dcszj@mail.tsinghua.edu.cn http://bigml.cs.tsinghua.edu.cn/~jun State Key Lab of Intelligent
[70240413 Statistical Machine Learning, Spring, 2015] Nonparametric Bayesian Methods (Gaussian Processes) Jun Zhu dcszj@mail.tsinghua.edu.cn http://bigml.cs.tsinghua.edu.cn/~jun State Key Lab of Intelligent
Spatial Source Filtering. Outline EEG/ERP. ERPs) Event-related Potentials (ERPs( EEG
 Event-related Potentials (ERPs( EEG") Integration of /MEG/fMRI Vince D. Calhoun, Ph.D. Director, Image Analysis & MR Research The MIND Institute Outline fmri/ data Three Approaches to integration/fusion Prediction Constraints 2 nd Level Fusion
Integration of /MEG/fMRI Vince D. Calhoun, Ph.D. Director, Image Analysis & MR Research The MIND Institute Outline fmri/ data Three Approaches to integration/fusion Prediction Constraints 2 nd Level Fusion
Bayesian Inference. Chris Mathys Wellcome Trust Centre for Neuroimaging UCL. London SPM Course
 Bayesian Inference Chris Mathys Wellcome Trust Centre for Neuroimaging UCL London SPM Course Thanks to Jean Daunizeau and Jérémie Mattout for previous versions of this talk A spectacular piece of information
ECE521 week 3: 23/26 January 2017
 ECE521 week 3: 23/26 January 2017 Outline Probabilistic interpretation of linear regression - Maximum likelihood estimation (MLE) - Maximum a posteriori (MAP) estimation Bias-variance trade-off Linear
Strategies for Discovering Mechanisms of Mind using fmri: 6 NUMBERS. Joseph Ramsey, Ruben Sanchez Romero and Clark Glymour
 1 Strategies for Discovering Mechanisms of Mind using fmri: 6 NUMBERS Joseph Ramsey, Ruben Sanchez Romero and Clark Glymour 2 The Numbers 20 50 5024 9205 8388 500 3 fmri and Mechanism From indirect signals
Dynamic causal modeling for fmri
 Dynamic causal modeling for fmri Methods and Models for fmri, HS 2015 Jakob Heinzle Structural, functional & effective connectivity Sporns 2007, Scholarpedia anatomical/structural connectivity - presence
Experimental Design. Rik Henson. With thanks to: Karl Friston, Andrew Holmes
 Experimental Design Rik Henson With thanks to: Karl Friston, Andrew Holmes Overview 1. A Taxonomy of Designs 2. Epoch vs Event-related 3. Mixed Epoch/Event Designs A taxonomy of design Categorical designs
Independent Component Analysis. Contents
 Contents Preface xvii 1 Introduction 1 1.1 Linear representation of multivariate data 1 1.1.1 The general statistical setting 1 1.1.2 Dimension reduction methods 2 1.1.3 Independence as a guiding principle
Models of effective connectivity & Dynamic Causal Modelling (DCM)
") Models of effective connectivit & Dnamic Causal Modelling (DCM Presented b: Ariana Anderson Slides shared b: Karl Friston Functional Imaging Laborator (FIL Wellcome Trust Centre for Neuroimaging Universit
Models of effective connectivit & Dnamic Causal Modelling (DCM Presented b: Ariana Anderson Slides shared b: Karl Friston Functional Imaging Laborator (FIL Wellcome Trust Centre for Neuroimaging Universit
FIL. Event-related. fmri. Rik Henson. With thanks to: Karl Friston, Oliver Josephs
 Event-related fmri Rik Henson With thanks to: Karl Friston, Oliver Josephs Overview 1. BOLD impulse response 2. General Linear Model 3. Temporal Basis Functions 4. Timing Issues 5. Design Optimisation
Multivariate Regression Generalized Likelihood Ratio Tests for FMRI Activation
 Multivariate Regression Generalized Likelihood Ratio Tests for FMRI Activation Daniel B Rowe Division of Biostatistics Medical College of Wisconsin Technical Report 40 November 00 Division of Biostatistics
Statistical Inference
 Statistical Inference Jean Daunizeau Wellcome rust Centre for Neuroimaging University College London SPM Course Edinburgh, April 2010 Image time-series Spatial filter Design matrix Statistical Parametric
General linear model: basic
 General linear model: basic Introducing General Linear Model (GLM): Start with an example Proper>es of the BOLD signal Linear Time Invariant (LTI) system The hemodynamic response func>on (Briefly) Evalua>ng
Time Series Analysis. James D. Hamilton PRINCETON UNIVERSITY PRESS PRINCETON, NEW JERSEY
 Time Series Analysis James D. Hamilton PRINCETON UNIVERSITY PRESS PRINCETON, NEW JERSEY & Contents PREFACE xiii 1 1.1. 1.2. Difference Equations First-Order Difference Equations 1 /?th-order Difference
Annealed Importance Sampling for Neural Mass Models
 for Neural Mass Models, UCL. WTCN, UCL, October 2015. Generative Model Behavioural or imaging data y. Likelihood p(y w, Γ). We have a Gaussian prior over model parameters p(w µ, Λ) = N (w; µ, Λ) Assume
Probabilistic Graphical Models
 Probabilistic Graphical Models Brown University CSCI 2950-P, Spring 2013 Prof. Erik Sudderth Lecture 13: Learning in Gaussian Graphical Models, Non-Gaussian Inference, Monte Carlo Methods Some figures
Variational solution to hemodynamic and perfusion response estimation from ASL fmri data
 Variational solution to hemodynamic and perfusion response estimation from ASL fmri data Aina Frau-Pascual, Florence Forbes, Philippe Ciuciu June, 2015 1 / 18 BOLD: Qualitative functional MRI Blood Oxygen
Chart types and when to use them
 APPENDIX A Chart types and when to use them Pie chart Figure illustration of pie chart 2.3 % 4.5 % Browser Usage for April 2012 18.3 % 38.3 % Internet Explorer Firefox Chrome Safari Opera 35.8 % Pie chart
The ASL signal. Parenchy mal signal. Venous signal. Arterial signal. Input Function (Label) Dispersion: (t e -kt ) Relaxation: (e -t/t1a )
 Dispersion: (t e -kt ) Relaxation: (e -t/t1a )") Lecture Goals Other non-bold techniques (T2 weighted, Mn contrast agents, SSFP, Dynamic Diffusion, ASL) Understand Basic Principles in Spin labeling : spin inversion, flow vs. perfusion ASL variations
Lecture Goals Other non-bold techniques (T2 weighted, Mn contrast agents, SSFP, Dynamic Diffusion, ASL) Understand Basic Principles in Spin labeling : spin inversion, flow vs. perfusion ASL variations
Contents. design. Experimental design Introduction & recap Experimental design «Take home» message. N εˆ. DISCOS SPM course, CRC, Liège, 2009
 DISCOS SPM course, CRC, Liège, 2009 Contents Experimental design Introduction & recap Experimental design «Take home» message C. Phillips, Centre de Recherches du Cyclotron, ULg, Belgium Based on slides
Supplementary Note on Bayesian analysis
 Supplementary Note on Bayesian analysis Structured variability of muscle activations supports the minimal intervention principle of motor control Francisco J. Valero-Cuevas 1,2,3, Madhusudhan Venkadesan
Homework #2 Due date: 2/19/2013 (Tuesday) Translate the slice Two Main Paths in Lecture Part II: Neurophysiology and BOLD to words.
 Translate the slice Two Main Paths in Lecture Part II: Neurophysiology and BOLD to words.") Homework #2 Due date: 2/19/2013 (Tuesday) 1. What is BOLD? In your own words, fully explain the mechanism of BOLD fmri (from stimulus input to image voxel signal). (20 points) Translate the slice Two Main
Homework #2 Due date: 2/19/2013 (Tuesday) 1. What is BOLD? In your own words, fully explain the mechanism of BOLD fmri (from stimulus input to image voxel signal). (20 points) Translate the slice Two Main
Comparison of stochastic and variational solutions to ASL fmri data analysis
 Comparison of stochastic and variational solutions to ASL fmri data analysis Aina Frau-Pascual 1,3, Florence Forbes 1, and Philippe Ciuciu 2,3 p1q INRIA, Univ. Grenoble Alpes, LJK, Grenoble, France p2q
Pattern Recognition and Machine Learning
 Christopher M. Bishop Pattern Recognition and Machine Learning ÖSpri inger Contents Preface Mathematical notation Contents vii xi xiii 1 Introduction 1 1.1 Example: Polynomial Curve Fitting 4 1.2 Probability
What is the neural code? Sekuler lab, Brandeis
 What is the neural code? Sekuler lab, Brandeis What is the neural code? What is the neural code? Alan Litke, UCSD What is the neural code? What is the neural code? What is the neural code? Encoding: how
MultiDimensional Signal Processing Master Degree in Ingegneria delle Telecomunicazioni A.A
 MultiDimensional Signal Processing Master Degree in Ingegneria delle Telecomunicazioni A.A. 2017-2018 Pietro Guccione, PhD DEI - DIPARTIMENTO DI INGEGNERIA ELETTRICA E DELL INFORMAZIONE POLITECNICO DI
Dynamic causal modeling for fmri
 Dynamic causal modeling for fmri Methods and Models for fmri, HS 2016 Jakob Heinzle Structural, functional & effective connectivity Sporns 2007, Scholarpedia anatomical/structural connectivity - presence
Observed Brain Dynamics
 Observed Brain Dynamics Partha P. Mitra Hemant Bokil OXTORD UNIVERSITY PRESS 2008 \ PART I Conceptual Background 1 1 Why Study Brain Dynamics? 3 1.1 Why Dynamics? An Active Perspective 3 Vi Qimnü^iQ^Dv.aamics'v