We are interconnected, we are resilient As air temperatures warm forests change, fires increase glaciers retreat, snowpack diminishes sediment
|
|
|
- Shanon Hubbard
- 5 years ago
- Views:
Transcription
1 We are interconnected, we are resilient As air temperatures warm forests change, fires increase glaciers retreat, snowpack diminishes sediment increases rivers change, salmon respond base sea level rises estuaries and oceans change forces combine, increasing flood risk We are interconnected, we are resilient
2 In partnership with Skagit Climate Science Consortium, Skagit Land Trust, Skagit Watershed Council, and Swinomish Indian Tribal Community, MoNA welcomes you to explore and experience climate change and its impacts on Northwest coastal communities through Surge, a week-long exhibition of art, science, and information. Surge is a collection among scientists, educators, and artists to link changes and impacts such as rising sea levels and changing river flows with how these affect people and the ecosystem we live in and depend upon. This year s exhibit is fundamentally about interconnectedness. The exhibits involve forests and forest ecosystems, magnitude and movement of freshwater and sediment, coastal and estuarine areas, and invite curiosity about the interconnectedness of the physical (storm surge, sea level rise, flooding, salt) and living (plants, animals, human) worlds. Surge offers the opportunity for that curiosity to result in greater awareness that can lead to community efforts to inspire change.
3 Climate Change Drivers System Changes and Impacts Human and Local Challenges INCREASING CO 2 RESULTS IN RISING AIR TEMPERATURES Decreasing Snowpack Shrinking Glaciers Changes in Precipitation Patterns More Severe and More Frequent Storms Increasing Fire Frequency Dam Management Drinking Water Power Generation Forests Increasing Disease and Pest/Insect Outbreaks Roads and Infrastructure Floodrisk Higher Winter Flows and More Flooding Agriculture Ecosystem Restoration Coastal Flooding Fish and Wildlife Lower River Flows and Higher Water Temperatures Rising Groundwater Levels Increasing Sediment in Rivers and Reduction in Flood Capacity More Frequent High Tide Events Rising Sea Levels INCREASING CO 2 RESULTS IN RISING AIR TEMPERATURES
4 As winter temperatures get warmer, the winter freezing level in the Skagit has risen (the elevation where the temperature is cold enough for most precipitation to fall as snow, not rain). The winter of had an average winter freezing level of 6,000 feet. That s 1,400 feet above the average elevation and 400 feet higher than it had ever been since records began in 1948.
5 Skagit Air Temperature Warms Rising Winter Freezing Levels Shrinking Glaciers Changing Precipitation Patterns Bigger and More More Rain and More Sediment Heavier Frequent Floods Less Snow in Rivers Rain Events Increased Skagit Flood Risk
6 0 C Level at N, W 7 Months Ending in April Years Warmer than Average 1600 Elevation (m) Years Colder than Average Ending Year ( ) Data provided by the Office of the Washington State Climatologist Last data: Means from Western Regional Climate Center
7 Temperature Trends Since 1920 CANADA WASHINGTON MONTANA COLDER 2.0 C (3.6 F) WARMER IDAHO 1.5 C (2.7 F) OREGON 1.0 C (1.8 F) 0.5 C (0.9 F) Data provided by the Office of the Washington State Climatologist Menne et al. 2009: ftp://ftp.ncdc.noaa.gov/pub/data/ushcn/v2/monthly/menne-etal2009.pdf USHCN version
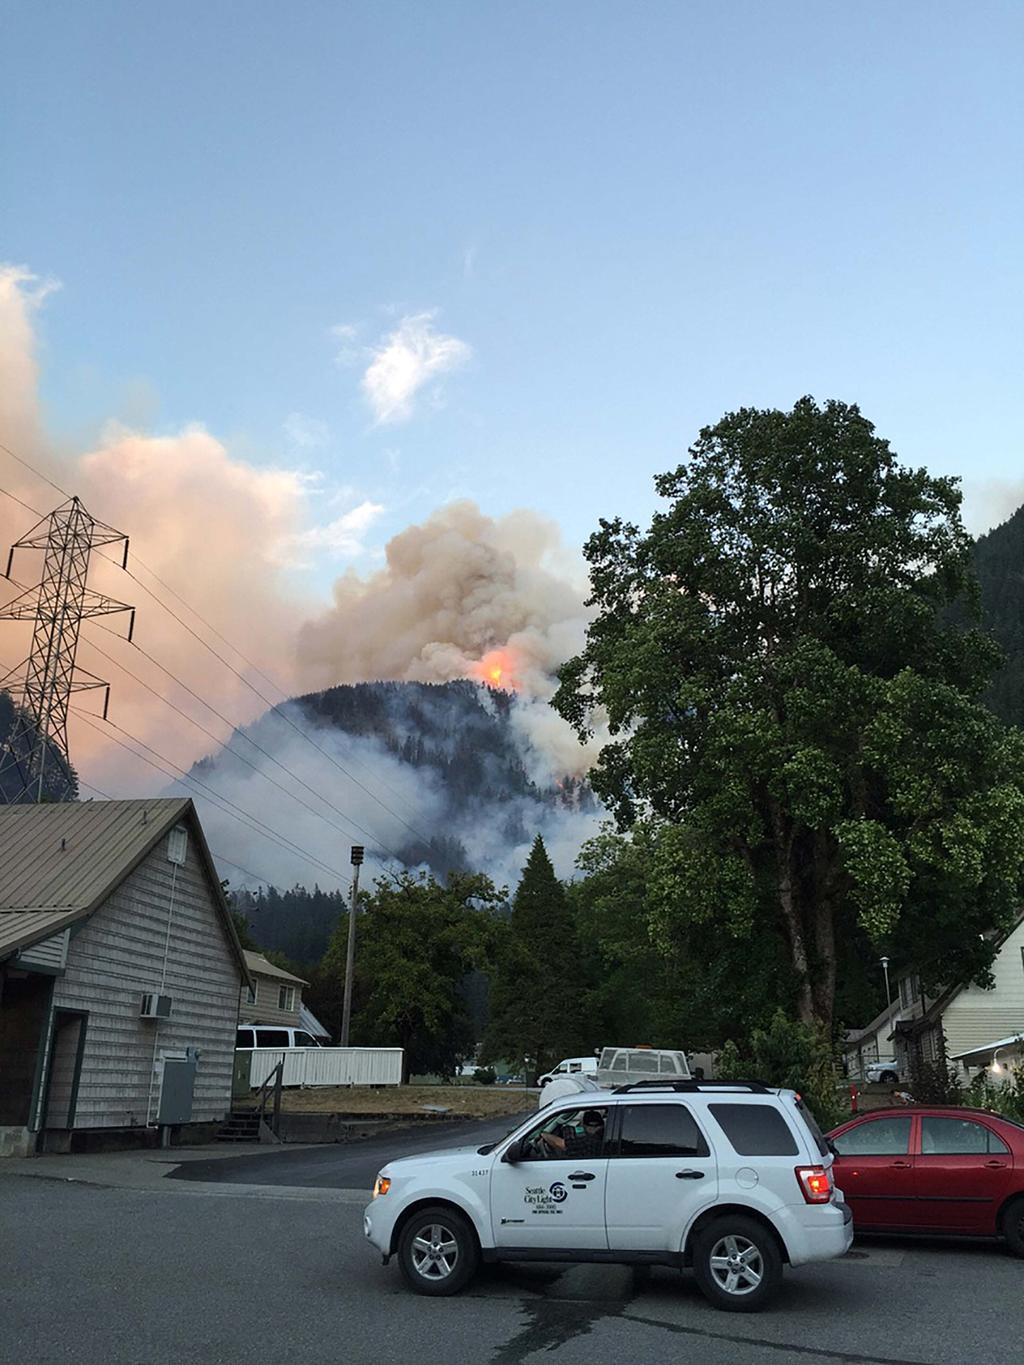
8 Wildfires in the Skagit River Basin have historically been uncommon and relatively small. In a warmer climate, the number and size of forest fires are expected to increase, with the biggest effects observed in extreme drought years. West-side fires that occurred in the record drought year of 2015 provided a preview of a future with smokier skies. The Goodell Fire burned over 7,000 acres near Newhalem in August Ignited by lightning, this fire crossed the North Cascades Highway, causing the temporary shutdown of Seattle City Light hydroelectric facilities and evacuation of the town of Diablo.
9
10 From 1959 to 2009, the Skagit lost about 12.3 square miles of glacial ice, representing a 19% loss in area and 800 billion gallons of water. The loss of water is equivalent to about 100 years of Skagit County water supply at the current rate of consumption.
11 Rising Winter Freezing Levels HISTORIC CURRENT PREDICTED SNOW STORES WATER ON LAND RAINWATER FLOWS INTO RIVER When precipitation falls as snow, it is stored as ice and snow that slowly melts, providing water to the Skagit River throughout the year, including late summer and drought periods. When precipitation falls as rain, water enters the Skagit River during fall and winter, contributing to flood risk. As freezing levels rise, the land area contributing to flooding increases. FREEZING LEVEL
12 Time Glacier Cumulative Mass Balance (Meter Water Equivalent) Cumulative mass balance (meter water equilvalent) North Cascade Glaciers N.Klawatti Noisy Silver Sandalee S.Cascade *Glacier-wide averages calculated using conventional glacier maps (1993/1995 & 2004/2006/2010). Annual balances calculated from direct method were adjusted to reflect differences with geodetic mass balance measurements. Gain of Ice Loss of Ice Water Year Water Year
13 Since the late 1880s, an estimated 90 million cubic meters of sediment has accumulated in Skagit Bay. This is enough to bury the I-5 corridor between Canada and Oregon 15 feet deep or cover a football field 10 miles high. The sediment has filled in the deeper parts of Skagit Bay an average of 49 feet and up to 90 feet in some places, and represents a tenfold increase in the rate of sedimentation that occurred prior to constructing levees.
14 Since 1975, an average of 3 to 5 feet of sediment has accumulated across most of the 30 reaches studied along the Skagit River between Sedro-Woolley and Fir Island. Up to 10 feet has accumulated in a few areas particularly near Mount Vernon. This build-up of sediment in the river reduces the ability of the river channel to carry water (conveyance capacity) during a high flow and increases the possibility that floods will overtop the levees and cause flooding.
15 Flow of Sediment Sediment is the sand, mud, and pebbles that were once solid rock. TRANSPORT: Rivers move SOURCE: Erosion from slopes and migrating river channels generate a lot of sediment Sediment flows in tributary streams and river channels of the Skagit, from the Cascade SINK: Sediment is deposited across sediment downstream Mountains to Skagit Bay and Puget Sound. natural river deltas and floodplains
*+,' 8.4*'(#)*+,' 8.")

*+,' Fall Winter Salmon die after they spawn. Spring!+6\"/9/'(#)*+,' Vulnerability Lowest Highest!&//)./#-:' ;#%,5+<'&0+4&' =4))'&0+4&' 84>.")
. Climate impacts for each species follow a different color scale (right).")


16 Skagit Salmon and Their Relatives: Life Stage Spawning Incubation Freshwater Rearing Estuary Rearing Nearshore Rearing Ocean Rearing Year Season Pink Chum Chinook Coho Sockeye Steelhead Bull trout Cutthroat Whitefish All Are Vulnerable to Climate Change 0 Summer Fall Winter Spring 7%,"'(#)*+,' 8.4*'(#)*+,' 8.%,++"'(#)*+,' Species have different life histories: they live in different habitats at different stages in their life (top right), and have differing life expectancy. Salmon spawn and then die, while trout and whitefish may spawn multiple times. 1 Summer Fall Winter Spring 2 Summer Fall Winter Spring 3 Summer Fall Winter Spring 4 Summer The same species may exhibit more than one life history. 8+.+'(#)*+,' Fall Winter Salmon die after they spawn. Spring!+6"/9/'(#)*+,' Vulnerability Lowest Highest!&//)./#-:' ;#%,5+<'&0+4&' =4))'&0+4&' 84>.0+#&'&0+4&' Because of their life history variation, salmon are vulnerable to climate change in different ways. Climate impacts are colored by life stage (top right color scale). Climate impacts for each species follow a different color scale (right). Climate Impact Pink Chum Chinook Coho Sockeye Steelhead Bull trout Cutthroat Whitefish - Spawning Temperature Temperature During Incubation Winter Flooding Suspended Sediment in Winter Summer River Flows Summer River Temperature These results are based on Sea REFERENCES FOR FISH ILLUSTRATIONS: Pink, Chum, Sockeye, and Cutthroat: US fish and Wildlife Service; Chinook, Coho, Steelhead, Bull trout: National Oceanic and Atmospheric Association; Mountain whitefish: bigtrout.com what climate impacts are expected by 2050, and vulnerabilities will increase if climate impacts worsen. Suspended Sediment in Spring Summer Nearshore Temperature Nearshore Dissolved Oxygen Ocean Temperatures Species are vulnerable to climate impacts only in habitats they use.
17 12 inches of sea level rise turns a 100-year storm into a 10-year storm event 24 inches of sea level rise turns a 100-year storm into an annual event This range of sea level increase is projected for Puget Sound by 2100
18 Rising Sea Levels & Storm Surge FUTURE HIGH TIDE STORM SURGE CURRENT SEA LEVEL CURRENT HIGH TIDE FUTURE SEA LEVEL DIKE FARMLAND NOTE: Sea, tide, and storm surge levels are for illustrative purposes only and do not depict actual or projected levels.
19 Rising Sea Levels, Groundwater & Storm Surge FUTURE FRESHWATER CURRENT FRESHWATER FARMLAND FUTURE HIGH TIDE STORM SURGE WELL CURRENT HIGH TIDE DIKE FUTURE SEA LEVEL CURRENT SEA LEVEL FRESH GROUNDWATER SEAFLOOR SALTY GROUNDWATER FUTURE SALTWATER CURRENT SALTWATER NOTE: Sea, tide, and storm surge levels, depth of groundwater, and location of saltwater lens are for illustrative purposes only and do not depict actual or projected levels.
20 Climate Change: Combining Forces Warming Rising Winter Shrinking Heavier Temperatures Freezing Levels Glaciers Rain Events MORE WATER BIGGER AND MORE FREQUENT FLOODS MORE WATER Rising Sea Levels

21 Adaptation: Responding to shifts associated with climate variability and climate change by forming and taking deliberate actions leading to: A reduction in harm or risk, or The realization of benefits for people or ecosystems Resiliency: The ability to recover readily from adversity; buoyancy
Climate change in the U.S. Northeast
 Climate change in the U.S. Northeast By U.S. Environmental Protection Agency, adapted by Newsela staff on 04.10.17 Word Count 1,109 Killington Ski Resort is located in Vermont. As temperatures increase
CLIMATE READY BOSTON. Climate Projections Consensus ADAPTED FROM THE BOSTON RESEARCH ADVISORY GROUP REPORT MAY 2016
 CLIMATE READY BOSTON Sasaki Steering Committee Meeting, March 28 nd, 2016 Climate Projections Consensus ADAPTED FROM THE BOSTON RESEARCH ADVISORY GROUP REPORT MAY 2016 WHAT S IN STORE FOR BOSTON S CLIMATE?
Catastrophic Events Impact on Ecosystems
 Catastrophic Events Impact on Ecosystems Hurricanes Hurricanes An intense, rotating oceanic weather system with sustained winds of at least 74 mph and a welldefined eye Conditions for formation: Warm water
Learning Objectives: I can identify and interpret river flows and directions.
 Learning Objectives: I can identify and interpret river flows and directions. Bellringer Review: Check for Understanding Questions: 1 2 What Are The Key Parts Of A River s Anatomy? In your data notebooks
Climate change projections for Ontario: an updated synthesis for policymakers and planners
 Ministry of Natural Resources and Forestry Climate change projections for Ontario: an updated synthesis for policymakers and planners Shannon Fera and Adam Hogg Ontario Ministry of Natural Resources and
Columbia Estuary Province
 Rolling Provincial Review: Implementation 2001-2004 Province 73 Columbia Basin Fish & Wildlife Authority Province FY 2001-2004 Spending Summaries NPCC Recommendations and BPA Spending by Project Category,
Extreme Weather Events: Infrastructure Damage and Impact on Vulnerable Populations
 Extreme Weather Events: Infrastructure Damage and Impact on Vulnerable Populations Cindy L. Parker MD, MPH Physicians for Social Responsibility Johns Hopkins Bloomberg School of Public Health 1 Climate
Chapter 2: Physical Geography
 Chapter 2: Physical Geography Pg. 39-68 Learning Goals for Chp2: q q q q q Explain how the Earth moves in space and why seasons change. Outline the factors that influence climate and recognize different
1 Earth s Oceans. TAKE A LOOK 2. Identify What are the five main oceans?
 CHAPTER 13 1 Earth s Oceans SECTION Exploring the Oceans BEFORE YOU READ After you read this section, you should be able to answer these questions: What affects the salinity of ocean water? What affects
The Dynamic Earth Section 3. Chapter 3 The Dynamic Earth Section 3: The Hydrosphere and Biosphere DAY 1
 Chapter 3 The Dynamic Earth Section 3: The Hydrosphere and Biosphere DAY 1 The Hydrosphere The hydrosphere includes all of the water on or near the Earth s surface. This includes water in the oceans, lakes,
Overview of a Changing Climate in Rhode Island
 Overview of a Changing Climate in Rhode Island David Vallee, Hydrologist in Charge, National Weather Service Northeast River Forecast Center, NOAA Lenny Giuliano, Air Quality Specialist, Rhode Island Department
Chapter 2 Planet Earth
 Chapter 2 Planet Earth Section Notes Earth and the Sun s Energy Water on Earth The Land Close-up The Water Cycle World Almanac Major Eruptions in the Ring of Fire Quick Facts Chapter 2 Visual Summary Video
Hydrosphere The hydrosphere includes all water on Earth.
 Hydrosphere The hydrosphere includes all water on Earth. The abundance of water on Earth is a unique feature that clearly distinguishes our "Blue Planet" from others in the solar system. Not a drop of
In the space provided, write the letter of the description that best matches the term or phrase. a. any form of water that falls to Earth s
 Skills Worksheet Concept Review In the space provided, write the letter of the description that best matches the term or phrase. 1. condensation 2. floodplain 3. watershed 4. tributary 5. evapotranspiration
Natural Variability in Annual Maximum Water Level and Outflow of Yellowstone Lake
 Natural Variability in Annual Maximum Water Level and Outflow of Yellowstone Lake Phillip E. Farnes Abstract The water level in Yellowstone Lake varies each year in response to differences in the winter
HYDROSPHERE NOTES. Water cycle: The continuous movement of water into the air, onto land, and then back to water sources.
 Hon Environmental Science HYDROSPHERE NOTES The Hydrosphere and the Water Cycle: Water cycle: The continuous movement of water into the air, onto land, and then back to water sources. Evaporation: the
Which map shows the stream drainage pattern that most likely formed on the surface of this volcano? A) B)
 B)") 1. When snow cover on the land melts, the water will most likely become surface runoff if the land surface is A) frozen B) porous C) grass covered D) unconsolidated gravel Base your answers to questions
1. When snow cover on the land melts, the water will most likely become surface runoff if the land surface is A) frozen B) porous C) grass covered D) unconsolidated gravel Base your answers to questions
Climate change in the U.S. Northeast
 Climate change in the U.S. Northeast By U.S. Environmental Protection Agency, adapted by Newsela staff on 04.10.17 Word Count 773 Level 800L Killington Ski Resort is located in Vermont. As temperatures
2015: A YEAR IN REVIEW F.S. ANSLOW
 2015: A YEAR IN REVIEW F.S. ANSLOW 1 INTRODUCTION Recently, three of the major centres for global climate monitoring determined with high confidence that 2015 was the warmest year on record, globally.
Name period date assigned date due date returned. Natural Disasters
 Name period date assigned date due date returned Match the following natural disaster to its description. Write the capital letter of the definition in the blank in front of the natural disaster. 1. tornado
STREAM SYSTEMS and FLOODS
 STREAM SYSTEMS and FLOODS The Hydrologic Cycle Precipitation Evaporation Infiltration Runoff Transpiration Earth s Water and the Hydrologic Cycle The Hydrologic Cycle The Hydrologic Cycle Oceans not filling
Precipitation Evaporation Infiltration Earth s Water and the Hydrologic Cycle. Runoff Transpiration
 STREAM SYSTEMS and FLOODS The Hydrologic Cycle Precipitation Evaporation Infiltration Earth s Water and the Hydrologic Cycle Runoff Transpiration The Hydrologic Cycle The Hydrologic Cycle Oceans not filling
Ecosystems Chapter 4. What is an Ecosystem? Section 4-1
 Ecosystems Chapter 4 What is an Ecosystem? Section 4-1 Ecosystems Key Idea: An ecosystem includes a community of organisms and their physical environment. A community is a group of various species that
Northwest Outlook October 2016
 Northwest Outlook October 2016 Rainfall Opportunities and Challenges Rainfall over the month of September presented some challenges for the fall harvest while other producers benefitted. Figure 1a shows
2nd Grade. Earth's Water. Slide 1 / 111 Slide 2 / 111. Slide 3 / 111. Slide 4 / 111. Slide 5 (Answer) / 111. Slide 5 / 111. Role of Water on Earth
 / 111. Slide 5 / 111. Role of Water on Earth") Slide 1 / 111 Slide 2 / 111 2nd Grade Role of Water on Earth 2015-11-20 www.njctl.org Slide 3 / 111 Slide 4 / 111 Table of Contents: The Role of Water on Earth Earth's Water The Use of Maps Click on the
Slide 1 / 111 Slide 2 / 111 2nd Grade Role of Water on Earth 2015-11-20 www.njctl.org Slide 3 / 111 Slide 4 / 111 Table of Contents: The Role of Water on Earth Earth's Water The Use of Maps Click on the
THE CANADIAN CENTRE FOR CLIMATE MODELLING AND ANALYSIS
 THE CANADIAN CENTRE FOR CLIMATE MODELLING AND ANALYSIS As Canada s climate changes, and weather patterns shift, Canadian climate models provide guidance in an uncertain future. CANADA S CLIMATE IS CHANGING
Lower South Fork McKenzie River Floodplain Enhancement Project
 Lower South Fork McKenzie River Floodplain Enhancement Project McKenzie River Ranger District Willamette National Forest Project Location The project is located in the South Fork McKenzie River Watershed,
3/3/2013. The hydro cycle water returns from the sea. All "toilet to tap." Introduction to Environmental Geology, 5e
 Introduction to Environmental Geology, 5e Running Water: summary in haiku form Edward A. Keller Chapter 9 Rivers and Flooding Lecture Presentation prepared by X. Mara Chen, Salisbury University The hydro
Terrestrial Climate Change Variables
 Terrestrial Climate Change Variables Content Terrestrial Climate Change Variables Surface Air Temperature Land Surface Temperature Sea Level Ice Level Aerosol Particles (acid rain) Terrestrial Climate
Biogeochemical cycles
 Lecture -2: Biogeochemical cycles ENV 107: Introduction to Environmental Science Dr. A.K.M. Saiful Islam Case Study: Lake Washington The city of Seattle, USA lies between two major bodies of water- saltwater
HOW GEOGRAPHY AND GEOLOGY AFFECT BIOLOGICAL DIVERSITY
 HOW GEOGRAPHY AND GEOLOGY AFFECT BIOLOGICAL DIVERSITY Factors Affecting Extinction Rates Natural Factors Climate change Cataclysmic event (volcano, earthquake) Human Activities Habitat Loss/Fragmentation
Oregon Water Conditions Report April 17, 2017
 Oregon Water Conditions Report April 17, 2017 Mountain snowpack continues to maintain significant levels for mid-april. By late March, statewide snowpack had declined to 118 percent of normal after starting
Grade 8 Science. Unit 1: Water Systems on Earth Chapter 1
 Grade 8 Science Unit 1: Water Systems on Earth Chapter 1 Effects of Water? Churchill River Large Ocean Wave How do you use water? House Hold Use Personal Use Recreational Activities Water Distribution
What are the different ways rocks can be weathered?
 Romano - 223 What are the different ways rocks can be weathered? Weathering - the breakdown of rocks and minerals at the Earth s surface 1. 2. PHYSICAL WEATHERING Rock is broken into smaller pieces with
Flood Risk Assessment
 Flood Risk Assessment February 14, 2008 Larry Schick Army Corps of Engineers Seattle District Meteorologist General Assessment As promised, La Nina caused an active winter with above to much above normal
STUDY GUIDE FOR CONTENT MASTERY. Surface Water Movement
 Surface Water SECTION 9.1 Surface Water Movement In your textbook, read about surface water and the way in which it moves sediment. Complete each statement. 1. An excessive amount of water flowing downslope
6.1 Water. The Water Cycle
 6.1 Water The Water Cycle Water constantly moves among the oceans, the atmosphere, the solid Earth, and the biosphere. This unending circulation of Earth s water supply is the water cycle. The Water Cycle
The following information is provided for your use in describing climate and water supply conditions in the West as of April 1, 2003.
 Natural Resources Conservation Service National Water and Climate Center 101 SW Main Street, Suite 1600 Portland, OR 97204-3224 Date: April 8, 2003 Subject: April 1, 2003 Western Snowpack Conditions and
The Niagara Escarpment extends from western New York, through the GTA all the way up to Manitoulin Island and into Michigan and Wisconsin.
 is southern Ontario s most prominent topographic feature, extending more than 500 kilometres from western New York, through Niagara Falls and the western part of the Greater Toronto Area (GTA), and north
Climate Change in Newfoundland & Labrador
 Climate Change in Newfoundland & Labrador Impacts and Adaptation Newleef Conference 08 October 2015 Met-Ocean Services The Team 55 personnel; 24/7 operational weather forecast desk; Equipment technician
Betsy Stevenson and Allison Mohrs (Skagit County Planning and Development Services) Jenny Baker, The Nature Conservancy
 Jenny Baker, The Nature Conservancy") TC Fisher Slough Final Design and Permitting Subject: Well Review Memorandum To: From: Betsy Stevenson and Allison Mohrs (Skagit County Planning and Development Services) Jenny Baker, The ature Conservancy
TC Fisher Slough Final Design and Permitting Subject: Well Review Memorandum To: From: Betsy Stevenson and Allison Mohrs (Skagit County Planning and Development Services) Jenny Baker, The ature Conservancy
Climate also has a large influence on how local ecosystems have evolved and how we interact with them.
 The Mississippi River in a Changing Climate By Paul Lehman, P.Eng., General Manager Mississippi Valley Conservation (This article originally appeared in the Mississippi Lakes Association s 212 Mississippi
GLOBAL WARMING: GLOBAL WARMING. landscape implications. Andrew Goudie St Cross College Oxford
 GLOBAL WARMING: GLOBAL WARMING landscape implications Andrew Goudie St Cross College Oxford THE PROCESS OF CHANGE HAS STARTED IPCC 2007 Increased Glacier retreat since the early 1990s Area of seasonally
Tracking the Salt Front
 Tracking the Salt Front Students will use Hudson River salinity data to practice math skills as they track movements of the salt front in response to storms and other weather events. Objectives: Students
Year 6. Geography. Revision
 Year 6 Geography Revision November 2017 Rivers and World knowledge How the water cycle works and the meaning of the terms evaporation, condensation, precipitation, transpiration, surface run-off, groundwater
Opportunities to Improve Ecological Functions of Floodplains and Reduce Flood Risk along Major Rivers in the Puget Sound Basin
 Opportunities to Improve Ecological Functions of Floodplains and Reduce Flood Risk along Major Rivers in the Puget Sound Basin Christopher Konrad, US Geological Survey Tim Beechie, NOAA Fisheries Managing
ADDRESSING GEOMORPHIC AND HYDRAULIC CONTROLS IN OFF-CHANNEL HABITAT DESIGN
 ADDRESSING GEOMORPHIC AND HYDRAULIC CONTROLS IN OFF-CHANNEL HABITAT DESIGN Conor Shea - Hydrologist U.S. Fish and Wildlife Service Conservation Partnerships Program Arcata, CA Learning Objectives Examine
Thermal / Solar. When air is warmed it... Rises. Solar Energy. Evaporation. Condensation Forms Clouds
 Thermal / Solar Light from the Sun is transformed into what type of energy when it hits Earth's surface? Rises When air is warmed it... Solar Energy Water moves through the water cycle using what type
Activity 2.2: Recognizing Change (Observation vs. Inference)
") Activity 2.2: Recognizing Change (Observation vs. Inference) Teacher Notes: Evidence for Climate Change PowerPoint Slide 1 Slide 2 Introduction Image 1 (Namib Desert, Namibia) The sun is on the horizon
Activity 2.2: Recognizing Change (Observation vs. Inference) Teacher Notes: Evidence for Climate Change PowerPoint Slide 1 Slide 2 Introduction Image 1 (Namib Desert, Namibia) The sun is on the horizon
Chapter Introduction. Earth. Change. Chapter Wrap-Up
 Chapter Introduction Lesson 1 Lesson 2 Lesson 3 Climates of Earth Chapter Wrap-Up Climate Cycles Recent Climate Change What is climate and how does it impact life on Earth? What do you think? Before you
Storm and Storm Systems Related Vocabulary and Definitions. Magnitudes are measured differently for different hazard types:
 Storm and Storm Systems Related Vocabulary and Definitions Magnitude: this is an indication of the scale of an event, often synonymous with intensity or size. In natural systems, magnitude is also related
Oregon Water Conditions Report May 1, 2017
 Oregon Water Conditions Report May 1, 2017 Mountain snowpack in the higher elevations has continued to increase over the last two weeks. Statewide, most low and mid elevation snow has melted so the basin
Kentucky Weather Hazards: What is Your Risk?
 Kentucky Weather Hazards: What is Your Risk? Stuart A. Foster State Climatologist for Kentucky 2010 Kentucky Weather Conference Bowling Green, Kentucky January 16, 2010 Perspectives on Kentucky s Climate
SECTION 2 How Is Pacific Northwest Climate Changing?
 SECTION 2 How Is Pacific Northwest Climate Changing? The Pacific Northwest is experiencing a suite of long-term changes that are consistent with those observed globally as a result of human-caused climate
Weathering, Erosion, and Deposition Guided Notes
 1. Weathering, Erosion, and Deposition 2. Outline Section 1: Weathering Section 2: Erosion Section 3: Deposition Section 4: Case Study Weathering, Erosion, and Deposition Guided Notes 3. Section 1: Weathering
Natural Disasters. in Florida. Severe Thunderstorms
 Natural Disasters in Florida SC.6.E.7.7 Investigate how natural disasters have affected human life in Florida. Severe Thunderstorms While the typical afternoon thunderstorm in Florida may not appear to
Impact of Climate Change on Alaska Native Communities
 Impact of Climate Change on Alaska Native Communities Alaska Native Science Commission www.nativescience.org www.nativeknowledge.org Climate Change Affects Community Way of Life Alaska Natives have always
netw rks Guided Reading Activity Essential Question: How does geography influence the way people live? Earth's Physical Geography
 Guided Reading Activity Lesson 1 Earth and the Sun Essential Question: How does geography influence the way people live? Looking at Earth Directions: What are the layers that make up Earth? Use your textbook
Weather and Climate Change
 Weather and Climate Change What if the environmental lapse rate falls between the moist and dry adiabatic lapse rates? The atmosphere is unstable for saturated air parcels but stable for unsaturated air
PH YSIC A L PROPERT IE S TERC.UCDAVIS.EDU
 PH YSIC A L PROPERT IE S 8 Lake surface level Daily since 1900 Lake surface level varies throughout the year. Lake level rises due to high stream inflow, groundwater inflow and precipitation directly onto
Kootenai River Habitat Restoration Program Update
 Kootenai River Habitat Restoration Program Update Kootenai Tribe of Idaho Kootenai Valley Resource Initiative November 19, 2012 Bonners Ferry, Idaho Changes to Kootenai Basin Beaver trapping Floodplain
Chapter 2. Wearing Down Landforms: Rivers and Ice. Physical Weathering
 Chapter 2 Wearing Down Landforms: Rivers and Ice Physical Weathering Weathering vs. Erosion Weathering is the breakdown of rock and minerals. Erosion is a two fold process that starts with 1) breakdown
Climate Change Impact on Drought Risk and Uncertainty in the Willamette River Basin
 Portland State University PDXScholar Geography Faculty Publications and Presentations Geography 5-24-2011 Climate Change Impact on Drought Risk and Uncertainty in the Willamette River Basin Heejun Chang
Fresh & Saltwater Systems
 Fresh & Saltwater Systems Topic 1 Need vs. Supply You got it! Water A Dependence! So who needs water? Everyone! Living systems need water to survive Ecosystems depend on it The land is changed by it Industry
Coastal Impacts of Climate Change in the Northwest: A Summary of the Findings of the upcoming National Climate Assessment
 Western Washington University Western CEDAR Salish Sea Ecosystem Conference 2014 Salish Sea Ecosystem Conference (Seattle, Wash.) May 1st, 3:30 PM - 5:00 PM Coastal Impacts of Climate Change in the Northwest:
RR#5 - Free Response
 Base your answers to questions 1 through 3 on the data table below and on your knowledge of Earth Science. The table shows the area, in million square kilometers, of the Arctic Ocean covered by ice from
Science EOG Review: Landforms
 Mathematician Science EOG Review: Landforms Vocabulary Definition Term canyon deep, large, V- shaped valley formed by a river over millions of years of erosion; sometimes called gorges (example: Linville
Solutions to Flooding on Pescadero Creek Road
 Hydrology Hydraulics Geomorphology Design Field Services Photo courtesy Half Moon Bay Review Solutions to Flooding on Pescadero Creek Road Prepared for: San Mateo County Resource Conservation District
Case Study 2: Twenty-mile Creek Rock Fords
 Case Study : Twenty-mile Creek Rock Fords Location Crossing Description Washington. Okanagan National Forest. Methow Valley Ranger District. Chewuch river basin, East Chewuch Road. The Twenty-mile Creek
GUIDED READING CHAPTER 1: THE LAY OF THE LAND (Page 1)
") CHAPTER 1: THE LAY OF THE LAND (Page 1) Section 1 The Tidewater Region Directions: Use the information from pages 6-11 to complete the following statements. 1. In the southern part of the coast, the Tidewater
CHAPTER 1: THE LAY OF THE LAND (Page 1) Section 1 The Tidewater Region Directions: Use the information from pages 6-11 to complete the following statements. 1. In the southern part of the coast, the Tidewater
Description DESCRIPTION
 DESCRIPTION The location of the Upper James Watershed is located in northeastern South Dakota as well as southeastern North Dakota. It includes the following counties located in North Dakota Barnes, Dickey,
4 Changes in Climate. TAKE A LOOK 2. Explain Why is more land exposed during glacial periods than at other times?
 Name Class CHAPTER 3 Date Climate 4 Changes in Climate SECTION National Science Education Standards BEFORE YOU READ After you read this section, you should be able to answer these questions: ES 1k, 2a
More open water means even more ice will melt
 Everyone needs water to survive. Humans, wildlife, birds, fish and plants all need water. Some live in the water, on the water or near the water. It keeps us all alive one way or another. We also use water
ES 105 Surface Processes I. Hydrologic cycle A. Distribution % in oceans 2. >3% surface water a. +99% surface water in glaciers b.
 ES 105 Surface Processes I. Hydrologic cycle A. Distribution 1. +97% in oceans 2. >3% surface water a. +99% surface water in glaciers b. >1/3% liquid, fresh water in streams and lakes~1/10,000 of water
hydrosphere notes nwebsite.notebook November 30, 2015 The Hydrosphere
 hydrosphere notes nwebsite.notebook The Hydrosphere 1 Earth's outer layer of water found as liquid gas or solid. Stats: 71% of earth is water 97.5% of this water is in the oceans 2.5% left is rivers, lakes,
Figure 1. Carbon dioxide time series in the North Pacific Ocean (
 Evidence #1: Since 1950, Earth s atmosphere and oceans have changed. The amount of carbon released to the atmosphere has risen. Dissolved carbon in the ocean has also risen. More carbon has increased ocean
Module 2, Investigation 4: Log 1 Our coasts
 Module 2, Investigation 4: Log 1 Our coasts The coast is where the ocean meets land. Coastlines are always changing their shape. They are being worn away in some places and built up in others. Coasts can
Sun, Moon, Hydrosphere Worksheet - Answers
 Sun, Moon, Hydrosphere Worksheet - Answers Question 1 WHAT TERM CORRESPONDS TO EACH OF THE FOLLOWING DEFINITIONS? a) a landform, slope or terrain that can affect water circulation b) the Earth s blue envelope
Ellen L. Mecray NOAA Regional Climate Services Director, Eastern Region Taunton, MA
 Ellen L. Mecray NOAA Regional Climate Services Director, Eastern Region Taunton, MA Regions of the US National Climate Assessment What we Observe: Climate changes and impacts Increasing temperature Increasingly
Biosphere Biome Ecosystem Community Population Organism
 Ecology ecology - The study of living things and how they relate to their environment Levels of Organization in Ecology organism lowest level one living thing population collection of organisms of the
HyMet Company. Streamflow and Energy Generation Forecasting Model Columbia River Basin
 HyMet Company Streamflow and Energy Generation Forecasting Model Columbia River Basin HyMet Inc. Courthouse Square 19001 Vashon Hwy SW Suite 201 Vashon Island, WA 98070 Phone: 206-463-1610 Columbia River
MET Lecture 20 Mountain Snowstorms (CH16)
") MET 4300 Lecture 20 Mountain Snowstorms (CH16) Learning Objectives Provide an overview of the importance and impacts of mountain snowstorms in the western US Describe how topography influence precipitation
MET 4300 Lecture 20 Mountain Snowstorms (CH16) Learning Objectives Provide an overview of the importance and impacts of mountain snowstorms in the western US Describe how topography influence precipitation
Tips for Success on a Test
 Number of Incorrect: Final Grade: Parent Signature: Top Tips for Success on a Test 1. Read the following statements at least two times. 2. Circle the key words in each question/ or statement. (*Remember
SEA ICE AND GLOBAL WARMING
 jkjk SEA ICE AND GLOBAL WARMING Lesson plan for grades K- 3 By: Laura Sanders, Environmental Science Institute, March 2011 Length of lesson: two 30- minute class periods SOURCES AND RESOURCES: Atmospheric
Physical Geography: Patterns, Processes, and Interactions, Grade 11, University/College Expectations
 Geographic Foundations: Space and Systems SSV.01 explain major theories of the origin and internal structure of the earth; Page 1 SSV.02 demonstrate an understanding of the principal features of the earth
What is weathering and how does it change Earth s surface? Answer the question using
 7 th Grade Lesson What is weathering and how does it change Earth s surface? Answer the question using the sentence frame. You have 4 minutes. Weathering is. This changes the Earth s surface because. 1
Surface Water Short Study Guide
 Name: Class: Date: Surface Water Short Study Guide Multiple Choice Identify the letter of the choice that best completes the statement or answers the question. 1. The three ways in which a stream carries
How Will Melting Ice Sheets Affect Us?
 PASSAGE 4 How Will Melting Ice Sheets Affect Us? Variation is normal. During the last ice age, for example, ice sheets also covered much of North America and Scandinavia. Why is what s happening now different
Soil Formation. Lesson Plan: NRES B2-4
 Soil Formation Lesson Plan: NRES B2-4 1 Anticipated Problems 1. What are five different factors that affect soil formation? 2. What are some different types of parent material that affect soils? 3. What
Coastal Oceanography. Coastal Oceanography. Coastal Waters
 Coastal Oceanography Coastal Oceanography 95% of ocean life is in coastal waters (320 km from shore) Estuaries and wetlands are among most productive ecosystems on Earth Major shipping routes, oil and
Climate Change. Unit 3
 Climate Change Unit 3 Aims Is global warming a recent short term phenomenon or should it be seen as part of long term climate change? What evidence is there of long-, medium-, and short- term climate change?
Name: Date: Class: Louisiana: Our History, Our Home Chapter 1: Louisiana s Geography - Section 2: Natural Regions Guided Reading
 Instructions: Read the section and complete each item with words from the passages in this section. 1. The diversity of Louisiana s can surprise residents and visitors alike. 2. Physical geography is concerned
Future Climate Change
 Future Climate Change How do you know whether to trust a prediction about the future? All predictions are based on global circulation models (GCMs, AOGCMs) - model accuracy is verified by its ability to
Lesson 2. Antarctic Oceanography: Component I - Ice/Glaciers Component II - Marine Snow
 Lesson 2. Antarctic Oceanography: Component I - Ice/Glaciers Component II - Marine Snow Lesson Objectives: Introduces students to the different kinds of ice found in Antarctica, Students will become familiar
The surface of the ocean floor is as varied as the land. The five major oceans, from largest to smallest, are
 11.1 Ocean Basins The surface of the ocean floor is as varied as the land. The five major oceans, from largest to smallest, are w the Pacific w the Atlantic w the Indian w the Southern w the Arctic The
Geography is the study of the earth, it s land, it s people and it s environments. When you study geography, you should be looking at five distinct
 I.N pg. 9 Geography is the study of the earth, it s land, it s people and it s environments. When you study geography, you should be looking at five distinct themes. LOCATION PLACE REGION MOVEMENT HUMANENVIRONMENTAL
Topic 6: Weathering, Erosion and Erosional-Deposition Systems (workbook p ) Workbook Chapter 4, 5 WEATHERING
 Workbook Chapter 4, 5 WEATHERING") Topic 6: Weathering, Erosion and Erosional-Deposition Systems (workbook p. 95-125) Workbook Chapter 4, 5 THE BIG PICTURE: Weathering, erosion and deposition are processes that cause changes to rock material
Topic 6: Weathering, Erosion and Erosional-Deposition Systems (workbook p. 95-125) Workbook Chapter 4, 5 THE BIG PICTURE: Weathering, erosion and deposition are processes that cause changes to rock material
Chapter 2 Earth s Interlocking Systems pg The Earth and Its Forces pg
 Chapter 2 Earth s Interlocking Systems pg. 24 55 2 1 The Earth and Its Forces pg. 27 33 Connecting to Your World and Internal Forces Shaping the Earth The Earth is unique in the solar system because it
Climatic and Ecological Conditions in the Klamath Basin of Southern Oregon and Northern California: Projections for the Future
 Climatic and Ecological Conditions in the Klamath Basin of Southern Oregon and Northern California: Projections for the Future A Collaborative Effort by: CLIMATE LEADERSHIP INITIATIVE INSTITUTE FOR A SUSTAINABLE
Promoting Resilience to Changing Weather
 Promoting Resilience to Changing Weather Harpswell Neck Harpswell Sound Orr s Island Basin Cove Pott s Point Harpswell Conservation Commission March 30, 2017 What Does This Mean for Harpswell? Topography