Linear Regression. Volker Tresp 2018
|
|
|
- Aubrey Gallagher
- 5 years ago
- Views:
Transcription
1 Linear Regression Volker Tresp
2 Learning Machine: The Linear Model / ADALINE As with the Perceptron we start with an activation functions that is a linearly weighted sum of the inputs h = M j=0 w j x j (Note: x 0 = 1 is a constant input, so that w 0 is the bias) New: The activation is the output (no thresholding) ŷ = f w (x) = h Regression: the target function can take on real values 2
3 Method of Least Squares Squared-loss cost function: cost(w) = N (y i f w (x i )) 2 i=1 The parameters that minimize the cost function are called least squares (LS) estimators w ls = arg min w cost(w) For visualization, we take M = 1 (although linear regression is often applied to high-dimensional inputs) 3
4 One-dimensional regression: f w (x) = w 0 + w 1 x w = (w 0, w 1 ) T Squared error: Least-squares Estimator for Regression Goal: cost(w) = N (y i f w (x i )) 2 i=1 w ls = arg min w cost(w) w 0 = 1, w 1 = 2, var(ɛ) = 1 4
5 Least-squares Estimator in Several Dimensions General Model: ŷ i = f w (x i ) = w 0 + = x T i w M j=1 w j x i,j w = (w 0, w 1,... w M ) T x i = (1, x i,1,..., x i,m ) T 5
6 Linear Regression with Several Inputs 6
7 Contribution to the Cost Function of one Data Point 7
8 Predictions as Matrix-vector product The vector of all predictions at the training data is ŷ 1 ŷ = ŷ 2... = Xw ŷ N 8
9 Gradient Descent Learning Initialize parameters (typically using small random numbers) Adapt the parameters in the direction of the negative gradient With f w (x i ) = M j=0 w j x i,j cost(w) = N i=1 (y i f w (x i )) 2 The parameter gradient is (Example: w j ) cost w j N = 2 (y i f w (x i ))x i,j i=1 A sensible learning rule is w j w j + η N (y i f w (x i ))x i,j i=1 9
10 ADALINE-Learning Rule ADALINE: ADAptive LINear Element The ADALINE uses stochastic gradient descent (SGD) Let x t and y t be the training pattern in iteration t. The we adapt, t = 1, 2,... w j w j + η(y t ŷ t )x t,j j = 0, 1, 2,..., M η > 0 is the learning rate, typically 0 < η << 0.1 This is identical to the Perceptron learning rule. For the Perceptron y t { 1, 1}, ŷ t { 1, 1} 10
11 Analytic Solution The ADALINE is optimized by SGD Online Adaptation: a physical system constantly produces new data: the ADALINE (SGD in general) can even track changes in the system With a fixed training data set the least-squares solution can be calculated analytically in one step (least-squares regression) 11
12 Cost Function in Matrix Form cost(w) = N (y i f w (x i )) 2 i=1 = (y Xw) T (y Xw) y = (y 1,..., y N ) T X = x 1,0... x 1,M x N,0... x N,M 12
13 Necessary Condition for an Optimum A necessary condition for an optimum is that cost(w) w = 0 w=w opt 13
14 One Parameter: Explicit f w (x 1 ) = x 1 w 1 and cost(w 1 ) = N i=1 (y i x i,1 w 1 ) 2 (chain rule: inner derivative times outer derivative) cost(w 1 ) w 1 = N i=1 (y i x i,1 w 1 ) w 1 2(y i x i,1 w 1 ) N N N = 2 x i,1 (y i x i,1 w 1 ) = 2 x i,1 y i + 2w 1 x i,1 x i,1 i=1 i=1 i=1 Thus w 1,l = N x i,1 x i,1 1 N i=1 i=1 x i,1 y i 14
15 One Parameter: in Vector Notation f w (x 1 ) = x 1 w 1 and cost(w 1 ) = (y x 1 w 1 ) T (y x 1 w 1 ), where x 1 = (x 1,1,..., x N,1 ) T (chain rule: inner derivative times outer derivative) cost(w 1 ) w 1 = (y x 1w 1 ) w 1 2(y x 1 w 1 ) = 2 x T 1 (y x 1w 1 ) = 2 x T 1 y + 2w 1 x T 1 x 1 Thus w 1,ls = ( x T 1 x 1) 1 x T 1 y 15
16 General Case f w (x) = x T w and cost(w) = (y Xw) T (y Xw) (chain rule: inner derivative times outer derivative) cost(w) w = (y Xw) 2(y Xw) w = 2X T (y Xw) = 2X T y + 2wX T X Thus w ls = ( X T X) 1 X T y 16
17 Setting First Derivative to Zero ŵ ls = (X T X) 1 X T y Complexity (linear in N): O(M 3 + NM 2 ) ŵ 0 = 0.75, ŵ 1 =
18 Derivatives of Vector Products We have used Ax = AT x x xt x = 2x x xt Ax = (A + A T )x Comment: one also finds the conventions, x Ax = A x xt x = 2x T x xt Ax = x T (A + A T ) 18
19 Stability of the Solution When N >> M, the LS solution is stable (small changes in the data lead to small changes in the parameter estimates) When N < M then there are many solutions which all produce zero training error Of all these solutions, one selects the one that minimizes M i=0 w 2 i = wt w (regularised solution) Even with N > M it is advantageous to regularize the solution, in particular with noise on the target 19
20 Linear Regression and Regularisation Regularised cost function (Penalized Least Squares (PLS), Ridge Regression, Weight Decay): the influence of a single data point should be small cost pen (w) = N M (y i f w (x i )) 2 + λ i=1 i=0 w 2 i ŵ pen = ( X T X + λi) 1 X T y Derivation: cost pen (w) w = 2X T (y Xw) + 2λw = 2[ X T y + (X T X + λi)w] 20
21 ADALINE-Learning Rule with Weight Decay Let x t and y t be the training pattern in iteration t. Then we adapt, t = 1, 2,... w j w j + η[(y t ŷ t )x t,j λ N w j] j = 0, 1, 2,..., M 21
22 Toy Example: Univariate Model (Pearson Correlation Coefficient) We generated N = 100 data points with M = 3 (no bias) x 1 and x 2 are highly correlated. x 3 is independent from x 1, x 2, and y We generate output data with y = x 1 +ɛ, where ɛ stands for independent noise with standard deviation 0.2 and thus variance of Thus ground truth parameters are w true = (1, 0, 0) T. Note that, y causally only depends on x 1 All variables are normalized to 0 mean and variance 1. In unit variate models, with only one input, the weights are identical to the sample Pearson correlation coefficients (here: r j = i y ix i,j /N) between the output and the input, I get r 1 = 0.99, r 2 = 0.96, r 3 = 0.21 A deeper analysis (see Appendix) reveals that the estimate r 1 has a mean of 1 and a standard deviation of r 1 reflects the dependency of y on x 1 22
23 The second coefficient, r 2 = 0.96, does not reflect a causal effect, but reflects the fact that x 1 and x 2 are highly correlated, and thus also y and x 2 (correlation does not imply causality). A deeper analysis (see Appendix) reveals that with perfect correlation between x 1 and x 2, the estimate r 1 also would have a mean of 1 and a standard deviation of 0.02 The third value r 3 is correctly closer to 0, but not really small in magnitude. A deeper analysis (see Appendix) reveals that the estimate r 3 has a mean of 0 and a standard deviation of approximately of 0.1
24 Toy Example: Least Squares Regression We get experimentally: X T X = Approximately Ncov(x); we see the strong correlation between x 1 and x 2 (X T X) 1 = X T y = (99, 97, 20) T This is approximately Nr; we see the strong correlation between both x 1 and x 2 with y 23
25 Toy Example: Least Squares Regression (cont d) We get w ls = (X T X) 1 X T y = (1.137, 0.150, 0.018) T Interestingly, linear regression pretty much identifies the correct causality, with w ls,1 1 and w ls,2 0! A deeper analysis (see Appendix) reveals that w ls,1 has a mean of 1 and a standard deviation of 0.1. So the estimator is unbiased but the uncertainty is larger then in the unit variate analysis ŵ 2 has mean of zero and a standard deviation of 0.1. Thus the bias is removed if compared to Pearson! w ls,1 and w ls,2 are negatively correlated. Note, that w ls,1 +w ls,2 = which is close to the true 1. w ls,3 = is much closer to 0 than the sample Pearson correlation coefficient r 3 =
26 A deeper analysis (see Appendix) reveals that w ls,3 has a mean of 0 and a standard deviation of Here it is important to see that the standard deviation of the spurious input is largely reduced! Intuitive explanation: Consider that I can write the cost function as i ([y i w 1 x i,1 w 2 x i,2 ] w 3 x i,3 ). Thus w 3 x i,3 only needs to fit the residual target [y i w 1 x i,1 w 2 x i,2 ] instead of the original target y i. Overall, in regression, the causal influence of x 1 stands out much more clearly! Both the influence of the correlated input x 2 and the noise input x 3 are largely reduced Application in healthcare: Same data. Consider that x 2 is a medication and y the outcome. If I do a univariate analysis, I would see a strong positive influence of x 2 on y (the medication works). Only if I include the so-called confounder x 1 in the regression model, it becomes clear that the confounder x 1 is the cause and not the treatment x 2. The treatment has no significant effect!
27
28 Toy Example: Penalized Least Squares Regression We get with λ = 0.6: X T X + λi = (X T X + λi) 1 = X T y = (99, 97, 20) T w pen = (X T X + λi) 1 X T y = (0.990, 0.005, 0.021) T Note that w pen,2 is even closer to ground truth! 25
29
30
31 Remarks The Pearson correlation coefficient does not reflect causality The regression coefficients display causal behavior, much more closely If one is only interested in prediction accuracy: adding inputs liberally in regression can be beneficial if regularization is used (in ad placements and ad bidding, hundreds or thousands of features are used) The weight parameters of useless (noisy) features become close to zero with regularization (ill-conditioned parameters) Regularization is especially important when N M, and N < M If parameter interpretation is essential or if, for computational reasons, one wants to keep the number of inputs small: Forward selection; start with the empty model; at each step add the input that reduces the error most 26
32 Backward selection (pruning); start with the full model; at each step remove the input that increases the error the least But no guarantee, that one finds the best subset of inputs or that one finds the true inputs
33 Experiments with Real World Data: Data from Prostate Cancer Patients 8 Inputs, 97 data points; y: Prostate-specific antigen 10-times cross validation error LS Best Subset (3) Ridge (Penalized)
34 Examples where High-dimensional Linear Systems are Used Ranking in search engines (relevance of a web page to a query) Ad placements: where to put which ad for a user GWAS 28
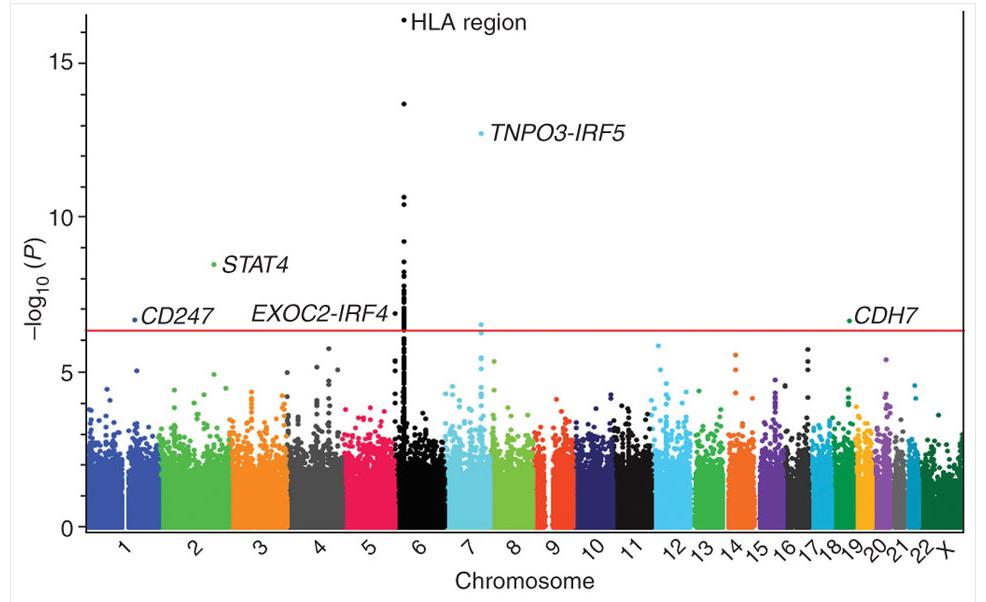
35 Genome-wide Association Study (GWAS) Trait (here: the disease systemic sclerosis) is the output and the SNPs are the inputs The major allele is encoded as 0 and the minor allele as 1. Thus w j is the influence of SNP j on the trait. Shown is the (log of the p-value) of w j ordered by the locations on the chromosomes. The weights can be calculated by penalized least squares (ridge regression) Solely based on the Pearson correlation, the plot would show many more (non-causal) associations. The regression analysis reduces the apparent influence of noncausal correlated inputs and the influence of uncorrelated inputs In practice one often uses an elastic net penalty: λ 2 j w2 j + λ 1 j w j where the lasso penalty λ 1 j w j increases sparsity 29
36
37 Appendix: A Deeper Analysis of Pearson versus Regression* The Pearson correlation coefficient is in the mean approximately (1, 1, 0). The variance of r 1, and r 2 can be estimated as var = σ 2 /N = 0.04/100 = and standard deviation stdev = var = For r 3 we get a variance var(r 3 ) = var(y)/n = 1/N = 0.01, and a standard deviation of stdev(r 3 ) = 0.1. Comment: r 2 does not reflect the true dependency; the variance of r 3 is relatively large. Since linear regression is unbiased, the parameter estimates have mean 1, 0, 0 (unbiased solutions). We get for the covariances cov(w ls ) = σ 2 (X T X) 1 The variances are then (we consider the diagonal terms) var(w ls,1 ) = var(w ls,2 ) = 0.01 var(w ls,3 ) = , 30
38 and stdev(w ls,1 ) = stdev(w ls,2 ) 0.2 stdev(w ls,3 ) 0.02 Thus the estimates are unbiased; the uncertainty of w ls,3 is greatly reduced and thus closer to zero!
Linear Regression. Volker Tresp 2014
 Linear Regression Volker Tresp 2014 1 Learning Machine: The Linear Model / ADALINE As with the Perceptron we start with an activation functions that is a linearly weighted sum of the inputs h i = M 1 j=0
Association studies and regression
 Association studies and regression CM226: Machine Learning for Bioinformatics. Fall 2016 Sriram Sankararaman Acknowledgments: Fei Sha, Ameet Talwalkar Association studies and regression 1 / 104 Administration
CS 4491/CS 7990 SPECIAL TOPICS IN BIOINFORMATICS
 CS 4491/CS 7990 SPECIAL TOPICS IN BIOINFORMATICS * Some contents are adapted from Dr. Hung Huang and Dr. Chengkai Li at UT Arlington Mingon Kang, Ph.D. Computer Science, Kennesaw State University Problems
Linear Regression (continued)
") Linear Regression (continued) Professor Ameet Talwalkar Professor Ameet Talwalkar CS260 Machine Learning Algorithms February 6, 2017 1 / 39 Outline 1 Administration 2 Review of last lecture 3 Linear regression
Linear Regression (continued) Professor Ameet Talwalkar Professor Ameet Talwalkar CS260 Machine Learning Algorithms February 6, 2017 1 / 39 Outline 1 Administration 2 Review of last lecture 3 Linear regression
Linear regression methods
 Linear regression methods Most of our intuition about statistical methods stem from linear regression. For observations i = 1,..., n, the model is Y i = p X ij β j + ε i, j=1 where Y i is the response
COMP 551 Applied Machine Learning Lecture 3: Linear regression (cont d)
") COMP 551 Applied Machine Learning Lecture 3: Linear regression (cont d) Instructor: Herke van Hoof (herke.vanhoof@mail.mcgill.ca) Slides mostly by: Class web page: www.cs.mcgill.ca/~hvanho2/comp551 Unless
COMP 551 Applied Machine Learning Lecture 3: Linear regression (cont d) Instructor: Herke van Hoof (herke.vanhoof@mail.mcgill.ca) Slides mostly by: Class web page: www.cs.mcgill.ca/~hvanho2/comp551 Unless
SCMA292 Mathematical Modeling : Machine Learning. Krikamol Muandet. Department of Mathematics Faculty of Science, Mahidol University.
 SCMA292 Mathematical Modeling : Machine Learning Krikamol Muandet Department of Mathematics Faculty of Science, Mahidol University February 9, 2016 Outline Quick Recap of Least Square Ridge Regression
Early Brain Damage. Volker Tresp, Ralph Neuneier and Hans Georg Zimmermann Siemens AG, Corporate Technologies Otto-Hahn-Ring München, Germany
 Early Brain Damage Volker Tresp, Ralph Neuneier and Hans Georg Zimmermann Siemens AG, Corporate Technologies Otto-Hahn-Ring 6 81730 München, Germany Abstract Optimal Brain Damage (OBD is a method for reducing
Linear Methods for Regression. Lijun Zhang
 Linear Methods for Regression Lijun Zhang zlj@nju.edu.cn http://cs.nju.edu.cn/zlj Outline Introduction Linear Regression Models and Least Squares Subset Selection Shrinkage Methods Methods Using Derived
Ridge Regression 1. to which some random noise is added. So that the training labels can be represented as:
 CS 1: Machine Learning Spring 15 College of Computer and Information Science Northeastern University Lecture 3 February, 3 Instructor: Bilal Ahmed Scribe: Bilal Ahmed & Virgil Pavlu 1 Introduction Ridge
6. Regularized linear regression
 Foundations of Machine Learning École Centrale Paris Fall 2015 6. Regularized linear regression Chloé-Agathe Azencot Centre for Computational Biology, Mines ParisTech chloe agathe.azencott@mines paristech.fr
Classification Logistic Regression
 Announcements: Classification Logistic Regression Machine Learning CSE546 Sham Kakade University of Washington HW due on Friday. Today: Review: sub-gradients,lasso Logistic Regression October 3, 26 Sham
4 Bias-Variance for Ridge Regression (24 points)
") Implement Ridge Regression with λ = 0.00001. Plot the Squared Euclidean test error for the following values of k (the dimensions you reduce to): k = {0, 50, 100, 150, 200, 250, 300, 350, 400, 450, 500,
Implement Ridge Regression with λ = 0.00001. Plot the Squared Euclidean test error for the following values of k (the dimensions you reduce to): k = {0, 50, 100, 150, 200, 250, 300, 350, 400, 450, 500,
MLCC 2018 Variable Selection and Sparsity. Lorenzo Rosasco UNIGE-MIT-IIT
 MLCC 2018 Variable Selection and Sparsity Lorenzo Rosasco UNIGE-MIT-IIT Outline Variable Selection Subset Selection Greedy Methods: (Orthogonal) Matching Pursuit Convex Relaxation: LASSO & Elastic Net
Introduction to Machine Learning
 Introduction to Machine Learning Linear Regression Varun Chandola Computer Science & Engineering State University of New York at Buffalo Buffalo, NY, USA chandola@buffalo.edu Chandola@UB CSE 474/574 1
Sparse regression. Optimization-Based Data Analysis. Carlos Fernandez-Granda
 Sparse regression Optimization-Based Data Analysis http://www.cims.nyu.edu/~cfgranda/pages/obda_spring16 Carlos Fernandez-Granda 3/28/2016 Regression Least-squares regression Example: Global warming Logistic
Linear Models for Regression CS534
 Linear Models for Regression CS534 Prediction Problems Predict housing price based on House size, lot size, Location, # of rooms Predict stock price based on Price history of the past month Predict the
Direct Learning: Linear Regression. Donglin Zeng, Department of Biostatistics, University of North Carolina
 Direct Learning: Linear Regression Parametric learning We consider the core function in the prediction rule to be a parametric function. The most commonly used function is a linear function: squared loss:
DATA MINING AND MACHINE LEARNING
 DATA MINING AND MACHINE LEARNING Lecture 5: Regularization and loss functions Lecturer: Simone Scardapane Academic Year 2016/2017 Table of contents Loss functions Loss functions for regression problems
Regression. Goal: Learn a mapping from observations (features) to continuous labels given a training set (supervised learning)
 to continuous labels given a training set (supervised learning)") Linear Regression Regression Goal: Learn a mapping from observations (features) to continuous labels given a training set (supervised learning) Example: Height, Gender, Weight Shoe Size Audio features
Linear Regression Regression Goal: Learn a mapping from observations (features) to continuous labels given a training set (supervised learning) Example: Height, Gender, Weight Shoe Size Audio features
Mark your answers ON THE EXAM ITSELF. If you are not sure of your answer you may wish to provide a brief explanation.
 CS 189 Spring 2015 Introduction to Machine Learning Midterm You have 80 minutes for the exam. The exam is closed book, closed notes except your one-page crib sheet. No calculators or electronic items.
Machine Learning for OR & FE
 Machine Learning for OR & FE Regression II: Regularization and Shrinkage Methods Martin Haugh Department of Industrial Engineering and Operations Research Columbia University Email: martin.b.haugh@gmail.com
Regression. Goal: Learn a mapping from observations (features) to continuous labels given a training set (supervised learning)
 to continuous labels given a training set (supervised learning)") Linear Regression Regression Goal: Learn a mapping from observations (features) to continuous labels given a training set (supervised learning) Example: Height, Gender, Weight Shoe Size Audio features
Linear Regression Regression Goal: Learn a mapping from observations (features) to continuous labels given a training set (supervised learning) Example: Height, Gender, Weight Shoe Size Audio features
Regression, Ridge Regression, Lasso
 Regression, Ridge Regression, Lasso Fabio G. Cozman - fgcozman@usp.br October 2, 2018 A general definition Regression studies the relationship between a response variable Y and covariates X 1,..., X n.
The Equivalence between Row and Column Linear Regression: A Surprising Feature of Linear Regression Updated Version 2.
 The Equivalence between Row and Column Linear Regression: A Surprising Feature of Linear Regression Updated Version 2.0, October 2005 Volker Tresp Siemens Corporate Technology Department of Information
The Perceptron. Volker Tresp Summer 2014
 The Perceptron Volker Tresp Summer 2014 1 Introduction One of the first serious learning machines Most important elements in learning tasks Collection and preprocessing of training data Definition of a
Neural Networks. Volker Tresp Summer 2015
 Neural Networks Volker Tresp Summer 2015 1 Introduction The performance of a classifier or a regression model critically depends on the choice of appropriate basis functions The problem with generic basis
Is the test error unbiased for these programs? 2017 Kevin Jamieson
 Is the test error unbiased for these programs? 2017 Kevin Jamieson 1 Is the test error unbiased for this program? 2017 Kevin Jamieson 2 Simple Variable Selection LASSO: Sparse Regression Machine Learning
LASSO Review, Fused LASSO, Parallel LASSO Solvers
 Case Study 3: fmri Prediction LASSO Review, Fused LASSO, Parallel LASSO Solvers Machine Learning for Big Data CSE547/STAT548, University of Washington Sham Kakade May 3, 2016 Sham Kakade 2016 1 Variable
Optimization and Gradient Descent
 Optimization and Gradient Descent INFO-4604, Applied Machine Learning University of Colorado Boulder September 12, 2017 Prof. Michael Paul Prediction Functions Remember: a prediction function is the function
Machine Learning for Biomedical Engineering. Enrico Grisan
 Machine Learning for Biomedical Engineering Enrico Grisan enrico.grisan@dei.unipd.it Curse of dimensionality Why are more features bad? Redundant features (useless or confounding) Hard to interpret and
ECE521 lecture 4: 19 January Optimization, MLE, regularization
 ECE521 lecture 4: 19 January 2017 Optimization, MLE, regularization First four lectures Lectures 1 and 2: Intro to ML Probability review Types of loss functions and algorithms Lecture 3: KNN Convexity
Apprentissage, réseaux de neurones et modèles graphiques (RCP209) Neural Networks and Deep Learning
 Neural Networks and Deep Learning") Apprentissage, réseaux de neurones et modèles graphiques (RCP209) Neural Networks and Deep Learning Nicolas Thome Prenom.Nom@cnam.fr http://cedric.cnam.fr/vertigo/cours/ml2/ Département Informatique Conservatoire
Apprentissage, réseaux de neurones et modèles graphiques (RCP209) Neural Networks and Deep Learning Nicolas Thome Prenom.Nom@cnam.fr http://cedric.cnam.fr/vertigo/cours/ml2/ Département Informatique Conservatoire
ECE521 week 3: 23/26 January 2017
 ECE521 week 3: 23/26 January 2017 Outline Probabilistic interpretation of linear regression - Maximum likelihood estimation (MLE) - Maximum a posteriori (MAP) estimation Bias-variance trade-off Linear
GI07/COMPM012: Mathematical Programming and Research Methods (Part 2) 2. Least Squares and Principal Components Analysis. Massimiliano Pontil
 2. Least Squares and Principal Components Analysis. Massimiliano Pontil") GI07/COMPM012: Mathematical Programming and Research Methods (Part 2) 2. Least Squares and Principal Components Analysis Massimiliano Pontil 1 Today s plan SVD and principal component analysis (PCA) Connection
GI07/COMPM012: Mathematical Programming and Research Methods (Part 2) 2. Least Squares and Principal Components Analysis Massimiliano Pontil 1 Today s plan SVD and principal component analysis (PCA) Connection
Case Study 1: Estimating Click Probabilities. Kakade Announcements: Project Proposals: due this Friday!
 Case Study 1: Estimating Click Probabilities Intro Logistic Regression Gradient Descent + SGD Machine Learning for Big Data CSE547/STAT548, University of Washington Sham Kakade April 4, 017 1 Announcements:
CS540 Machine learning Lecture 5
 CS540 Machine learning Lecture 5 1 Last time Basis functions for linear regression Normal equations QR SVD - briefly 2 This time Geometry of least squares (again) SVD more slowly LMS Ridge regression 3
Introduction to Machine Learning
 Introduction to Machine Learning Thomas G. Dietterich tgd@eecs.oregonstate.edu 1 Outline What is Machine Learning? Introduction to Supervised Learning: Linear Methods Overfitting, Regularization, and the
ECS171: Machine Learning
 ECS171: Machine Learning Lecture 4: Optimization (LFD 3.3, SGD) Cho-Jui Hsieh UC Davis Jan 22, 2018 Gradient descent Optimization Goal: find the minimizer of a function min f (w) w For now we assume f
Linear Models in Machine Learning
 CS540 Intro to AI Linear Models in Machine Learning Lecturer: Xiaojin Zhu jerryzhu@cs.wisc.edu We briefly go over two linear models frequently used in machine learning: linear regression for, well, regression,
Sparse Linear Models (10/7/13)
") STA56: Probabilistic machine learning Sparse Linear Models (0/7/) Lecturer: Barbara Engelhardt Scribes: Jiaji Huang, Xin Jiang, Albert Oh Sparsity Sparsity has been a hot topic in statistics and machine
STA56: Probabilistic machine learning Sparse Linear Models (0/7/) Lecturer: Barbara Engelhardt Scribes: Jiaji Huang, Xin Jiang, Albert Oh Sparsity Sparsity has been a hot topic in statistics and machine
Linear & nonlinear classifiers
 Linear & nonlinear classifiers Machine Learning Hamid Beigy Sharif University of Technology Fall 1396 Hamid Beigy (Sharif University of Technology) Linear & nonlinear classifiers Fall 1396 1 / 44 Table
CS260: Machine Learning Algorithms
 CS260: Machine Learning Algorithms Lecture 4: Stochastic Gradient Descent Cho-Jui Hsieh UCLA Jan 16, 2019 Large-scale Problems Machine learning: usually minimizing the training loss min w { 1 N min w {
Lecture 5: Logistic Regression. Neural Networks
 Lecture 5: Logistic Regression. Neural Networks Logistic regression Comparison with generative models Feed-forward neural networks Backpropagation Tricks for training neural networks COMP-652, Lecture
The Perceptron. Volker Tresp Summer 2018
 The Perceptron Volker Tresp Summer 2018 1 Elements in Learning Tasks Collection, cleaning and preprocessing of training data Definition of a class of learning models. Often defined by the free model parameters
Machine Learning. Regularization and Feature Selection. Fabio Vandin November 13, 2017
 Machine Learning Regularization and Feature Selection Fabio Vandin November 13, 2017 1 Learning Model A: learning algorithm for a machine learning task S: m i.i.d. pairs z i = (x i, y i ), i = 1,..., m,
These slides follow closely the (English) course textbook Pattern Recognition and Machine Learning by Christopher Bishop
 course textbook Pattern Recognition and Machine Learning by Christopher Bishop") Music and Machine Learning (IFT68 Winter 8) Prof. Douglas Eck, Université de Montréal These slides follow closely the (English) course textbook Pattern Recognition and Machine Learning by Christopher Bishop
Music and Machine Learning (IFT68 Winter 8) Prof. Douglas Eck, Université de Montréal These slides follow closely the (English) course textbook Pattern Recognition and Machine Learning by Christopher Bishop
Midterm. Introduction to Machine Learning. CS 189 Spring Please do not open the exam before you are instructed to do so.
 CS 89 Spring 07 Introduction to Machine Learning Midterm Please do not open the exam before you are instructed to do so. The exam is closed book, closed notes except your one-page cheat sheet. Electronic
MSA220/MVE440 Statistical Learning for Big Data
 MSA220/MVE440 Statistical Learning for Big Data Lecture 7/8 - High-dimensional modeling part 1 Rebecka Jörnsten Mathematical Sciences University of Gothenburg and Chalmers University of Technology Classification
25 : Graphical induced structured input/output models
 10-708: Probabilistic Graphical Models 10-708, Spring 2013 25 : Graphical induced structured input/output models Lecturer: Eric P. Xing Scribes: Meghana Kshirsagar (mkshirsa), Yiwen Chen (yiwenche) 1 Graph
Logistic Regression Logistic
 Case Study 1: Estimating Click Probabilities L2 Regularization for Logistic Regression Machine Learning/Statistics for Big Data CSE599C1/STAT592, University of Washington Carlos Guestrin January 10 th,
Classification CE-717: Machine Learning Sharif University of Technology. M. Soleymani Fall 2012
 Classification CE-717: Machine Learning Sharif University of Technology M. Soleymani Fall 2012 Topics Discriminant functions Logistic regression Perceptron Generative models Generative vs. discriminative
Lasso, Ridge, and Elastic Net
 Lasso, Ridge, and Elastic Net David Rosenberg New York University February 7, 2017 David Rosenberg (New York University) DS-GA 1003 February 7, 2017 1 / 29 Linearly Dependent Features Linearly Dependent
Ad Placement Strategies
 Case Study : Estimating Click Probabilities Intro Logistic Regression Gradient Descent + SGD AdaGrad Machine Learning for Big Data CSE547/STAT548, University of Washington Emily Fox January 7 th, 04 Ad
Summary and discussion of: Dropout Training as Adaptive Regularization
 Summary and discussion of: Dropout Training as Adaptive Regularization Statistics Journal Club, 36-825 Kirstin Early and Calvin Murdock November 21, 2014 1 Introduction Multi-layered (i.e. deep) artificial
Overfitting, Bias / Variance Analysis
 Overfitting, Bias / Variance Analysis Professor Ameet Talwalkar Professor Ameet Talwalkar CS260 Machine Learning Algorithms February 8, 207 / 40 Outline Administration 2 Review of last lecture 3 Basic
Linear classifiers: Overfitting and regularization
 Linear classifiers: Overfitting and regularization Emily Fox University of Washington January 25, 2017 Logistic regression recap 1 . Thus far, we focused on decision boundaries Score(x i ) = w 0 h 0 (x
Midterm. Introduction to Machine Learning. CS 189 Spring You have 1 hour 20 minutes for the exam.
 CS 189 Spring 2013 Introduction to Machine Learning Midterm You have 1 hour 20 minutes for the exam. The exam is closed book, closed notes except your one-page crib sheet. Please use non-programmable calculators
Machine Learning. Support Vector Machines. Fabio Vandin November 20, 2017
 Machine Learning Support Vector Machines Fabio Vandin November 20, 2017 1 Classification and Margin Consider a classification problem with two classes: instance set X = R d label set Y = { 1, 1}. Training
The perceptron learning algorithm is one of the first procedures proposed for learning in neural network models and is mostly credited to Rosenblatt.
 1 The perceptron learning algorithm is one of the first procedures proposed for learning in neural network models and is mostly credited to Rosenblatt. The algorithm applies only to single layer models
MIDTERM: CS 6375 INSTRUCTOR: VIBHAV GOGATE October,
 MIDTERM: CS 6375 INSTRUCTOR: VIBHAV GOGATE October, 23 2013 The exam is closed book. You are allowed a one-page cheat sheet. Answer the questions in the spaces provided on the question sheets. If you run
Machine Learning Basics III
 Machine Learning Basics III Benjamin Roth CIS LMU München Benjamin Roth (CIS LMU München) Machine Learning Basics III 1 / 62 Outline 1 Classification Logistic Regression 2 Gradient Based Optimization Gradient
ESS2222. Lecture 4 Linear model
 ESS2222 Lecture 4 Linear model Hosein Shahnas University of Toronto, Department of Earth Sciences, 1 Outline Logistic Regression Predicting Continuous Target Variables Support Vector Machine (Some Details)
Lecture 14 : Online Learning, Stochastic Gradient Descent, Perceptron
 CS446: Machine Learning, Fall 2017 Lecture 14 : Online Learning, Stochastic Gradient Descent, Perceptron Lecturer: Sanmi Koyejo Scribe: Ke Wang, Oct. 24th, 2017 Agenda Recap: SVM and Hinge loss, Representer
CSCI567 Machine Learning (Fall 2014)
") CSCI567 Machine Learning (Fall 24) Drs. Sha & Liu {feisha,yanliu.cs}@usc.edu October 2, 24 Drs. Sha & Liu ({feisha,yanliu.cs}@usc.edu) CSCI567 Machine Learning (Fall 24) October 2, 24 / 24 Outline Review
CSCI567 Machine Learning (Fall 24) Drs. Sha & Liu {feisha,yanliu.cs}@usc.edu October 2, 24 Drs. Sha & Liu ({feisha,yanliu.cs}@usc.edu) CSCI567 Machine Learning (Fall 24) October 2, 24 / 24 Outline Review
Multiple regression. CM226: Machine Learning for Bioinformatics. Fall Sriram Sankararaman Acknowledgments: Fei Sha, Ameet Talwalkar
 Multiple regression CM226: Machine Learning for Bioinformatics. Fall 2016 Sriram Sankararaman Acknowledgments: Fei Sha, Ameet Talwalkar Multiple regression 1 / 36 Previous two lectures Linear and logistic
Prediction & Feature Selection in GLM
 Tarigan Statistical Consulting & Coaching statistical-coaching.ch Doctoral Program in Computer Science of the Universities of Fribourg, Geneva, Lausanne, Neuchâtel, Bern and the EPFL Hands-on Data Analysis
Regularized Regression A Bayesian point of view
 Regularized Regression A Bayesian point of view Vincent MICHEL Director : Gilles Celeux Supervisor : Bertrand Thirion Parietal Team, INRIA Saclay Ile-de-France LRI, Université Paris Sud CEA, DSV, I2BM,
Lasso Regression: Regularization for feature selection
 Lasso Regression: Regularization for feature selection Emily Fox University of Washington January 18, 2017 Feature selection task 1 Why might you want to perform feature selection? Efficiency: - If size(w)
Biostatistics-Lecture 16 Model Selection. Ruibin Xi Peking University School of Mathematical Sciences
 Biostatistics-Lecture 16 Model Selection Ruibin Xi Peking University School of Mathematical Sciences Motivating example1 Interested in factors related to the life expectancy (50 US states,1969-71 ) Per
The Perceptron. Volker Tresp Summer 2016
 The Perceptron Volker Tresp Summer 2016 1 Elements in Learning Tasks Collection, cleaning and preprocessing of training data Definition of a class of learning models. Often defined by the free model parameters
Lab 5: 16 th April Exercises on Neural Networks
 Lab 5: 16 th April 01 Exercises on Neural Networks 1. What are the values of weights w 0, w 1, and w for the perceptron whose decision surface is illustrated in the figure? Assume the surface crosses the
Mark Gales October y (x) x 1. x 2 y (x) Inputs. Outputs. x d. y (x) Second Output layer layer. layer.
 x 1. x 2 y (x) Inputs. Outputs. x d. y (x) Second Output layer layer. layer.") University of Cambridge Engineering Part IIB & EIST Part II Paper I0: Advanced Pattern Processing Handouts 4 & 5: Multi-Layer Perceptron: Introduction and Training x y (x) Inputs x 2 y (x) 2 Outputs x
University of Cambridge Engineering Part IIB & EIST Part II Paper I0: Advanced Pattern Processing Handouts 4 & 5: Multi-Layer Perceptron: Introduction and Training x y (x) Inputs x 2 y (x) 2 Outputs x
ESL Chap3. Some extensions of lasso
 ESL Chap3 Some extensions of lasso 1 Outline Consistency of lasso for model selection Adaptive lasso Elastic net Group lasso 2 Consistency of lasso for model selection A number of authors have studied
Linear Models for Regression. Sargur Srihari
 Linear Models for Regression Sargur srihari@cedar.buffalo.edu 1 Topics in Linear Regression What is regression? Polynomial Curve Fitting with Scalar input Linear Basis Function Models Maximum Likelihood
Machine Learning CSE546 Carlos Guestrin University of Washington. October 7, Efficiency: If size(w) = 100B, each prediction is expensive:
 = 100B, each prediction is expensive:") Simple Variable Selection LASSO: Sparse Regression Machine Learning CSE546 Carlos Guestrin University of Washington October 7, 2013 1 Sparsity Vector w is sparse, if many entries are zero: Very useful
Simple Variable Selection LASSO: Sparse Regression Machine Learning CSE546 Carlos Guestrin University of Washington October 7, 2013 1 Sparsity Vector w is sparse, if many entries are zero: Very useful
25 : Graphical induced structured input/output models
 10-708: Probabilistic Graphical Models 10-708, Spring 2016 25 : Graphical induced structured input/output models Lecturer: Eric P. Xing Scribes: Raied Aljadaany, Shi Zong, Chenchen Zhu Disclaimer: A large
Machine learning - HT Basis Expansion, Regularization, Validation
 Machine learning - HT 016 4. Basis Expansion, Regularization, Validation Varun Kanade University of Oxford Feburary 03, 016 Outline Introduce basis function to go beyond linear regression Understanding
Big Data Analytics: Optimization and Randomization
 Big Data Analytics: Optimization and Randomization Tianbao Yang Tutorial@ACML 2015 Hong Kong Department of Computer Science, The University of Iowa, IA, USA Nov. 20, 2015 Yang Tutorial for ACML 15 Nov.
l 1 and l 2 Regularization
 David Rosenberg New York University February 5, 2015 David Rosenberg (New York University) DS-GA 1003 February 5, 2015 1 / 32 Tikhonov and Ivanov Regularization Hypothesis Spaces We ve spoken vaguely about
Linear Regression Linear Regression with Shrinkage
 Linear Regression Linear Regression ith Shrinkage Introduction Regression means predicting a continuous (usually scalar) output y from a vector of continuous inputs (features) x. Example: Predicting vehicle
ECS289: Scalable Machine Learning
 ECS289: Scalable Machine Learning Cho-Jui Hsieh UC Davis Sept 29, 2016 Outline Convex vs Nonconvex Functions Coordinate Descent Gradient Descent Newton s method Stochastic Gradient Descent Numerical Optimization
Lecture 4: Perceptrons and Multilayer Perceptrons
 Lecture 4: Perceptrons and Multilayer Perceptrons Cognitive Systems II - Machine Learning SS 2005 Part I: Basic Approaches of Concept Learning Perceptrons, Artificial Neuronal Networks Lecture 4: Perceptrons
Lecture 3: More on regularization. Bayesian vs maximum likelihood learning
 Lecture 3: More on regularization. Bayesian vs maximum likelihood learning L2 and L1 regularization for linear estimators A Bayesian interpretation of regularization Bayesian vs maximum likelihood fitting
Multilayer Perceptron
 Outline Hong Chang Institute of Computing Technology, Chinese Academy of Sciences Machine Learning Methods (Fall 2012) Outline Outline I 1 Introduction 2 Single Perceptron 3 Boolean Function Learning 4
Ad Placement Strategies
 Case Study 1: Estimating Click Probabilities Tackling an Unknown Number of Features with Sketching Machine Learning for Big Data CSE547/STAT548, University of Washington Emily Fox 2014 Emily Fox January
Optimization in the Big Data Regime 2: SVRG & Tradeoffs in Large Scale Learning. Sham M. Kakade
 Optimization in the Big Data Regime 2: SVRG & Tradeoffs in Large Scale Learning. Sham M. Kakade Machine Learning for Big Data CSE547/STAT548 University of Washington S. M. Kakade (UW) Optimization for
EXAM IN STATISTICAL MACHINE LEARNING STATISTISK MASKININLÄRNING
 EXAM IN STATISTICAL MACHINE LEARNING STATISTISK MASKININLÄRNING DATE AND TIME: August 30, 2018, 14.00 19.00 RESPONSIBLE TEACHER: Niklas Wahlström NUMBER OF PROBLEMS: 5 AIDING MATERIAL: Calculator, mathematical
CS6220: DATA MINING TECHNIQUES
 CS6220: DATA MINING TECHNIQUES Matrix Data: Prediction Instructor: Yizhou Sun yzsun@ccs.neu.edu September 14, 2014 Today s Schedule Course Project Introduction Linear Regression Model Decision Tree 2 Methods
Warm up. Regrade requests submitted directly in Gradescope, do not instructors.
 Warm up Regrade requests submitted directly in Gradescope, do not email instructors. 1 float in NumPy = 8 bytes 10 6 2 20 bytes = 1 MB 10 9 2 30 bytes = 1 GB For each block compute the memory required
Ridge Regression: Regulating overfitting when using many features. Training, true, & test error vs. model complexity. CSE 446: Machine Learning
 Ridge Regression: Regulating overfitting when using many features Emily Fox University of Washington January 3, 207 Training, true, & test error vs. model complexity Overfitting if: Error y Model complexity
A Significance Test for the Lasso
 A Significance Test for the Lasso Lockhart R, Taylor J, Tibshirani R, and Tibshirani R Ashley Petersen May 14, 2013 1 Last time Problem: Many clinical covariates which are important to a certain medical
Dimension Reduction Methods
 Dimension Reduction Methods And Bayesian Machine Learning Marek Petrik 2/28 Previously in Machine Learning How to choose the right features if we have (too) many options Methods: 1. Subset selection 2.
Feature Engineering, Model Evaluations
 Feature Engineering, Model Evaluations Giri Iyengar Cornell University gi43@cornell.edu Feb 5, 2018 Giri Iyengar (Cornell Tech) Feature Engineering Feb 5, 2018 1 / 35 Overview 1 ETL 2 Feature Engineering
Lasso, Ridge, and Elastic Net
 Lasso, Ridge, and Elastic Net David Rosenberg New York University October 29, 2016 David Rosenberg (New York University) DS-GA 1003 October 29, 2016 1 / 14 A Very Simple Model Suppose we have one feature
Machine Learning and Computational Statistics, Spring 2017 Homework 2: Lasso Regression
 Machine Learning and Computational Statistics, Spring 2017 Homework 2: Lasso Regression Due: Monday, February 13, 2017, at 10pm (Submit via Gradescope) Instructions: Your answers to the questions below,
Biostatistics Advanced Methods in Biostatistics IV
 Biostatistics 140.754 Advanced Methods in Biostatistics IV Jeffrey Leek Assistant Professor Department of Biostatistics jleek@jhsph.edu Lecture 12 1 / 36 Tip + Paper Tip: As a statistician the results
STA141C: Big Data & High Performance Statistical Computing
 STA141C: Big Data & High Performance Statistical Computing Lecture 8: Optimization Cho-Jui Hsieh UC Davis May 9, 2017 Optimization Numerical Optimization Numerical Optimization: min X f (X ) Can be applied
Comments. Assignment 3 code released. Thought questions 3 due this week. Mini-project: hopefully you have started. implement classification algorithms
 Neural networks Comments Assignment 3 code released implement classification algorithms use kernels for census dataset Thought questions 3 due this week Mini-project: hopefully you have started 2 Example:
CSC242: Intro to AI. Lecture 21
 CSC242: Intro to AI Lecture 21 Administrivia Project 4 (homeworks 18 & 19) due Mon Apr 16 11:59PM Posters Apr 24 and 26 You need an idea! You need to present it nicely on 2-wide by 4-high landscape pages