Probabilistic verification
|
|
|
- Sherman Hicks
- 5 years ago
- Views:
Transcription
1 Probabilistic verification Chiara Marsigli with the help of the WG and Laurie Wilson in particular
2 Goals of this session Increase understanding of scores used for probability forecast verification Characteristics, strengths and weaknesses Know which scores to choose for different verification questions
3 Topics Introduction: review of essentials of probability forecasts for verification Brier score: Accuracy Brier skill score: Skill Reliability Diagrams: Reliability, resolution and sharpness Discrimination Exercise Relative operating characteristic Exercise Exercise Ensembles: The CRPS and Rank Histogram
4 Probability forecast Applies to a specific, completely defined event Examples: Probability of precipitation over 6h Question: What does a probability forecast POP for Melbourne for today (6am to 6pm) is 0.40 mean?

5 Deterministic approach Weather forecast:
6 Probabilistic approach Weather forecast: 50% 30% 20%?

7 Deterministic approach Weather forecast:
8 Probabilistic approach 20%

9 Probabilistic approach 20%
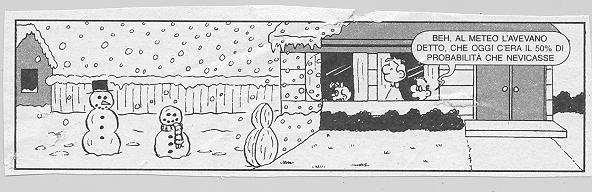
10 Probabilistic approach
11 Deterministic forecast event E e. g.: 24 h accumulated precipitation on one point (raingauge, radar pixel, catchment, area) exceeds 20 mm no o(e) = 0 event is observed with frequency o(e) yes o(e) = 1 no p(e) = 0 event is forecasted with probability p(e) yes p(e) = 1
12 Probabilistic forecast event E e. g.: 24 h accumulated precipitation on one point (raingauge, radar pixel, catchment, area) exceeds 20 mm no o(e) = 0 event is observed with frequency o(e) event is forecasted with probability p(e) p(e) [0,1] yes o(e) = 1
13 Ensemble forecast event E e. g.: 24 h accumulated precipitation on one point (raingauge, radar pixel, catchment, area) exceeds 20 mm no o(e) = 0 event is observed with frequency o(e) sì o(e) = 1 ensemble of M elements event is forecasted with probability p(e) = k/m none all p(e) = 0 p(e) = 1
14 Deterministic approach
15 Probabilistic approach

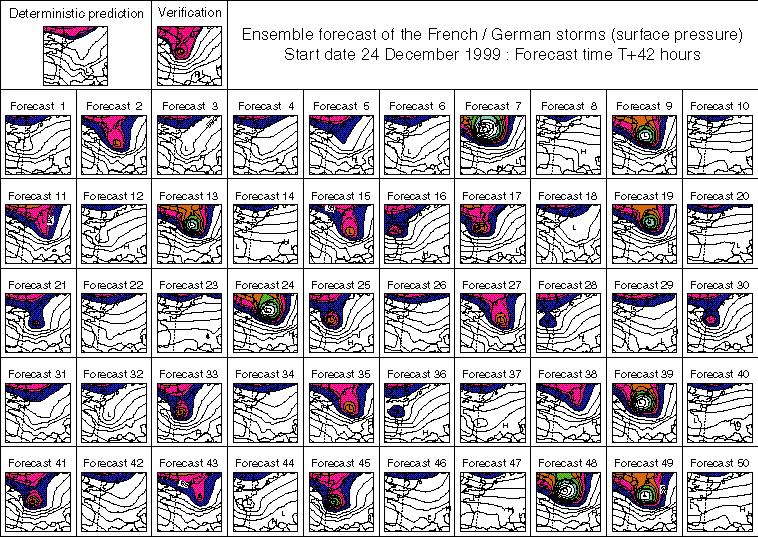
16 Ensemble forecast
17 Forecast evaluation Verification is possible only in statistical sense, not for one single issue E.g.: correspondence between forecast probabilities and observed frequencies Dependence on the ensemble size
18 Brier Score 1 n 2 BS f i oi n i 1 Scalar summary measure for the assessment of the forecast performance, mean square error of the probability forecast n = temporal) oi number of points in the domain (spatio- = 1 if the event occurs = 0 if the event does not occur fi is the probability of occurrence according to the forecast system (e.g. the fraction of ensemble members forecasting the event) BS can take on values in the range [0,1], a perfect forecast having BS = 0
19 Brier Score Gives result on a single forecast, but cannot get a perfect score unless forecast categorically. A summary score measures accuracy, summarized into one value over a dataset. Weights larger errors more than smaller ones. Sensitive to climatological frequency of the event: the more rare an event, the easier it is to get a good BS without having any real skill Brier Score decomposition components of the error
20 Components of probability error The Brier score can be decomposed into 3 terms (for K probability classes and a sample of size N): 1 K 1 K 2 2 BS nk ( pk ok ) n ( o o ) o (1 o ) k k N k 1 N k 1 reliability If for all occasions when forecast probability pk is predicted, the observed frequency of the event is ok = p then the forecast is k said to be reliable. Similar to bias for a continuous variable resolution The ability of the forecast to distinguish situations with distinctly different frequencies of occurrence. uncertainty The variability of the observations. Maximized when the climatological frequency (base rate) =0.5 Has nothing to do with forecast quality! Use the Brier skill score to overcome this problem. The presence of the uncertainty term means that Brier Scores should not be compared on different samples.
21 Probabilistic forecasts An accurate probability forecast system has: reliability - agreement between forecast probability and mean observed frequency sharpness - tendency to forecast probabilities near 0 or 1, as opposed to values clustered around the mean resolution - ability of the forecast to resolve the set of sample events into subsets with characteristically different outcomes
22 Brier Score decomposition Murphy (1973) 1 M 1 M 2 2 BS N k ( f k ok ) ( o o ) o (1 o ) k N k 0 N k 0 reliabilit y M = ensemble size resolutio n uncertain ty K = 0,, M number of ensemble members forecasting the event (probability classes) N = total number of point in the verification domain Nk = number of points where the event is forecast by k members Nk ok oi = frequency of the event in the subi 1 sample Nk o = total frequency of the event (sample climatology)
23 Brier Score decomposition Murphy (1973) M 1 M 1 2 BS N k ( f k ok ) 2 ( o o ) o (1 o ) k N k 0 N k 0 uncertain ty reliabilit resolutio y n The first term is a reliability measure: for forecasts that are perfectly reliable, the sub-sample relative frequency is exactly equal to the forecast probability in each sub-sample. The second term is a resolution measure: if the forecasts sort the observations into sub-samples having substantially different relative frequencies than the overall sample climatology, the resolution term will be large. This is a desirable situation, since the resolution term is subtracted. It is large if there is resolution enough to produce very high and very low probability forecasts.
24 Brier Score decomposition 1 M 1 M 2 2 BS N k ( f k ok ) ( o o ) o (1 o ) k N k 0 N k 0 uncertain ty reliabilit resolutio y n The uncertainty term ranges from 0 to If E was either so common, or so rare, that it either always occurred or never occurred within the sample of years studied, then b unc=0; in this case, always forecasting the climatological probability generally gives good results. When the climatological probability is near 0.5, there is substantially more uncertainty inherent in the forecasting situation: if E occurred 50% of the time within the sample, then bunc=0.25. Uncertainty is a function of the climatological frequency of E, and is not dependent on the forecasting system itself.
25 Brier Score decomposition II Talagrand et al. (1997) 2 M M k k BS o H k 1 (1 o ) Fk M M k 0 k 0 Hit Rate term 2 False Alarm Rate term M = ensemble size K = 0,, M number of ensemble members forecasting the event (probability classes) o = total frequency of the event (sample climatology) M M H k H i i k Fk Fi i k
26 Brier Skill Score Measures the improvement of the accuracy of the probabilistic forecast relative to a reference forecast (e. g. climatology or persistence) BSS BS BSref BSref The forecast system has predictive skill if BSS is positive, a perfect system having BSS = 1. IF the sample climatology o is used, can be expressed as: Res Rel BSS Unc BScli o 1 o
27 Brier Score and Skill Score Summary Measures accuracy and skill respectively Summary scores Cautions: Cannot compare BS on different samples BSS take care about underlying climatology BSS Take care about small samples
28 Ranked Probability Score M m m 1 RPS f k ok M 1 m 1 k 1 k 1 2 Extension of the Brier Score to multi-event situation. The squared errors are computed with respect to the cumulative probabilities in the forecast and observation vectors. M oik = number of forecast categories = 1 if the event occurs in category k = 0 if the event does not occur in category k fk is the probability of occurrence in category k according to the forecast system (e.g. the fraction of ensemble members forecasting the event) RPS take on values in the range [0,1], a perfect forecast having RPS = 0
29 Reliability Diagram o(p) is plotted against p for some finite binning of width dp In a perfectly reliable system o(p)=p and the graph is a straight line oriented at 45o to the axes
30 Reliability Diagram Forecast probability Reliabilit y Obs. frequency Obs. frequency No skill line: Where reliability and resolution are equal Brier skill 1 1 score goes to 0 clim Forecast probability Resolutio n climatology 0 # fcsts Resolution: Variation about horizontal (climatology) line skill Observed frequency Reliability: Proximity to diagonal 1 Pfcst 0 Forecast probability 1
31 Reliability Diagram and Brier Score The reliability term measures the mean square distance of the graph of o(p) to the diagonal line. Points between the "no skill" line and the diagonal contribute positively to the Brier skill score. The resolution term measures the mean square distance of the graph of o(p) to the sample climate horizontal dotted line.
32 Reliability Diagram If the curve lies below the 45 line, the probabilities are overestimated If the curve lies above the 45 line, the probabilities are underestimated


33 Reliability Diagram No skill line 33

34 Reliability Diagram Exercise
35 Reliability Diagram Wilks (1995) climatologic al forecast minimal resolution underforecasti ng bias Good resolution at the expense of reliability reliable rare event small sample size
36 Sharpness Refers to the spread of the probability distributions. It is expressed as the capability of the system to forecast extreme values, or values close 0 or 1. The frequency of forecasts in each probability bin (shown in the histogram) shows the sharpness of the forecast.

37 Sharpness Histogram Exercise
38 Reliability Diagrams - Summary Diagnostic tool Measures reliability, resolution and sharpness Requires reasonably large dataset to get useful results Try to ensure enough cases in each bin Graphical representation of Brier score components The reliability diagram is conditioned on the forecasts (i.e., given that X was predicted, what was the outcome?), and can be expected to give information on the real meaning of the forecast. It is a good partner to the ROC, which is conditioned on the observations.
39 Discrimination and the ROC Reliability diagram partitioning the data according to the forecast probability Suppose we partition according to observation 2 categories, yes or no Look at distribution of forecasts separately for these two categories
40 Discrimination Discrimination: The ability of the forecast system to clearly distinguish situations leading to the occurrence of an event of interest from those leading to the non-occurrence of the event. Depends on: Separation of means of conditional distributions Variance within conditional distributions (a) observed observed (b) observed observed non-events events frequency frequency non-events events forecast Good discrimination (c) observed observed non-events events frequency forecast Poor discrimination forecast Good discrimination
41 Sample Likelihood Diagrams: All precipitation, 20 Cdn stns, one year. Discrimination: The ability of the forecast system to clearly distinguish situations leading to the occurrence of an event of interest from those leading to the non-occurrence of the event. ecmwf msc Yes No No Relative Frequency 0.3 No Yes No Yes 0.0 Relative Frequency Yes Forecast Forecast

42 Relative Operating Characteristic curve: Construction HR Number of correct fcsts of event/total occurrences of event FA Number of false alarms/total occurrences of non-event
43 ROC Curves (Relative Operating Characteristics, Mason and Graham 1999) contingency table Forecas t Hit Rate False Alarm Rate H Observed Yes No Yes a b No c d a number of correct forecasts of the event a c total number of occurrences of the event b number of non correct forecasts of the event F b d total number of non - occurrences of the event A contingency table can be built for each probability class (a probability class can be defined as the % of ensemble elements which actually forecast a given event)
44 ROC Curve At least 0 members (always) x x x x x x x x x x x k-th probability class: E is forecast if it is forecast by at least k ensemble members => a warning can be issued when the forecast probability for the predefined event exceeds some threshold For the k-th probability M class: M H k H i i k Fk Fi i k At least M+1 members (never) Hit rates are plotted against the corresponding false alarm rates to generate the ROC Curve
45 ROC Curve x x x x x x x x x x x The ability of the system to prevent dangerous situations depends on the decision criterion: if we choose to alert when at least one member forecasts precipitation exceeding a certain threshold, the Hit Rate will be large enough, but also the False Alarm Rate. If we choose to alert when this is done by at least a high number of members, our FAR will decrease, but also our HR
46 ROC Area The area under the ROC curve is used as a statistic measure of forecast usefulness. A value of 0.5 indicates that the forecast system has no skill. In fact, for a system that has no skill, the warnings (W) and the events (E) are independent occurrences: H p W E p(w ) p(w E ) F
47 Construction of ROC curve From original dataset, determine bins Can use binned data as for Reliability diagram BUT There must be enough occurrences of the event to determine the conditional distribution given occurrences may be difficult for rare events. Generally need at least 5 bins. For each probability threshold, determine HR and FA Plot HR vs FA to give empirical ROC. Use binormal model to obtain ROC area; recommended whenever there is sufficient data >100 cases or so. For small samples, recommended method is that described by Simon Mason. (See 2007 tutorial)
48 ROC - Interpretation Interpretation of ROC: *Quantitative measure: Area under the curve ROCA *Positive if above 45 degree No discrimination line where ROCA = 0.5 *Perfect is 1.0. ROC is NOT sensitive to bias: It is necessarily only that the two conditional distributions are separate * Can compare with deterministic forecast one point
49 ROC for infrequent events For fixed binning (e.g. deciles), points cluster towards lower left corner for rare events: subdivide lowest probability bin if possible. Remember that the ROC is insensitive to bias (calibration).
50 Summary - ROC Measures discrimination Plot of Hit rate vs false alarm rate Area under the curve by fitted model Sensitive to sample climatology careful about averaging over areas or time NOT sensitive to bias in probability forecasts companion to reliability diagram Related to the assessment of value of forecasts Can compare directly the performance of probability and deterministic forecast
51 Cost-loss Analysis Is it possible to individuate a threshold for the skill, which can be considered a usefulness threshold for the forecast system? Decisional model U take action E happens ye no yes s C C no L 0 The event E causes a damage which incur a loss L. The user U can avoid the damage by taking a preventive action which cost is C. U wants to minimize the mean total expense over a great number of cases. U can rely on a forecast system to know in advance if the event is going to occur or not.
52 Cost-loss Analysis contingency table Forecas t Observed Yes No Yes a b No c d With a deterministic forecast system, the mean expense for unit loss is: c * L ( a b) * C C C F 1 o Ho 1 o ME = L L L o a c is the sample climatology (the observed frequency) If the forecast system is probabilistic, the user has to fix a probability threshold k. When this threshold is exceeded, it take protective action. MEkf= Fk C 1 o H k o 1 C o L L Mean expens e
 L L it is")
53 Cost-loss Analysis Vk = MEcli ME k f MEcli MEp Valu e Gain obtained using the system instead of the climatological information, percentage with respect to the gain obtained using a perfect system ME with a perfect forecast system C the preventive action is MEp o L taken only when the event occurs ME based on climatological C information the action is always taken if o C MEcli min( o, ) L L it is never taken otherwise
54 Cost-loss Analysis Curves of Vk as a function of C/L, a curve for each probability threshold. The area under the envelope of the curves is the cost-loss area.
55 CRPS
56 Continuous Rank Probability Score 2 CRPS ( P, x a ) P( x) Pa ( x) dx -difference between observation and forecast, expressed as cdfs -defaults to MAE for deterministic fcst -flexible, can accommodate uncertain obs
57 Rank Histogram Commonly used to diagnose the average spread of an ensemble compared to observations Computation: Identify rank of the observation compared to ranked ensemble forecasts Assumption: observation equally likely to occur in each of n+1 bins. (questionable?)

58 Rank histogram (Talagrand Diagram) Rank histogram of the distribution of the values forecast by an ensemble Outliers below the minimum V1 range of forecast value I II III IV V2 V3 V4 V5 Outliers above the maximum
59 Percentage of Outliers Percentage of points where the observed value lies out of the range of forecast values. range of forecast value Outliers below the minimum V1 V2 V3 V4 Total Outliers V5 Outliers above the maximum
60 Rank histogram - exercise
 of simulation, before the LBCs overwhelm differences in initial states.")
61 Uncertainty in LAM Vié et al., 2011 The uncertainty on convective scale ICs has a stronger impact over the first hours (12 h) of simulation, before the LBCs overwhelm differences in initial states. The uncertainties on LBCs have a growing impact at a longer range (beyond 12 h). boundary condition perturbation only initial condition perturbation
62 Data considerations for ensemble verification An extra dimension many forecast values, one observation value Suggests data matrix format needed; columns for the ensemble members and the observation, rows for each event Raw ensemble forecasts are a collection of deterministic forecasts The use of ensembles to generate probability forecasts requires interpretation. i.e. processing of the raw ensemble data matrix.
63 average -10mm/24h COSMO-LEPS 16-MEMBER EPS noss=234
64 COSMO-LEPS vs ECMWF 5 RM fc. range +66 tp > 20mm/24h fc. range +90 ROC average on 1.5 x 1.5 boxes COSMO-LEPS COSMO-LEPS 5-MEMBER EPS 5-MEMBER EPS 2nd SRNWP Workshop on Short-range ensembles Bologna, 7-8 April
65 COSMO-LEPS vs ECMWF 5 RM COST-LOSS (envelope) tp > 10mm/24h boxes fc. range +66 average on 1.5 x 1.5 tp > 20mm/24h COSMO-LEPS COSMO-LEPS 5-MEMBER EPS 5-MEMBER EPS 2nd SRNWP Workshop on Short-range ensembles Bologna, 7-8 April


66 Spatial scales
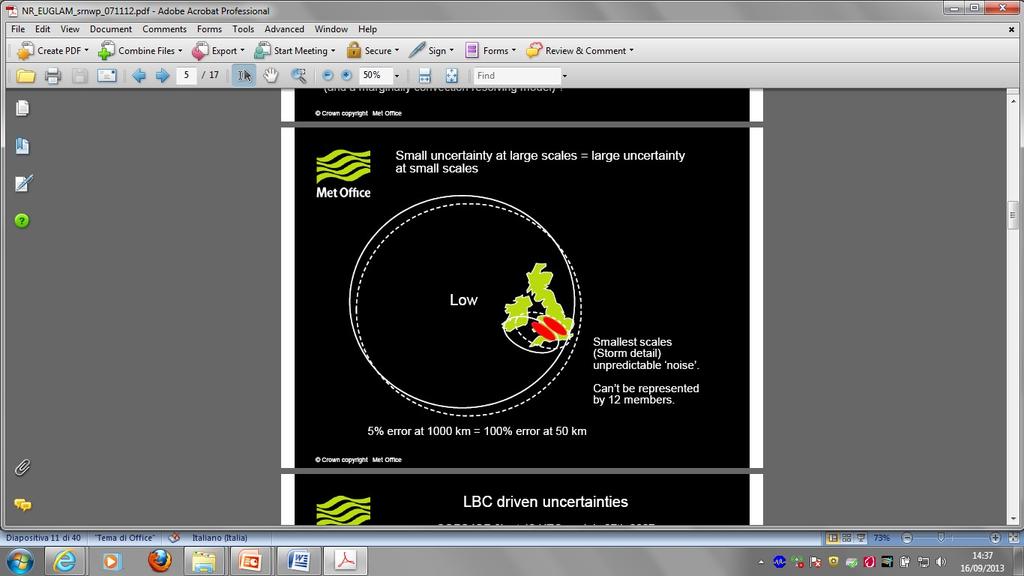
67 Mesoscale uncertainty

68 Predictability: a fractal problem


69 Predictability: a fractal problem


70 A matter of scale

71 Leadtime: The need for uncertainty assessment OBS HIGH-RES LOW-RES
72 Summary Summary score: Brier and Brier Skill Partition of the Brier score Reliability diagrams: Reliability, resolution and sharpness ROC: Discrimination Diagnostic verification: Reliability and ROC Ensemble forecasts: Summary score CRPS
73 Thank you!
74 bibliography Bougeault, P., WGNE recommendations on verification methods for numerical prediction of weather elements and severe weather events (CAS/JSC WGNE Report No. 18) Jolliffe, I.T. and D.B. Stephenson, Forecast Verification: A Practitioner s Guide. In Atmospheric Sciences (Wiley). Pertti Nurmi, Recommendations on the verification of local weather forecasts. ECMWF Technical Memorandum n Stanski, H.R., L.J. Wilson and W.R. Burrows, Survey of Common Verification Methods in Meteorology (WMO Research Report No. 89-5) Wilks D. S., Statistical methods in atmospheric sciences. Academic Press, New York, 467 pp.
75 bibliography Hamill, T.M., 1999: Hypothesis tests for evaluating numerical precipitation forecasts. Wea. Forecasting, 14, Mason S.J. and Graham N.E., Conditional probabilities, relative operating characteristics and relative operating levels. Wea. and Forecasting, 14, Murphy A.H., A new vector partition of the probability score. J. Appl. Meteor., 12, Richardson D.S., Skill and relative economic value of the ECMWF ensemble prediction system. Quart. J. Roy. Meteor. Soc., 126, Talagrand, O., R. Vautard and B. Strauss, Evaluation of probabilistic prediction systems. Proceedings, ECMWF Workshop on Predictability.
Ensemble Verification Metrics
 Ensemble Verification Metrics Debbie Hudson (Bureau of Meteorology, Australia) ECMWF Annual Seminar 207 Acknowledgements: Beth Ebert Overview. Introduction 2. Attributes of forecast quality 3. Metrics:
Verification of Probability Forecasts
 Verification of Probability Forecasts Beth Ebert Bureau of Meteorology Research Centre (BMRC) Melbourne, Australia 3rd International Verification Methods Workshop, 29 January 2 February 27 Topics Verification
Towards Operational Probabilistic Precipitation Forecast
 5 Working Group on Verification and Case Studies 56 Towards Operational Probabilistic Precipitation Forecast Marco Turco, Massimo Milelli ARPA Piemonte, Via Pio VII 9, I-10135 Torino, Italy 1 Aim of the
Evaluating Forecast Quality
 Evaluating Forecast Quality Simon J. Mason International Research Institute for Climate Prediction Questions How do we decide whether a forecast was correct? How do we decide whether a set of forecasts
The Impact of Horizontal Resolution and Ensemble Size on Probabilistic Forecasts of Precipitation by the ECMWF EPS
 The Impact of Horizontal Resolution and Ensemble Size on Probabilistic Forecasts of Precipitation by the ECMWF EPS S. L. Mullen Univ. of Arizona R. Buizza ECMWF University of Wisconsin Predictability Workshop,
Predicting uncertainty in forecasts of weather and climate (Also published as ECMWF Technical Memorandum No. 294)
") Predicting uncertainty in forecasts of weather and climate (Also published as ECMWF Technical Memorandum No. 294) By T.N. Palmer Research Department November 999 Abstract The predictability of weather
Predicting uncertainty in forecasts of weather and climate (Also published as ECMWF Technical Memorandum No. 294) By T.N. Palmer Research Department November 999 Abstract The predictability of weather
Methods of forecast verification
 Methods of forecast verification Kiyotoshi Takahashi Climate Prediction Division Japan Meteorological Agency 1 Outline 1. Purposes of verification 2. Verification methods For deterministic forecasts For
Five years of limited-area ensemble activities at ARPA-SIM: the COSMO-LEPS system
 Five years of limited-area ensemble activities at ARPA-SIM: the COSMO-LEPS system Andrea Montani, Chiara Marsigli and Tiziana Paccagnella ARPA-SIM Hydrometeorological service of Emilia-Romagna, Italy 11
VERFICATION OF OCEAN WAVE ENSEMBLE FORECAST AT NCEP 1. Degui Cao, H.S. Chen and Hendrik Tolman
 VERFICATION OF OCEAN WAVE ENSEMBLE FORECAST AT NCEP Degui Cao, H.S. Chen and Hendrik Tolman NOAA /National Centers for Environmental Prediction Environmental Modeling Center Marine Modeling and Analysis
Basic Verification Concepts
 Basic Verification Concepts Barbara Brown National Center for Atmospheric Research Boulder Colorado USA bgb@ucar.edu Basic concepts - outline What is verification? Why verify? Identifying verification
Verification of Continuous Forecasts
 Verification of Continuous Forecasts Presented by Barbara Brown Including contributions by Tressa Fowler, Barbara Casati, Laurence Wilson, and others Exploratory methods Scatter plots Discrimination plots
Verification of ensemble and probability forecasts
 Verification of ensemble and probability forecasts Barbara Brown NCAR, USA bgb@ucar.edu Collaborators: Tara Jensen (NCAR), Eric Gilleland (NCAR), Ed Tollerud (NOAA/ESRL), Beth Ebert (CAWCR), Laurence Wilson
Sensitivity of COSMO-LEPS forecast skill to the verification network: application to MesoVICT cases Andrea Montani, C. Marsigli, T.
 Sensitivity of COSMO-LEPS forecast skill to the verification network: application to MesoVICT cases Andrea Montani, C. Marsigli, T. Paccagnella Arpae Emilia-Romagna Servizio IdroMeteoClima, Bologna, Italy
Ensemble forecast and verification of low level wind shear by the NCEP SREF system
 Ensemble forecast and verification of low level wind shear by the NCEP SREF system Binbin Zhou*, Jeff McQueen, Jun Du, Geoff DiMego, Zoltan Toth, Yuejian Zhu NOAA/NWS/NCEP/Environment Model Center 1. Introduction
Main characteristics and performance of COSMO LEPS
 Main characteristics and performance of COSMO LEPS Andrea Montani, Chiara Marsigli, Tiziana Paccagnella ARPA Emilia Romagna, Idro Meteo Clima Service Montani Marsigli Paccagnella Stochastic forcing, Ensemble
Upscaled and fuzzy probabilistic forecasts: verification results
 4 Predictability and Ensemble Methods 124 Upscaled and fuzzy probabilistic forecasts: verification results Zied Ben Bouallègue Deutscher Wetterdienst (DWD), Frankfurter Str. 135, 63067 Offenbach, Germany
Accounting for the effect of observation errors on verification of MOGREPS
 METEOROLOGICAL APPLICATIONS Meteorol. Appl. 15: 199 205 (2008) Published online in Wiley InterScience (www.interscience.wiley.com).64 Accounting for the effect of observation errors on verification of
Basic Verification Concepts
 Basic Verification Concepts Barbara Brown National Center for Atmospheric Research Boulder Colorado USA bgb@ucar.edu May 2017 Berlin, Germany Basic concepts - outline What is verification? Why verify?
Categorical Verification
 Forecast M H F Observation Categorical Verification Tina Kalb Contributions from Tara Jensen, Matt Pocernich, Eric Gilleland, Tressa Fowler, Barbara Brown and others Finley Tornado Data (1884) Forecast
Validation of Forecasts (Forecast Verification) Overview. Ian Jolliffe
 Overview. Ian Jolliffe") Validation of Forecasts (Forecast Verification) Overview Ian Jolliffe 1 Outline 1. Introduction and history (4) 2. Types of forecast (2) 3. Properties of forecasts (3) verification measures (2) 4. Terminology
Validation of Forecasts (Forecast Verification) Overview Ian Jolliffe 1 Outline 1. Introduction and history (4) 2. Types of forecast (2) 3. Properties of forecasts (3) verification measures (2) 4. Terminology
North Carolina State University Land Grant University founded in undergraduate fields of study 80 master's degree areas 51 doctoral degree
 NC State University North Carolina State University Land Grant University founded in 1887 89 undergraduate fields of study 80 master's degree areas 51 doctoral degree programs Enrollment is 33,819 students
Probabilistic seasonal forecast verification
 Probabilistic seasonal forecast verification Caio Coelho Centro de Previsão de Tempo e Estudos Climáticos (CPTEC) Instituto Nacional de Pesquisas Espaciais (INPE) Plan of lecture Introduction: Examples
Verification of WAQUA/DCSMv5 s operational water level probability forecasts
 Ministry of Infrastructure and Water Management Verification of WAQUA/DCSMv5 s operational water level probability forecasts N. Wagenaar KNMI Internal report IR-18-1 UTRECHT UNIVSERSITY DEPARTMENT OF
Drought forecasting methods Blaz Kurnik DESERT Action JRC
 Ljubljana on 24 September 2009 1 st DMCSEE JRC Workshop on Drought Monitoring 1 Drought forecasting methods Blaz Kurnik DESERT Action JRC Motivations for drought forecasting Ljubljana on 24 September 2009
Assessment of Ensemble Forecasts
 Assessment of Ensemble Forecasts S. L. Mullen Univ. of Arizona HEPEX Workshop, 7 March 2004 Talk Overview Ensemble Performance for Precipitation Global EPS and Mesoscale 12 km RSM Biases, Event Discrimination
Complimentary assessment of forecast performance with climatological approaches
 Complimentary assessment of forecast performance with climatological approaches F.Gofa, V. Fragkouli, D.Boucouvala The use of SEEPS with metrics that focus on extreme events, such as the Symmetric Extremal
4.3.2 Configuration. 4.3 Ensemble Prediction System Introduction
 4.3 Ensemble Prediction System 4.3.1 Introduction JMA launched its operational ensemble prediction systems (EPSs) for one-month forecasting, one-week forecasting, and seasonal forecasting in March of 1996,
Verification of ECMWF products at the Finnish Meteorological Institute
 Verification of ECMWF products at the Finnish Meteorological Institute by Juha Kilpinen, Pertti Nurmi and Matias Brockmann 1. Summary of major highlights The new verification system is under pre-operational
Standardized Verification System for Long-Range Forecasts. Simon Mason
 Standardized Verification System for Long-Range Forecasts Simon Mason simon@iri.columbia.edu MedCOF 2015 Training Workshop Madrid, Spain, 26 30 October 2015 SVS for LRF: Goal Provide verification information
REPORT ON APPLICATIONS OF EPS FOR SEVERE WEATHER FORECASTING
 WORLD METEOROLOGICAL ORGANIZATION COMMISSION FOR BASIC SYSTEMS OPAG DPFS EXPERT TEAM ON ENSEMBLE PREDICTION SYSTEMS CBS-DPFS/EPS/Doc. 7(2) (31.I.2006) Item: 7 ENGLISH ONLY EXETER, UNITED KINGDOM 6-10 FEBRUARY
Performance of the INM short-range multi-model ensemble using high resolution precipitation observations
 Performance of the INM short-range multi-model ensemble using high resolution precipitation observations CARLOS SANTOS, ALFONS CALLADO, JOSE A. GARCIA-MOYA, DANIEL SANTOS-MUÑOZ AND JUAN SIMARRO. Predictability
István Ihász, Máté Mile and Zoltán Üveges Hungarian Meteorological Service, Budapest, Hungary
 Comprehensive study of the calibrated EPS products István Ihász, Máté Mile and Zoltán Üveges Hungarian Meteorological Service, Budapest, Hungary 1. Introduction Calibration of ensemble forecasts is a new
QUANTIFYING THE ECONOMIC VALUE OF WEATHER FORECASTS: REVIEW OF METHODS AND RESULTS
 QUANTIFYING THE ECONOMIC VALUE OF WEATHER FORECASTS: REVIEW OF METHODS AND RESULTS Rick Katz Institute for Study of Society and Environment National Center for Atmospheric Research Boulder, CO USA Email:
Enhancing Weather Information with Probability Forecasts. An Information Statement of the American Meteorological Society
 Enhancing Weather Information with Probability Forecasts An Information Statement of the American Meteorological Society (Adopted by AMS Council on 12 May 2008) Bull. Amer. Meteor. Soc., 89 Summary This
Model verification / validation A distributions-oriented approach
 Model verification / validation A distributions-oriented approach Dr. Christian Ohlwein Hans-Ertel-Centre for Weather Research Meteorological Institute, University of Bonn, Germany Ringvorlesung: Quantitative
Spatial forecast verification
 Spatial forecast verification Manfred Dorninger University of Vienna Vienna, Austria manfred.dorninger@univie.ac.at Thanks to: B. Ebert, B. Casati, C. Keil 7th Verification Tutorial Course, Berlin, 3-6
Assessing high resolution forecasts using fuzzy verification methods
 Assessing high resolution forecasts using fuzzy verification methods Beth Ebert Bureau of Meteorology Research Centre, Melbourne, Australia Thanks to Nigel Roberts, Barbara Casati, Frederic Atger, Felix
Probabilistic Weather Forecasting and the EPS at ECMWF
 Probabilistic Weather Forecasting and the EPS at ECMWF Renate Hagedorn European Centre for Medium-Range Weather Forecasts 30 January 2009: Ensemble Prediction at ECMWF 1/ 30 Questions What is an Ensemble
Proper Scores for Probability Forecasts Can Never Be Equitable
 APRIL 2008 J O L LIFFE AND STEPHENSON 1505 Proper Scores for Probability Forecasts Can Never Be Equitable IAN T. JOLLIFFE AND DAVID B. STEPHENSON School of Engineering, Computing, and Mathematics, University
Exploring ensemble forecast calibration issues using reforecast data sets
 NOAA Earth System Research Laboratory Exploring ensemble forecast calibration issues using reforecast data sets Tom Hamill and Jeff Whitaker NOAA Earth System Research Lab, Boulder, CO tom.hamill@noaa.gov
EMC Probabilistic Forecast Verification for Sub-season Scales
 EMC Probabilistic Forecast Verification for Sub-season Scales Yuejian Zhu Environmental Modeling Center NCEP/NWS/NOAA Acknowledgement: Wei Li, Hong Guan and Eric Sinsky Present for the DTC Test Plan and
Overview of Verification Methods
 Overview of Verification Methods Joint Working Group on Forecast Verification Research (JWGFVR) Greg Smith on behalf of Barbara Casati, ECCC Existing Verification Techniques Traditional (point-by-point)
Probabilistic fog forecasting with COSMO model
 Probabilistic fog forecasting with COSMO model Giulio Monte, A. Montani, C. Marsigli, T. Paccagnella Arpae Emilia-Romagna Servizio IdroMeteoClima, Bologna, Italy OSA 1.6 Session EMS Annual Meeting, 4-8
Calibration of extreme temperature forecasts of MOS_EPS model over Romania with the Bayesian Model Averaging
 Volume 11 Issues 1-2 2014 Calibration of extreme temperature forecasts of MOS_EPS model over Romania with the Bayesian Model Averaging Mihaela-Silvana NEACSU National Meteorological Administration, Bucharest
AROME-EPS development in Météo-France
 AROME-EPS development in Météo-France Int.Conf.Ens.Methods Toulouse, 15 Nov 2012 francois.bouttier@meteo.fr collaborators: Olivier Nuissier, Laure Raynaud, Benoît Vié Ensemble setup Boundary conditions
LAMEPS activities at the Hungarian Meteorological Service. Hungarian Meteorological Service
 LAMEPS activities at the Hungarian Meteorological Service Edit Hágel Presented by András Horányi Hungarian Meteorological Service 1 2 Outline of the talk Motivation and background Sensitivity experiments
Predictability from a Forecast Provider s Perspective
 Predictability from a Forecast Provider s Perspective Ken Mylne Met Office, Bracknell RG12 2SZ, UK. email: ken.mylne@metoffice.com 1. Introduction Predictability is not a new issue for forecasters or forecast
PROBABILISTIC FORECASTS OF MEDITER- RANEAN STORMS WITH A LIMITED AREA MODEL Chiara Marsigli 1, Andrea Montani 1, Fabrizio Nerozzi 1, Tiziana Paccagnel
 PROBABILISTIC FORECASTS OF MEDITER- RANEAN STORMS WITH A LIMITED AREA MODEL Chiara Marsigli 1, Andrea Montani 1, Fabrizio Nerozzi 1, Tiziana Paccagnella 1, Roberto Buizza 2, Franco Molteni 3 1 Regional
A Local Ensemble Prediction System for Fog and Low Clouds: Construction, Bayesian Model Averaging Calibration, and Validation
 3072 J O U R N A L O F A P P L I E D M E T E O R O L O G Y A N D C L I M A T O L O G Y VOLUME 47 A Local Ensemble Prediction System for Fog and Low Clouds: Construction, Bayesian Model Averaging Calibration,
Verification of nowcasts and short-range forecasts, including aviation weather
 Verification of nowcasts and short-range forecasts, including aviation weather Barbara Brown NCAR, Boulder, Colorado, USA WMO WWRP 4th International Symposium on Nowcasting and Very-short-range Forecast
A spatial verification method applied to the evaluation of high-resolution ensemble forecasts
 METEOROLOGICAL APPLICATIONS Meteorol. Appl. 15: 125 143 (2008) Published online in Wiley InterScience (www.interscience.wiley.com).65 A spatial verification method applied to the evaluation of high-resolution
Verification Marion Mittermaier
 MOSAC-17 14-16 November 2012 PAPER 17.6 Verification Marion Mittermaier Crown Copyright 2012 1 1. Introduction Whilst it has been relatively easy to show an increase in skill when comparing forecasts from
Evaluating weather and climate forecasts
 Evaluating weather and climate forecasts Chris Ferro Department of Mathematics University of Exeter, UK RSS Highlands Local Group and University of St Andrews (St Andrews, 1 September 2016) Monitoring
Spatial verification of NWP model fields. Beth Ebert BMRC, Australia
 Spatial verification of NWP model fields Beth Ebert BMRC, Australia WRF Verification Toolkit Workshop, Boulder, 21-23 February 2007 New approaches are needed to quantitatively evaluate high resolution
NOTES AND CORRESPONDENCE. Improving Week-2 Forecasts with Multimodel Reforecast Ensembles
 AUGUST 2006 N O T E S A N D C O R R E S P O N D E N C E 2279 NOTES AND CORRESPONDENCE Improving Week-2 Forecasts with Multimodel Reforecast Ensembles JEFFREY S. WHITAKER AND XUE WEI NOAA CIRES Climate
Using time-lag ensemble techniques to assess behaviour of high-resolution precipitation forecasts
 Using time-lag ensemble techniques to assess behaviour of high-resolution precipitation forecasts Marion Mittermaier 3 rd Int l Verification Methods Workshop, ECMWF, 31/01/2007 Crown copyright Page 1 Outline
Probabilistic fog forecasting with COSMO model
 Probabilistic fog forecasting with COSMO model Giulio Monte, A. Montani, C. Marsigli, T. Paccagnella Arpae Emilia-Romagna Servizio IdroMeteoClima, Bologna, Italy OSA 1.6 Session EMS Annual Meeting, 4-8
Verification of ECMWF products at the Deutscher Wetterdienst (DWD)
") Verification of ECMWF products at the Deutscher Wetterdienst (DWD) DWD Martin Göber 1. Summary of major highlights The usage of a combined GME-MOS and ECMWF-MOS continues to lead to a further increase
Verification of ECMWF products at the Deutscher Wetterdienst (DWD) DWD Martin Göber 1. Summary of major highlights The usage of a combined GME-MOS and ECMWF-MOS continues to lead to a further increase
Verification of intense precipitation forecasts from single models and ensemble prediction systems
 Verification of intense precipitation forecasts from single models and ensemble prediction systems F Atger To cite this version: F Atger Verification of intense precipitation forecasts from single models
Precipitation verification. Thanks to CMC, CPTEC, DWD, ECMWF, JMA, MF, NCEP, NRL, RHMC, UKMO
 Precipitation verification Thanks to CMC, CPTEC, DWD, ECMWF, JMA, MF, NCEP, NRL, RHMC, UKMO Outline 1) Status of WGNE QPF intercomparisons 2) Overview of the use of recommended methods for the verification
Use of medium-range ensembles at the Met Office I: PREVIN a system for the production of probabilistic forecast information from the ECMWF EPS
 Meteorol. Appl. 9, 255 271 (2002) DOI:10.1017/S1350482702003018 Use of medium-range ensembles at the Met Office I: PREVIN a system for the production of probabilistic forecast information from the ECMWF
Global Flash Flood Forecasting from the ECMWF Ensemble
 Global Flash Flood Forecasting from the ECMWF Ensemble Calumn Baugh, Toni Jurlina, Christel Prudhomme, Florian Pappenberger calum.baugh@ecmwf.int ECMWF February 14, 2018 Building a Global FF System 1.
A skill score based on economic value for probability forecasts
 Meteorol. Appl. 8, 209 219 (2001) A skill score based on economic value for probability forecasts D S Wilks, Department of Earth and Atmospheric Sciences, Cornell University, Ithaca, New York, USA An approach
Verification at JMA on Ensemble Prediction
 Verification at JMA on Ensemble Prediction - Part Ⅱ : Seasonal prediction - Yukiko Naruse, Hitoshi Sato Climate Prediction Division Japan Meteorological Agency 05/11/08 05/11/08 Training seminar on Forecasting
Forecast verification at Deltares
 Forecast verification at Deltares Dr Jan Verkade October 26, 2016 Brief introduction: Jan Verkade Hydrologist; expert in Real-time hydrological forecasting Member of the Rijkswaterstaat River Forecasting
Model verification and tools. C. Zingerle ZAMG
 Model verification and tools C. Zingerle ZAMG Why verify? The three most important reasons to verify forecasts are: to monitor forecast quality - how accurate are the forecasts and are they improving over
Sensitivity of forecast skill to the parameterisation of moist convection in a limited-area ensemble forecast system
 Sensitivity of forecast skill to the parameterisation of moist convection in a limited-area ensemble forecast system Matteo Vasconi 1,2, Andrea Montani 2, and Tiziana Paccagnella 2 1 Department of Physics
Spatial Verification. for Ensemble. at DWD
 Spatial Verification for Ensemble at DWD Susanne Theis Deutscher Wetterdienst (DWD) Introduction Spatial Verification of Single Simulations Box Statistics (e.g. averaging) Fraction Skill Score Wavelets
Deterministic and Probabilistic prediction approaches in Seasonal to Inter-annual climate forecasting
 RA 1 EXPERT MEETING ON THE APPLICATION OF CLIMATE FORECASTS FOR AGRICULTURE Banjul, Gambia, 9-13 December 2002 Deterministic and Probabilistic prediction approaches in Seasonal to Inter-annual climate
operational status and developments
 COSMO-DE DE-EPSEPS operational status and developments Christoph Gebhardt, Susanne Theis, Zied Ben Bouallègue, Michael Buchhold, Andreas Röpnack, Nina Schuhen Deutscher Wetterdienst, DWD COSMO-DE DE-EPSEPS
Ensemble forecasting: Error bars and beyond. Jim Hansen, NRL Walter Sessions, NRL Jeff Reid,NRL May, 2011
 Ensemble forecasting: Error bars and beyond Jim Hansen, NRL Walter Sessions, NRL Jeff Reid,NRL May, 2011 1 Why ensembles Traditional justification Predict expected error (Perhaps) more valuable justification
Extending a Metric Developed in Meteorology to Hydrology
 Extending a Metric Developed in Meteorology to Hydrology D.M. Sedorovich Department of Agricultural and Biological Engineering, The Pennsylvania State University, University Park, PA 680, USA dms5@psu.edu
ECMWF 10 th workshop on Meteorological Operational Systems
 ECMWF 10 th workshop on Meteorological Operational Systems 18th November 2005 Crown copyright 2004 Page 1 Monthly range prediction products: Post-processing methods and verification Bernd Becker, Richard
Feature-specific verification of ensemble forecasts
 Feature-specific verification of ensemble forecasts www.cawcr.gov.au Beth Ebert CAWCR Weather & Environmental Prediction Group Uncertainty information in forecasting For high impact events, forecasters
Operational use of ensemble hydrometeorological forecasts at EDF (french producer of energy)
") Operational use of ensemble hydrometeorological forecasts at EDF (french producer of energy) M. Le Lay, P. Bernard, J. Gailhard, R. Garçon, T. Mathevet & EDF forecasters matthieu.le-lay@edf.fr SBRH Conference
Operational use of ensemble hydrometeorological forecasts at EDF (french producer of energy) M. Le Lay, P. Bernard, J. Gailhard, R. Garçon, T. Mathevet & EDF forecasters matthieu.le-lay@edf.fr SBRH Conference
Monthly probabilistic drought forecasting using the ECMWF Ensemble system
 Monthly probabilistic drought forecasting using the ECMWF Ensemble system Christophe Lavaysse(1) J. Vogt(1), F. Pappenberger(2) and P. Barbosa(1) (1) European Commission (JRC-IES), Ispra Italy (2) ECMWF,
SPECIAL PROJECT PROGRESS REPORT
 SPECIAL PROJECT PROGRESS REPORT Progress Reports should be 2 to 10 pages in length, depending on importance of the project. All the following mandatory information needs to be provided. Reporting year
Focus on parameter variation results
 Accounting for Model Uncertainty in the Navy s Global Ensemble Forecasting System C. Reynolds, M. Flatau, D. Hodyss, J. McLay, J. Moskaitis, J. Ridout, C. Sampson, J. Cummings Naval Research Lab, Monterey,
Concepts of Forecast Verification FROST-14
 Concepts of Forecast Verification FROST-14 Forecast & Research Olympics Sochi Testbed Pertti Nurmi WWRP JWGFVR Finnish Meteorological Institute pertti.nurmi@fmi.fi pertti.nurmi@fmi.fi FROST-14 Verification
Probabilistic Weather Prediction
 Probabilistic Weather Prediction George C. Craig Meteorological Institute Ludwig-Maximilians-Universität, Munich and DLR Institute for Atmospheric Physics Oberpfaffenhofen Summary (Hagedorn 2009) Nothing
JP3.7 SHORT-RANGE ENSEMBLE PRECIPITATION FORECASTS FOR NWS ADVANCED HYDROLOGIC PREDICTION SERVICES (AHPS): PARAMETER ESTIMATION ISSUES
: PARAMETER ESTIMATION ISSUES") JP3.7 SHORT-RANGE ENSEMBLE PRECIPITATION FORECASTS FOR NWS ADVANCED HYDROLOGIC PREDICTION SERVICES (AHPS): PARAMETER ESTIMATION ISSUES John Schaake*, Mary Mullusky, Edwin Welles and Limin Wu Hydrology
JP3.7 SHORT-RANGE ENSEMBLE PRECIPITATION FORECASTS FOR NWS ADVANCED HYDROLOGIC PREDICTION SERVICES (AHPS): PARAMETER ESTIMATION ISSUES John Schaake*, Mary Mullusky, Edwin Welles and Limin Wu Hydrology
Effects of observation errors on the statistics for ensemble spread and reliability
 393 Effects of observation errors on the statistics for ensemble spread and reliability Øyvind Saetra, Jean-Raymond Bidlot, Hans Hersbach and David Richardson Research Department December 22 For additional
Distributions-Oriented Verification of Probability Forecasts for Small Data Samples
 903 Distributions-Oriented Verification of Probability Forecasts for Small Data Samples A. ALLE BRADLEY AD TEMPEI HASHIO IIHR Hydroscience and Engineering, and Department of Civil and Environmental Engineering,
NHC Ensemble/Probabilistic Guidance Products
 NHC Ensemble/Probabilistic Guidance Products Michael Brennan NOAA/NWS/NCEP/NHC Mark DeMaria NESDIS/STAR HFIP Ensemble Product Development Workshop 21 April 2010 Boulder, CO 1 Current Ensemble/Probability
Deutscher Wetterdienst
 Deutscher Wetterdienst Limited-area ensembles: finer grids & shorter lead times Susanne Theis COSMO-DE-EPS project leader Deutscher Wetterdienst Thank You Neill Bowler et al. (UK Met Office) Andras Horányi
Application and verification of ECMWF products 2015
 Application and verification of ECMWF products 2015 Hungarian Meteorological Service 1. Summary of major highlights The objective verification of ECMWF forecasts have been continued on all the time ranges
Implementation and Evaluation of a Mesoscale Short-Range Ensemble Forecasting System Over the. Pacific Northwest. Eric P. Grimit
 Implementation and Evaluation of a Mesoscale Short-Range Ensemble Forecasting System Over the Eric P. Grimit Pacific Northwest Advisor: Dr. Cliff Mass Department of Atmospheric Sciences, University of
A study on the spread/error relationship of the COSMO-LEPS ensemble
 4 Predictability and Ensemble Methods 110 A study on the spread/error relationship of the COSMO-LEPS ensemble M. Salmi, C. Marsigli, A. Montani, T. Paccagnella ARPA-SIMC, HydroMeteoClimate Service of Emilia-Romagna,
TC/PR/RB Lecture 3 - Simulation of Random Model Errors
 TC/PR/RB Lecture 3 - Simulation of Random Model Errors Roberto Buizza (buizza@ecmwf.int) European Centre for Medium-Range Weather Forecasts http://www.ecmwf.int Roberto Buizza (buizza@ecmwf.int) 1 ECMWF
Monthly forecast and the Summer 2003 heat wave over Europe: a case study
 ATMOSPHERIC SCIENCE LETTERS Atmos. Sci. Let. 6: 112 117 (2005) Published online 21 April 2005 in Wiley InterScience (www.interscience.wiley.com). DOI: 10.1002/asl.99 Monthly forecast and the Summer 2003
J11.5 HYDROLOGIC APPLICATIONS OF SHORT AND MEDIUM RANGE ENSEMBLE FORECASTS IN THE NWS ADVANCED HYDROLOGIC PREDICTION SERVICES (AHPS)
") J11.5 HYDROLOGIC APPLICATIONS OF SHORT AND MEDIUM RANGE ENSEMBLE FORECASTS IN THE NWS ADVANCED HYDROLOGIC PREDICTION SERVICES (AHPS) Mary Mullusky*, Julie Demargne, Edwin Welles, Limin Wu and John Schaake
J11.5 HYDROLOGIC APPLICATIONS OF SHORT AND MEDIUM RANGE ENSEMBLE FORECASTS IN THE NWS ADVANCED HYDROLOGIC PREDICTION SERVICES (AHPS) Mary Mullusky*, Julie Demargne, Edwin Welles, Limin Wu and John Schaake
Severe storm forecast guidance based on explicit identification of convective phenomena in WRF-model forecasts
 Severe storm forecast guidance based on explicit identification of convective phenomena in WRF-model forecasts Ryan Sobash 10 March 2010 M.S. Thesis Defense 1 Motivation When the SPC first started issuing
COMPOSITE-BASED VERIFICATION OF PRECIPITATION FORECASTS FROM A MESOSCALE MODEL
 J13.5 COMPOSITE-BASED VERIFICATION OF PRECIPITATION FORECASTS FROM A MESOSCALE MODEL Jason E. Nachamkin, Sue Chen, and Jerome M. Schmidt Naval Research Laboratory, Monterey, CA 1. INTRODUCTION Mesoscale
Met Office convective-scale 4DVAR system, tests and improvement
 Met Office convective-scale 4DVAR system, tests and improvement Marco Milan*, Marek Wlasak, Stefano Migliorini, Bruce Macpherson Acknowledgment: Inverarity Gordon, Gareth Dow, Mike Thurlow, Mike Cullen
152 STATISTICAL PREDICTION OF WATERSPOUT PROBABILITY FOR THE FLORIDA KEYS
 152 STATISTICAL PREDICTION OF WATERSPOUT PROBABILITY FOR THE FLORIDA KEYS Andrew Devanas 1, Lydia Stefanova 2, Kennard Kasper 1, Sean Daida 1 1 NOAA/National Wear Service, Key West, Florida, 2 COAPS/Florida
Ensemble Forecas.ng and their Verifica.on
 AOSC630 Guest Class April 16 th, 2014 Ensemble Forecas.ng and their Verifica.on Malaquías Peña Environmental Modeling Center, NCEP/NOAA Material comprises Sects. 6.6, 7.4 and 7.7 in Wilks (2 nd Edition).
1.10 A NEW SPATIAL SCALE DECOMPOSITION OF THE BRIER SCORE FOR THE VERIFICATION OF PROBABILISTIC LIGHTNING FORECASTS. Abstract
 1.10 A NEW SPATIAL SCALE DECOMPOSITION OF THE BRIER SCORE FOR THE VERIFICATION OF PROBABILISTIC LIGHTNING FORECASTS B. Casati L. J. Wilson Meteorological Service of Canada, Meteorological Research Branch,
WWRP Recommendations for the Verification and Intercomparison of QPFs and PQPFs from Operational NWP Models. Revision 2 October 2008
 WWRP 009-1 For more information, please contact: World Meteorological Organization Research Department Atmospheric Research and Environment Branch 7 bis, avenue de la Paix P.O. Box 300 CH 111 Geneva Switzerland
Revisiting predictability of the strongest storms that have hit France over the past 32 years.
 Revisiting predictability of the strongest storms that have hit France over the past 32 years. Marie Boisserie L. Descamps, P. Arbogast GMAP/RECYF 20 August 2014 Introduction Improving early detection
Verification of African RCOF Forecasts
 Technical Report #09-02 RCOF Review 2008 Position Paper: Verification of African RCOF Forecasts by Dr. Simon Mason and Mr. Simbarashe Chidzambwa Dr Simon J. Mason International Research Institute for Climate