Comparison of AIRS and AMSU-B monthly mean estimates of upper tropospheric humidity
|
|
|
- Colleen Cross
- 6 years ago
- Views:
Transcription
1 GEOPHYSICAL RESEARCH LETTERS, VOL.???, XXXX, DOI: /, Comparison of AIRS and AMSU-B monthly mean estimates of upper tropospheric humidity M. Milz Department of Space Science, Luleå University of Technology, Kiruna, Sweden S. A. Buehler Department of Space Science, Luleå University of Technology, Kiruna, Sweden V. O. John Met Office Hadley Centre, Exeter, UK M. Milz, Department of Space Science, Luleå University, Box 812, Kiruna, Sweden.
2 X - 2 MILZ ET AL.: COMPARING AIRS AND AMSUB UTH Satellite-borne measurements provide valuable information on the global distribution of upper tropospheric humidity (UTH), which represents the mean relative humidity in a layer approximately enclosed by the atmospheric pressure levels 500 and 200 hpa. Monthly mean distributions of microwave observations of UTH obtained from the Advanced Microwave Sounding Unit- B (AMSU-B) and the Humidity Sounder for Brazil (HSB) are compared to infrared observations of UTH from the Atmospheric Infrared Sounder (AIRS). All data sets for January 2003 show distributions as expected from climatologies. Data of AIRS and AMSU-B averaged on 1.5 x 1.5 lat-lon bins for January 2003 show good overall agreement. However, with 2.7 %RH AIRS shows an unexpected wet mean bias, especially for regions where the influence of clouds is small or cloud affected measurements are excluded for both sensors. In regions where AIRS is sensitive to cloud affected measurements but not AMSU-B, the bias is reduced and partly negative.
3 MILZ ET AL.: COMPARING AIRS AND AMSUB UTH X Introduction Atmospheric water vapor is the most effective greenhouse gas. Especially in the upper troposphere, the water vapor content has a strong influence on the amount of outgoing long-wave radiation. However, major uncertainty in the temporal and spatial distribution of water vapor in the upper troposphere is reflected in the differences between the climate models used for the fourth IPCC assessment report[intergovernmental Panel on Climate Change, 2007; John and Soden, 2007]. A suitable measure of upper tropospheric water vapor content is the upper tropospheric humidity (UTH) which corresponds to the average relative humidity with respect to water between approximately 500 hpa and 200 hpa [Soden and Bretherton, 1996]. Satelliteborne instruments are the only sources of a global picture of the water vapor distribution with good horizontal and temporal resolution which can be used to understand the variability and trends in UTH. Continuous operational satellite-borne measurements of tropospheric water vapor are available since the late 1970s, using the infrared (IR) spectral range. Since 1993 continuous humidity measurements have been available also from instruments using the microwave range (MW), especially a prominent water vapor line at GHz. In recent years several instruments using the IR or MW spectral region have been launched on operational satellites. Sensors using the MW region are, among others, the Advanced Microwave Sounding Unit-B (AMSU-B) and the Humidity Sounder for Brazil (HSB), which are to a large extent similar. One of several infrared sensors is the Atmospheric Infrared Sounder (AIRS) which is on board Aqua, the same satellite as
4 X - 4 MILZ ET AL.: COMPARING AIRS AND AMSUB UTH HSB. In this study we compare UTH products obtained from AMSU-B, HSB, and AIRS measurements and characterize the differences. Due to the short life time of HSB (from May 24, 2002 until February 5, 2003) the data products of HSB have not been maintained and revised as thoroughly as the products of AMSU-B and AIRS. Therefore, we will focus on the comparison of AMSU-B and AIRS, and HSB will only be considered because of its nearly identical collocation with AIRS. UTH datasets obtained from the different spectral ranges must take careful account of the characteristics of individual products and differences between them. Humidity measurements from IR sensors represent clear sky (cloud free) conditions or nearly clear sky conditions while MW measurements represent nearly all conditions. As humidity and cloud coverage are correlated, humidity measurements under clear sky conditions show a dry bias compared to measurements considering all conditions [Lanzante and Gahrs, 2000]. UTH data from different IR instruments have been compared to radiosondes even though these were limited to areas where radiosondes were routinely launched. They showed large uncertainties and differences between UTH measured by satellite sensors and radiosondes. To a certain extent, the differences are due to known instrument-dependent and geographically varying problems affecting radiosonde measurements of humidity in the upper troposphere [Soden and Lanzante, 1996; Divakarla et al., 2006; Gettelman et al., 2006]. We wish to determine whether UTH measured by AIRS show a dry bias compared to MW measurements, as would be expected due to cloud clearing, and to asses its
5 MILZ ET AL.: COMPARING AIRS AND AMSUB UTH X - 5 significance. Both instrument types provide global measurements covering the broad latitude range from 60 S to 60 N. 2. Data Description and Method All instruments used in this study are downlooking with a similar scanning pattern. They scan at 90 different angles spanning a range of approximately 49 to each side of the nadir. The field of view (FOV) represents a footprint size of about 15x15 km at nadir. All instruments are on-board sun-synchronous satellites AIRS AIRS is on board NASA s Earth observing system satellite Aqua (EOS-Aqua). AIRS provides several atmospheric parameters, including vertical profiles of atmospheric water vapor. The AIRS instrument uses three spectral bands in the infrared with high spectral resolution. Atmospheric state parameters retrieved from the microwave instrument AMSU-A, also on-board Aqua, are used for the retrieval of AIRS profiles, in particular to obtain cloudcleared radiances for AIRS [Susskind et al., 2003]. Therefore profiles for the nine AIRS ground pixels covered by the AMSU-A FOV are averaged and attributed to the location of the larger AMSU-A ground pixel. The accuracy of temperature and water vapor profiles is expected to be 1K for 1 km levels and 15% for 2 km layers in the troposphere, respectively. [Tobin et al., 2006]. The cloud clearing technique used for AIRS retrievals enables measurements for scenes with cloud fractions up to 70%. In this study we use version 5 of the AIRS Level 2 product.
6 X - 6 MILZ ET AL.: COMPARING AIRS AND AMSUB UTH 2.2. AMSU-B AMSU-B instruments are on board the operational meteorological satellites NOAA-15, -16, and -17. AMSU-B has five channels, of which three channels (Channel 18 to 20) are situated around a strong water vapor spectral line at GHz with different channel offsets from the line center. These channels are used to determine tropospheric water vapor. The measured radiance in terms of brightness temperature of channel 18 is used to obtain a UTH product by the method described by Buehler and John [2005]. Channels 19 and 20 are used for cloud clearing [Buehler et al., 2007]. Brightness temperatures were obtained from AMSU-B level 1b data using with the ATOVS and AVHRR Pre-processing Package Version 6 (AAPP6) [Labrot et al., 2006]. Brightness temperature measured by channel 18 will be denoted as Tb 18 and the obtained UTH product will be denoted as UTH 18. AMSU-B on board NOAA-16 (AMSU-B-16) is taken as reference instrument for the three instruments. AMSU-B on board NOAA-15 (AMSU-B-15) has two problems, and therefore was not taken as reference. Firstly, it shows a false warming trend in brightness temperature, and consequently a false drying trend in UTH, because of the satellite s orbital drift which has moved the measurements from the UTH maximum towards its minimum of the diurnal cycle. Secondly, it shows a cold bias for simultaneous nadir overpasses with NOAA-16 (John, 2008, personal communication) which is believed to be due to instrumental problems. The radiometer on board NOAA-17 (AMSU-B-17) agrees well with measurements for AMSU-B-16 [Buehler et al., 2008].
7 MILZ ET AL.: COMPARING AIRS AND AMSUB UTH X HSB HSB, on-board Aqua, is generally similar to AMSU-B, except that one channel (at 89 GHz) has been omitted. HSB brightness temperatures are part of the extended AIRS level 1b data product. As mentioned above, some of the processing operations of HSB have not been modified between different data versions as done for the products for AMSU- B and AIRS. For example, only antenna temperatures are provided and no side-lobe corrected brightness temperature product is available. The brightness temperatures of the ±1.00 GHz and the UTH product will also be denoted by Tb 18 and UTH 18, respectively, with reference to HSB Method HSB and AMSU-B Tb 18 are transformed to UTH 18 by the method of Buehler and John [2005], which represents the Jacobian-weighted UTH. In contrast to that, AIRS level 2 products provide vertical profiles of atmospheric parameters such as temperature, mass mixing ratio of water vapor and volume mixing ratio for ozone. In order to make results of both instrument types comparable, profiles obtained from AIRS, accepting quality flag 0 and 1, are used to simulate Tb 18 measured by AMSU-B, using the radiative transfer model ARTS (Atmospheric Radiative Transfer Simulator) [Buehler et al., 2005]. The simulated AMSU-B measurement based on the AIRS profile is calculated for the nadir view (scan angle=0 ) and the corresponding UTH 18 is obtained by the method of [Buehler and John, 2005]. Assuming that the RT model is accurate enough, this procedure is expected to prevent wrong interpretation of the results as a consequence of different weighting functions of the instruments.
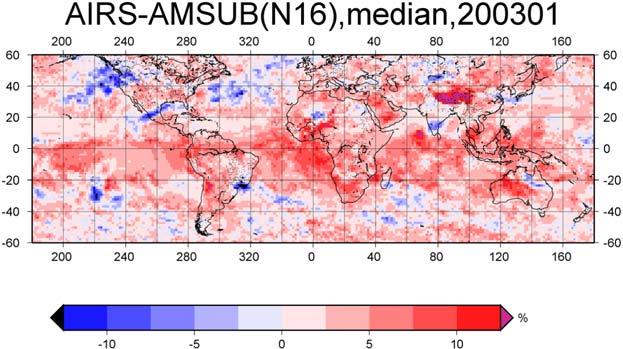
8 X - 8 MILZ ET AL.: COMPARING AIRS AND AMSUB UTH We expect some differences in the comparison between AMSU-B and AIRS UTH products due to different temporal and spatial sampling of the two instruments. The Aqua and NOAA satellites have different overpass times and the AIRS data are provided on a coarser grid than AMSU-B and HSB. The data of the individual instruments are therefore monthly averaged and binned on a 1.5 x 1.5 grid, covering the latitude range between 60 S and 60 N, resulting in up to 360 and 6000 entries per bin for AIRS and AMSU-B (N16), respectively. For some regions with high elevation, such as the Tibetan Plateau, the AIRS data products were marked as corrupted and thus are excluded from the analysis. To reduce the influence of outliers, we consider median distributions of UTH rather than means [John et al., 2006]. Averaged parameters for collocated bins and corresponding statistics are then compared and analyzed. 3. Comparison of AIRS and AMSU-B data Figure 1a shows the binned median UTH 18 distribution obtained from AMSU-B measurements for January The distribution shows expected features like high humidity over equatorial continents and the Indonesian warm pool and low UTH 18 values over the subtropical subsidence regions. Distributions obtained from HSB and AIRS for the same period show similar distributions and are therefore not shown. In the following subsections we present comparisons of UTH 18 measured by the three instruments. In general, a positive (moist) bias in UTH 18 means a negative bias in radiance (Tb 18 ) and vice versa AIRS vs AMSU-B/HSB Figure 1b shows the difference between the monthly median distribution of AIRS UTH 18 and AMSU-B-16 UTH 18. In general AIRS shows a wet bias which is larger at tropical
9 MILZ ET AL.: COMPARING AIRS AND AMSUB UTH X - 9 latitudes but for some regions with high humidity, which is related to high clouds, the bias is slightly negative. This indicates that the dry bias regions in Figure 1 are due to a sampling bias as described by Lanzante and Gahrs [2000] where cloud affected measurements with associated increased UTH are excluded for the IR-measurements but still used by the MW-measurements. In the tropics this dry bias is not visible. This is presumably because persistent deep clouds here are optically thick in MW and IR and the cloud filtering for both instrument types removes cloud affected measurements in a way that the sampling bias is reduced. For median UTH 18 distributions obtained for AIRS measurements marked as cloud free (cloud fraction approx. 0, not shown) these dry bias regions are more pronounced. Cloud free AIRS distributions show a mean dry bias of 1 %RH (Table 1). Figure 2a displays a histogram of binned UTH 18 values of (AIRS AMSU-B-16) versus AMSU-B-16 measurements. For the monthly averaged data, the mean moist bias of the AIRS UTH 18 values is 2.7 %RH, and the standard deviation of the differences is 3.2 %RH. The bias shows a slight dependence on UTH. The reduced bias for increased UTH 18 is probably a result of the above mentioned sampling bias as the amount of measurements with increased UTH 18 which are removed by the AIRS cloud filtering increases compared to AMSU-B measurements. As expected, the drop in the bias for increased UTH 18 is much more pronounced for AIRS cloud free measurements (not shown). However, the agreement might be worse for shorter timescales or restricted regions. For Comparison of AIRS with AMSU-B-15 and AMSU-B-17 the corresponding parameters are listed in Table 1. It will be further discussed in section 4.
10 X - 10 MILZ ET AL.: COMPARING AIRS AND AMSUB UTH Comparison of monthly averaged AIRS and AMSU-B-16 for other months between September 2002 and December 2003 show similar biases as January The mean bias for the monthly binned data sets for this 16 month time period is 2.8 %RH with a standard deviation of 0.2 %RH. The standard deviation here is the standard deviation for the 16 individual monthly mean values around their common mean. Thus the bias can be considered as consistent during this period. The distribution for the comparison of (AIRS-HSB) vs HSB is similar to the one comparing AIRS-AMSU-B-16 vs AMSU-B-16 and thus not shown here (see also Table 1) HSB vs AMSU-B The histogram (HSB AMSU-B-16) vs AMSU-B-16 is shown in Figure 2b. As expected, the agreement is very good, comparable to the agreement among the AMSU-B instruments on different platforms. The slight dry bias (0.8 %RH, Stddev.: 1.67 %RH) of HSB is due to a warm bias in brightness temperature. As the HSB brightness temperatures are provided without the necessary side-lobe correction, this is one possible reason for the bias. The bias for the comparison of HSB and AMSU-B-17 is 0.55 %RH (stddev.: 1.8 %RH). The bias between HSB and AMSU-B-15 is small (0.1 %RH (stddev.: 2.0 %RH)) due to the warm bias of AMSU-B-15 w.r.t. the other two AMSU-B instruments. Tb 18 (HSB) is on average warmer than Tb 18 (AMSU-B) and the difference shows a slight scan angle dependency where Tb 18 (HSB) is in average 0.2 (scan angle 0-5 ) to 0.8 K (scan angle ) warmer than Tb 18 (AMSU-B). 4. Discussion
11 MILZ ET AL.: COMPARING AIRS AND AMSUB UTH X - 11 Looking at the two instruments on board Aqua, AIRS and HSB, the data for January 2003 show a bias of 3.5 %RH (standard deviation: 3.0 %RH). For AIRS and AMSU-B- 16 the bias is 2.7 %RH (standard deviation 3.2 %RH) and for AIRS and AMSU-B-17 the bias is 3.0 %RH (standard deviation 3.2 %RH). The small observed variations in the AIRS AMSU-B bias for different satellites are most likely due to aliasing of the daily cycle from different spatial and temporal sampling and small instrumental differences between individual AMSU-B instruments. Each of these bias sources is of a magnitude that can explain the overall observed bias variations which indicate partial error cancellation. The bias between AIRS and all AMSU-B instruments can have different causes. Besides possible instrumental biases, temperature and water vapor profiles from AIRS, which are used to simulate UTH 18, are affected by constraints (e.g. a priori information) and by the accuracy of the radiative transfer model used in the retrieval process. Additionally the different cloud clearing approaches may introduce error. Due to the fact that cloudy scenes with increased humidity are partly rejected by the cloud detection, infrared instruments are expected to show a slight dry bias of about 2 to 7 %RH [Soden and Lanzante, 1996; Gaffen and Elliott, 1993]. Contrary to this expectation, AIRS UTH 18 shows a wet bias compared to AMSU-B UTH 18. Only in regions with high clouds and increased UTH 18, AIRS has small or negative biases in regions of high cloud amount indicating that cloud affected measurements with increased UTH 18 are removed from the averaged data set which are not removed from the MW measurements. A cold bias in observed temperature profiles in the upper troposphere leads to a wet bias in AIRS UTH 18. Gettelman et al. [2006] have proposed that the wet bias in AIRS relative
12 X - 12 MILZ ET AL.: COMPARING AIRS AND AMSUB UTH humidity with respect to ice (RHi) observed over Antarctica can partly be explained by a cold bias of the AIRS temperature profiles in the upper troposphere. In fact, temperature measurements of AIRS do show a cold bias of up to 0.75K in the upper troposphere [Divakarla et al., 2006]. Recently, Fetzer et al. [2008] found a % wet bias in AIRS specific humidity data at 300 hpa compared to collocated measurements by Microwave Limb sounder (MLS, on board Aura satellite). This is attributed to a dry bias in MLS data based on previous studies. However, our results indicate that at least a part of this bias can be explained by a wet bias in AIRS data at these altitudes. Both, AMSU-B and AIRS data have been compared to radiosondes in various studies. For AMSU-B data John and Buehler [2005] data confirmed a known dry bias in Vaisala RS-80 radiosonde data. They observed a mean relative dry bias of up to 11 %, depending on the time of measurement. For AIRS water vapor data the results are less clear. Comparison with different radiosonde data sets showed good agreement within the AIRS retrieval specifications. Comparisons of AIRS mass mixing ratios to radiosondes from ARM sites showed a relative bias between 0 to +5 % at 500 hpa and -10 % for the upper troposphere (at 200 hpa) which was explained by a possible wet bias of the radiosondes. However, AIRS water vapor products for the upper troposphere show a large uncertainty in terms of root mean square error (RMSE) of up to 35% depending on the location of the radiosonde launching site [Tobin et al., 2006]. The aforementioned study by Gettelman et al. [2006] shows that comparisons to radiosondes over Antarctica show a relative wet bias of approximately 20 % of AIRS with respect to RHi for the upper troposphere
13 MILZ ET AL.: COMPARING AIRS AND AMSUB UTH X - 13 compared to radiosondes for the upper troposphere under cold conditions. They state that besides the temperature bias, too high specific humidity values observed by AIRS can explain this high bias. However, for all comparisons, these biases in temperature and humidity are still within the temporal and spatial variability in humidity and described by the standard deviation of these experiments. 5. Conclusion Monthly mean distributions of UTH products from AMSU-B, HSB, and AIRS have been compared for January In the case of AIRS, microwave Tb 18 was simulated from the measured AIRS profiles with a microwave radiative transfer model. There is no significant dependence on the scan angle of the AIRS atmospheric profiles. HSB has a small warm bias compared to AMSU-B-16. The differences in Tb 18 and the resulting UTH 18 may partly be explained by missing sidelobe corrections for HSB, differences in the calibration schemes and the calculation of Tb 18. In general, the UTH 18 based on simulated Tb 18 from AIRS measurements has a slight moist bias of up to 4 %RH compared to the MW instruments, except in small areas with high cloud amount. The large discrepancies and variability observed by comparisons to radiosonde measurements are not visible in the comparison between the binned monthly mean satellite measurements. The bias between AIRS and the AMSU-B-16 in the presented UTH 18 product is small compared to differences in UTH observed between radiosondes and nadir looking infrared sounders as presented by Soden and Lanzante [1996], which were in the range of 10 to 15 %RH depending on the type of radiosondes. The mean errors introduced by using different UTH 18 data sets obtained from the different AMSU-B
14 X - 14 MILZ ET AL.: COMPARING AIRS AND AMSUB UTH sensors and AIRS are small compared to other error sources and especially compared to the large differences in UTH in different climate models [John and Soden, 2007]. Thus, these datasets are suitable as benchmark for improving climate model representations of humidity. Acknowledgments. Thanks to two anonymous reviewers for their constructive comments. Thanks to Lisa Neclos from NOAA s CLASS online facility for providing the AMSU data. Thanks to the AIRS and HSB teams for their data. Furthermore, thanks to the ARTS radiative transfer community, many of whom have indirectly contributed by implementing features to the ARTS model. This work is a contribution to COST Action ES0604, Atmospheric Water Vapor in the Climate System. Viju John is supported by the U.K. Joint DECC and MoD Integrated Climate Programme - GA01101, CBC/2B/0417 Annex C5. Through his contribution this paper is British Crown Copyright. References Buehler, S. A., and V. O. John, A simple method to relate microwave radiances to upper tropospheric humidity, J. Geophys. Res., 110, D02110, doi: /2004jd005111, Buehler, S. A., P. Eriksson, T. Kuhn, A. von Engeln, and C. Verdes, ARTS, the atmospheric radiative transfer simulator, J. Quant. Spectrosc. Radiat. Transfer, 91 (1), 65 93, doi: /j.jqsrt , 2005.
15 MILZ ET AL.: COMPARING AIRS AND AMSUB UTH X - 15 Buehler, S. A., M. Kuvatov, T. R. Sreerekha, V. O. John, B. Rydberg, P. Eriksson, and J. Notholt, A cloud filtering method for microwave upper tropospheric humidity measurements, Atmos. Chem. Phys., 7 (21), , Buehler, S. A., M. Kuvatov, V. O. John, M. Milz, B. J. Soden, and J. Notholt, An upper tropospheric humidity data set from operational satellite microwave data, J. Geophys. Res., 113, D14110, doi: /2007jd009314, Divakarla, M. G., C. D. Barnet, M. D. Goldberg, L. M. McMillin, E. Maddy, W. Wolf, L. Zhou, and X. Liu, Validation of atmospheric infrared sounder temperature and water vapor retrievals with matched radiosonde measurements and forecasts, J. Geophys. Res., 111 (D09S15), doi: / , Fetzer, E. J., et al., Comparison of upper tropospheric water vapor observations from the microwave limb sounder and atmospheric infrared sounder, J. Geophys. Res., 113, doi: /2008jd010000, Gaffen, D. J., and W. P. Elliott, Column water vapor content in clear and cloudy skies, J. Climate, 6, , Gettelman, A., V. P. Walden, L. M. Miloshevich, W. L. Roth, and B. Halter, Relative humidity over antarctica from radiosondes, satellites and a general circulation model, J. Geophys. Res., doi: /2005jd006636, Intergovernmental Panel on Climate Change, Fourth Assessment Report: Climate Change 2007: The AR4 Synthesis Report, Geneva: IPCC, John, V. O., and S. A. Buehler, Comparison of microwave satellite humidity data and radiosonde profiles: A survey of European stations, Atmos. Chem. Phys., 5, ,
16 X - 16 MILZ ET AL.: COMPARING AIRS AND AMSUB UTH sref-id: /acp/ , John, V. O., and B. J. Soden, Temperature and humidity biases in global climate models and their impact on climate feedbacks, Geophys. Res. Lett., 34, L18704, doi: / 2007GL030429, John, V. O., S. A. Buehler, and N. Courcoux, A cautionary note on the use of gaussian statistics in satellite based UTH climatologies, IEEE Geosci. R. S. Le., 3 (1), , doi: /lgrs , Labrot, T., L. Lavanant, K. Whyte, N. Atkinson, and P. Brunel, AAPP documentation scientific description, version 6.0, document nwpsaf-mf-ud-001, Tech. rep., NWP SAF, Satellite Application Facility for Numerical Weather Prediction, NWPSAF-MF-UD%-001_Science.pdf, Lanzante, J. R., and G. E. Gahrs, The clear-sky bias of TOVS upper-tropospheric humidity, J. Climate, 13, , Soden, B. J., and F. P. Bretherton, Interpretation of TOVS water vapor radiances in terms of layer-average relative humidities: Method and climatology for the upper, middle, and lower troposphere, J. Geophys. Res., 101 (D5), , doi: /96jd00280, Soden, B. J., and J. R. Lanzante, An assessment of satellite and radiosonde climatologies of upper-tropospheric water vapor, J. Climate, 9, , Susskind, J., C. D. Barnet, and J. Blaisdell, Retrieval of atmospheric and surface parameters from airs/amsu.hsb data under cloud conditions, IEEE, pp , 2003.
17 MILZ ET AL.: COMPARING AIRS AND AMSUB UTH X - 17 Table 1. Summary of biases, standard deviations, regression coefficients between UTH 18 of different instruments. The data are for January Instruments Bias Standard- [%RH] deviation AMSU-B (N15) vs AIRS AMSU-B (N16) vs AIRS AMSU-B (N16) vs AIRS (cloud-free) AMSU-B (N17) vs AIRS HSB vs AIRS AMSU-B (N15) vs HSB AMSU-B (N16) vs HSB AMSU-B (N17) vs HSB Figure 1. a): Median UTH distribution for AMSU-B-16 for January The UTH data are binned to a 1.5x1.5 grid. b): Distribution of the differences of the binned median distributions for AIRS - AMSU-B-16 for the same period. Figure 2. Difference of the median binned UTH values for AIRS- AMSU-B-16 vs AMSU-B-16 (a)) and HSB - AMSU-B-16 vs AMSU-B-16 (b)) for January The solid white line is the mean and the dashed white line the standard deviation of the differences for 1% RH bins. Darker shades indicate higher number of measurements. Tobin, D. C., et al., Atmospheric radiation measurement site atmospheric state best estimates for atmospheric infrared sounder temperature and water vapor retrieval validation, J. Geophys. Res., 111, D09S14, doi: /2005jd006103, 2006.

18

19
Comparison of AMSU-B Brightness Temperature with Simulated Brightness Temperature using Global Radiosonde Data
 Comparison of AMSU-B Brightness Temperature with Simulated Brightness Temperature using Global Radiosonde Data V.O. John, S.A. Buehler, and M. Kuvatov Institute of Environmental Physics, University of
Retrieval of upper tropospheric humidity from AMSU data. Viju Oommen John, Stefan Buehler, and Mashrab Kuvatov
 Retrieval of upper tropospheric humidity from AMSU data Viju Oommen John, Stefan Buehler, and Mashrab Kuvatov Institute of Environmental Physics, University of Bremen, Otto-Hahn-Allee 1, 2839 Bremen, Germany.
A cloud filtering method for microwave upper tropospheric humidity measurements
 Atmos. Chem. Phys., 7, 5531 5542, 27 www.atmos-chem-phys.net/7/5531/27/ Author(s) 27. This work is licensed under a Creative Commons License. Atmospheric Chemistry and Physics A cloud filtering method
P2.7 CHARACTERIZATION OF AIRS TEMPERATURE AND WATER VAPOR MEASUREMENT CAPABILITY USING CORRELATIVE OBSERVATIONS
 P2.7 CHARACTERIZATION OF AIRS TEMPERATURE AND WATER VAPOR MEASUREMENT CAPABILITY USING CORRELATIVE OBSERVATIONS Eric J. Fetzer, Annmarie Eldering and Sung -Yung Lee Jet Propulsion Laboratory, California
Comparing upper tropospheric humidity data from microwave satellite instruments and tropical radiosondes
 JOURNAL OF GEOPHYSICAL RESEARCH, VOL.???, XXXX, DOI:10.1029/, 1 2 3 Comparing upper tropospheric humidity data from microwave satellite instruments and tropical radiosondes Isaac Moradi 1, Stefan A. Buehler
An upper tropospheric humidity data set from operational satellite microwave data
 Click Here for Full Article JOURNAL OF GEOPHYSICAL RESEARCH, VOL. 113,, doi:10.1029/2007jd009314, 2008 An upper tropospheric humidity data set from operational satellite microwave data S. A. Buehler, 1
Bias correction of satellite data at the Met Office
 Bias correction of satellite data at the Met Office Nigel Atkinson, James Cameron, Brett Candy and Stephen English Met Office, Fitzroy Road, Exeter, EX1 3PB, United Kingdom 1. Introduction At the Met Office,
Comparing upper tropospheric humidity data from microwave satellite instruments and tropical radiosondes
 JOURNAL OF GEOPHYSICAL RESEARCH, VOL. 115,, doi:10.1029/2010jd013962, 2010 Comparing upper tropospheric humidity data from microwave satellite instruments and tropical radiosondes Isaac Moradi, 1 Stefan
Observed and Simulated Upper-Tropospheric Water Vapor Feedback
 3282 J O U R N A L O F C L I M A T E VOLUME 21 Observed and Simulated Upper-Tropospheric Water Vapor Feedback A. GETTELMAN National Center for Atmospheric Research,* Boulder, Colorado Q. FU University
Clear sky biases in satellite infrared estimates of upper tropospheric humidity and its trends
 JOURNAL OF GEOPHYSICAL RESEARCH, VOL. 116,, doi:10.1029/2010jd015355, 2011 Clear sky biases in satellite infrared estimates of upper tropospheric humidity and its trends Viju O. John, 1 Gerrit Holl, 2
Principal Component Analysis (PCA) of AIRS Data
 of AIRS Data") Principal Component Analysis (PCA) of AIRS Data Mitchell D. Goldberg 1, Lihang Zhou 2, Walter Wolf 2 and Chris Barnet 1 NOAA/NESDIS/Office of Research and Applications, Camp Springs, MD 1 QSS Group Inc.
Principal Component Analysis (PCA) of AIRS Data Mitchell D. Goldberg 1, Lihang Zhou 2, Walter Wolf 2 and Chris Barnet 1 NOAA/NESDIS/Office of Research and Applications, Camp Springs, MD 1 QSS Group Inc.
Performance of the AIRS/AMSU And MODIS Soundings over Natal/Brazil Using Collocated Sondes: Shadoz Campaign
 Performance of the AIRS/AMSU And MODIS Soundings over Natal/Brazil Using Collocated Sondes: Shadoz Campaign 2004-2005 Rodrigo Augusto Ferreira de Souza, Jurandir Rodrigues Ventura, Juan Carlos Ceballos
DERIVING ATMOSPHERIC MOTION VECTORS FROM AIRS MOISTURE RETRIEVAL DATA
 DERIVING ATMOSPHERIC MOTION VECTORS FROM AIRS MOISTURE RETRIEVAL DATA David Santek 1, Sharon Nebuda 1, Christopher Velden 1, Jeff Key 2, Dave Stettner 1 1 Cooperative Institute for Meteorological Satellite
Stratospheric Influences on MSU-Derived Tropospheric Temperature Trends: A Direct Error Analysis
 4636 JOURNAL OF CLIMATE Stratospheric Influences on MSU-Derived Tropospheric Temperature Trends: A Direct Error Analysis QIANG FU ANDCELESTE M. JOHANSON Department of Atmospheric Sciences, University of
The NOAA Unique CrIS/ATMS Processing System (NUCAPS): first light retrieval results
: first light retrieval results") The NOAA Unique CrIS/ATMS Processing System (NUCAPS): first light retrieval results A. Gambacorta (1), C. Barnet (2), W.Wolf (2), M. Goldberg (2), T. King (1), X. Ziong (1), N. Nalli (3), E. Maddy (1),
The NOAA Unique CrIS/ATMS Processing System (NUCAPS): first light retrieval results A. Gambacorta (1), C. Barnet (2), W.Wolf (2), M. Goldberg (2), T. King (1), X. Ziong (1), N. Nalli (3), E. Maddy (1),
Atmospheric total precipitable water from AIRS and ECMWF during Antarctic summer
 Click Here for Full Article GEOPHYSICAL RESEARCH LETTERS, VOL. 34, L19701, doi:10.1029/2006gl028547, 2007 Atmospheric total precipitable water from AIRS and ECMWF during Antarctic summer Hengchun Ye, 1
The NOAA/NESDIS/STAR IASI Near Real-Time Product Processing and Distribution System
 The NOAA/NESDIS/STAR Near Real-Time Product Processing and Distribution System W. Wolf 2, T. King 1, Z. Cheng 1, W. Zhou 1, H. Sun 1, P. Keehn 1, L. Zhou 1, C. Barnet 2, and M. Goldberg 2 1 QSS Group Inc,
Spaceborne Hyperspectral Infrared Observations of the Cloudy Boundary Layer
 Spaceborne Hyperspectral Infrared Observations of the Cloudy Boundary Layer Eric J. Fetzer With contributions by Alex Guillaume, Tom Pagano, John Worden and Qing Yue Jet Propulsion Laboratory, JPL KISS
Assessment of inter-calibration methods for satellite microwave humidity sounders
 JOURNAL OF GEOPHYSICAL RESEARCH, VOL.???, XXXX, DOI:1.19/, 1 Assessment of inter-calibration methods for satellite microwave humidity sounders Viju O. John 1, Richard P. Allan, William Bell 3, Stefan A.
COMPARISON OF SIMULATED RADIANCE FIELDS USING RTTOV AND CRTM AT MICROWAVE FREQUENCIES IN KOPS FRAMEWORK
 COMPARISON OF SIMULATED RADIANCE FIELDS USING RTTOV AND CRTM AT MICROWAVE FREQUENCIES IN KOPS FRAMEWORK Ju-Hye Kim 1, Jeon-Ho Kang 1, Hyoung-Wook Chun 1, and Sihye Lee 1 (1) Korea Institute of Atmospheric
CORRELATION BETWEEN ATMOSPHERIC COMPOSITION AND VERTICAL STRUCTURE AS MEASURED BY THREE GENERATIONS OF HYPERSPECTRAL SOUNDERS IN SPACE
 CORRELATION BETWEEN ATMOSPHERIC COMPOSITION AND VERTICAL STRUCTURE AS MEASURED BY THREE GENERATIONS OF HYPERSPECTRAL SOUNDERS IN SPACE Nadia Smith 1, Elisabeth Weisz 1, and Allen Huang 1 1 Space Science
AIRS observations of Dome Concordia in Antarctica and comparison with Automated Weather Stations during 2005
 AIRS observations of Dome Concordia in Antarctica and comparison with Automated Weather Stations during 2005, Dave Gregorich and Steve Broberg Jet Propulsion Laboratory California Institute of Technology
Towards a better use of AMSU over land at ECMWF
 Towards a better use of AMSU over land at ECMWF Blazej Krzeminski 1), Niels Bormann 1), Fatima Karbou 2) and Peter Bauer 1) 1) European Centre for Medium-range Weather Forecasts (ECMWF), Shinfield Park,
Correcting diurnal cycle aliasing in satellite microwave humidity sounder measurements
 JOURNAL OF GEOPHYSICAL RESEARCH: ATMOSPHERES, VOL. 118, 101 113, doi:10.1029/20jd018545, 2013 Correcting diurnal cycle aliasing in satellite microwave humidity sounder measurements Ajil Kottayil, 1 Viju
Plans for the Assimilation of Cloud-Affected Infrared Soundings at the Met Office
 Plans for the Assimilation of Cloud-Affected Infrared Soundings at the Met Office Ed Pavelin and Stephen English Met Office, Exeter, UK Abstract A practical approach to the assimilation of cloud-affected
Assessment of intercalibration methods for satellite microwave humidity sounders
 JOURNAL OF GEOPHYSICAL RESEARCH: ATMOSPHERES, VOL. 118, 96 918, doi:1.1/jgrd.38, 13 Assessment of intercalibration methods for satellite microwave humidity sounders Viju O. John, 1 Richard P. Allan, William
Combining Polar Hyper-spectral and Geostationary Multi-spectral Sounding Data A Method to Optimize Sounding Spatial and Temporal Resolution
 Combining Polar Hyper-spectral and Geostationary Multi-spectral Sounding Data A Method to Optimize Sounding Spatial and Temporal Resolution W. L. Smith 1,2, E. Weisz 1, and J. McNabb 2 1 University of
Satellite data assimilation for Numerical Weather Prediction II
 Satellite data assimilation for Numerical Weather Prediction II Niels Bormann European Centre for Medium-range Weather Forecasts (ECMWF) (with contributions from Tony McNally, Jean-Noël Thépaut, Slide
NOAA MSU/AMSU Radiance FCDR. Methodology, Production, Validation, Application, and Operational Distribution. Cheng-Zhi Zou
 NOAA MSU/AMSU Radiance FCDR Methodology, Production, Validation, Application, and Operational Distribution Cheng-Zhi Zou NOAA/NESDIS/Center for Satellite Applications and Research GSICS Microwave Sub-Group
Data Short description Parameters to be used for analysis SYNOP. Surface observations by ships, oil rigs and moored buoys
 3.2 Observational Data 3.2.1 Data used in the analysis Data Short description Parameters to be used for analysis SYNOP Surface observations at fixed stations over land P,, T, Rh SHIP BUOY TEMP PILOT Aircraft
Comparison of NASA AIRS and MODIS Land Surface Temperature and Infrared Emissivity Measurements from the EOS AQUA platform
 Comparison of NASA AIRS and MODIS Land Surface Temperature and Infrared Emissivity Measurements from the EOS AQUA platform Robert Knuteson, Hank Revercomb, Dave Tobin University of Wisconsin-Madison 16
Climate Applications from High Spectral Resolution Infrared Sounders
 Climate Applications from High Spectral Resolution Infrared Sounders Mitchell D. Goldberg, Lihang Zhou, and Xingpin Liu National Oceanic and Atmospheric Administration, National Environmental Satellite,
The assimilation of AMSU and SSM/I brightness temperatures in clear skies at the Meteorological Service of Canada
 The assimilation of AMSU and SSM/I brightness temperatures in clear skies at the Meteorological Service of Canada Abstract David Anselmo and Godelieve Deblonde Meteorological Service of Canada, Dorval,
Validation of Atmospheric Infrared Sounder temperature and water vapor retrievals with matched radiosonde measurements and forecasts
 JOURNAL OF GEOPHYSICAL RESEARCH, VOL. 111,, doi:10.1029/2005jd006116, 2006 Validation of Atmospheric Infrared Sounder temperature and water vapor retrievals with matched radiosonde measurements and forecasts
Sensitivity Study of the MODIS Cloud Top Property
 Sensitivity Study of the MODIS Cloud Top Property Algorithm to CO 2 Spectral Response Functions Hong Zhang a*, Richard Frey a and Paul Menzel b a Cooperative Institute for Meteorological Satellite Studies,
Comparison of NASA AIRS and MODIS Land Surface Temperature and Infrared Emissivity Measurements from the EOS AQUA platform
 Comparison of NASA AIRS and MODIS Land Surface Temperature and Infrared Emissivity Measurements from the EOS AQUA platform Robert Knuteson, Steve Ackerman, Hank Revercomb, Dave Tobin University of Wisconsin-Madison
Extending the use of surface-sensitive microwave channels in the ECMWF system
 Extending the use of surface-sensitive microwave channels in the ECMWF system Enza Di Tomaso and Niels Bormann European Centre for Medium-range Weather Forecasts Shinfield Park, Reading, RG2 9AX, United
Stratospheric Influences on MSU-Derived Tropospheric Temperature. Trends: A Direct Error Analysis
 Stratospheric Influences on MSU-Derived Tropospheric Temperature Trends: A Direct Error Analysis Qiang Fu and Celeste M. Johanson Department of Atmospheric Sciences, University of Washington, Seattle,
Bias correction of satellite data at the Met Office
 Bias correction of satellite data at the Met Office Nigel Atkinson, James Cameron, Brett Candy and Steve English ECMWF/EUMETSAT NWP-SAF Workshop on Bias estimation and correction in data assimilation,
Biases in total precipitable water vapor climatologies from Atmospheric Infrared Sounder and Advanced Microwave Scanning Radiometer
 JOURNAL OF GEOPHYSICAL RESEARCH, VOL. 111,, doi:10.1029/2005jd006598, 2006 Biases in total precipitable water vapor climatologies from Atmospheric Infrared Sounder and Advanced Microwave Scanning Radiometer
Using HIRS Observations to Construct Long-Term Global Temperature and Water Vapor Profile Time Series
 Using HIRS Observations to Construct Long-Term Global Temperature and Water Vapor Profile Time Series Lei Shi and John J. Bates National Climatic Data Center, National Oceanic and Atmospheric Administration
SCIAMACHY REFLECTANCE AND POLARISATION VALIDATION: SCIAMACHY VERSUS POLDER
 SCIAMACHY REFLECTANCE AND POLARISATION VALIDATION: SCIAMACHY VERSUS POLDER L. G. Tilstra (1), P. Stammes (1) (1) Royal Netherlands Meteorological Institute (KNMI), P.O. Box 201, 3730 AE de Bilt, The Netherlands
Interpretation of Polar-orbiting Satellite Observations. Atmospheric Instrumentation
 Interpretation of Polar-orbiting Satellite Observations Outline Polar-Orbiting Observations: Review of Polar-Orbiting Satellite Systems Overview of Currently Active Satellites / Sensors Overview of Sensor
The ATOVS and AVHRR Product Processing Facility of EPS
 The ATOVS and AVHRR Product Processing Facility of EPS Dieter Klaes, Jörg Ackermann, Rainer Schraidt, Tim Patterson, Peter Schlüssel, Pepe Phillips, Arlindo Arriaga, and Jochen Grandell EUMETSAT Am Kavalleriesand
Remote sensing of ice clouds
 Remote sensing of ice clouds Carlos Jimenez LERMA, Observatoire de Paris, France GDR microondes, Paris, 09/09/2008 Outline : ice clouds and the climate system : VIS-NIR, IR, mm/sub-mm, active 3. Observing
THE VALIDATION OF GOES-LI AND AIRS TOTAL PRECIPITABLE WATER RETRIEVALS USING GROUND-BASED MEASUREMENTS
 THE VALIDATION OF GOES-LI AND AIRS TOTAL PRECIPITABLE WATER RETRIEVALS USING GROUND-BASED MEASUREMENTS Richard Dworak and Ralph A. Petersen Cooperative Institute for Meteorological Satellite Studies, University
REVISION OF THE STATEMENT OF GUIDANCE FOR GLOBAL NUMERICAL WEATHER PREDICTION. (Submitted by Dr. J. Eyre)
") WORLD METEOROLOGICAL ORGANIZATION Distr.: RESTRICTED CBS/OPAG-IOS (ODRRGOS-5)/Doc.5, Add.5 (11.VI.2002) COMMISSION FOR BASIC SYSTEMS OPEN PROGRAMME AREA GROUP ON INTEGRATED OBSERVING SYSTEMS ITEM: 4 EXPERT
WORLD METEOROLOGICAL ORGANIZATION Distr.: RESTRICTED CBS/OPAG-IOS (ODRRGOS-5)/Doc.5, Add.5 (11.VI.2002) COMMISSION FOR BASIC SYSTEMS OPEN PROGRAMME AREA GROUP ON INTEGRATED OBSERVING SYSTEMS ITEM: 4 EXPERT
Evaluation of FY-3B data and an assessment of passband shifts in AMSU-A and MSU during the period
 Interim report of Visiting Scientist mission NWP_11_05 Document NWPSAF-EC-VS-023 Version 0.1 28 March 2012 Evaluation of FY-3B data and an assessment of passband Qifeng Lu 1 and William Bell 2 1. China
Bias correction of satellite data at Météo-France
 Bias correction of satellite data at Météo-France É. Gérard, F. Rabier, D. Lacroix, P. Moll, T. Montmerle, P. Poli CNRM/GMAP 42 Avenue Coriolis, 31057 Toulouse, France 1. Introduction Bias correction at
Long-Term Time Series of Water Vapour Total Columns from GOME, SCIAMACHY and GOME-2
 Graphics: ESA Graphics: ESA Graphics: ESA Long-Term Time Series of Water Vapour Total Columns from GOME, SCIAMACHY and GOME-2 S. Noël, S. Mieruch, H. Bovensmann, J. P. Burrows Institute of Environmental
RTMIPAS: A fast radiative transfer model for the assimilation of infrared limb radiances from MIPAS
 RTMIPAS: A fast radiative transfer model for the assimilation of infrared limb radiances from MIPAS Niels Bormann, Sean Healy, and Marco Matricardi European Centre for Medium-range Weather Forecasts (ECMWF),
Chalmers Publication Library
 Chalmers Publication Library Retrieving Layer-Averaged Tropospheric Humidity from Advanced Technology Microwave Sounder Water Vapor Channels This document has been downloaded from Chalmers Publication
P6.13 GLOBAL AND MONTHLY DIURNAL PRECIPITATION STATISTICS BASED ON PASSIVE MICROWAVE OBSERVATIONS FROM AMSU
 P6.13 GLOBAL AND MONTHLY DIURNAL PRECIPITATION STATISTICS BASED ON PASSIVE MICROWAVE OBSERVATIONS FROM AMSU Frederick W. Chen*, David H. Staelin, and Chinnawat Surussavadee Massachusetts Institute of Technology,
Three-dimensional tropospheric water vapor in coupled climate models compared with observations from the AIRS satellite system
 Click Here for Full Article GEOPHYSICAL RESEARCH LETTERS, VOL. 33, L21701, doi:10.1029/2006gl027060, 2006 Three-dimensional tropospheric water vapor in coupled climate models compared with observations
Michelle Feltz, Robert Knuteson, Dave Tobin, Tony Reale*, Steve Ackerman, Henry Revercomb
 P1 METHODOLOGY FOR THE VALIDATION OF TEMPERATURE PROFILE ENVIRONMENTAL DATA RECORDS (EDRS) FROM THE CROSS-TRACK INFRARED MICROWAVE SOUNDING SUITE (CRIMSS): EXPERIENCE WITH RADIO OCCULTATION FROM COSMIC
Study of temperature and moisture profiles retrieved from microwave and hyperspectral infrared sounder data over Indian regions
 Indian Journal of Radio & Space Physics Vol. 35, August 2006, pp. 286-292 Study of temperature and moisture profiles retrieved from microwave and hyperspectral infrared sounder data over Indian regions
GIFTS SOUNDING RETRIEVAL ALGORITHM DEVELOPMENT
 P2.32 GIFTS SOUNDING RETRIEVAL ALGORITHM DEVELOPMENT Jun Li, Fengying Sun, Suzanne Seemann, Elisabeth Weisz, and Hung-Lung Huang Cooperative Institute for Meteorological Satellite Studies (CIMSS) University
On the Satellite Determination of Multilayered Multiphase Cloud Properties. Science Systems and Applications, Inc., Hampton, Virginia 2
 JP1.10 On the Satellite Determination of Multilayered Multiphase Cloud Properties Fu-Lung Chang 1 *, Patrick Minnis 2, Sunny Sun-Mack 1, Louis Nguyen 1, Yan Chen 2 1 Science Systems and Applications, Inc.,
Atmospheric Profiles Over Land and Ocean from AMSU
 P1.18 Atmospheric Profiles Over Land and Ocean from AMSU John M. Forsythe, Kevin M. Donofrio, Ron W. Kessler, Andrew S. Jones, Cynthia L. Combs, Phil Shott and Thomas H. Vonder Haar DoD Center for Geosciences
Joint Airborne IASI Validation Experiment (JAIVEx) - An Overview
 - An Overview") Joint Airborne IASI Validation Experiment (JAIVEx) - An Overview W. Smith 1,2, A. Larar 3, J.Taylor 4, H. Revercomb 2, S. Kireev 1, D. Zhou 3, X. Liu 3, D. Tobin 2, S. Newman 4, P. Schluessel 5, X. Calbet
Joint Airborne IASI Validation Experiment (JAIVEx) - An Overview W. Smith 1,2, A. Larar 3, J.Taylor 4, H. Revercomb 2, S. Kireev 1, D. Zhou 3, X. Liu 3, D. Tobin 2, S. Newman 4, P. Schluessel 5, X. Calbet
Synergistic use of AIRS and MODIS radiance measurements for atmospheric profiling
 Click Here for Full Article GEOPHYSICAL RESEARCH LETTERS, VOL. 35, L21802, doi:10.1029/2008gl035859, 2008 Synergistic use of AIRS and MODIS radiance measurements for atmospheric profiling Chian-Yi Liu,
The impact of assimilation of microwave radiance in HWRF on the forecast over the western Pacific Ocean
 The impact of assimilation of microwave radiance in HWRF on the forecast over the western Pacific Ocean Chun-Chieh Chao, 1 Chien-Ben Chou 2 and Huei-Ping Huang 3 1Meteorological Informatics Business Division,
Effect of Predictor Choice on the AIRS Bias Correction at the Met Office
 Effect of Predictor Choice on the AIRS Bias Correction at the Met Office Brett Harris Bureau of Meterorology Research Centre, Melbourne, Australia James Cameron, Andrew Collard and Roger Saunders, Met
Introduction of the Hyperspectral Environmental Suite (HES) on GOES-R and beyond
 on GOES-R and beyond") Introduction of the Hyperspectral Environmental Suite (HES) on GOES-R and beyond 1 Timothy J. Schmit, 2 Jun Li, 3 James Gurka 1 NOAA/NESDIS, Office of Research and Applications, Advanced Satellite Products
Introduction of the Hyperspectral Environmental Suite (HES) on GOES-R and beyond 1 Timothy J. Schmit, 2 Jun Li, 3 James Gurka 1 NOAA/NESDIS, Office of Research and Applications, Advanced Satellite Products
Atmospheric Soundings of Temperature, Moisture and Ozone from AIRS
 Atmospheric Soundings of Temperature, Moisture and Ozone from AIRS M.D. Goldberg, W. Wolf, L. Zhou, M. Divakarla,, C.D. Barnet, L. McMillin, NOAA/NESDIS/ORA Oct 31, 2003 Presented at ITSC-13 Risk Reduction
Aerosol impact and correction on temperature profile retrieval from MODIS
 GEOPHYSICAL RESEARCH LETTERS, VOL. 35, L13818, doi:10.1029/2008gl034419, 2008 Aerosol impact and correction on temperature profile retrieval from MODIS Jie Zhang 1,2 and Qiang Zhang 1,2 Received 24 April
SSMIS 1D-VAR RETRIEVALS. Godelieve Deblonde
 SSMIS 1D-VAR RETRIEVALS Godelieve Deblonde Meteorological Service of Canada, Dorval, Québec, Canada Summary Retrievals using synthetic background fields and observations for the SSMIS (Special Sensor Microwave
Satellite data assimilation for NWP: II
 Satellite data assimilation for NWP: II Jean-Noël Thépaut European Centre for Medium-range Weather Forecasts (ECMWF) with contributions from many ECMWF colleagues Slide 1 Special thanks to: Tony McNally,
Radiometric correction of observations from microwave humidity sounders
 Radiometric correction of observations from microwave humidity sounders Isaac Moradi 1,,3, James Beauchamp 1, and Ralph Ferraro 1 ESSIC, University of Maryland, College Park, Maryland, USA. STAR, NOAA,
Instrumentation planned for MetOp-SG
 Instrumentation planned for MetOp-SG Bill Bell Satellite Radiance Assimilation Group Met Office Crown copyright Met Office Outline Background - the MetOp-SG programme The MetOp-SG instruments Summary Acknowledgements:
OBSERVING SYSTEM EXPERIMENTS ON ATOVS ORBIT CONSTELLATIONS
 OBSERVING SYSTEM EXPERIMENTS ON ATOVS ORBIT CONSTELLATIONS Enza Di Tomaso and Niels Bormann European Centre for Medium-range Weather Forecasts Shinfield Park, Reading, RG2 9AX, United Kingdom Abstract
The Use of Hyperspectral Infrared Radiances In Numerical Weather Prediction
 The Use of Hyperspectral Infrared Radiances In Numerical Weather Prediction J. Le Marshall 1, J. Jung 1, J. Derber 1, T. Zapotocny 2, W. L. Smith 3, D. Zhou 4, R. Treadon 1, S. Lord 1, M. Goldberg 1 and
Future Opportunities of Using Microwave Data from Small Satellites for Monitoring and Predicting Severe Storms
 Future Opportunities of Using Microwave Data from Small Satellites for Monitoring and Predicting Severe Storms Fuzhong Weng Environmental Model and Data Optima Inc., Laurel, MD 21 st International TOV
TOWARDS IMPROVED HEIGHT ASSIGNMENT AND QUALITY CONTROL OF AMVS IN MET OFFICE NWP
 Proceedings for the 13 th International Winds Workshop 27 June - 1 July 2016, Monterey, California, USA TOWARDS IMPROVED HEIGHT ASSIGNMENT AND QUALITY CONTROL OF AMVS IN MET OFFICE NWP James Cotton, Mary
9.12 EVALUATION OF CLIMATE-MODEL SIMULATIONS OF HIRS WATER-VAPOUR CHANNEL RADIANCES
 9.12 EVALUATION OF CLIMATE-MODEL SIMULATIONS OF HIRS WATER-VAPOUR CHANNEL RADIANCES Richard P. Allan* and Mark A. Ringer Hadley Centre for Climate Prediction and Research Met Office, Bracknell, Berkshire,
ASSIMILATION OF CLOUDY AMSU-A MICROWAVE RADIANCES IN 4D-VAR 1. Stephen English, Una O Keeffe and Martin Sharpe
 ASSIMILATION OF CLOUDY AMSU-A MICROWAVE RADIANCES IN 4D-VAR 1 Stephen English, Una O Keeffe and Martin Sharpe Met Office, FitzRoy Road, Exeter, EX1 3PB Abstract The assimilation of cloud-affected satellite
Lecture 19: Operational Remote Sensing in Visible, IR, and Microwave Channels
 MET 4994 Remote Sensing: Radar and Satellite Meteorology MET 5994 Remote Sensing in Meteorology Lecture 19: Operational Remote Sensing in Visible, IR, and Microwave Channels Before you use data from any
ASSIMILATION EXPERIMENTS WITH DATA FROM THREE CONICALLY SCANNING MICROWAVE INSTRUMENTS (SSMIS, AMSR-E, TMI) IN THE ECMWF SYSTEM
 IN THE ECMWF SYSTEM") ASSIMILATION EXPERIMENTS WITH DATA FROM THREE CONICALLY SCANNING MICROWAVE INSTRUMENTS (SSMIS, AMSR-E, TMI) IN THE ECMWF SYSTEM Niels Bormann 1, Graeme Kelly 1, Peter Bauer 1, and Bill Bell 2 1 ECMWF,
ASSIMILATION EXPERIMENTS WITH DATA FROM THREE CONICALLY SCANNING MICROWAVE INSTRUMENTS (SSMIS, AMSR-E, TMI) IN THE ECMWF SYSTEM Niels Bormann 1, Graeme Kelly 1, Peter Bauer 1, and Bill Bell 2 1 ECMWF,
M. Mielke et al. C5816
 Atmos. Chem. Phys. Discuss., 14, C5816 C5827, 2014 www.atmos-chem-phys-discuss.net/14/c5816/2014/ Author(s) 2014. This work is distributed under the Creative Commons Attribute 3.0 License. Atmospheric
Use of AMSU data in the Met Office UK Mesoscale Model
 Use of AMSU data in the Met Office UK Mesoscale Model 1. Introduction Brett Candy, Stephen English, Richard Renshaw & Bruce Macpherson The Met Office, Exeter, United Kingdom In common with other global
Feature-tracked 3D Winds from Satellite Sounders: Derivation and Impact in Global Models
 Feature-tracked 3D Winds from Satellite Sounders: Derivation and Impact in Global Models David Santek, Anne-Sophie Daloz 1, Samantha Tushaus 1, Marek Rogal 1, Will McCarty 2 1 Space Science and Engineering
Performance of sounding retrievals from AIRS, GOES10, MODIS and HIRS Radiances during Mini-Barca campaign June 2008
 Performance of sounding retrievals from AIRS, GOES10, MODIS and HIRS Radiances during Mini-Barca campaign June 2008 Simone Sievert da Costa 1 Jurandir Ventura Rodrigues 1 Weber Andrade Gonçalves 1 Rodrigo
esa ACE+ An Atmosphere and Climate Explorer based on GPS, GALILEO, and LEO-LEO Occultation Per Høeg (AIR/DMI) Gottfried Kirchengast (IGAM/UG)
 Gottfried Kirchengast (IGAM/UG)") ACE+ An Atmosphere and Climate Explorer based on GPS, GALILEO, and LEO-LEO Occultation Per Høeg (AIR/DMI) Gottfried Kirchengast (IGAM/UG) OPAC-1, September, 2002 1 Objectives Climate Monitoring global
ACE+ An Atmosphere and Climate Explorer based on GPS, GALILEO, and LEO-LEO Occultation Per Høeg (AIR/DMI) Gottfried Kirchengast (IGAM/UG) OPAC-1, September, 2002 1 Objectives Climate Monitoring global
Ground-based temperature and humidity profiling using microwave radiometer retrievals at Sydney Airport.
 Ground-based temperature and humidity profiling using microwave radiometer retrievals at Sydney Airport. Peter Ryan Bureau of Meteorology, Melbourne, Australia Peter.J.Ryan@bom.gov.au ABSTRACT The aim
NUMERICAL EXPERIMENTS USING CLOUD MOTION WINDS AT ECMWF GRAEME KELLY. ECMWF, Shinfield Park, Reading ABSTRACT
 NUMERICAL EXPERIMENTS USING CLOUD MOTION WINDS AT ECMWF GRAEME KELLY ECMWF, Shinfield Park, Reading ABSTRACT Recent monitoring of cloud motion winds (SATOBs) at ECMWF has shown an improvement in quality.
Toward assimilation of CrIS and ATMS in the NCEP Global Model
 Toward assimilation of CrIS and ATMS in the NCEP Global Model Andrew Collard 1, John Derber 2, Russ Treadon 2, Nigel Atkinson 3, Jim Jung 4 and Kevin Garrett 5 1 IMSG at NOAA/NCEP/EMC 2 NOAA/NCEP/EMC 3
Evaluation of AIRS, IASI, and OMI ozone profile retrievals in the extratropical tropopause region using in situ aircraft measurements
 Click Here for Full Article JOURNAL OF GEOPHYSICAL RESEARCH, VOL. 114,, doi:10.1029/2009jd012493, 2009 Evaluation of AIRS, IASI, and OMI ozone profile retrievals in the extratropical tropopause region
Clear-Air Forward Microwave and Millimeterwave Radiative Transfer Models for Arctic Conditions
 Clear-Air Forward Microwave and Millimeterwave Radiative Transfer Models for Arctic Conditions E. R. Westwater 1, D. Cimini 2, V. Mattioli 3, M. Klein 1, V. Leuski 1, A. J. Gasiewski 1 1 Center for Environmental
NE T specification and monitoring for microwave sounders
 Document NWPSAF-MO-TR-033 Version 1.1 17 th December 015 NE T specification and monitoring for microwave sounders Nigel Atkinson Met Office NE T specification and monitoring for microwave sounders Doc
The Development of Hyperspectral Infrared Water Vapor Radiance Assimilation Techniques in the NCEP Global Forecast System
 The Development of Hyperspectral Infrared Water Vapor Radiance Assimilation Techniques in the NCEP Global Forecast System James A. Jung 1, John F. Le Marshall 2, Lars Peter Riishojgaard 3, and John C.
Global Soundings of the Atmosphere from ATOVS Measurements: The Algorithm and Validation
 1248 JOURNAL OF APPLIED METEOROLOGY Global Soundings of the Atmosphere from ATOVS Measurements: The Algorithm and Validation JUN LI ANDWALTER W. WOLF Cooperative Institute for Meteorological Satellite
GPS RO Retrieval Improvements in Ice Clouds
 Joint COSMIC Tenth Data Users Workshop and IROWG-6 Meeting GPS RO Retrieval Improvements in Ice Clouds Xiaolei Zou Earth System Science Interdisciplinary Center (ESSIC) University of Maryland, USA September
AIRS Level 1b. Tom Pagano AIRS Project Project Manager. Hartmut Aumann AIRS Project Scientist
 AIRS Level 1b Tom Pagano AIRS Project Project Manager Hartmut Aumann AIRS Project Scientist Jet Propulsion Laboratory California Institute of Technology and Ken Overoye AIRS Calibration System Engineer
An Overview of the UW Hyperspectral Retrieval System for AIRS, IASI and CrIS
 An Overview of the UW Hyperspectral Retrieval System for AIRS, IASI and CrIS Nadia Smith a, Elisabeth Weisz b and William L. Smith Cooperative Institute for Meteorological Satellite Studies (CIMSS) Space
Effects of Possible Scan Geometries on the Accuracy of Satellite Measurements of Water Vapor
 1710 JOURNAL OF ATMOSPHERIC AND OCEANIC TECHNOLOGY VOLUME 16 Effects of Possible Scan Geometries on the Accuracy of Satellite Measurements of Water Vapor LARRY M. MCMILLIN National Environmental Satellite,
Inter-comparison of CRTM and RTTOV in NCEP Global Model
 Inter-comparison of CRTM and RTTOV in NCEP Global Model Emily H. C. Liu 1, Andrew Collard 2, Ruiyu Sun 2, Yanqiu Zhu 2 Paul van Delst 2, Dave Groff 2, John Derber 3 1 SRG@NOAA/NCEP/EMC 2 IMSG@NOAA/NCEP/EMC
An anomaly correlation skill score for the evaluation of the performance of hyperspectral infrared sounders 1. Abstract
 An anomaly correlation skill score for the evaluation of the performance of hyperspectral infrared sounders 1. Hartmut H. Aumann a, Evan Manning a, Chris Barnet b, Eric Maddy c andwilliam Blackwell d a
x = x a +(K T S e -1 K+S a -1 ) -1 K T S e -1 *[R-F(x)+K*(x-x a )]
![x = x a +(K T S e -1 K+S a -1 ) -1 K T S e -1 *[R-F(x)+K*(x-x a )]](/thumbs/86/93497200.jpg "x = x a +(K T S e -1 K+S a -1 ) -1 K T S e -1 *[R-F(x)+K*(x-x a )]") P2.7 RETRIEVALS OF ATMOSPHERIC THERMODYNAMIC STRUCTURE FROM UNIVERSITY OF WISCONSIN SCANNING-HIGH-RESOLUTION INTERFEROMETER SOUNDER (S-HIS) UPWELLING RADIANCE OBSERVATIONS USING A BAYESIAN MAXIMUM A POSTERIORI
P2.7 RETRIEVALS OF ATMOSPHERIC THERMODYNAMIC STRUCTURE FROM UNIVERSITY OF WISCONSIN SCANNING-HIGH-RESOLUTION INTERFEROMETER SOUNDER (S-HIS) UPWELLING RADIANCE OBSERVATIONS USING A BAYESIAN MAXIMUM A POSTERIORI
A strict test in climate modeling with spectrally resolved radiances: GCM simulation versus AIRS observations
 Click Here for Full Article GEOPHYSICAL RESEARCH LETTERS, VOL. 34, L24707, doi:10.1029/2007gl031409, 2007 A strict test in climate modeling with spectrally resolved radiances: GCM simulation versus AIRS
Lambertian surface scattering at AMSU-B frequencies:
 Lambertian surface scattering at AMSU-B frequencies: An analysis of airborne microwave data measured over snowcovered surfaces Chawn Harlow, 2nd Workshop on Remote Sensing and Modeling of Land Surface