LETTERS. Moisture transport across Central America as a positive feedback on abrupt climatic changes
|
|
|
- Joel Casey
- 6 years ago
- Views:
Transcription
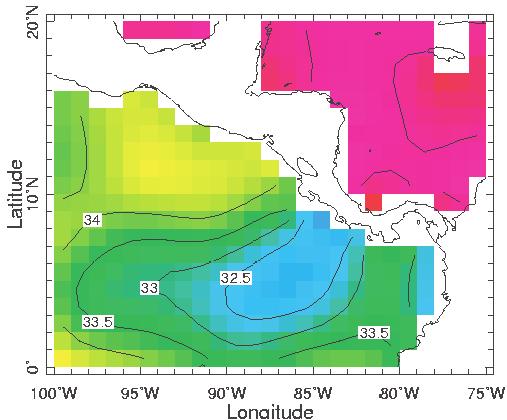
1 Vol 445 February 007 doi: /nature05578 LETTERS Moisture transport across Central America as a positive feedback on abrupt climatic changes Guillaume Leduc 1, Laurence Vidal 1, Kazuyo Tachikawa 1, Frauke Rostek 1, Corinne Sonzogni 1, Luc Beaufort 1 & Edouard Bard 1 Moisture transport from the Atlantic to the Pacific ocean across Central America leads to relatively high salinities in the North Atlantic Ocean 1 and contributes to the formation of North Atlantic Deep Water. This deep water formation varied strongly between Dansgaard/Oeschger interstadials and Heinrich events millennial-scale abrupt warm and cold events, respectively, during the last glacial period 3. Increases in the moisture transport across Central America have been proposed to coincide with northerly shifts of the Intertropical Convergence Zone and with Dansgaard/ Oeschger interstadials, with opposite changes for Heinrich events 4. Here we reconstruct sea surface salinities in the eastern equatorial Pacific Ocean over the past 90,000 years by comparing palaeotemperature estimates from alkenones and Mg/Ca ratios with foraminiferal oxygen isotope ratios that vary with both temperature and salinity. We detect millennial-scale fluctuations of sea surface salinities in the eastern equatorial Pacific Ocean of up to two to four practical salinity units. High salinities are associated with the southward migration of the tropical Atlantic Intertropical Convergence Zone, coinciding with Heinrich events and with Greenland stadials 5. The amplitudes of these salinity variations are significantly larger on the Pacific side of the Panama isthmus, as inferred from a comparison of our data with a palaeoclimate record from the Caribbean basin 6. We conclude that millennialscale fluctuations of moisture transport constitute an important feedback mechanism for abrupt climate changes, modulating the North Atlantic freshwater budget and hence North Atlantic Deep Water formation. Paleotemperatures recorded in Greenland indicate that rapid climatic changes occurred on a millennial timescale during Marine Isotope Stage 3 (MIS3 5,7, between 59 and 5 kyr BP) and were intimately linked to the process of North Atlantic Deep Water (NADW) formation,3 (the Dansgaard Oeschger 5 and Heinrich events 7, H-DO variability). The H-DO features are also observed in tropical areas sensitive to summer monsoon fluctuations, which were linked to latitudinal shifts of the Intertropical Convergence Zone (ITCZ) 4,8,9. To explain the existence of H-DO features at different latitudes, we need to understand how climatic teleconnections are set up between high and low latitudes and/or different ocean basins 10,11. In modern climatology, the interoceanic freshwater transfer from the Atlantic to the Pacific Oceans maintains the high Atlantic salinity required for NADW formation 1. This is achieved by the combination of strong easterly winds and increased atmospheric humidity within the Caribbean region 1, which occurs mainly during the boreal summer when the ITCZ is shifted northward (Supplementary Information). Modelling studies imply that the modern interoceanic vapour flux ranges from 0.13 Sv (ref. 1) to 0.45 Sv (ref. 13) (1 Sv m 3 s 1 ). For the Last Glacial Maximum (LGM), different models show either an increased 14 or a decreased 15 water vapour export from the Atlantic Ocean. Recent work on marine sequences covering the last deglaciation suggested that cross-isthmus vapour transport was not strongly affected by glacial boundary conditions 16. Rather, the interoceanic vapour transport and the interbasin salt contrast seem to have been influenced by ITCZ dynamics, which contributed to the hydrological variability in the Eastern Equatorial Pacific (EEP) region 16. From this point of view, the EEP appears to be a key climatic crossroad involved in rapid climatic changes. To understand better how the ITCZ dynamics and the moisture transfer changes across Central America evolved with respect to the H-DO variability, it is crucial to gather observations covering the entire MIS3, and in particular at the prominent six Heinrich events. Since the EEP sea surface salinities (SSS) are intimately linked to the intensity of the ITCZ and its mean latitudinal position (Fig. 1), reconstructing past EEP SSS fluctuations allows us to track variations in moisture transport across the Panama isthmus (Supplementary Information). Here we present a multi-proxy record of past EEP hydrological characteristics from the sediment core MD0-59 (08u N, 84u W, 1,619 m water depth) (Fig. ). The d 18 O values for the surface-dwelling foraminifer Globigerinoides ruber (d 18 O G. ruber ) are about 3% for the Holocene and decrease by about % between the MIS and the late Holocene (Fig. a). Rapid d 18 O G. ruber variations of 0.5 to 1% occurred on a millennial timescale during MIS and the late part of MIS3. Two longer cycles with saw-tooth shapes are recorded between 40 and 46 kyr BP and between 46 and 53 kyr BP. From 58 to 90 kyr BP, fluctuations are observed with longer wavelengths and weaker amplitudes than the d 18 O G. ruber shifts during MIS and 3. The U k0 k0 sea surface temperatures (U-SST) reconstruction agrees well with the record of the Mg/Ca-SST measured on G. ruber, except between 0 and 5 kyr BP (Fig. b, Supplementary Information). The mean Holocene SST of 8 uc (Fig. b) is within the range of modern SST values (Supplementary Information). A long-term 3 uc increase occurred between 5 and 10 kyr BP in U k0 -SST. The SST record for MIS3, 4 and 5 varies between 4.5 and 8 uc with minima and maxima centred at 30, 43 and 65 kyr BP, and at 38, 57 and 85 kyr BP, respectively. Therefore the EEP SST appear to vary independently from the millennial-scale variability of d 18 O G. ruber (Fig. a, b), and the d 18 O of sea water (d 18 O sw ) clearly indicates that the large-amplitude millennial-scale d 18 O G. ruber fluctuations are driven by d 18 O sw variations (Fig. a, c and Supplementary Information). After the removal of the global d 18 O sw linked to sea-level variations (ref. 17), rapid fluctuations in Dd 18 O sw (a proxy for regional SSS) persist throughout the sequence (Fig. 3c). For the modern climate, a northern position of the ITCZ during the boreal summer leads to increased net precipitation in the EEP region (Fig. 1). Indeed, about half of the EEP precipitation originates from the Caribbean 18 and is brought to the Pacific side through zonal atmospheric transport 1 CEREGE, UMR6635, CNRS Université Paul Cézanne Aix-Marseille III, Collège de France, Europôle de l Arbois, BP 80, Aix-en-Provence Cedex 04, France Nature Publishing Group

 results from high/low productivity and terrigenous input associated with the northward/southward shifts of the ITCZ over the last glacial period 4.")
2 NATURE Vol 445 February 007 LETTERS across Central America, mainly during the wet summer season 1 (Supplementary Information). The salinity record based on Dd 18 O sw can therefore be used as an indicator of rainfall and, in connection with similar records, of cross-isthmus moisture transport. Time intervals with low Dd 18 O sw should correspond to periods of intensified moisture fluxes across the Panama isthmus. The high-resolution reflectance record of the Cariaco Basin (Fig. 1) results from high/low productivity and terrigenous input associated with the northward/southward shifts of the ITCZ over the last glacial period 4. The northern position of the ITCZ appears to be in phase with DO interstadials 4, while southward migrations of the ITCZ are in phase with Heinrich events and DO stadials (Fig. 3a, b). The MD0-59 Dd 18 O sw and Cariaco Basin reflectance data indicate that the northward migration of the ITCZ in the Cariaco Basin is associated with EEP SSS minima, and so to enhanced moisture export from the Atlantic, when the ITCZ was aligned with the Central America low-level mountain channels 4 (Fig. 3b, c). Therefore, the Equatorial Atlantic and the EEP are efficiently linked through atmospheric teleconnection. Maximum EEP SSS occurred during H events and DO stadials (Fig. 3c). This is compatible with a southward migration of the ITCZ accompanied by a decrease in water vapour transport to the Pacific Ocean. The ITCZ displacements are also documented in northeastern Brazil at 10u S by well-dated growth phases of speleothems during the prominent H events, indicating wet climate at these periods 19 (Fig. 3d). The modern distribution of precipitation over South America in March (Fig. 1) implies a southward migration of the ITCZ over the Amazon Basin at the times of H events (Fig. 3d). These enhanced rainfall time intervals correspond to periods of increased runoff to the tropical Atlantic, as is clearly recorded in shallow sediments along the northeastern Brazilian coast 0 (Figs 1 and 3d). The orogenic blocking by the Andes prevented the export of water vapour from the Atlantic to the Pacific, and probably induced the recirculation of freshwater within the Atlantic Ocean during H events and DO stadials, mainly via the Amazon River outflow. We consider similar records obtained from cores retrieved on the other side of the Panama isthmus in order to better constrain the EEP hydrological changes and to further study the moisture transport from the Atlantic to the Pacific. Recent work on a Caribbean sediment core (Fig. 1) has recorded regional SSS maxima during Heinrich events and the Younger Dryas 6, indicating that both sides of the isthmus were strongly influenced by north south shifts of the ITCZ (Fig. 1), making the Atlantic and the Pacific salinity records in phase for their main features. However, a second-order antiphase pattern is superimposed on these first-order variations, and is linked to cross-isthmus moisture transport. Evidence for this second-order antiphase is seen when the respective amplitudes of salinity changes Latitude N (º) 10 0 EEP Cariaco Basin Caribbean Sea March September Longitude W (º) Brazilian speleothem Precipitation rate (mm day 1 ) ( averaged) Northeast Brazilian coast Figure 1 Averaged precipitation rates over South America for March and September for the period AD Black dots indicate locations of palaeoclimatic archives discussed in the text, that is, the comparison of the EEP (core MD0-59, yellow star, this study) to the sedimentary sequences of the Cariaco Basin (ODP hole 100C) 4, of the Caribbean Sea (core VM8-1 and ODP hole 999A) 6 and of the northeastern Brazilian margin (core GeoB3104-1/391-1) 0 as well as the northeastern Brazil speleothem growing phases 19. Rainfall data were retrieved from the International Research Institute for Climate Prediction and are available at iri.ldeo.columbia.edu δ 18 O ( versus VPDB) δ 18 O ( versus VPDB) δ 18 O ( versus VSMOW) Nature Publishing Group G. ruber a b MIS1 MIS MIS3 MIS4 MIS5 c d C. wuellerstorfi 4 e 4.5 U. peregrina Age (kyr BP) ,000 1,500 Figure Records of MD0-59 versus age for the last 90 kyr BP. a, d 18 O record of the surface-dwelling planktonic foraminifer G. ruber. b, Comparison of U k0 -SST (red curve) and Mg/Ca-SST (green curve). c, Calculated d 18 O sw. d, Age depth relationship based on radiocarbon measurements (black dots) and benthic foraminifera stratigraphy tuned to Byrd (open triangles) and to a benthic d 18 O stack (open circles) (see Supplementary Information for the age model construction). e, d 18 O records of the benthic species Cibicidoides wuellerstorfi (blue curve) and Uvigerina peregrina (orange curve). VPDB, Vienna Pee-Dee Belemnite standard; VSMOW, Vienna Standard Mean Ocean Water. SST (ºC) MD0-59 depth (cm) 909
3 LETTERS NATURE Vol 445 February 007 Greenland temperatures Cariaco Basin ITCZ mean latitudinal position EEP salinity GISP δ 18 O ( versus SMOW) MD0-59 δ 18 O sw ( versus SMOW) Northeastern Brazil river runoff Wet periods in Brazilian speleothem at 10º S 1 p.s.u. YD H1 in the Caribbean and the EEP are considered (Supplementary Information). Our observations demonstrate that for all Heinrich events and the Younger Dryas the salinity increases are about two to three times larger on the Pacific side than on the Atlantic side of the isthmus (Supplementary Information). Our interpretation is that the salinity increases on both sides of the isthmus are modulated by the southward ITCZ shifts, whereas the signature of decreased interoceanic moisture flux is less salinity increase on the Atlantic side and more salinity increase on the Pacific side. This is precisely the antiphased pattern of cross-isthmus moisture transport changes. The MD0-59 Dd 18 O sw values imply that a northerly location of the ITCZ allowed enhanced moisture transport across the Panama isthmus, potentially leading to the build-up of salt in North Atlantic surface waters. By contrast, a southerly ITCZ position led to the orogenic blocking of moisture transport by the Andes 4. This fresh water returned preferentially into the Atlantic Ocean, in particular through the Amazon basin drainage 0. Inevitably, this must have lowered the salinity of low-latitude currents in the Atlantic Ocean, such as the North Brazil current, the Guyana current and the Caribbean current feeding the Gulf Stream. The deuterium excess record from GRIP ice cores in Greenland shows that changes in their source temperature reflect southward shifts of the geographical location of moisture sources during stadials, presumably associated with southward displacements of the ITCZ 1. This provides additional evidence for the key role played by the atmospheric water cycle and its related cross-isthmus moisture transport with respect to the H-DO variability. Some modelling studies attempted to reproduce the H-DO variability related to the formation of NADW by applying small freshwater anomalies of 0.03 Sv to the North Atlantic surface water that are one order of magnitude smaller than the modern cross-isthmus Figure 3 Temporal variations of the calculated Dd 18 O sw of MD0-59 compared to other palaeoclimatic records. The data are presented on their published original timescales without further tuning. a, Greenland GISP palaeotemperature record 5. b, Cariaco basin sediment reflectance, monitoring the latitudinal mean position of the ITCZ in the northwestern equatorial Atlantic 4. c, Dd 18 O sw of MD0-59. d, Fe/Ca measurements, a a b c d H H3 H Age (kyr BP) H5 North South More Less 007 Nature Publishing Group H6 Warm Cold Fresher Saltier ODP hole 100C 550 nm reflectance GeoB /391-1 XRF Fe/Ca proxy for riverine input, performed on sediments retrieved off Brazil 0 ; black arrows indicate time intervals of the ITCZ southward expansion over Brazil based on well-dated speleothem growth intervals 19. Grey vertical bars mark the North Atlantic H events. See Fig. 1 for the localization of tropical palaeoclimatic archives. YD, Younger Dryas; H1 H6, Heinrich events. vapour transport 1,13,14,18. In the modern North Atlantic, low-salinity anomalies initially located at river mouths 3 are then advected in the Nordic Seas after a delay of several years with a probable influence on NADW formation 4. If the ITCZ latitudinal cycles were indeed able to modulate the interoceanic salt contrast at the millennial timescale, then they could have contributed to the freshwater flux forcing applied in modelling experiments. It is also possible that further north in the North Atlantic gyre other feedbacks could operate in a different manner 5. The combined palaeoceanographic evidence and all identified feedback effects should be considered in modelling these events, that may enlighten our understanding of the modulation of NADW formation process and its related climatic effects. We speculate that the moisture transport across Central America acts as a positive feedback on abrupt climatic changes. If true, the tropical climate variability is not limited to a passive response to the abrupt climatic changes observed in the North Atlantic region. Further tests of the implications of observed latitudinal and longitudinal hydrological shifts should be performed with models coupling atmosphere and ocean processes at the seasonal scale, and using highly resolved representations of Central and South-America in order to simulate realistic runoff fluxes. METHODS We estimated the regional SSS over the last 90 kyr BP by measuring d 18 O G. ruber coupled with alkenone-based (using U k0 ) and G. ruber Mg/Ca-based (using the cleaning method including the reductive step) sea surface palaeotemperatures data (Supplementary Information). To convert the U k0 and the Mg/Ca into temperatures, we have used the calibration of refs 6 and 7, respectively. The lower Mg/Ca temperatures of the 0 5 kyr BP time interval might be caused by foraminiferal test dissolution (Fig. b, Supplementary Information). The d 18 Oof sea water (d 18 O sw ) was estimated by combining the d 18 O G. ruber and U k0 -SST (Fig. c, Supplementary Information). To reconstruct past EEP salinities
4 NATURE Vol 445 February 007 LETTERS (Dd 18 O sw, Fig. 3c) we also removed the effect of global ice volume changes (ref. 17) from d 18 O sw. In the modern EEP, a d 18 O sw drop of 1% corresponds to a salinity decrease of about 4 p.s.u. (ref. 18), remaining highly significant with respect to the typical error on salinity reconstructions 8 (Supplementary Information). The age model is constrained by a series of radiocarbon ages and by isotopic stratigraphy using the d 18 O temporal variations measured on two benthic foraminifer species (Fig. d, e; see Supplementary Information). Received 18 October 006; accepted 4 January Zaucker, F. & Broecker, W. S. The influence of atmospheric moisture transport on the fresh water balance of the Atlantic drainage basin: General circulation model simulations and observations. J. Geophys. Res. 97, (199).. Broecker, W. S., Bond, G., Klas, M., Bonani, G. & Wolfli, W. A salt oscillator in the glacial Atlantic? 1. The concept. Paleoceanography 5, (1990). 3. Bard, E. Climate shock: Abrupt changes over millennial time scales. Phys. Today 55, 3 (00). 4. Peterson, L. C., Haug, G. H., Hughen, K. A. & Röhl, U. Rapid changes in the hydrologic cycle of the tropical Atlantic during the Last Glacial. Science 90, (000). 5. Stuiver, M. & Grootes, P. M. GISP oxygen isotope ratios. Quat. Res. 53, (000). 6. Schmidt, M. W., Spero, H. J. & Lea, D. W. Links between salinity variation in the Caribbean and North Atlantic thermohaline circulation. Nature 48, (004). 7. Bond, G. et al. Correlations between climate records from North Atlantic sediments and Greenland ice. Nature 365, (1993). 8. Wang, Y. J. et al. A high-resolution absolute-dated late Pleistocene monsoon record from Hulu Cave, China. Science 94, (001). 9. Ivanochko, T. S. et al. Variations in tropical convection as an amplifier of global climate change at the millennial scale. Earth Planet. Sci. Lett. 35, (005). 10. Broecker, W. S. Does the trigger for abrupt climate change reside in the ocean or in the atmosphere? Science 300, (003). 11. Vidal, L. & Arz, H. in Past Climate Variability Through Europe And Africa (eds Battarbee, R. W. et al.) (Springer, Dordrecht, 004). 1. Liu, W. T. & Tang, W. Estimating moisture transport over oceans using spacebased observations. J. Geophys. Res. 110, D10101, doi:10.109/004jd (005). 13. Manabe, S. & Stouffer, R. J. Two stable equilibria of a coupled ocean-atmosphere model. J. Clim. 1, (1988). 14. Hostetler, S. W. & Mix, A. C. Reassessment of ice-age cooling of the tropical ocean and atmosphere. Nature 399, (1999). 15. Schmittner, A., Meissner, K. J., Eby, M. & Weaver, A. J. Forcing of the deep ocean circulation in simulations of the Last Glacial Maximum. Paleoceanography 17, 1015, doi:10.109/001pa (00). 16. Benway, H. M., Mix, A. C., Haley, B. A. & Klinkhammer, G. P. Eastern Pacific Warm Pool paleosalinity and climate variability: 0 30 kyr. Paleoceanography 1, PA3008, doi:10.109/005pa00108 (006). 17. Waelbroeck, C. et al. Sea-level and deep water temperature changes derived from benthic foraminifera isotopic records. Quat. Sci. Rev. 1, (00). 18. Benway, H. M. & Mix, A. C. Oxygen isotopes, upper-ocean salinity, and precipitation sources in the eastern tropical Pacific. Earth Planet. Sci. Lett. 4, (004). 19. Wang, X. et al. Wet periods in northeastern Brazil over the past 10 kyr linked to distant climate anomalies. Nature 43, (004). 0. Arz, H. W., Pätzold, J. & Wefer, G. Correlated millennial-scale changes in surface hydrography and terrigenous sediment yield inferred from last-glacial marine deposits off northeastern Brazil. Quat. Res. 50, (1998). 1. Masson-Delmotte, V. et al. GRIP deuterium excess reveals rapid and orbital-scale changes in Greenland moisture origin. Science 309, (005).. Ganopolski, A. & Rahmstorf, S. Rapid changes of glacial climate simulated in a coupled climate model. Nature 409, (001). 3. Masson, S. & Delecluse, P. Influence of the Amazon river runoff on the tropical Atlantic. Phys. Chem. Earth B 6, 1 14 (001). 4. Mignot, J. & Frankignoul, C. Interannual to interdecadal variability of sea surface salinity in the Atlantic and its link to the atmosphere in a coupled model. J. Geophys. Res. 109, C04005, doi:10.109/003jc00005 (004). 5. Schmidt, M. W., Vautravers, M. J. & Spero, H. J. Rapid subtropical North Atlantic salinity oscillations across Dansgaard-Oeschger cycles. Nature 443, (006). 6. Sonzogni, C. et al. Temperature and salinity effects on alkenone ratios measured in surface sediments from the Indian Ocean. Quat. Res. 47, (1997). 7. Lea, D. W., Pak, D. K. & Spero, H. J. Climate impact of Late Quaternary equatorial Pacific sea surface temperature variations. Science 89, (000). 8. Schmidt, G. A. Error analysis of paleosalinity calculations. Paleoceanography 14, 4 49 (1999). Supplementary Information is linked to the online version of the paper at Acknowledgements We acknowledge support from INSU and the French Polar Institute IPEV, which provided the RV Marion Dufresne and the CALYPSO coring system used during the IMAGES VIII MONA cruise. Thanks to Y. Garcin and M. Siddall for discussion and reviews. Paleoclimate work at CEREGE is supported by grants from the CNRS, the ANR and the Gary Comer Science and Education Foundation. Author Information Reprints and permissions information is available at The authors declare no competing financial interests. Correspondence and requests for materials should be addressed to G.L. (leduc@cerege.fr) and E.B. (bard@cerege.fr). 007 Nature Publishing Group 911
5 SI1. EEP climatology 1) present-day atmospheric and oceanographic settings Core MD0-59 ( N; W; 1619 m water depth) was collected during the IMAGES VIII/MD 16 MONA oceanographic cruise (Fig. SF1a,b), off the Costa Rican margin. At the core location, SST are higher than 7 C and SSS are lower than 33. p.s.u. throughout the year (Fig. SF1c,d). The permanently low salinity of surface waters of the Panama Basin is maintained by the annual cycle of the ITCZ and its related surface currents. The dry and wet seasons occur between December and April (boreal winter), and between May and November (boreal summer), respectively (Fig. SF1e). In March, northeasterly trade winds blow from the Atlantic area through low-level mountain gaps located onshore of the Tehuantepec Gulf (TG), the Nicaraguan Margin (NM) and the Panama Bight (PB), leading to a reduction in regional rainfall by shifting the ITCZ southward (Fig. SF1a,e, Fig. SF). Wind-induced upwelling and mixing near the coast decrease the SST at TG, NM and PB (Fig. SF1a). No wind-induced upwelling affects the local hydrology at the coring site, which is situated in the lee of the Talamanca Cordillera (TC) culminating at between 3,000 and 4,000 m above sea level (Fig. SF1a). Northeasterly trades blowing across the NM and PB create westward flows of surface waters that advect into the North Equatorial Current (NEC) and the South Equatorial Current (SEC), respectively (Fig. SF1a). The westward advection of low-salinity (<3.5 p.s.u.) coastal currents - initially located close to the Colombian margin causes a reduction in the SSS at the core location in March and April (Fig. SF1a,d) and make the surface circulation within the Panama Basin cyclonic. The absence of cloud cover leads to SST maxima during the dry season, remaining warmer than 8.5 C from December to May (Fig. SF1c). The wet season between May and November is related to the northward shift of the ITCZ (e.g. September in Fig. SF1b and Fig. SF), which leads to large amounts of rainfall during the summer monsoon over the MD0-59 core location (Fig. SF1e, Fig. SF). From May to July, the increasing cloud cover as well as the maximum development of the Costa Rica Dome [S1] lead to a SST drop, in turn responsible for a substantial weakening of deep atmospheric convection, at the origin of a mid-summer dry season occurring in July [S] (see July in Fig. SF1e). Then, increased solar radiation over the warm pool occurring during the mid-summer dry season permits the reinvigoration of deep atmospheric convection, resulting in a second precipitation maximum between August and November. For these reasons, the 1 1
6 precipitation patterns of the wet season is bimodal [S]. This wet season is in turn responsible for the general decrease in SSS between May and December (Fig. SF1d). Below the ITCZ, the trade winds weaken, allowing the eastward advection of the warm (9 C) and low-salinity waters (3 p.s.u.) of the North Equatorial Counter Current (NECC). This allows the mixing of NECC waters with EEP surface waters, while the NEC and SEC move northward and southward, respectively (Fig. SF1b). When it attains the Panama Bight, the NECC then flow southward, and the Panama Basin surface circulation becomes anticyclonic [S3]. During the wet season, the summer monsoon precipitation reduces the SSS from roughly 33 to 3 p.s.u. at MD0-59 coring site (Fig. SF1d,e). The regional SSS and the Central America rainfall patterns are unaffected by ENSO warm events [S4]. By contrast, El Niño years are marked rather by positive SST anomalies of 1 to C in the Panama Basin. At the core location, these SST anomalies are imprinted in the δ 18 O record of recent corals as a 0. to 0.4 negative anomaly, which is superimposed onto the mean annual variability of 0.9 of the δ 18 O of corals due to the SSS seasonal cycle, and linked to the ITCZ dynamics [S4]. At the site of core MD0-59, the millennial-scale δ 18 O variability of 1 recorded by the surface-dwelling planktonic foraminifer G. ruber is hence unlikely to be affected by the ENSO dynamics. Due to the high temperatures and low salinity of the surface waters, a strong pycnocline is set up between 30 and 70 m water depth at the core location (Fig. SF3). The seasonal variability of the pycnocline appears to be insignificant (Fig. SF3). ) present-day seasonality of cross-isthmus freshwater fluxes The seasonal timing as well as the exact amount of atmospheric freshwater flux that crosses Central America can be estimated from satellite data [S5]. The moisture transport is by definition the product of the precipitable water and an equivalent velocity integrated over the height of the atmosphere, i.e. the depth-averaged wind velocity weighted by humidity [S5]. For the Central America area, it is clear that predominant Easterlies situated in the Caribbean region are crossing the Central America during all seasons [S6], potentially leading to moisture export from the Atlantic throughout the year (Fig. SF). However, the precipitable water content of the atmosphere on the Caribbean side of the Central America is reduced during the boreal winter (Fig. SF). By contrast, during the boreal summer, the Caribbean easterlies transport water vapour from the tropical Atlantic toward the tropical Pacific Oceans. In addition, the ITCZ remains largely above the EEP during the wet season of boreal summer
7 (e.g. see Figure 1 of the manuscript). At the seasonal scale, the regional SSS variations in EEP are thus clearly triggered by the ITCZ-induced rainfall variations. During the wet season, the rainfall received in the EEP is both derived from the atmospheric advection of locally (or from southerly winds) and remotely (or from northeasterly winds) derived moisture [S7]. The Figure SF illustrates the atmospheric content of precipitable water that allows tracking the source region of the atmospheric moisture that is precipitated at MD0-59 coring site during summer. The precipitable water brought from the southerly trades is picked up after these winds have crossed the equator, i.e. above an oceanic region where SST considerably increases between the equatorial divergence and the warm pool. When they cross Central America, the northeasterly trades (i.e. carrying the water vapour across the Panama Isthmus) are already loaded by precipitable water evaporated over the Caribbean Sea. The EEP warm pool is a preferential site of precipitation for this fresh water transported from the Atlantic to the Pacific. A paleoclimatic approach based on SSS is thus suitable to reconstruct changes of rainfall, and hence of moisture transport across Central America. 3) atmospheric and oceanographic settings over the last 90 ky BP In addition to atmospheric moisture transport across Central America, other processes such as horizontal mixing/advection, non-atlantic moisture sources and mixing/upwelling from below the thermocline may have modulated the SSS fluctuations recorded in MD0-59. However these processes are unlikely to be responsible for the main SSS variability patterns when it is kept in mind the SSS amplitudes i.e. to 4 that we report at the millennial timescale: The NECC salinity in the central Pacific is only 1 p.s.u. lower than the surrounding northern and southern surface water masses up to at least 110 W of longitude. Farther east, the salinity then decreases simply because of the intense rainfall that occurs during the wet season, reaching salinities as low as 3.5 p.s.u. Even in the far eastern Pacific, the salinity gradient between the NECC and the broad regional surface waters of the entire EEP region remains largely lower than the SSS shifts that we report. Consequently, a very hypothetical collapse of the NECC could not be responsible for the SSS increase evidenced in core MD0-59, in particular at times of Heinrich events. Advection processes are thus unlikely to explain the to 4 p.s.u. recorded at the millennial timescale over the last 90 ky BP. 3
8 About half of the rainfall over EEP was derived from the Caribbean Sea, as implied by the isotopic signature of the EEP precipitation [S7]. Because the ITCZ (and core MD0-59) are located at the edge of the Central American coast, the atmospheric moisture transported by the northern trades must derive from the Caribbean Sea [S5] (see Fig. SF). The other moisture sources (referred as local for the sake of simplicity) derive in fact from a region located in the northern hemisphere. Indeed, the equatorial cold tongue prevents the atmospheric loading because of the relatively cool SST at the equator (Fig. SF, [S5]). Because of the geometry of the Panama Isthmus as well as the persistence of relatively cold equatorial temperature during glacial times [S8], it is unlikely that these local moisture sources dramatically changed in the past. Moreover, our SST record together with others from the tropical Pacific [S9] clearly show that temperature changes did not follow the H-DO variability at the millennial-centennial time scale. It is thus very unlikely that atmospheric moisture recharge followed by local precipitation would explain the EEP SSS signal recorded in core MD0-59. At least two types of observations indicate that the observed surface waters variability was not driven by upwelling or mixing of the surface water column: Firstly, the Alkenone-derived SST temporal variations indicate that the sea surface remained warmer than 4 C over the last 90 ky BP (Fig. b), implying that subsurface waters were unlikely to have reached the 30m-thick mixed layer (see Fig. SF3 for the present-day thermocline depth). Secondly, for the last 90 ky BP, measurements of the δ 13 C performed on the thermocline-dwelling species Neogloboquadrina dutertrei indicate that the δ 13 C offset between Globigerinoides ruber and N. dutertrei varied independently of the largeamplitude fluctuations of δ 18 O in G. ruber. Figure SF4 shows that the surface salinity proxy (Δδ 18 O sw ) is not correlated (r = 0.01) with the upwelling proxy based on the δ 13 C gradient between the two planktonic foraminifera (see [S10] for the planktonic foraminifera depth habitat and [S11] for the δ 13 C DIC gradients within the water column). It shows convincingly that the sea surface variability was not driven by subsurface waters, and that the pycnocline remained stable throughout the time interval studied. 4
9 SI. Analytical procedures used to generate data available in Table 1 G. ruber was picked from the μm size fraction. Samples of about 5 specimens were then reacted in H 3 PO 4 at 70 C and the evolved CO was analysed by a Finnigan Delta Advantage mass spectrometer at CEREGE. Stable isotopic ratios are reported in relative to the V-PDB standard, where δ 18 O=[( 18 O/ 16 O sample / 18 O/ 16 O standard )-1]*1000. Analytical precision was better than ± 0.05 (± 1σ) based on repeated analyses of a NBS-19 limestone standard. We performed about 80 sample replicates out of a total of about 380 measurements, especially at key depths where rapid isotopic shifts are recorded. The temporal resolution of the G. ruber δ 18 O dataset is ~50 years for the MIS and 3 intervals. Stable isotope measurements were also performed on the benthic foraminifera species Cibicidoides wuellerstorfi and Uvigerina peregrina, using the > 50 μm size fraction. The time resolution of C. wuellerstorfi is roughly the same as for the G. ruber dataset during MIS and 3, while the resolution of U. peregrina is three times lower. We performed about 50 sample replicates out of a total of about 330 measurements on C. wuellerstorfi, and 3 replicates from a total of about 10 measurements on U. peregrina. Alkenones were extracted from bulk sediment, and analyses of C alkenones were performed by GC at CEREGE. The sample preparation and alkenone measurement techniques are described in Sonzogni et al. [S1]. The SST accuracy has been confirmed by an interlaboratory comparison study [S13]. Because temperatures are higher than 4 C throughout the sequence, we selected the calibration proposed by Sonzogni et al. [S1] (T ( C) = [ U ]/0.019), which is based on low-latitude core-tops from the Indian Ocean including samples representing SST between 4 and 30 C. This U vs. SST linear equation has a lower slope (0.019/ C) than the slope of the linear regression (0.033/ C) based on core tops compiled from all oceans [S14]. Although the calibration of Sonzogni et al. has not been tested in the EEP, we believe it provides a better estimation for warm SST. Our choice of calibration is justified by a close inspection of the global compilation itself, as given by Müller et al. [S14], which suggests a flattening out of the relationship at high temperature. In addition, culture studies of different strains of Gephyrocapsa oceanica and Emiliania huxleyi [S15] and measurements in sinking particulates [S16, S17] strongly suggest that the true shape of the U vs. SST is probably sigmoïdal, with the U index converging asymptotically towards 0 and 1, for low and high temperatures, respectively. We estimate a temporal resolution of ~350 years for the U record in the MIS3 interval. The analytical 5
10 precision of replicated measurements is better than 0.01 U units, while the uncertainty of U SST is ± 0.7 C for the calibration used [S1]. Hence, the overall uncertainty is thus on the order of 1 C. The Mg/Ca ratio was measured on G. ruber. About 30 shells were weighed prior to multi-step cleaning to estimate the possible influence of dissolution on Mg/Ca ratio. The shells were gently crushed and subjected to a cleaning procedure, which included a reductive step [S18, S19]. The reductive step appears to be crucial for the measurement of Mg/Ca in shells from Panama deep-sea sediments [S0]. Mg/Ca measurements were performed by ICP- OES (Jobin Yvon ULTIMA C) at CEREGE. The SST accuracy has been confirmed by an interlaboratory comparison study [S1]. Fe and Mn were also measured on these samples to monitor Mg contamination by remaining Fe-bearing clay minerals or Mn-bearing oxides and carbonates. With this method, the analytical precision on Mg/Ca is ca. 0.5 % (1σ). Foraminiferal Mg/Ca is converted to SST using the calibration of Lea et al. [S] (Mg/Ca (mmol/mol) = 0.30exp[0.089*SST ( C) ]). The uncertainty of SST reconstructed from Mg/Ca is estimated at ca. 1 C, similar than for U. Between 0 and 5 kyr BP, Mg/Ca temperatures are C lower than U temperatures. One of the possible reasons for this offset is partial dissolution of shells, which lowers the foraminiferal Mg/Ca. The MIS is characterized by relatively high organic carbon content (i.e. about 3 % of dry sediment, Leduc et al., in prep.), that has probably induced metabolicdriven dissolution. The weights of G. ruber vary between 8 and 14 μg per individual through the studied time interval, and we did not observe any systematic trend with foraminiferal Mg/Ca (Table 1). However, since some shells contain pyrite, shell weight may not be an appropriate indicator of dissolution in this core. We used U paleothermometry for the high-resolution calculation of the δ 18 O of seawater. To obtain a SST value for each δ 18 O G.ruber measurement, the U SST record has been linearly interpolated (the depth resolution is to 5 cm, and 5 cm, respectively, for these markers, see Table 1). In our case, such an interpolation is justified because SST does not vary at high frequency, unlike δ 18 O G.ruber. Although alkenones are carried by finer sized particles than foraminiferal tests, the sedimentation rate which is higher than 10 cm.ky -1 - considerably decreases the phase shift between the two different size fractions and reduces the signal attenuation due to mixing of deep-sea sediment by benthic organisms [S3]. Besides, sediment trap studies of the Panama Basin have pointed out that the maximum flux of G. 6
11 ruber is concurrent with the main phytoplanktonic bloom during the summer months [S4]. This suggests that, at least for this survey, the δ 18 O G.ruber and alkenones should have recorded comparable hydrological patterns with respect to the annual variability of SST and SSS. Moreover, long-term variations of both Mg/Ca and U paleothermometers show roughly the same amplitude and phasing, thus justifying the use of alkenones to derive fluctuations in seawater δ 18 O. To estimate the δ 18 O of seawater (δ 18 O sw ), we used the paleotemperature equation calibrated for symbiont-bearing planktonic foraminifera [S5] in order to correct the δ 18 O G.ruber values for temperature influence (Fig. c). However, obtaining a proxy for regional SSS variations that reflect the rainfall variations strictly speaking (i.e. the Δδ 18 O sw, see Figure 3c) also requires further correction from the global δ 18 O sw due to variations of continental ice volumes, that is linearly related to sea level variations. To reconstruct the Δδ 18 O sw, we removed the long-term ice volume signal [S6]. Even if sea level fluctuations could have occurred at the millennial scale [S7, S8] (and then could have induced global oceanic δ 18 O sw variations of amplitude higher than that of Waelbroeck et al., [S6]) our calculated Δδ 18 O sw cannot be explained in terms of high-frequency sea-level fluctuations, which are one order of magnitude smaller than our Δδ 18 O sw record. Also, in the equatorial Pacific Ocean, regional transient changes in the δ 18 O sw due to deglacial spikes are not expected because of the long-term mixing time of δ 18 O sw within the ocean [S9]. Then, our Δδ 18 O sw record properly represents past regional SSS variations that are linked to the ITCZ dynamics. Based on the modern δ 18 O sw /salinity linear relationship for Panama basin surface waters [S7], a Δδ 18 O sw decrease of 0.5 to 1 would correspond to a salinity decrease of about to 4 p.s.u. It is also important to note that in the case of variable water transport, no δ 18 O sw /salinity relationship changes are expected [S7]. Paleosalinities reconstructed from U paleothermometry lead typically to errors of 1.4 p.s.u. under tropical climates [S30]. In the case of MD0-59, the systematic fluctuations of to 4 p.s.u. at the millennial timescale remain highly significant. 7
12 SI3. Age control The age model for core MD0-59 is based on calibrated radiocarbon ages for the last 40 kyr BP and on benthic foraminifera stratigraphy for the rest of the sequence (cf. Fig. d and Table ). Eleven radiocarbon measurements were performed on the planktonic foraminifer species N. dutertrei (Table ). Where possible, several intervals were also dated using G. ruber (Table ), to test for any age differences between the two species. N. dutertrei has a slightly deeper-water habitat than G. ruber and may record some additional age reservoir effect, linked to different water masses [S10]. At the present day, the upper 00 m of the EEP are relatively homogeneous in terms of Δ 14 C [S31], despite the sharp pycnocline at around 50 m depth (Fig. SF3), indicating that N. dutertrei is bathed in the newly formed equatorial undercurrent subsurface waters. The differences between the 14 C ages of the two species do not systematically display a Δ 14 C offset due to surface water stratification, and are of the same order as the age measurement uncertainty (Table ). Consequently, to simplify the construction of the age model, we only used 14 C dates obtained from N. dutertrei, and two 14 C ages at the cm and cm core-depth intervals have been averaged (Table ). For the construction of the age model, we used the MARINE04 calibration curve to convert the 14 C ages into calendar ages for the last 5, C years BP [S3] and the CALIB 5.3 radiocarbon calibration program [S33]. We have used a ΔR of 50±49 for the surface water mass at the core location (ΔR for the MD0-59 core location is available at For older radiocarbon ages, we applied the polynomial equation proposed by Bard et al. [S34], which has been calculated by stratigraphic tuning on GISP chronology [S35]. To obtain better constraints beyond the 14 C age limit, we also made use of the benthic δ 18 O record (Fig. d). A widely observed feature of high-resolution benthic oxygen isotopic records is the succession of several triangular shapes during MIS3, which mimics the Antarctica paleotemperature variations (e.g. [S8, S36]), and which likely represent fluctuations of ice volume and sea level [S7, S8], and/or deep sea temperature variations [S]. In the MD0-59 core, the benthic oxygen isotopes - measured on C. wuellerstorfi and on U. peregrina - also yield typical triangle-shaped records (Fig. e). Following the approach of Shackleton et al. [S8], we took additional age control points from the correlation between the benthic δ 18 O minima and the Antarctic warm events. These warm events are 8
13 dated at around 46, 53 and 58 kyr BP for A, A3 and A4, respectively, which are themselves tuned to the GISP chronology [S38]. We are quite confident about our MIS3 chronology because (1) MD0-59 δ 18 O benthic records made on two different species both mimic the δ 18 O profile of Byrd ice core; () it yields relatively stable sedimentation rates throughout the sequence; (3) it provides a smooth connection between the oldest radiocarbon age and the age of Antarctic event A1 (i.e. 39 kyr BP); (4) it provides a good match between the Cariaco reflectance record [S39] and the δ 18 O record of core MD0-59. Even if this match is already satisfactory, it could even be improved by fine tuning by a few centuries the chronology of core MD0-59, especially for the early MIS3. However we decided not to apply further matching in order to keep each tropical record on its own independent chronology. The kyr BP interval is dated by correlating the benthic δ 18 O record to a reference stack of benthic foraminifera δ 18 O records [S40]. The mean sedimentation rate is ~13 cm.kyr -1 for MIS and


14 10

 for March (left panels) and September (right panels).")


15 MARCH SEPTEMBER WIND FIELDS AND RAINFALL PRECIPITABLE WATER AND MAIN WIND DIRECTIONS Precipitable water (kg.m - ) Figure SF: Upper panels: seasonal extremes of wind vectors and precipitation fields (green colors and their related precipitation rates in mm/month) for March (left panels) and September (right panels). Bottom panels: precipitable water (i.e. atmospheric humidity) for March (left panels) and September (right panels). The black arrows in the bottom panels indicate the main wind directions. Data were retrieved from the NCEP/NCAR reanalysis dataset and are available online at Note that in the Caribbean, the easterlies strength remains roughly constant, but winds are carrying dry and wet air during boreal winter and summer, respectively. 11
16 T ( o C) d 18 O CaCO3 ( vs. PDB) mixed layer pycnocline Water depth (m) Temp. March Temp. Sept. Sal. March EUC d 18 O cal. March d 18 O cal. Sept. d 18 O sw March d 18 O sw Sept. Sal. Sept S (p.s.u.) d 18 O sw ( vs. SMOW) -0.6 Figure SF3: Mean monthly hydrological records for March (black symbols) and September (open symbols) of the upper 00 m depth at core location. Temperatures (circles) and Salinity (triangles) were extracted from the WOA01 database [S41] at the same location as described for Figure SF1. The black vertical bars localize the two main water masses (EEP surface waters and Equatorial Undercurrent referred as EUC), and the sharp pycnocline between 30 and 70 m depth. The values of d 18 O (right panel) calculated for the seawater (triangles) and for the CaCO 3 at equilibrium (circles) are based on the same dataset [S41]. To convert the salinity to d 18 O sw we used the d 18 O sw -Salinity relationship (d 18 O sw ( ) = 0.53 S (p.s.u.) for the upper 40m water depth; d 18 O sw ( ) = S (p.s.u.) for the m water depth interval [S7]). The d 18 OCaCO 3 was calculated with the paleotemperature equation [S43] (T ( o C) = (d 18 OCaCO 3 - d 18 O sw ) (d 18 OCaCO 3 - d 18 O sw ) ). The calculated d 18 OCaCO 3 for surface waters are 3.4 and 3.1 for March and September respectively. It is in agreement with the d 18 OCaCO 3 measured on the surface-dwelling planktonic species G. ruber retrieved in sediment traps in Panama Basin, that approximately vary between 3.4 an.8 through the year [S44].
17 R = 0.01 Dd 18 Osw vs. SMOW (salinity) Dd 13 C G. ruber - N. dutertrei vs. V-PDB (DIC-normalized) Figure SF4: Dd 18 O sw (i.e. SSS) as a function of the d13c gradient between G. ruber and N. dutertrei (Dd13C, i.e. a proxy for upwelling/mixing). The d13c measured on planktonic foraminifera have been normalized to the d13c of Dissolved Inorganic Carbon (DIC) by assuming a constant offset of for G. ruber and 0.5 for N. dutertrei [S10, S45]. Note that no relationship exists between both proxies, indicating that the SSS is unlikely to have been influenced by upwelling and/or mixing. 13
18 MD0-59 (this study) Caribbean Sea (Schmidt et al., 004) d18o sw /salinity relationships : d18o sw =0,53 psu d18o sw =0, psu SSS increases (p.s.u.) YD H1 H H3 H4 H5 H6 Figure SF5: Comparison between salinity increases in MD0-59 (this study) and in the Caribbean Sea [S46], reconstructed for the six Heinrich events and the Younger Dryas. These seven events are all characterized by a southward shift of the ITCZ, inducing a salinity increase in both records. A second-order antiphasis signature of the reduced moisture transport induces the amplitude differences recorded across the Panama Basin at these times. The water vapour that is not efficiently transferred from the Atlantic toward the Pacific Ocean leads to a freshening of the Caribbean Sea, and to an increased salinity at MD0-59 core location. 14
19 Table 1: Results from MD0-59 core. MD0-59 depth (cm) age (yr BP) d18o G. ruber (VPDB ) Uk' Uk' - SST (ºC) Mg/Ca (mmol.mol-1) Mg/Ca- SST (ºC) ruber weight (μg.ind-1) n.d. n.d. n.d n.d. n.d. n.d n.d. n.d. n.d n.d. n.d. n.d n.d. n.d. n.d n.d. n.d. n.d n.d. n.d. n.d n.d. n.d. n.d n.d. n.d. n.d n.d. n.d. n.d n.d. n.d. n.d n.d. n.d. n.d n.d. n.d. n.d n.d. n.d. n.d n.d. n.d. n.d n.d n.d. n.d. n.d n.d. n.d. n.d n.d. n.d. n.d n.d. n.d. n.d n.d. n.d. n.d n.d. n.d. n.d n.d. n.d. n.d n.d. n.d. n.d n.d. n.d. n.d n.d. n.d. n.d n.d n.d. n.d. n.d n.d. n.d. n.d. n.d. n.d n.d. n.d. n.d n.d. n.d. n.d n.d. n.d. n.d n.d n.d. n.d. n.d n.d. n.d. n.d n.d n.d. n.d. n.d n.d. n.d. n.d n.d. n.d. n.d n.d n.d. n.d. n.d n.d n.d. n.d. n.d n.d. n.d. n.d n.d. n.d. n.d n.d n.d. n.d. n.d n.d. n.d. n.d n.d. n.d. n.d n.d. n.d. n.d n.d. n.d. n.d n.d. n.d. n.d n.d. n.d. n.d n.d. n.d. n.d n.d. n.d. n.d. 15
A multi-proxy study of planktonic foraminifera to identify past millennialscale. climate variability in the East Asian Monsoon and the Western Pacific
 This pdf file consists of all pages containing figures within: A multi-proxy study of planktonic foraminifera to identify past millennialscale climate variability in the East Asian Monsoon and the Western
Supporting Online Material for
 www.sciencemag.org/cgi/content/full/316/5829/1303/dc1 Supporting Online Material for 155,000 Years of West African Monsoon and Ocean Thermal Evolution Syee Weldeab,* David W. Lea, Ralph R. Schneider, Nils
Muted change in Atlantic overturning circulation over some glacial-aged Heinrich events
 SUPPLEMENTARY INFORMATION DOI: 10.1038/NGEO2045 Muted change in Atlantic overturning circulation over some glacial-aged Heinrich events Jean Lynch-Stieglitz 1, Matthew W. Schmidt 2, L. Gene Henry 1,7,
The Tswaing Impact Crater, South Africa: derivation of a long terrestrial rainfall record for the southern mid-latitudes
 The Tswaing Impact Crater, South Africa: derivation of a long terrestrial rainfall record for the southern mid-latitudes T.C. PARTRIDGE Climatology Research Group, University of the Witwatersrand, Johannesburg,
1. Introduction 2. Ocean circulation a) Temperature, salinity, density b) Thermohaline circulation c) Wind-driven surface currents d) Circulation and
 Temperature, salinity, density b) Thermohaline circulation c) Wind-driven surface currents d) Circulation and") 1. Introduction 2. Ocean circulation a) Temperature, salinity, density b) Thermohaline circulation c) Wind-driven surface currents d) Circulation and climate change e) Oceanic water residence times 3.
1. Introduction 2. Ocean circulation a) Temperature, salinity, density b) Thermohaline circulation c) Wind-driven surface currents d) Circulation and climate change e) Oceanic water residence times 3.
Ocean & climate: an introduction and paleoceanographic perspective
 Ocean & climate: an introduction and paleoceanographic perspective Edouard BARD Chaire de l évolution du climat et de l'océan du Collège de France CEREGE, UMR CNRS, AMU, IRD, CdF Aix-en-Provence The ocean
Supporting Online Material
 Supporting Online Material Materials and Methods Planktonic foraminiferal δ 18 O and Mg/Ca Core MD97-2120 was sampled at 2 cm intervals for stable oxygen isotope analyses on Globigerina bulloides (250-355
The Planetary Circulation System
 12 The Planetary Circulation System Learning Goals After studying this chapter, students should be able to: 1. describe and account for the global patterns of pressure, wind patterns and ocean currents
Air sea temperature decoupling in western Europe during the last interglacial glacial transition
 María Fernanda Sánchez Goñi, Edouard Bard, Amaelle Landais, Linda Rossignol, Francesco d Errico SUPPLEMENTARY INFORMATION DOI: 10.1038/NGEO1924 Air sea temperature decoupling in western Europe during the
Deep Ocean Circulation & implications for Earth s climate
 Deep Ocean Circulation & implications for Earth s climate I. Ocean Layers and circulation types 1) Ocean Layers Ocean is strongly Stratified Consists of distinct LAYERS controlled by density takes huge
/ Past and Present Climate
 MIT OpenCourseWare http://ocw.mit.edu 12.842 / 12.301 Past and Present Climate Fall 2008 For information about citing these materials or our Terms of Use, visit: http://ocw.mit.edu/terms. Ice Sheet Paleoclimatology
Gulf Stream Temperature, Salinity, and Transport during the Last Millennium
 Gulf Stream Temperature, Salinity, and Transport during the Last Millennium David Lund - University of Michigan Part I - Geostrophic estimation of Gulf Stream flow - Gulf Stream strength varied by ~10%
An Introduction to Coupled Models of the Atmosphere Ocean System
 An Introduction to Coupled Models of the Atmosphere Ocean System Jonathon S. Wright jswright@tsinghua.edu.cn Atmosphere Ocean Coupling 1. Important to climate on a wide range of time scales Diurnal to
The North Atlantic Oscillation: Climatic Significance and Environmental Impact
 1 The North Atlantic Oscillation: Climatic Significance and Environmental Impact James W. Hurrell National Center for Atmospheric Research Climate and Global Dynamics Division, Climate Analysis Section
Please be ready for today by:
 Please be ready for today by: 1. HW out for a stamp 2. Paper and pencil/pen for notes 3. Be ready to discuss what you know about El Nino after you view the video clip What is El Nino? El Nino Basics El
Rapid Climate Change: Heinrich/Bolling- Allerod Events and the Thermohaline Circulation. By: Andy Lesage April 13, 2010 Atmos.
 Rapid Climate Change: Heinrich/Bolling- Allerod Events and the Thermohaline Circulation By: Andy Lesage April 13, 2010 Atmos. 6030 Outline Background Heinrich Event I/Bolling-Allerod Transition (Liu et
Supplementary Figure 1. Foraminifer shell weights and coating composition. Correlation of mean foraminiferal shell weights of (a) G.
 G.") Supplementary Figure 1. Foraminifer shell weights and coating composition. Correlation of mean foraminiferal shell weights of (a) G. bulloides and (b) Uvigerina spp. with respective U/Ca cc+c (grey) and
Supplementary Figure 1. Foraminifer shell weights and coating composition. Correlation of mean foraminiferal shell weights of (a) G. bulloides and (b) Uvigerina spp. with respective U/Ca cc+c (grey) and
Selected Presentation from the INSTAAR Monday Noon Seminar Series.
 Selected Presentation from the INSTAAR Monday Noon Seminar Series. Institute of Arctic and Alpine Research, University of Colorado at Boulder. http://instaar.colorado.edu http://instaar.colorado.edu/other/seminar_mon_presentations
AMOC Impacts on Climate
 AMOC Impacts on Climate Rong Zhang GFDL/NOAA, Princeton, NJ, USA Paleo-AMOC Workshop, Boulder, CO, USA May 24, 2016 Atlantic Meridional Overturning Circulation (AMOC) Kuklbrodt et al. 2007 McManus et al.,
Upper Ocean Circulation
 Upper Ocean Circulation C. Chen General Physical Oceanography MAR 555 School for Marine Sciences and Technology Umass-Dartmouth 1 MAR555 Lecture 4: The Upper Oceanic Circulation The Oceanic Circulation
M. Wary et al. Correspondence to: M. Wary
 Supplement of Clim. Past, 11, 1507 1525, 2015 http://www.clim-past.net/11/1507/2015/ doi:10.5194/cp-11-1507-2015-supplement Author(s) 2015. CC Attribution 3.0 License. Supplement of Stratification of surface
the 2 past three decades
 SUPPLEMENTARY INFORMATION DOI: 10.1038/NCLIMATE2840 Atlantic-induced 1 pan-tropical climate change over the 2 past three decades 3 4 5 6 7 8 9 10 POP simulation forced by the Atlantic-induced atmospheric
Ruddiman CHAPTER 13. Earth during the LGM ca. 20 ka BP
 Ruddiman CHAPTER 13 Earth during the LGM ca. 20 ka BP The Last Glacial Maximum When? How much more ice than today? How much colder was it than today (global average)? How much lower were snowlines? Did
Modes of Global Climate Variability during Marine Isotope Stage 3 (60 26 ka)
") 15 MARCH 2010 P I S I A S E T A L. 1581 Modes of Global Climate Variability during Marine Isotope Stage 3 (60 26 ka) NICKLAS G. PISIAS College of Oceanic and Atmospheric Sciences, Oregon State University,
15 MARCH 2010 P I S I A S E T A L. 1581 Modes of Global Climate Variability during Marine Isotope Stage 3 (60 26 ka) NICKLAS G. PISIAS College of Oceanic and Atmospheric Sciences, Oregon State University,
Part 1. Ocean Composition & Circulation
 OCN 401 Biogeochemical Systems (10.19.17) (Schlesinger: Chapter 9) Part 1. Ocean Composition & Circulation 1. Introduction Lecture Outline 2. Ocean Circulation a) Global Patterns in T, S, ρ b) Thermohaline
Chapter 15 Millennial Oscillations in Climate
 Chapter 15 Millennial Oscillations in Climate This chapter includes millennial oscillations during glaciations, millennial oscillations during the last 8000 years, causes of millennial-scale oscillations,
Speleothems and Climate Models
 Earth and Life Institute Georges Lemaître Centre for Earth and Climate Research Université catholique de Louvain, Belgium Speleothems and Climate Models Qiuzhen YIN Summer School on Speleothem Science,
SIO 210 Final examination Answer Key for all questions except Daisyworld. Wednesday, December 10, PM Name:
 SIO 210 Final examination Answer Key for all questions except Daisyworld. Wednesday, December 10, 2008 3-6 PM Name: This is a closed book exam. You may use a calculator. There are two parts: Talley (weighted
Lecture 1. Amplitude of the seasonal cycle in temperature
 Lecture 6 Lecture 1 Ocean circulation Forcing and large-scale features Amplitude of the seasonal cycle in temperature 1 Atmosphere and ocean heat transport Trenberth and Caron (2001) False-colour satellite
Why the Atlantic was surprisingly quiet in 2013
 1 Why the Atlantic was surprisingly quiet in 2013 by William Gray and Phil Klotzbach Preliminary Draft - March 2014 (Final draft by early June) ABSTRACT This paper discusses the causes of the unusual dearth
Wind: Global Systems Chapter 10
 Wind: Global Systems Chapter 10 General Circulation of the Atmosphere General circulation of the atmosphere describes average wind patterns and is useful for understanding climate Over the earth, incoming
WATER VAPOR FLUXES OVER EQUATORIAL CENTRAL AFRICA
 WATER VAPOR FLUXES OVER EQUATORIAL CENTRAL AFRICA INTRODUCTION A good understanding of the causes of climate variability depend, to the large extend, on the precise knowledge of the functioning of the
SUPPLEMENTARY INFORMATION
 SUPPLEMENTARY INFORMATION Site Information: Table S1: Sites Modern Location Modern SST ( C) PO4(µM)-0m PO4(µM)-75m 130-806 0.5N, 159.5E 29.2 0.24 0.34 *(6) 154-925 4.5N, 43.5W 27.4 0.24 0.35 *(S35) 198-1208
Where is all the water?
 Where is all the water? The distribution of water at the Earth's surface % of total Oceans 97.25 Ice caps and glaciers 2.05 Groundwater 0.68 Lakes 0.01 Soils 0.005 Atmosphere (as vapour) 0.001 Rivers 0.0001
Chapter 4. Understanding the Weather. Weather is short-term and caused by various air and ocean circulations
 Video: Meteorologist Paul Douglas April 2013 Understanding the Weather Weather is short-term and caused by various air and ocean circulations There are natural climate cycle that cause large climate changes
North Pacific Climate Overview N. Bond (UW/JISAO), J. Overland (NOAA/PMEL) Contact: Last updated: August 2009
, J. Overland (NOAA/PMEL) Contact: Last updated: August 2009") North Pacific Climate Overview N. Bond (UW/JISAO), J. Overland (NOAA/PMEL) Contact: Nicholas.Bond@noaa.gov Last updated: August 2009 Summary. The North Pacific atmosphere-ocean system from fall 2008 through
North Pacific Climate Overview N. Bond (UW/JISAO), J. Overland (NOAA/PMEL) Contact: Nicholas.Bond@noaa.gov Last updated: August 2009 Summary. The North Pacific atmosphere-ocean system from fall 2008 through
2013 ATLANTIC HURRICANE SEASON OUTLOOK. June RMS Cat Response
 2013 ATLANTIC HURRICANE SEASON OUTLOOK June 2013 - RMS Cat Response Season Outlook At the start of the 2013 Atlantic hurricane season, which officially runs from June 1 to November 30, seasonal forecasts
6. What has been the most effective erosive agent in the climate system? a. Water b. Ice c. Wind
 Multiple Choice. 1. Heinrich Events a. Show increased abundance of warm-water species of planktic foraminifera b. Show greater intensity since the last deglaciation c. Show increased accumulation of ice-rafted
ENSO Cycle: Recent Evolution, Current Status and Predictions. Update prepared by Climate Prediction Center / NCEP 23 April 2012
 ENSO Cycle: Recent Evolution, Current Status and Predictions Update prepared by Climate Prediction Center / NCEP 23 April 2012 Outline Overview Recent Evolution and Current Conditions Oceanic Niño Index
Climate of the Past. A. Govin et al.
 Clim. Past Discuss., 9, C3570 C3579, 2014 www.clim-past-discuss.net/9/c3570/2014/ Author(s) 2014. This work is distributed under the Creative Commons Attribute 3.0 License. Climate of the Past Discussions
Project of Strategic Interest NEXTDATA. Deliverables D1.3.B and 1.3.C. Final Report on the quality of Reconstruction/Reanalysis products
 Project of Strategic Interest NEXTDATA Deliverables D1.3.B and 1.3.C Final Report on the quality of Reconstruction/Reanalysis products WP Coordinator: Nadia Pinardi INGV, Bologna Deliverable authors Claudia
Does the Mg/Ca in Foraminifera Tests Provide a Reliable Temperature Proxy?
 Grand Valley State University ScholarWorks@GVSU Student Summer Scholars Undergraduate Research and Creative Practice 2009 Does the Mg/Ca in Foraminifera Tests Provide a Reliable Temperature Proxy? Sarah
ATOC OUR CHANGING ENVIRONMENT
 ATOC 1060-002 OUR CHANGING ENVIRONMENT Class 22 (Chp 15, Chp 14 Pages 288-290) Objectives of Today s Class Chp 15 Global Warming, Part 1: Recent and Future Climate: Recent climate: The Holocene Climate
Chapter outline. Reference 12/13/2016
 Chapter 2. observation CC EST 5103 Climate Change Science Rezaul Karim Environmental Science & Technology Jessore University of science & Technology Chapter outline Temperature in the instrumental record
8. Climate changes Short-term regional variations
 8. Climate changes 8.1. Short-term regional variations By short-term climate changes, we refer here to changes occurring over years to decades. Over this timescale, climate is influenced by interactions
size fraction for elemental measurement. Samples for Mg/Ca were cleaned using the full
 DR2008246 SUPPLEMENTARY ONLINE MATERIALS Methods 51GGC and 36GGC. Samples were taken for elemental and isotopic analyses at 2 (51GGC) and 4 (36GGC) cm intervals giving a time resolution of 200 to 300 years
SIO 210 Final Exam December 10, :30 2:30 NTV 330 No books, no notes. Calculators can be used.
 SIO 210 Final Exam December 10, 2003 11:30 2:30 NTV 330 No books, no notes. Calculators can be used. There are three sections to the exam: multiple choice, short answer, and long problems. Points are given
Tracers. 1. Conservative tracers. 2. Non-conservative tracers. Temperature, salinity, SiO 2, Nd, 18 O. dissolved oxygen, phosphate, nitrate
 Tracers 1. Conservative tracers Temperature, salinity, SiO 2, Nd, 18 O 2. Non-conservative tracers dissolved oxygen, phosphate, nitrate Temperature itself is a tracer but other tracers (like oxygen isotopes)
Ocean Mixing and Climate Change
 Ocean Mixing and Climate Change Factors inducing seawater mixing Different densities Wind stirring Internal waves breaking Tidal Bottom topography Biogenic Mixing (??) In general, any motion favoring turbulent
LETTERS. Tropical Stabilization of the Thermohaline Circulation in a Greenhouse Warming Simulation
 VOLUME 13 JOURNAL OF CLIMATE 1JUNE 2000 LETTERS Tropical Stabilization of the Thermohaline Circulation in a Greenhouse Warming Simulation M. LATIF, E.ROECKNER, U.MIKOLAJEWICZ, AND R. VOSS Max-Planck-Institut
ENSO Cycle: Recent Evolution, Current Status and Predictions. Update prepared by Climate Prediction Center / NCEP 24 September 2012
 ENSO Cycle: Recent Evolution, Current Status and Predictions Update prepared by Climate Prediction Center / NCEP 24 September 2012 Outline Overview Recent Evolution and Current Conditions Oceanic Niño
North Pacific Climate Overview N. Bond (UW/JISAO), J. Overland (NOAA/PMEL) Contact: Last updated: September 2008
, J. Overland (NOAA/PMEL) Contact: Last updated: September 2008") North Pacific Climate Overview N. Bond (UW/JISAO), J. Overland (NOAA/PMEL) Contact: Nicholas.Bond@noaa.gov Last updated: September 2008 Summary. The North Pacific atmosphere-ocean system from fall 2007
North Pacific Climate Overview N. Bond (UW/JISAO), J. Overland (NOAA/PMEL) Contact: Nicholas.Bond@noaa.gov Last updated: September 2008 Summary. The North Pacific atmosphere-ocean system from fall 2007
CHAPTER 9 ATMOSPHERE S PLANETARY CIRCULATION MULTIPLE CHOICE QUESTIONS
 CHAPTER 9 ATMOSPHERE S PLANETARY CIRCULATION MULTIPLE CHOICE QUESTIONS 1. Viewed from above in the Northern Hemisphere, surface winds about a subtropical high blow a. clockwise and inward. b. counterclockwise.
Supplementary Figure 1. New downcore data from this study. Triangles represent the depth of radiocarbon dates. Error bars represent 2 standard error
 Supplementary Figure 1. New downcore data from this study. Triangles represent the depth of radiocarbon dates. Error bars represent 2 standard error of measurement (s.e.m.). 1 Supplementary Figure 2. Particle
ENSO Cycle: Recent Evolution, Current Status and Predictions. Update prepared by Climate Prediction Center / NCEP 5 August 2013
 ENSO Cycle: Recent Evolution, Current Status and Predictions Update prepared by Climate Prediction Center / NCEP 5 August 2013 Outline Overview Recent Evolution and Current Conditions Oceanic Niño Index
SUPPLEMENTARY INFORMATION
 SUPPLEMENTARY INFORMATION DOI: 1.138/NGEO168 "Strength and geometry of the glacial Atlantic Meridional Overturning Circulation" S2 Map of core locations Core locations of the Holocene and LGM 231 / 23
Climate and Environment
 Climate and Environment Oxygen Isotope Fractionation and Measuring Ancient Temperatures Oxygen Isotope Ratio Cycles Oxygen isotope ratio cycles are cyclical variations in the ratio of the mass of oxygen
ENSO Cycle: Recent Evolution, Current Status and Predictions. Update prepared by Climate Prediction Center / NCEP 11 November 2013
 ENSO Cycle: Recent Evolution, Current Status and Predictions Update prepared by Climate Prediction Center / NCEP 11 November 2013 Outline Overview Recent Evolution and Current Conditions Oceanic Niño Index
lecture 12 Paleoclimate
 lecture 12 Paleoclimate OVERVIEW OF EARTH S CLIMATIC HISTORY Geologic time scales http://www.snowballearth.org/index.html Features of the climate during the Cretaceous period the land-sea distribution
We re living in the Ice Age!
 Chapter 18. Coping with the Weather: Causes and Consequences of Naturally Induce Climate Change 지구시스템의이해 We re living in the Ice Age! 1 Phanerozoic Climate 서늘해지고 더웠고 따뜻했고 3 Climate Rollercoaster 4 2 Time
KUALA LUMPUR MONSOON ACTIVITY CENT
 T KUALA LUMPUR MONSOON ACTIVITY CENT 2 ALAYSIAN METEOROLOGICAL http://www.met.gov.my DEPARTMENT MINISTRY OF SCIENCE. TECHNOLOGY AND INNOVATIO Introduction Atmospheric and oceanic conditions over the tropical
MET 3102-U01 PHYSICAL CLIMATOLOGY (ID 17901) Lecture 14
 Lecture 14") MET 3102-U01 PHYSICAL CLIMATOLOGY (ID 17901) Lecture 14 The hydrologic cycle evaporation vapor transport precipitation precipitation evaporation runoff Evaporation, precipitation, etc. in cm Vapor transported
MET 3102-U01 PHYSICAL CLIMATOLOGY (ID 17901) Lecture 14 The hydrologic cycle evaporation vapor transport precipitation precipitation evaporation runoff Evaporation, precipitation, etc. in cm Vapor transported
Tracking El Niño using optical indices of phytoplankton dynamics in the equatorial Pacific
 Abstract Tracking El Niño using optical indices of phytoplankton dynamics in the equatorial Pacific Joel Craig 1, Pete Strutton 2, Wiley Evans 2 1. College of Earth and Atmospheric Science, Georgia Institute
SE Atlantic SST variability and southern African climate
 SE Atlantic SST variability and southern African climate Chris Reason Oceanography Dept, Univ. Cape Town Overview of southern African climate and tropical Atlantic SST South American monsoon, Benguela
A Broecker Brief Origin of the Atlantic s glacial age lower deep water
 A Broecker Brief Origin of the Atlantic s glacial age lower deep water Today s deep Atlantic shows no hint of nutrient stratification (see Figure 1). By contrast, during the last glacial maximum (LGM),
ENSO: Recent Evolution, Current Status and Predictions. Update prepared by: Climate Prediction Center / NCEP 9 November 2015
 ENSO: Recent Evolution, Current Status and Predictions Update prepared by: Climate Prediction Center / NCEP 9 November 2015 Outline Summary Recent Evolution and Current Conditions Oceanic Niño Index (ONI)
The role of teleconnections in extreme (high and low) precipitation events: The case of the Mediterranean region
 precipitation events: The case of the Mediterranean region") European Geosciences Union General Assembly 2013 Vienna, Austria, 7 12 April 2013 Session HS7.5/NP8.4: Hydroclimatic Stochastics The role of teleconnections in extreme (high and low) events: The case of
European Geosciences Union General Assembly 2013 Vienna, Austria, 7 12 April 2013 Session HS7.5/NP8.4: Hydroclimatic Stochastics The role of teleconnections in extreme (high and low) events: The case of
ENSO and April SAT in MSA. This link is critical for our regression analysis where ENSO and
 Supplementary Discussion The Link between El Niño and MSA April SATs: Our study finds a robust relationship between ENSO and April SAT in MSA. This link is critical for our regression analysis where ENSO
Impact of atmospheric CO 2 doubling on the North Pacific Subtropical Mode Water
 GEOPHYSICAL RESEARCH LETTERS, VOL. 36, L06602, doi:10.1029/2008gl037075, 2009 Impact of atmospheric CO 2 doubling on the North Pacific Subtropical Mode Water Hyun-Chul Lee 1,2 Received 19 December 2008;
General Circulation. Nili Harnik DEES, Lamont-Doherty Earth Observatory
 General Circulation Nili Harnik DEES, Lamont-Doherty Earth Observatory nili@ldeo.columbia.edu Latitudinal Radiation Imbalance The annual mean, averaged around latitude circles, of the balance between the
Winds and Global Circulation
 Winds and Global Circulation Atmospheric Pressure Winds Global Wind and Pressure Patterns Oceans and Ocean Currents El Nino How is Energy Transported to its escape zones? Both atmospheric and ocean transport
Regional Oceanography: an Introduction
 138 Regional Oceanography: an Introduction A characteristic feature of the South Pacific Ocean is the existence of a second region of wind convergence in the tropics known as the South Pacific Convergence
MAR 110 LECTURE #10 The Oceanic Conveyor Belt Oceanic Thermohaline Circulation
 1 MAR 110 LECTURE #10 The Oceanic Conveyor Belt Oceanic Thermohaline Circulation Ocean Climate Temperature Zones The pattern of approximately parallel oceanic surface isotherms (lines of constant temperature)
Weather & Ocean Currents
 Weather & Ocean Currents Earth is heated unevenly Causes: Earth is round Earth is tilted on an axis Earth s orbit is eliptical Effects: Convection = vertical circular currents caused by temperature differences
East-west SST contrast over the tropical oceans and the post El Niño western North Pacific summer monsoon
 GEOPHYSICAL RESEARCH LETTERS, VOL. 32, L15706, doi:10.1029/2005gl023010, 2005 East-west SST contrast over the tropical oceans and the post El Niño western North Pacific summer monsoon Toru Terao Faculty
INFLUENCE OF LARGE-SCALE ATMOSPHERIC MOISTURE FLUXES ON THE INTERANNUAL TO MULTIDECADAL RAINFALL VARIABILITY OF THE WEST AFRICAN MONSOON
 3C.4 INFLUENCE OF LARGE-SCALE ATMOSPHERIC MOISTURE FLUXES ON THE INTERANNUAL TO MULTIDECADAL RAINFALL VARIABILITY OF THE WEST AFRICAN MONSOON Andreas H. Fink*, and Sonja Eikenberg University of Cologne,
Project Retrograde imagine Earth rotated in the opposite direction
 Project Retrograde imagine Earth rotated in the opposite direction The rotation of Earth shapes our climate system in various ways: It controls the major wind directions, lets the weather systems swirl,
Lecture 28: Observed Climate Variability and Change
 Lecture 28: Observed Climate Variability and Change 1. Introduction This chapter focuses on 6 questions - Has the climate warmed? Has the climate become wetter? Are the atmosphere/ocean circulations changing?
ENSO Cycle: Recent Evolution, Current Status and Predictions. Update prepared by Climate Prediction Center / NCEP 25 February 2013
 ENSO Cycle: Recent Evolution, Current Status and Predictions Update prepared by Climate Prediction Center / NCEP 25 February 2013 Outline Overview Recent Evolution and Current Conditions Oceanic Niño Index
Lecture 0 A very brief introduction
 Lecture 0 A very brief introduction Eli Tziperman Climate variability results from a very diverse set of physical phenomena and occurs on a very wide range of time scales. It is difficult to envision a
Analysis of Fall Transition Season (Sept-Early Dec) Why has the weather been so violent?
 Why has the weather been so violent?") WEATHER TOPICS Analysis of Fall Transition Season (Sept-Early Dec) 2009 Why has the weather been so violent? As can be seen by the following forecast map, the Fall Transition and early Winter Season of
WEATHER TOPICS Analysis of Fall Transition Season (Sept-Early Dec) 2009 Why has the weather been so violent? As can be seen by the following forecast map, the Fall Transition and early Winter Season of
Science 1206 Chapter 1 - Inquiring about Weather
 Science 1206 Chapter 1 - Inquiring about Weather 1.1 - The Atmosphere: Energy Transfer and Properties (pp. 10-25) Weather and the Atmosphere weather the physical conditions of the atmosphere at a specific
LETTERS. Influence of the Thermohaline Circulation on Projected Sea Level Rise
 VOLUME 13 JOURNAL OF CLIMATE 15 JUNE 2000 LETTERS Influence of the Thermohaline Circulation on Projected Sea Level Rise RETO KNUTTI AND THOMAS F. STOCKER Climate and Environmental Physics, Physics Institute,
ENSO: Recent Evolution, Current Status and Predictions. Update prepared by: Climate Prediction Center / NCEP 30 October 2017
 ENSO: Recent Evolution, Current Status and Predictions Update prepared by: Climate Prediction Center / NCEP 30 October 2017 Outline Summary Recent Evolution and Current Conditions Oceanic Niño Index (ONI)
MPACT OF EL-NINO ON SUMMER MONSOON RAINFALL OF PAKISTAN
 MPACT OF EL-NINO ON SUMMER MONSOON RAINFALL OF PAKISTAN Abdul Rashid 1 Abstract: El-Nino is the dominant mod of inter- annual climate variability on a planetary scale. Its impact is associated worldwide
JEAN-CLAUDE DUPLESSY, MAURICE ARNOLD, EDOUARD BARD, ANNE JUILLET-LECLERC, NEJIB KALLEL
 [RADIOCARBON, VOL 31, No. 3, 1989, P 493-521 AMS 14C STUDY OF TRANSIENT EVENTS AND OF THE VENTILATION RATE OF THE PACIFIC INTERMEDIATE WATER DURING THE LAST DEGLACIATION JEAN-CLAUDE DUPLESSY, MAURICE ARNOLD,
The Atlantic/Pacific moisture budget asymmetry: the role of atmospheric moisture transport
 The Atlantic/Pacific moisture budget asymmetry: the role of atmospheric moisture transport Philip Craig, David Ferreira, John Methven Lunchtime seminar Department of Meteorology, University of Reading
Continental Hydrology, Rapid Climate Change, and the Intensity of the Atlantic MOC: Insights from Paleoclimatology
 Continental Hydrology, Rapid Climate Change, and the Intensity of the Atlantic MOC: Insights from Paleoclimatology W.R. Peltier Department of Physics University of Toronto WOCE derived N-S salinity section
SUPPLEMENTARY INFORMATION
 1. Simulation of Glacial Background Climate Globally averaged surface air is 3 K cooler than in the pre-industrial simulation. This is less than the 4-7 K cooling estimated for the Last Glacial Maximum
Tropical Ocean Temperatures Over the Past 3.5 Million Years
 www.sciencemag.org/cgi/content/full/328/5985/1530/dc1 Supporting Online Material for Tropical Ocean Temperatures Over the Past 3.5 Million Years Timothy D. Herbert, Laura Cleaveland Peterson, Kira T. Lawrence,
ENSO Cycle: Recent Evolution, Current Status and Predictions. Update prepared by Climate Prediction Center / NCEP 15 July 2013
 ENSO Cycle: Recent Evolution, Current Status and Predictions Update prepared by Climate Prediction Center / NCEP 15 July 2013 Outline Overview Recent Evolution and Current Conditions Oceanic Niño Index
Two aspects of moisture origin relevant to analysis of isotope modeling
 Two aspects of moisture origin relevant to analysis of isotope modeling Maxwell Kelley MIT Department of Earth, Atmospheric, and Planetary Sciences and NASA Goddard Institute for Space Studies IAEA SIMS
Potential Impact of climate change and variability on the Intra-Americas Sea (IAS)
") Potential Impact of climate change and variability on the Intra-Americas Sea (IAS) Sang-Ki Lee 1, Yanyun Liu 1 and Barbara Muhling 2 1 CIMAS-University of Miami and AOML-NOAA 2 Princeton University and
Potential Impact of climate change and variability on the Intra-Americas Sea (IAS) Sang-Ki Lee 1, Yanyun Liu 1 and Barbara Muhling 2 1 CIMAS-University of Miami and AOML-NOAA 2 Princeton University and
At it s most extreme very low pressure off Indonesia, every high off SA, ~8 o C difference over the Pacific and ½ m water level differential) ENSO is
 ENSO is") This summer : El Niño (ENSO) and the NAO (Ocean/Atmosphere coupling teleconnections) A teleconnection (as used in the atmospheric sciences) refers to climate anomalies that are related across very large
This summer : El Niño (ENSO) and the NAO (Ocean/Atmosphere coupling teleconnections) A teleconnection (as used in the atmospheric sciences) refers to climate anomalies that are related across very large
Physics of Aquatic Systems II
 Contents of Session 5 Physics of Aquatic Systems II 5. Stable Isotopes - Applications Some examples of applications Stable isotopes as markers of water origin Stable isotopes in process studies Stable
NOTES AND CORRESPONDENCE. El Niño Southern Oscillation and North Atlantic Oscillation Control of Climate in Puerto Rico
 2713 NOTES AND CORRESPONDENCE El Niño Southern Oscillation and North Atlantic Oscillation Control of Climate in Puerto Rico BJÖRN A. MALMGREN Department of Earth Sciences, University of Göteborg, Goteborg,
OCN/ATM/ESS 587. Ocean circulation, dynamics and thermodynamics.
 OCN/ATM/ESS 587 Ocean circulation, dynamics and thermodynamics. Equation of state for seawater General T/S properties of the upper ocean Heat balance of the upper ocean Upper ocean circulation Deep circulation
Name the surface winds that blow between 0 and 30. GEO 101, February 25, 2014 Monsoon Global circulation aloft El Niño Atmospheric water
 GEO 101, February 25, 2014 Monsoon Global circulation aloft El Niño Atmospheric water Name the surface winds that blow between 0 and 30 What is the atmospheric pressure at 0? What is the atmospheric pressure
TROPICAL-EXTRATROPICAL INTERACTIONS
 Notes of the tutorial lectures for the Natural Sciences part by Alice Grimm Fourth lecture TROPICAL-EXTRATROPICAL INTERACTIONS Anomalous tropical SST Anomalous convection Anomalous latent heat source Anomalous
Water percolating through hot lava dissolves soluble minerals containing chlorine, bromine and sulphur compounds
 Figure 5 The sources of dissolved ions in sea water. Water falls as rain Compounds containing mainly calcium, magnesium, carbonate and silicate ions are leached from the soil Rivers carry ions in solution