HOW THE EUROPEAN CYCLONE TRACKS AND FREQUENCY CHANGED IN THE PERIOD?
|
|
|
- Augustine Parrish
- 5 years ago
- Views:
Transcription
1 HOW THE EUROPEAN CYCLONE TRACKS AND FREQUENCY CHANGED IN THE PERIOD? R. Pongrácz 1, J. Bartholy 1, M. Pattantyús-Ábrahám 2 and ZS. Pátkai 1 1 Department of Meteorology, Eötvös Loránd University, Budapest, Hungary, prita@nimbus.elte.hu, bari@ludens.elte.hu, a2zsolt@fre .hu 2 Department of Hydraulic and Water Resources Engineering, Budapest University of Technology and Economics, Budapest, Hungary, patyi@nimbus.elte.hu Abstract. Variability and trend of the large-scale circulation characteristics over the North- Atlantic-European region are analyzed for the 20th century. First, changes in decadal frequency of Hess-Brezowsky macrocirculation patterns (MCP) are evaluated between 1881 and Then, cyclone center identification and cyclone tracks and intensity analysis is accomplished on the base of the European Centre for Medium-range Weather Forecast (ECMWF) reanalysis datasets (ERA-40) on a 2.5 horizontal resolution grid for the 45 year period between 1957 and Time series of the four main geopotential height fields (i.e., AT 500 hpa, AT 700 hpa, AT 850 hpa, and AT 1000 hpa) are used together with the sea level pressure fields. Decadal scale variability and trends are analyzed and compared for all levels. Finally, significant frontal events (e.g., frontal precipitation and temperature changes) are also analyzed, i.e., how often and how intense they occurred in the last few decades, whether or not any trend may be detected in the Carpathian Basin. Keywords. Cyclone track, cyclone intensity, Atlantic-European region, macrocirculation pattern 1. Introduction Extratropical cyclones are responsible for a large portion of the heat and moisture transports between the tropics and the polar regions. Therefore, any changes in frequency or intensity of these cyclones may affect significantly the regional climate of the midlatitudes. Several methodological approaches are available and have been applied to these analyses. One of the most often used statistical methods is to analyze the frequency change of macrocirculation patterns (MCP) defined for Europe by Hess and Brezowsky (1977) or defined for the region of the British Isles by Lamb (1972). Another method can also be used, namely, to extract and analyze the extratropical cyclones and their tracks since midlatitude cyclones are important features of the extratropical climate. In earlier studies midlatitude cyclones were subjectively identified by van Bebber (1891) and Klein (1957). Then, objective identification was used by Lambert (1988) and Hodges (1994). Zhang et al. (2004) composed the climatology of cyclone activity in the arctic regions for the , while Alpert et al. (1990) analyzed monthly cyclone frequencies and cyclone tracks based on 5-year-long ( ) seven geopotential level fields for the Mediterranean region. Both analyses used data with 2.5 horizontal resolution. Key and Chan (1999) analyzed seasonal and annual trends of cyclone frequencies using time series of 1000 hpa and 500 hpa geopotential fields for (with a latitude-longitude grid resolution of ). Statistically significant increasing trends (at 0.05 level) were found in all seasons at 1000 hpa for the Arctic region. In this paper, first, significant changes in the frequency of different Western/Central-European macrocirculation patterns are presented for the 20th century (Section 2). Then, in Section 3 cyclone tracks and intensity analysis is accomplished for the North-Atlantic-European region on the base of the European Centre for Medium-range Weather Forecast (ECMWF) reanalysis datasets (ERA-40) with 2.5 horizontal resolution. Changes of frontal activity in the Carpathian Basin are also analyzed. 2. Observed tendency of frequency of macrocirculation patterns Phenomenological circulation statistics are analyzed using the Hess-Brezowsky (1977) macrocirculation types. Overview of the regional circulation structures of the Atlantic-European region can be found in Table 1. The macrocirculation patterns are classified into 29 types based on the
2 dominant direction of air mass movements and the presence of cyclones or anticyclones in different regions. The available dataset consists of daily MCP codes from 1881 to 2000 and is published monthly in the journal Die Grosswetterlagen Europas of the German Meteorological Service. Table 1. Macrocirculation types defined in the Hess-Brezowsky classification system. Circulation type Main flow direction Macrosynoptic type (notation) Zonal West (W) West anticyclonic (Wa) West cyclonic (Wz) Southern West (Ws) Angleformed West (Ww) Half- Southwest (SW) Southwest anticyclonic (SWa) Meridional Northwest (NW) Central European high (HM) Central European low (TM) Southwest cyclonic (SWz) Northwest anticyclonic (NWa) Northwest cyclonic (NWz) Central European high (HM) Central European ridge (BM) Central European low (TM) Meridional North (N) North anticyclonic (Na) Northeast (NE) East (E) Southeast (SE) South (S) North cyclonic (Nz) North, Iceland high, anticyclonic (HNa) North, Iceland high, cyclonic (HNz) British Islands high (HB) Central European Trough (TRM) Northeast anticyclonic (NEa) Northeast cyclonic (NEz) Fennoscandian high, anticyclonic (HFa) Fennoscandian high, cyclonic (HFz) Norwegian Sea Fennoscandian high, anticyclonic (HNFa) Norwegian Sea Fennoscandian high, cyclonic (HNFz) Southeast anticyclonic (SEa) Southeast cyclonic (SEz) South anticyclonic (Sa) South cyclonic (Sz) British Islands low (TB) Western European Trough (TRW) Figure 1 presents the decadal frequency distribution of Hess-Brezowsky MCP types using Box- Whisker plot diagrams, and the significance of the detected trends. Large differences between the upper and the lower quartile values (appearing as large boxes in the figure) may indicate considerable changes in frequency of the given MCP type during the 120 years. Furthermore, the entire range between the maximum and minimum values of the decadal frequency also highlights the variability of MCP type frequency. Below the x-axis, sign of the detected trends is presented, and the significant trend signs are shaded by grey. According to the results, frequency of several MCP types changed significantly.

3 Figure 1. Decadal frequency distribution of Hess-Brezowsky types, The description of the MCP types are listed in Table 1. Figures 2 and 3 illustrate the increasing and decreasing tendency of occurrences, respectively. Frequencies of Southwest cyclonic (SWz), Central European ridge (BM), and Western European Trough (TrW) MCP types increased considerably during the 20th century. Frequencies of Northwest anticyclonic (NWa), Central European high (HM), and Fennoscandian high, anticyclonic (HFa) MCP types decreased in the last 120 years, all of them represent anticyclonically dominated circulation features over the European continent. At the lower panels of the figures, the typical sea level pressure patterns of the corresponding MCP types are provided. Figure 2. Selected Hess-Brezowsky MCP types with increasing decadal frequency distribution ( ). The linear trend is fitted using the least square method. The description of these MCP types are listed in Table 1. Maps represent the typical sea level pressure patterns.

4 Figure 3. Selected Hess-Brezowsky MCP types with decreasing decadal frequency distribution ( ). The linear trend is fitted using the least square method. The description of these MCP types are listed in Table 1. Maps represent the typical sea level pressure patterns. Since these Hess-Brezowsky MCP types, as well, as the classification method include many subjective elements, the results presented in this section also involve a lot of uncertainty. In order to reduce this, objective algorithms are used in the next section for cyclone track identification. 3. Identification and analysis of European cyclone tracks In the Northern hemisphere, midlatitude cyclones with their associated frontal systems influence significantly the local weather in Europe, as well as in most parts of North-America. For instance, more than two-thirds of the winter precipitation amount of the European continent originate from the frontal systems of less than 15 cyclones (Fraedrich et al., 1986), further highlighting the importance of cyclone track and cyclone intensity analysis Data In the present analysis the European Centre for Medium-range Weather Forecast (ECMWF) reanalysis datasets (ERA-40) are used. Figure 4. The selected domain and the grid points of the North-Atlantic-European region.
5 ERA-40 ( has been compiled from both in-situ and remotelysensed measurements made over the period since mid-1957 until 2002 (Kallberg et al., 2004). ERA-40 datasets provide all meteorological variables at 60 vertical levels between the surface and a height of about 65 km with 6-hour temporal resolution. Originally, ERA-40 has a spectral representation based on a triangular truncation at wave number 156 or horizontal resolution using a Gaussian grid (Simmons and Gibson, 2000). The spatial resolution of the four main geopotential height fields (or Absolute Topography - AT) used in this analysis (i.e., AT 500 hpa, AT 700 hpa, AT 850 hpa, and AT 1000 hpa) is , which can be downloaded via Internet. In this paper, the North-Atlantic- European region is shown in Figure 4. This entire domain covers the area between N and 45 W-40 E, and it consists of 665 (=19 35) grid points altogether Results and discussion In order to explore the structural changes in geopotential height fields, statistical descriptive parameters are analyzed for the last 45 years. Figure 5 presents the standard deviation of the four main geopotential height fields (AT-500 hpa, AT-700 hpa, AT-850 hpa, AT-1000 hpa) of the troposphere. Large standard deviation values indicate high variability of the geopotential height level. They can be observed in the northern part of the selected domain, namely, around Iceland. In general, the North- Atlantic-European region can be characterized by zonal distribution of standard deviation. Two disturbances can be identified, namely, (i) in the northwestern part of the selected domain where the large variance may partly be explained by frequent cyclogenesis, (ii) in the Ligurian/Tyrrhenian Sea with smaller standard deviation values where the so-called Genoa cyclones are often forming. Figure 5. Standard deviation of the four main geopotential height fields for the North-Atlantic-European region, Linear tendency analysis is accomplished for all the grid points of the North-Atlantic-European domain. Decadal trend values are presented on the maps of Figures 6 and 7 for the middle and the lower tropospheric levels, respectively. Similar spatial structures can be seen on these maps representing different geopotential height levels. Special zonal patterns may be recognized with
6 negative trend coefficients with one center area in the Greenland/Iceland region, while positive trend coefficients dominate the southern area, where two centers can be identified: (1) in the Mediterranean and (2) in the Atlantic regions. On the maps, white and red asterisks represent the northern and the southern central regions, respectively. Graphs, shown above the maps of Figures 6 and 7, present the decreasing tendency of the annual mean geopotential height values for the grid point located in the Atlantic Ocean between southern Greenland and Iceland at 65 N latitude, 35 W longitude. Graphs, shown below the maps, illustrate the increasing tendency of the annual mean geopotential height values for the grid point located in the Mediterranean Sea at 42.5 N latitude, 7.5 E longitude. Except the AT 1000 hpa level, all of the presented linear trends for these two selected grid points are significant at 0.05 level using the t-test. Figure 6. Tendency analysis of AT-500 hpa (left) and AT-700 hpa (right) geopotential height levels. Detailed linear trends are shown for two selected gridpoints (65 N 35 W and 42.5 N 7.5 E) above and below the map of the trend coefficients, respectively. The fitted linear trends are significant at 0.05 level using the t-test.
7 Figure 7. Tendency analysis of AT-850 hpa (left) and AT-1000 hpa (right) geopotential height levels. Detailed linear trends are shown for two selected gridpoints (65 N 35 W and 42.5 N 7.5 E) above and below the map of the trend coefficients, respectively. The fitted linear trends are significant at 0.05 level using the t-test only in case of AT-850 hpa. After the evaluation of the annual trend maps, the seasonal trend coefficients are mapped for the four main geopotential height fields. Figure 8 presents the detected trend fields for the AT 500 hpa level. No significant trend can be found in summer (coefficients are below 1 gpm/decade in absolute value), while the largest trend coefficients are detected in winter. The structure of the winter trends is similar to the annual trend fields. However, the absolute values of the winter trend coefficients at the two centers (the northwestern part of the selected domain around Greenland/Iceland, and the Mediterranean region in southwestern Europe and the Ligurian/Tyrrhenian Sea) are larger than the annual trend coefficients. One of the main advantages of compiled global reanalysis datasets is to open the possibility for the identification of cyclone centers and cyclone tracks using objective methodology. After obtaining the location of identified midlatitude cyclones, frequency and intensity analysis can be accomplished. Several authors attempted to identify extratropical cyclones using different algorithms but probably the most often cited method was developed by Serreze (1995) and Serreze et al. (1997). They studied
8 arctic cyclones occurring in spring and winter, , based on sea level pressure data with 2.5 horizontal resolution. Their results suggest that frequency of cyclones increased, while their lifetime decreased. The method applied by Serreze et al. (1997) derives cyclones using pressure gradient, and is able to detect strong high-latitude cyclones. Figure 8. Seasonal trend analysis of AT-500 hpa geopotential height level, In this paper potential midlatitude cyclone centers are defined on grid points with pressure depression where the following main criteria are fulfilled: (1) the sea level pressure is less than 1012 hpa, and (2) the pressure gradient is greater than 0.07 hpa/100 km for all direction. Geographical latitude and longitude, sea level pressure, and minimum of the pressure gradient values of the potential cyclone centers are stored at every time step (i.e., 6 hours). Then, cyclone tracks are determined by special sequences of stored potential cyclone centers. According to the algorithm used in this paper, two subsequent potential cyclone centers may belong to the same cyclone track if (1) their geographical distance is less than 900 km, and (2) their sea level pressure difference is less than 5 hpa in absolute value. Finally, the stored cyclone tracks contain data on (i) the time of the first detection of the cyclone center, (ii) the number of time steps until the last detection, (iii) the minimum pressure gradient during the entire lifetime of the cyclone, (iv) the geographical latitude/longitude coordinates of the cyclone center and (v) the sea level pressure in each time step. In order to verify the obtained cyclone tracks, synoptic charts of the North-Atlantic- European region have been used for June 2002 (one example is shown in Figure 9). Although slight shifts (a few degrees) in the location of cyclone centers occurred, no false cyclone track has been determined during the verification period.


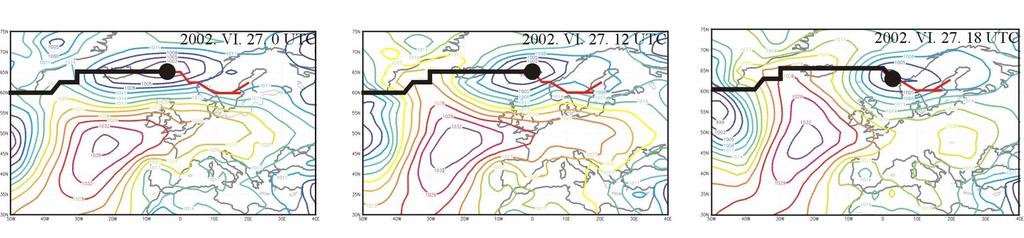
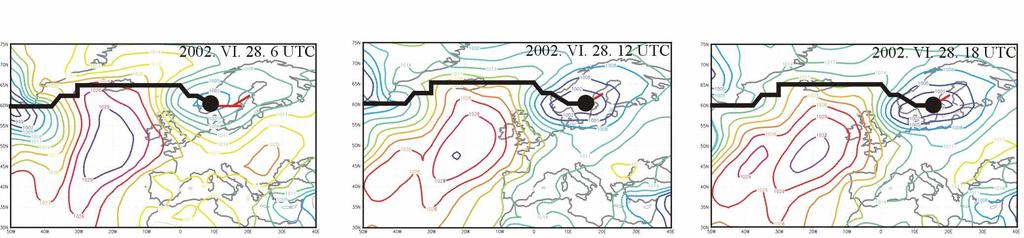

9 Figure 9. Midlatitude cyclone track reconstruction, June 2002.
.")
. Figure 10. Frequency of cyclogenesis, 1957-2002.")

10 The starting positions of the identified midlatitude cyclone tracks indicate the geographical locations of cyclogenesis. Figure 10 shows the spatial frequency distribution of these cyclogenesis centers for the entire 45 years ( ). The two largest frequency values can be found in the northwestern part of the selected domain around Greenland/Iceland, and in the Mediterranean region in southwestern Europe and the Ligurian/Tyrrhenian Sea where the largest trend coefficients occurred (shown in Figures 6, 7, and 8). Figure 10. Frequency of cyclogenesis, Figure 11 summarizes seasonal cyclones center frequency in the North-Atlantic-European region for five equal 9-year-long periods. Maps on the left and the right panels represent smoothed grid point values in winter and summer, respectively. In general, less midlatitude cyclones can be detected in summer than in winter. Furthermore, cyclone tracks shift to the North in summer since they are located mainly north to the N latitude zone. The results also suggest that the number of cyclones increased considerably in the northwestern part of the domain in the last 45 year in both seasons (Bartholy et al., 2006). Figure 11. Changes of seasonal cyclone center frequency (per decade) distribution in the North- Atlantic-European region in winter (December-January-February) and summer (June-July-August).
, which summarizes the differences between the sea level pressure of cyclone centers and the monthly mean pressure of that grid point for each time step of all cyclones detected in a given")

11 In order to characterize the intensity of midlatitude cyclones, a complex parameter, namely, the Cyclone Activity Index (CAI) was defined by Zhang et al. (2004), which summarizes the differences between the sea level pressure of cyclone centers and the monthly mean pressure of that grid point for each time step of all cyclones detected in a given month. For the North-Atlantic-European region, seasonal CAI values are mapped in Figure 12. In order to detect the possible changes in cyclone activity, the entire 45-year-long period is separated into five equal long subsets similarly to the previous analysis. In general, the Icelandic cyclogenesis region is the most intense activity center on the maps. Genoa cyclone area is much weaker than the Icelandic low. Furthermore, winter cyclone activity is larger than CAI values in summer. The results suggest that a considerable intensification can be detected in cyclone activity in winter, especially, in the northwestern part of the domain. Further analysis of selected subregions would require different CAI-scale and dataset with finer spatial resolution. Figure 12. Changes of seasonal CAI values in the North-Atlantic-European region in winter (December-January-February) and summer (June-July-August). As part of the cyclone activity, frontal systems are investigated in the last part of the paper. We are focusing on the cold and warm fronts passing over the Carpathian Basin. In our analysis, fronts are defined using the temperature values of 850 hpa geopotential height of the ERA-40 database (Kallberg et al., 2004). On the base of the synoptic practical guides, we assume that if the temperature change during 12 hours is more than 3 C it can be considered as a front by definition. Figure 13 presents the frequency distribution of the frontal systems. The total number of cold and warm fronts during the entire 45 year period is 2202 (58%) and 1580 (42%), respectively. According to the results, not only the number of the cold fronts occurred in the region is larger than the number of warm fronts, but the corresponding temperature change is also significantly larger in case of the cold fronts.
12 Hidegfront Cold Warm Melegfront Gyakoriság Frequency Homérsékletváltozás Temperature change in 12 óra hours alatt ( C) ( C) Figure 13. Frequency distribution of temperature changes in case of cold and warm frontal systems, Annual, seasonal, and monthly trends of the number of cold and warm fronts are determined. Figure 14 shows the annual tendency analysis of the cold and warm frontal systems in the upper and the lower panel, respectively. Four-year moving average (MA) and the fitted linear trend using the least squares method are presented in the graphs. The annual number of cold fronts increased more than the warm fronts between 1957 and The linear trend coefficients significantly differ from zero using the statistical t-test at 0.05 level of significance. Seasonal trend analysis is illustrated in Figure 15, where the significant positive tendencies of the cold fronts in autumn and the warm fronts in winter are presented Cold fronts Linear trend: y = x Linear trend: 2005 Warm fronts y = x esetek trend Linear trend Frequency esetek Mtrend A (4 yr) Linear trend Figure 14. Annual tendency of cold and warm fronts (using criterion T>3 C), Linear trend coefficients are significant at 0.05 level.
13 Cold fronts in Autumn Linear trend: y = x Warm fronts in Winter Linear trend: y = x esetek trend Lineáris trend Frequency esetek MA trend (4 yr) Linear trend Figure 15. Seasonal tendency of cold fronts (in autumn) and warm fronts (in winter) using criterion T>3 C, Linear trend coefficients are significant at 0.05 level. Precipitation events associated with the frontal systems strongly affect the regional climate, therefore, at the end of the paper we present the results of the frontal precipitation analysis. Several thresholds (i.e., 0 mm, 1 mm, 5 mm, 10 mm) are defined, and then, the annual and the seasonal numbers of cold and warm frontal precipitation events exceeding these thresholds are determined during the period. Figures 16 and 17 present the annual trend analysis of the cold and warm frontal precipitation events, respectively. Annual number of cold frontal precipitation events increased in the last 45 years (the positive trend is significant in case of 0 mm, 1 mm, 5 mm thresholds at 0.05 level). The largest seasonal trend coefficients can be detected in spring and autumn. Annual number of warm frontal precipitation events decreased between 1957 and 2002 (the negative trend is significant in case of 1 mm, 5 mm, 10 mm thresholds at 0.05 level). The largest seasonal trend coefficients (in absolute value) can be detected in winter. Frequency MA (4 yr) Linear trend Figure 16. Annual tendency of cold frontal precipitation using criterion T>3 C, Linear trend coefficients are significant at 0.05 level except using the 10 mm threshold.
14 Frequency MA (4 yr) Linear trend Figure 17. Annual tendency of warm frontal precipitation using criterion T>3 C, Linear trend coefficients are significant at 0.05 level except using the 0 mm threshold. 4. Conclusions Changes in large-scale circulation have been analyzed for the North-Atlantic-European region for the 20th century. In order to accomplish this task, time series of MCP types ( ) and height fields of four geopotential levels of the ERA-40 database ( , with 2.5 horizontal resolution) have been used. Based on the presented results, the following conclusions can be drawn. 1. Frequency of many anticyclonic Hess-Brezowsky MCP types has decreased significantly in the last 120 years. Several other Hess-Brezowsky MCP types performed considerable increase between 1881 and Decreasing tendency of the annual mean geopotential height values has been detected in the Greenland/Iceland region between 1957 and 2002, while positive trend coefficients dominate the southern area of the North-Atlantic-European region with two centers, one in the Mediterranean subregion and the other in the Atlantic subregion. The largest seasonal trends can be detected in case of winter with similar spatial structure. 3. Less midlatitude cyclones occurred and cyclone tracks shifted more to the North in summer than in winter in the last 45 years. Furthermore, the number of cyclones increased considerably in the northwestern part of the domain in both seasons. 4. The Icelandic cyclogenesis region is the most intense cyclone activity center in the North- Atlantic-European region. Furthermore, considerable intensification has been detected in cyclone activity between 1957 and CAI values in winter are larger than in summer. 5. Annual number of both cold and warm frontal systems in the Carpathian Basin increased significantly during the period. 6. Cold frontal precipitation events increased in the region during the 45 years, especially in spring and autumn, while warm frontal precipitation events decreased, especially in winter. Acknowledgements. The authors thank ECMWF for producing and making available the ERA-40 reanalysis data. This paper is the written version of the presentation at the special session of ECAM conference organized in the frame of COST Action 733. Research leading to this paper has been supported by the Hungarian National Science Research Foundation under grants T , T , and T , also by the CHIOTTO project of the European Union Nr. 5 program under grant
15 EVK2-CT-2002/0163, and the Hungarian National Research Development Program under grants NKFP-3A/0006/2002, NKFP-3A/082/2004, and NKFP-6/079/2005. References Alpert P, Neeman BU, Shay-el Y Climatological analysis of Mediterranean cyclones using ECMWF data. Tellus 42A: Bartholy, J., Pongrácz, R., Pattantyús-Ábrahám, M European cyclone track analysis based on four geopotential fields of ECMWF ERA-40 datasets. Int. J. Climatology (in press) van Bebber WJ Die Zugstrassen der barometrischen Minima nach den Bahnenkarten der Deutschen Seewarte für den Zeitraum von Meteorol. Zeitschrift 8: Fraedrich K, Bach R, Naujokat G Single station climatology of Central European fronts: number, time, and precipitation statistics. Contr. Atmos. Phys. 59: Gibson JK, Kallberg P, Uppala S, Nomura A, Hernandez A, Serrano A ERA description. ECMWF Reanalysis Project Report Series No. 1., 77p. Hess P, Brezowsky H Katalog der Grosswetterlagen. Berichte Deutscher Wetterdienst Offenbach. 113 Bd 15. Hodges KI A general method for tracking analysis and its application to meteorological data. Mon. Wea. Rev. 122: IPCC, 2001: Climate Change 2001: The Scientific Basis. Contribution of Working Group I to the Third Assessment Report of the Intergovernmental Panel on Climate Change. (Houghton JT, Ding Y, Griggs DJ, Noguer M, van der Linden PJ, Dai X, Maskell K, Johnson CA, eds.) Cambridge University Press: Cambridge, U.K. and New York, NY, USA. 881pp. Kallberg P, Simmons A, Uppala S, Fuentes M The ERA-40 archive. ERA-40 Project Report Series No. 17. Key JR, Chan ACK Multidecadal global and regional trends in 1000 mb and 500 mb cyclone frequencies. Geophys. Res. Lett. 26: Klein W Principal tracks and mean frequencies of cyclones and anticyclones in the Northern hemisphere. Research Paper No. 40. U.S. Weather Bureau: Washington. Lamb HH British Isles weather types and a register of the daily sequence of circulation patterns, Geophys. Mem HMSO: London. Lambert SJ A cyclone climatology of the Canadian Climate Centre general circulation model. J. Climate 1: Serreze MC Climatological aspects of cyclone development and decay in the Arctic. Atmosphere-Ocean 33: Serreze MC, Carse F, Barry R Icelandic low cyclone activity: Climatological features, linkages with the NAO, and relationships with recent changes in the Northern Hemisphere circulation. J. Climate 10: Zhang X, Walsh JE, Zhang J, Bhatt US, Ikeda M Climatology and interannual variability of arctic cyclone activity: J Climate 17:
EUROPEAN CYCLONE TRACK ANALYSIS BASED ON ECMWF ERA-40 DATA SETS
 INTERNATIONAL JOURNAL OF CLIMATOLOGY Int. J. Climatol. 26: 1517 1527 (2006) Published online in Wiley InterScience (www.interscience.wiley.com).1392 EUROPEAN CYCLONE TRACK ANALYSIS BASED ON ECMWF ERA-40
University of East Anglia
 Figure : Differences (hpa) in NCEP minus UKMO MSLP in 99: annual (top panel), January (middle panel) and July (bottom panel). Figure : Comparison between the first two PCs of NCEP and observed MSLP (left)
Impacts of Climate Change on Autumn North Atlantic Wave Climate
 Impacts of Climate Change on Autumn North Atlantic Wave Climate Will Perrie, Lanli Guo, Zhenxia Long, Bash Toulany Fisheries and Oceans Canada, Bedford Institute of Oceanography, Dartmouth, NS Abstract
CENTRAL EUROPEAN BLOCKING ANTICYCLONES AND THE INFLUENCES IMPRINT OVER THE ROMANIA S CLIMATE
 DOI 10.1515/pesd-2016-0040 PESD, VOL. 10, no. 2, 2016 CENTRAL EUROPEAN BLOCKING ANTICYCLONES AND THE INFLUENCES IMPRINT OVER THE ROMANIA S CLIMATE Niță Andrei 1, Apostol Liviu 2 Keywords: anticyclones,
A Preliminary Climatology of Extratropical Transitions in the Southwest Indian Ocean
 A Preliminary Climatology of Extratropical Transitions in the Southwest Indian Ocean Kyle S. Griffin Department of Atmospheric and Environmental Sciences, University at Albany, State University of New
Atmospheric patterns for heavy rain events in the Balearic Islands
 Adv. Geosci., 12, 27 32, 2007 Author(s) 2007. This work is licensed under a Creative Commons License. Advances in Geosciences Atmospheric patterns for heavy rain events in the Balearic Islands A. Lana,
CUMULONIMBUS CLOUDS AND RELATED WEATHER PHENOMENA AT TÂRGU-MUREŞ, ROMANIA
 CUMULONIMBUS CLOUDS AND RELATED WEATHER PHENOMENA AT TÂRGU-MUREŞ, ROMANIA RUSZ OTTILIA 1 ABSTRACT. Cumulonimbus clouds and related weather phenomena at Târgu Mureş, Romania. Cumulonimbus (Cb) is a vertically
Romanian Contribution in Quantitative Precipitation Forecasts Project
 3 Working Group on Physical Aspects 29 Romanian Contribution in Quantitative Precipitation Forecasts Project Rodica Dumitrache, Victor Pescaru, Liliana Velea, Cosmin Barbu National Meteorological Administration,
SUPPLEMENTARY INFORMATION
 Intensification of Northern Hemisphere Subtropical Highs in a Warming Climate Wenhong Li, Laifang Li, Mingfang Ting, and Yimin Liu 1. Data and Methods The data used in this study consists of the atmospheric
APPENDIX B PHYSICAL BASELINE STUDY: NORTHEAST BAFFIN BAY 1
 APPENDIX B PHYSICAL BASELINE STUDY: NORTHEAST BAFFIN BAY 1 1 By David B. Fissel, Mar Martínez de Saavedra Álvarez, and Randy C. Kerr, ASL Environmental Sciences Inc. (Feb. 2012) West Greenland Seismic
Relationship between atmospheric circulation indices and climate variability in Estonia
 BOREAL ENVIRONMENT RESEARCH 7: 463 469 ISSN 1239-695 Helsinki 23 December 22 22 Relationship between atmospheric circulation indices and climate variability in Estonia Oliver Tomingas Department of Geography,
The Atmospheric Circulation
 The Atmospheric Circulation Vertical structure of the Atmosphere http://www.uwsp.edu/geo/faculty/ritter/geog101/textbook/atmosphere/atmospheric_structure.html The global heat engine [courtesy Kevin Trenberth,
SHORT COMMUNICATION EXPLORING THE RELATIONSHIP BETWEEN THE NORTH ATLANTIC OSCILLATION AND RAINFALL PATTERNS IN BARBADOS
 INTERNATIONAL JOURNAL OF CLIMATOLOGY Int. J. Climatol. 6: 89 87 (6) Published online in Wiley InterScience (www.interscience.wiley.com). DOI:./joc. SHORT COMMUNICATION EXPLORING THE RELATIONSHIP BETWEEN
Extremely cold weather events caused by arctic air mass and its synoptic situation in Finland from the year 1950 onwards
 Extremely cold weather events caused by arctic air mass and its synoptic situation in Finland from the year 1950 onwards Senior meteorologist Henri Nyman Finnish Meteorological Institute, Weather and Safety
THE IMPORTANCE OF CYCLONE FREQUENCIES IN AIR POLLUTION IN TURKEY
 THE IMPORTANCE OF CYCLONE FREQUENCIES IN AIR POLLUTION IN TURKEY Dr. Ali DENİZ Istanbul Technical University, Aeronautics and Astronautics Faculty, Department of Meteorology, 866, Maslak, İstanbul-TURKEY.
TEMPORAL FLUCTUATIONS IN HEAT WAVES AT PRAGUE KLEMENTINUM, THE CZECH REPUBLIC, FROM , AND THEIR RELATIONSHIPS TO ATMOSPHERIC CIRCULATION
 INTERNATIONAL JOURNAL OF CLIMATOLOGY Int. J. Climatol. 22: 33 50 (2002) DOI: 10.1002/joc.720 TEMPORAL FLUCTUATIONS IN HEAT WAVES AT PRAGUE KLEMENTINUM, THE CZECH REPUBLIC, FROM 1901 97, AND THEIR RELATIONSHIPS
J1.7 SOIL MOISTURE ATMOSPHERE INTERACTIONS DURING THE 2003 EUROPEAN SUMMER HEATWAVE
 J1.7 SOIL MOISTURE ATMOSPHERE INTERACTIONS DURING THE 2003 EUROPEAN SUMMER HEATWAVE E Fischer* (1), SI Seneviratne (1), D Lüthi (1), PL Vidale (2), and C Schär (1) 1 Institute for Atmospheric and Climate
On the remarkable Arctic winter in 2008/2009
 JOURNAL OF GEOPHYSICAL RESEARCH, VOL. 114,, doi:10.1029/2009jd012273, 2009 On the remarkable Arctic winter in 2008/2009 K. Labitzke 1 and M. Kunze 1 Received 17 April 2009; revised 11 June 2009; accepted
Effect of Synoptic Systems on the Variability of the North Atlantic Oscillation
 2894 M O N T H L Y W E A T H E R R E V I E W VOLUME 133 Effect of Synoptic Systems on the Variability of the North Atlantic Oscillation ULRIKE LÖPTIEN AND EBERHARD RUPRECHT Leibniz-Institute for Marine
Impacts of the April 2013 Mean trough over central North America
 Impacts of the April 2013 Mean trough over central North America By Richard H. Grumm National Weather Service State College, PA Abstract: The mean 500 hpa flow over North America featured a trough over
Extratropical transition of North Atlantic tropical cyclones in variable-resolution CAM5
 Extratropical transition of North Atlantic tropical cyclones in variable-resolution CAM5 Diana Thatcher, Christiane Jablonowski University of Michigan Colin Zarzycki National Center for Atmospheric Research
1. INTRODUCTION: 2. DATA AND METHODOLOGY:
 27th Conference on Hurricanes and Tropical Meteorology, 24-28 April 2006, Monterey, CA 3A.4 SUPERTYPHOON DALE (1996): A REMARKABLE STORM FROM BIRTH THROUGH EXTRATROPICAL TRANSITION TO EXPLOSIVE REINTENSIFICATION
MEDITERRANEAN CLIMATE OUTLOOK FORUM MEDCOF-10 Online Forum
 MEDITERRANEAN CLIMATE OUTLOOK FORUM MEDCOF-10 Online Forum MONITORING SUMMARY MEDCOF-10 for April 2018 Final Version Last update: 25 May 2018 Compiled by WMO RA VI RCC Toulouse Node on Long Range Forecasting
The North Atlantic Oscillation: Climatic Significance and Environmental Impact
 1 The North Atlantic Oscillation: Climatic Significance and Environmental Impact James W. Hurrell National Center for Atmospheric Research Climate and Global Dynamics Division, Climate Analysis Section
16C.6 Genesis of Atlantic tropical storms from African Easterly Waves a comparison of two contrasting years
 16C.6 Genesis of Atlantic tropical storms from African Easterly Waves a comparison of two contrasting years Susanna Hopsch 1 Department of Earth and Atmospheric Sciences, University at Albany, Albany,
Special blog on winter 2016/2017 retrospective can be found here -
 March 4, 2019 Special blog on winter 2016/2017 retrospective can be found here - http://www.aer.com/winter2017 Special blog on winter 2015/2016 retrospective can be found here - http://www.aer.com/winter2016
Changes in Frequency of Extreme Wind Events in the Arctic
 Changes in Frequency of Extreme Wind Events in the Arctic John E. Walsh Department of Atmospheric Sciences University of Illinois 105 S. Gregory Avenue Urbana, IL 61801 phone: (217) 333-7521 fax: (217)
The Impact of air-sea interaction on the extratropical transition of tropical cyclones
 The Impact of air-sea interaction on the extratropical transition of tropical cyclones Sarah Jones Institut für Meteorologie und Klimaforschung Universität Karlsruhe / Forschungszentrum Karlsruhe 1. Introduction
The role of teleconnections in extreme (high and low) precipitation events: The case of the Mediterranean region
 precipitation events: The case of the Mediterranean region") European Geosciences Union General Assembly 2013 Vienna, Austria, 7 12 April 2013 Session HS7.5/NP8.4: Hydroclimatic Stochastics The role of teleconnections in extreme (high and low) events: The case of
European Geosciences Union General Assembly 2013 Vienna, Austria, 7 12 April 2013 Session HS7.5/NP8.4: Hydroclimatic Stochastics The role of teleconnections in extreme (high and low) events: The case of
Polar Lows and Other High Latitude Weather Systems
 Polar Lows and Other High Latitude Weather Systems John Turner and Tom Bracegirdle British Antarctic Survey, Cambridge, UK (J.Turner@bas.ac.uk) 1. Introduction Polar lows are mesoscale (less than 1,000
FUTURE PROJECTIONS OF PRECIPITATION CHARACTERISTICS IN ASIA
 FUTURE PROJECTIONS OF PRECIPITATION CHARACTERISTICS IN ASIA AKIO KITOH, MASAHIRO HOSAKA, YUKIMASA ADACHI, KENJI KAMIGUCHI Meteorological Research Institute Tsukuba, Ibaraki 305-0052, Japan It is anticipated
Trends in Climate Teleconnections and Effects on the Midwest
 Trends in Climate Teleconnections and Effects on the Midwest Don Wuebbles Zachary Zobel Department of Atmospheric Sciences University of Illinois, Urbana November 11, 2015 Date Name of Meeting 1 Arctic
The impact of polar mesoscale storms on northeast Atlantic Ocean circulation
 The impact of polar mesoscale storms on northeast Atlantic Ocean circulation Influence of polar mesoscale storms on ocean circulation in the Nordic Seas Supplementary Methods and Discussion Atmospheric
Changes in Southern Hemisphere rainfall, circulation and weather systems
 19th International Congress on Modelling and Simulation, Perth, Australia, 12 16 December 2011 http://mssanz.org.au/modsim2011 Changes in Southern Hemisphere rainfall, circulation and weather systems Frederiksen,
NOTES AND CORRESPONDENCE. El Niño Southern Oscillation and North Atlantic Oscillation Control of Climate in Puerto Rico
 2713 NOTES AND CORRESPONDENCE El Niño Southern Oscillation and North Atlantic Oscillation Control of Climate in Puerto Rico BJÖRN A. MALMGREN Department of Earth Sciences, University of Göteborg, Goteborg,
What kind of stratospheric sudden warming propagates to the troposphere?
 What kind of stratospheric sudden warming propagates to the troposphere? Ken I. Nakagawa 1, and Koji Yamazaki 2 1 Sapporo District Meteorological Observatory, Japan Meteorological Agency Kita-2, Nishi-18,
Satellites, Weather and Climate Module??: Polar Vortex
 Satellites, Weather and Climate Module??: Polar Vortex SWAC Jan 2014 AKA Circumpolar Vortex Science or Hype? Will there be one this year? Today s objectives Pre and Post exams What is the Polar Vortex
HEIGHT-LATITUDE STRUCTURE OF PLANETARY WAVES IN THE STRATOSPHERE AND TROPOSPHERE. V. Guryanov, A. Fahrutdinova, S. Yurtaeva
 HEIGHT-LATITUDE STRUCTURE OF PLANETARY WAVES IN THE STRATOSPHERE AND TROPOSPHERE INTRODUCTION V. Guryanov, A. Fahrutdinova, S. Yurtaeva Kazan State University, Kazan, Russia When constructing empirical
Evidence for Weakening of Indian Summer Monsoon and SA CORDEX Results from RegCM
 Evidence for Weakening of Indian Summer Monsoon and SA CORDEX Results from RegCM S K Dash Centre for Atmospheric Sciences Indian Institute of Technology Delhi Based on a paper entitled Projected Seasonal
The ENSO s Effect on Eastern China Rainfall in the Following Early Summer
 ADVANCES IN ATMOSPHERIC SCIENCES, VOL. 26, NO. 2, 2009, 333 342 The ENSO s Effect on Eastern China Rainfall in the Following Early Summer LIN Zhongda ( ) andluriyu( F ) Center for Monsoon System Research,
5D.6 EASTERLY WAVE STRUCTURAL EVOLUTION OVER WEST AFRICA AND THE EAST ATLANTIC 1. INTRODUCTION 2. COMPOSITE GENERATION
 5D.6 EASTERLY WAVE STRUCTURAL EVOLUTION OVER WEST AFRICA AND THE EAST ATLANTIC Matthew A. Janiga* University at Albany, Albany, NY 1. INTRODUCTION African easterly waves (AEWs) are synoptic-scale disturbances
Katherine E. Lukens and E. Hugo Berbery. Acknowledgements: Kevin I. Hodges 1 and Matthew Hawcroft 2. University of Reading, Reading, Berkshire, UK
 Boreal Winter Storm Tracks and Related Precipitation in North America: A Potential Vorticity Perspective Katherine E. Lukens and E. Hugo Berbery Acknowledgements: Kevin I. Hodges 1 and Matthew Hawcroft
Possible Roles of Atlantic Circulations on the Weakening Indian Monsoon Rainfall ENSO Relationship
 2376 JOURNAL OF CLIMATE Possible Roles of Atlantic Circulations on the Weakening Indian Monsoon Rainfall ENSO Relationship C.-P. CHANG, PATRICK HARR, AND JIANHUA JU Department of Meteorology, Naval Postgraduate
Regional Climate Simulations with WRF Model
 WDS'3 Proceedings of Contributed Papers, Part III, 8 84, 23. ISBN 978-8-737852-8 MATFYZPRESS Regional Climate Simulations with WRF Model J. Karlický Charles University in Prague, Faculty of Mathematics
P1.20 AN ANALYSIS OF SYNOPTIC PATTERNS ASSOCIATED WITH STRONG NORTH TEXAS COLD FRONTS DURING THE COLD SEASON
 P1.20 AN ANALYSIS OF SYNOPTIC PATTERNS ASSOCIATED WITH STRONG NORTH TEXAS COLD FRONTS DURING THE 2005-06 COLD SEASON Stacie Hanes* and Gregory R. Patrick NOAA/NWS Weather Forecast Office Fort Worth, TX
Interannual Variability of the South Atlantic High and rainfall in Southeastern South America during summer months
 Interannual Variability of the South Atlantic High and rainfall in Southeastern South America during summer months Inés Camilloni 1, 2, Moira Doyle 1 and Vicente Barros 1, 3 1 Dto. Ciencias de la Atmósfera
General Circulation. Nili Harnik DEES, Lamont-Doherty Earth Observatory
 General Circulation Nili Harnik DEES, Lamont-Doherty Earth Observatory nili@ldeo.columbia.edu Latitudinal Radiation Imbalance The annual mean, averaged around latitude circles, of the balance between the
SEASONAL VARIABILITY AND PERSISTENCE IN TEMPERATURE SCENARIOS FOR ICELAND
 SEASONAL VARIABILITY AND PERSISTENCE IN TEMPERATURE SCENARIOS FOR ICELAND Haraldur Ólafsson 1,2 and Ólafur Rögnvaldsson 2,3 1 University of Iceland, Reykjavík, Iceland 2 Bergen School of Meteorology, Geophysical
TENDENCY ANALYSIS OF EXTREME CLIMATE INDICES WITH SPECIAL EMPHASIS ON AGRICULTURAL IMPACTS
 TENDENCY ANALYSIS OF EXTREME CLIMATE INDICES WITH SPECIAL EMPHASIS ON AGRICULTURAL IMPACTS R. Pongrácz and J. Bartholy Department of Meteorology, Eötvös Loránd University, Budapest, Hungary, prita@nimbus.elte.hu,
The Interdecadal Variation of the Western Pacific Subtropical High as Measured by 500 hpa Eddy Geopotential Height
 ATMOSPHERIC AND OCEANIC SCIENCE LETTERS, 2015, VOL. 8, NO. 6, 371 375 The Interdecadal Variation of the Western Pacific Subtropical High as Measured by 500 hpa Eddy Geopotential Height HUANG Yan-Yan and
2013 ATLANTIC HURRICANE SEASON OUTLOOK. June RMS Cat Response
 2013 ATLANTIC HURRICANE SEASON OUTLOOK June 2013 - RMS Cat Response Season Outlook At the start of the 2013 Atlantic hurricane season, which officially runs from June 1 to November 30, seasonal forecasts
Climate Forecast Applications Network (CFAN)
") Forecast of 2018 Atlantic Hurricane Activity April 5, 2018 Summary CFAN s inaugural April seasonal forecast for Atlantic tropical cyclone activity is based on systematic interactions among ENSO, stratospheric
Forecast of 2018 Atlantic Hurricane Activity April 5, 2018 Summary CFAN s inaugural April seasonal forecast for Atlantic tropical cyclone activity is based on systematic interactions among ENSO, stratospheric
Characteristics of Storm Tracks in JMA s Seasonal Forecast Model
 Characteristics of Storm Tracks in JMA s Seasonal Forecast Model Akihiko Shimpo 1 1 Climate Prediction Division, Japan Meteorological Agency, Japan Correspondence: ashimpo@naps.kishou.go.jp INTRODUCTION
Veretenenko S., Ogurtsov M.
 First VarSITI General Symposium Albena, Bulgaria 6-10 June 2016 Veretenenko S., Ogurtsov M. Ioffe Physical-Technical Institute Saint-Petersburg, Russia Correlation coefficient between globally averaged
STUDY OF FUTURE CLIMATIC VARIATIONS OF A TELECONNECTION PATTERN AFFECTING EASTERN MEDITERRANEAN
 Global NEST Journal, Vol 8, No 3, pp 195-3, 06 Copyright 06 Global NEST Printed in Greece. All rights reserved STUDY OF FUTURE CLIMATIC VARIATIONS OF A TELECONNECTION PATTERN AFFECTING EASTERN MEDITERRANEAN
An integrated assessment of the potential for change in storm activity over Europe: implications for forestry in the UK
 International Conference Wind Effects on Trees September 16-18, 3, University of Karlsruhe, Germany An integrated assessment of the potential for change in storm activity over Europe: implications for
First-Order Draft Chapter 3 IPCC WG1 Fourth Assessment Report
 0 Figure... Estimates of linear trends in significant wave height (cm decade - ) for the regions along the major ship routes for the global ocean for the period 0 00. Trends are shown only for the locations
Long-Term Trend and Decadal Variability of Persistence of Daily 500-mb Geopotential Height Anomalies during Boreal Winter
 OCTOBER 2009 D I N G A N D L I 3519 Long-Term Trend and Decadal Variability of Persistence of Daily 500-mb Geopotential Height Anomalies during Boreal Winter RUIQIANG DING AND JIANPING LI State Key Laboratory
The Predictability of Extratropical Storm Tracks and the. Sensitivity of their Prediction to the Observing System
 The Predictability of Extratropical Storm Tracks and the Sensitivity of their Prediction to the Observing System Lizzie S. R. Froude *, Lennart Bengtsson and Kevin I. Hodges Environmental Systems Science
The observed global warming of the lower atmosphere
 WATER AND CLIMATE CHANGE: CHANGES IN THE WATER CYCLE 3.1 3.1.6 Variability of European precipitation within industrial time CHRISTIAN-D. SCHÖNWIESE, SILKE TRÖMEL & REINHARD JANOSCHITZ SUMMARY: Precipitation
The feature of atmospheric circulation in the extremely warm winter 2006/2007
 The feature of atmospheric circulation in the extremely warm winter 2006/2007 Hiroshi Hasegawa 1, Yayoi Harada 1, Hiroshi Nakamigawa 1, Atsushi Goto 1 1 Climate Prediction Division, Japan Meteorological
2015: A YEAR IN REVIEW F.S. ANSLOW
 2015: A YEAR IN REVIEW F.S. ANSLOW 1 INTRODUCTION Recently, three of the major centres for global climate monitoring determined with high confidence that 2015 was the warmest year on record, globally.
Climatic study of the surface wind field and extreme winds over the Greek seas
 C O M E C A P 2 0 1 4 e - b o o k o f p r o c e e d i n g s v o l. 3 P a g e 283 Climatic study of the surface wind field and extreme winds over the Greek seas Vagenas C., Anagnostopoulou C., Tolika K.
3. Midlatitude Storm Tracks and the North Atlantic Oscillation
 3. Midlatitude Storm Tracks and the North Atlantic Oscillation Copyright 2006 Emily Shuckburgh, University of Cambridge. Not to be quoted or reproduced without permission. EFS 3/1 Review of key results
WINTER NIGHTTIME TEMPERATURE INVERSIONS AND THEIR RELATIONSHIP WITH THE SYNOPTIC-SCALE ATMOSPHERIC CIRCULATION
 Proceedings of the 14 th International Conference on Environmental Science and Technology Rhodes, Greece, 3-5 September 2015 WINTER NIGHTTIME TEMPERATURE INVERSIONS AND THEIR RELATIONSHIP WITH THE SYNOPTIC-SCALE
Eurasian Snow Cover Variability and Links with Stratosphere-Troposphere Coupling and Their Potential Use in Seasonal to Decadal Climate Predictions
 US National Oceanic and Atmospheric Administration Climate Test Bed Joint Seminar Series NCEP, Camp Springs, Maryland, 22 June 2011 Eurasian Snow Cover Variability and Links with Stratosphere-Troposphere
Global Atmospheric Circulation
 Global Atmospheric Circulation Polar Climatology & Climate Variability Lecture 11 Nov. 22, 2010 Global Atmospheric Circulation Global Atmospheric Circulation Global Atmospheric Circulation The Polar Vortex
Polar Lows and other High Latitude Weather Systems. John Turner and Tom Bracegirdle British Antarctic Survey Cambridge, UK
 Polar Lows and other High Latitude Weather Systems John Turner and Tom Bracegirdle British Antarctic Survey Cambridge, UK A mosaic of infra-red satellite imagery of the Antarctic and Southern Ocean on
Manfred A. Lange Energy, Environment and Water Research Center The Cyprus Institute. M. A. Lange 11/26/2008 1
 Manfred A. Lange Energy, Environment and Water Research Center The Cyprus Institute M. A. Lange 11/26/2008 1 Background and Introduction Mediterranean Climate Past and Current Conditions Tele-Connections
WIND TRENDS IN THE HIGHLANDS AND ISLANDS OF SCOTLAND AND THEIR RELATION TO THE NORTH ATLANTIC OSCILLATION. European Way, Southampton, SO14 3ZH, UK
 J 4A.11A WIND TRENDS IN THE HIGHLANDS AND ISLANDS OF SCOTLAND AND THEIR RELATION TO THE NORTH ATLANTIC OSCILLATION Gwenna G. Corbel a, *, John T. Allen b, Stuart W. Gibb a and David Woolf a a Environmental
particular regional weather extremes
 SUPPLEMENTARY INFORMATION DOI: 1.138/NCLIMATE2271 Amplified mid-latitude planetary waves favour particular regional weather extremes particular regional weather extremes James A Screen and Ian Simmonds
Synoptic forcing of precipitation in the Mackenzie and Yukon River basins
 INTERNATIONAL JOURNAL OF CLIMATOLOGY Int. J. Climatol. 0: 68 67 (00) Published online 8 April 009 in Wiley InterScience (www.interscience.wiley.com) DOI: 0.00/joc.96 Synoptic forcing of precipitation in
A Synoptic Climatology of Heavy Precipitation Events in California
 A Synoptic Climatology of Heavy Precipitation Events in California Alan Haynes Hydrometeorological Analysis and Support (HAS) Forecaster National Weather Service California-Nevada River Forecast Center
The Planetary Circulation System
 12 The Planetary Circulation System Learning Goals After studying this chapter, students should be able to: 1. describe and account for the global patterns of pressure, wind patterns and ocean currents
Department of Atmospheric Sciences, National Taiwan University, Taipei, Taiwan
 10A.4 TROPICAL CYCLONE FORMATIONS IN THE SOUTH CHINA SEA CHENG-SHANG LEE 1 AND YUNG-LAN LIN* 1, 2 1 Department of Atmospheric Sciences, National Taiwan University, Taipei, Taiwan 2 Taipei Aeronautic Meteorological
Climate Monitoring, Climate Watch Advisory. E. Rodríguez-Camino, AEMET
 Climate Monitoring, Climate Watch Advisory E. Rodríguez-Camino, AEMET WMO International Workshop on Global Review of Regional Climate Outlook Forums, Ecuador, 5 7 September 2017 Outline Introduction. Elements
Observational responses of stratospheric sudden warming to blocking highs and its feedbacks on the troposphere
 Article SPECIAL ISSUE: Extreme Climate in China April 2013 Vol.58 No.12: 1374 1384 doi: 10.1007/s11434-012-5505-4 SPECIAL TOPICS: Observational responses of stratospheric sudden warming to blocking highs
A Study of the Uncertainty in Future Caribbean Climate Using the PRECIS Regional Climate Model
 A Study of the Uncertainty in Future Caribbean Climate Using the PRECIS Regional Climate Model by Abel Centella and Arnoldo Bezanilla Institute of Meteorology, Cuba & Kenrick R. Leslie Caribbean Community
Trends in Wave Height and its Relation to Cyclone Activity in the NE Atlantic - Winter season (DJF) of
 of") Trends in Wave Height and its Relation to Cyclone Activity in the NE Atlantic - Winter season (DJF) of 1959-2002 Ole Johan Aarnes Norwegian Meteorological Institute Motivation Investigate trends in winter
Trends in Wave Height and its Relation to Cyclone Activity in the NE Atlantic - Winter season (DJF) of 1959-2002 Ole Johan Aarnes Norwegian Meteorological Institute Motivation Investigate trends in winter
 Page 1 of 5 Home research global climate enso effects Research Effects of El Niño on world weather Precipitation Temperature Tropical Cyclones El Niño affects the weather in large parts of the world. The
Cold months in a warming climate
 GEOPHYSICAL RESEARCH LETTERS, VOL. 38,, doi:10.1029/2011gl049758, 2011 Cold months in a warming climate Jouni Räisänen 1 and Jussi S. Ylhäisi 1 Received 21 September 2011; revised 18 October 2011; accepted
Vertical Structure of Atmosphere
 ATMOS 3110 Introduction to Atmospheric Sciences Distribution of atmospheric mass and gaseous constituents Because of the earth s gravitational field, the atmosphere exerts a downward forces on the earth
J5.3 Seasonal Variability over Southeast Brazil related to frontal systems behaviour in a climate simulation with the AGCM CPTEC/COLA.
 J5.3 Seasonal Variability over Southeast Brazil related to frontal systems behaviour in a climate simulation with the AGCM CPTEC/COLA. Iracema F.A.Cavalcanti and Luiz Henrique R. Coura Silva Centro de
AMIP-type horizontal resolution experiments with NorESM. Øyvind Seland, Trond Iversen, Ivar Seierstad
 AMWG meeting 10th-12th February 2014 AMIP-type horizontal resolution experiments with NorESM Øyvind Seland, Trond Iversen, Ivar Seierstad Motivation: For given a computer resource, ESMs need to balance
Introduction of climate monitoring and analysis products for one-month forecast
 Introduction of climate monitoring and analysis products for one-month forecast TCC Training Seminar on One-month Forecast on 13 November 2018 10:30 11:00 1 Typical flow of making one-month forecast Observed
Possible Change of Extratropical Cyclone Activity due to Enhanced Greenhouse Gases and Sulfate Aerosols Study with a High-Resolution AGCM
 2262 JOURNAL OF CLIMATE Possible Change of Extratropical Cyclone Activity due to Enhanced Greenhouse Gases and Sulfate Aerosols Study with a High-Resolution AGCM QUANZHEN GENG Frontier Research System
Monitoring and Prediction of Climate Extremes
 Monitoring and Prediction of Climate Extremes Stephen Baxter Meteorologist, Climate Prediction Center NOAA/NWS/NCEP Deicing and Stormwater Management Conference ACI-NA/A4A Arlington, VA May 19, 2017 What
Temporal change of some statistical characteristics of wind speed over the Great Hungarian Plain
 Theor. Appl. Climatol. 69, 69±79 (2001) 1 Department of Meteorology, University of Debrecen, Hungary 2 Department of Climatology and Landscape Ecology, University of Szeged, Hungary Temporal change of
ATMOSPHERIC MODELLING. GEOG/ENST 3331 Lecture 9 Ahrens: Chapter 13; A&B: Chapters 12 and 13
 ATMOSPHERIC MODELLING GEOG/ENST 3331 Lecture 9 Ahrens: Chapter 13; A&B: Chapters 12 and 13 Agenda for February 3 Assignment 3: Due on Friday Lecture Outline Numerical modelling Long-range forecasts Oscillations
Supplementary Figure 1: Latitudinal position of the August Northern Hemisphere
 Supplementary Figure : Latitudinal position of the August Northern Hemisphere Jet (NHJ). (same figure as Fig. but for.5 stdev anomalies in stead of stdev) Left wings of the violins represent the August
Tropical Cyclone Formation/Structure/Motion Studies
 Tropical Cyclone Formation/Structure/Motion Studies Patrick A. Harr Department of Meteorology Naval Postgraduate School Monterey, CA 93943-5114 phone: (831) 656-3787 fax: (831) 656-3061 email: paharr@nps.edu
The Influence of Intraseasonal Variations on Medium- to Extended-Range Weather Forecasts over South America
 486 MONTHLY WEATHER REVIEW The Influence of Intraseasonal Variations on Medium- to Extended-Range Weather Forecasts over South America CHARLES JONES Institute for Computational Earth System Science (ICESS),
P2.11 DOES THE ANTARCTIC OSCILLATION MODULATE TROPICAL CYCLONE ACTIVITY IN THE NORTHWESTERN PACIFIC
 P2.11 DOES THE ANTARCTIC OSCILLATION MODULATE TROPICAL CYCLONE ACTIVITY IN THE NORTHWESTERN PACIFIC Joo-Hong Kim*, Chang-Hoi Ho School of Earth and Environmental Sciences, Seoul National University, Korea
William M. Frank* and George S. Young The Pennsylvania State University, University Park, PA. 2. Data
 1C.1 THE 80 CYCLONES MYTH William M. Frank* and George S. Young The Pennsylvania State University, University Park, PA 1. Introduction myth: A traditional story accepted as history and/or fact. For the
ENSO Cycle: Recent Evolution, Current Status and Predictions. Update prepared by Climate Prediction Center / NCEP 23 April 2012
 ENSO Cycle: Recent Evolution, Current Status and Predictions Update prepared by Climate Prediction Center / NCEP 23 April 2012 Outline Overview Recent Evolution and Current Conditions Oceanic Niño Index
ENSO Cycle: Recent Evolution, Current Status and Predictions. Update prepared by Climate Prediction Center / NCEP 5 August 2013
 ENSO Cycle: Recent Evolution, Current Status and Predictions Update prepared by Climate Prediction Center / NCEP 5 August 2013 Outline Overview Recent Evolution and Current Conditions Oceanic Niño Index
Nerushev A.F., Barkhatov A.E. Research and Production Association "Typhoon" 4 Pobedy Street, , Obninsk, Kaluga Region, Russia.
 DETERMINATION OF ATMOSPHERIC CHARACTERISTICS IN THE ZONE OF ACTION OF EXTRA-TROPICAL CYCLONE XYNTHIA (FEBRUARY 2010) INFERRED FROM SATELLITE MEASUREMENT DATA Nerushev A.F., Barkhatov A.E. Research and
CPTEC and NCEP Model Forecast Drift and South America during the Southern Hemisphere Summer
 CPTEC and NCEP Model Forecast Drift and South America during the Southern Hemisphere Summer José Antonio Aravéquia 1 Pedro L. Silva Dias 2 (1) Center for Weather Forecasting and Climate Research National
A STUDY ON THE INTRA-ANNUAL VARIATION AND THE SPATIAL DISTRIBUTION OF PRECIPITATION AMOUNT AND DURATION OVER GREECE ON A 10 DAY BASIS
 INTERNATIONAL JOURNAL OF CLIMATOLOGY Int. J. Climatol. 23: 207 222 (2003) Published online in Wiley InterScience (www.interscience.wiley.com). DOI: 10.1002/joc.874 A STUDY ON THE INTRA-ANNUAL VARIATION
Analysis Links Pacific Decadal Variability to Drought and Streamflow in United States
 Page 1 of 8 Vol. 80, No. 51, December 21, 1999 Analysis Links Pacific Decadal Variability to Drought and Streamflow in United States Sumant Nigam, Mathew Barlow, and Ernesto H. Berbery For more information,