Tropical Intraseasonal Variability in Version 3 of the GFDL Atmosphere Model
|
|
|
- Molly Carson
- 5 years ago
- Views:
Transcription
1 Tropical Intraseasonal Variability in Version 3 of the GFDL Atmosphere Model James J. Benedict* and Eric D. Maloney Department of Atmospheric Science, Colorado State University, Fort Collins, CO Adam H. Sobel Department of Applied Mathematics and Department of Earth and Environmental Sciences, and Lamont-Doherty Earth Observatory Columbia University, New York, NY Dargan M. Frierson Department of Atmospheric Sciences, University of Washington, Seattle, WA Leo J. Donner Geophysical Fluid Dynamics Laboratory/NOAA, Princeton, NJ Submitted to: Journal of Climate 22 February June 2012 (revised) Corresponding author address: Jim Benedict, Department of Atmospheric Science, Colorado State University, Fort Collins, CO jim@atmos.colostate.edu 1
2 Abstract Tropical intraseasonal variability is examined in version 3 of the Geophysical Fluid Dynamics Laboratory Atmosphere Model (AM3). Compared to its predecessor AM2, AM3 uses a new treatment of deep and shallow cumulus convection and mesoscale clouds. The AM3 cumulus parameterization is a mass flux-based scheme but also, unlike that in AM2, incorporates subgrid-scale vertical velocities; these play a key role in cumulus microphysical processes. The AM3 convection scheme allows multiphase water substance produced in deep cumuli to be transported directly into mesoscale clouds, which strongly influence large-scale moisture and radiation fields. We examine four AM3 simulations, using a control model and three versions with different modifications to the deep convection scheme. In the control AM3, using a convective closure based on CAPE relaxation, both the MJO and Kelvin waves are weak compared to those in observations. By modifying the convective closure and trigger assumptions to inhibit deep cumuli, AM3 produces reasonable intraseasonal variability but a degraded mean state. MJO-like disturbances in the modified AM3 propagate eastward at roughly the observed speed in the Indian Ocean but up to twice the observed speed in the West Pacific. Distinct differences in intraseasonal convective organization and propagation exist among the modified AM3 versions. Differences in vertical diabatic heating profiles associated with the MJO are also found. The two AM3 versions with the strongest intraseasonal signals have a more prominent bottom-heavy heating profile leading the disturbance center and top-heavy heating profile following the disturbance. The more realistic heating structures are associated with an improved depiction of moisture convergence and intraseasonal convective organization in AM3. 2
3 Section 1. Introduction In the tropical atmosphere, variability on day time scales (hereafter, intraseasonal ) is dominated by the Madden-Julian Oscillation (MJO; Madden and Julian 1971). Kelvin and equatorial Rossby waves modify tropical precipitation and wind distributions on shorter timescales. In the Indo- Pacific region, these disturbances typically involve a coupling between moist convection and the largescale flow field. General circulation models (GCMs) use parameterizations to represent the bulk effects of these convective clouds on grid-scale heat, moisture, and momentum budgets. GCM simulations are often strongly sensitive to the choice of convective parameterization and parameter variations within a given parameterization scheme (e.g., Maloney and Hartmann 2001). The challenges of accurately simulating subgrid-scale clouds and the sensitivity to the convective parameterizations used have contributed to a poor depiction of intraseasonal convective systems in many GCMs (Slingo et al. 1996, Lin et al. 2006, Kim et al. 2009). In this study, we examine intraseasonal convective disturbances in version 3 of the Geophysical Fluid Dynamics Laboratory (GFDL) Atmosphere Model (AM3; Donner et al. 2011). For selected diagnostics, we also compare the AM3 results to those of its predecessor, AM2 (Anderson et al. 2004). Two important differences distinguish AM3 from AM2: (1) the AM3 deep convective parameterization utilizes plume momentum budgets to compute cumulus cell-scale updraft speeds, and (2) AM3 uses a separate parameterization to assess the impact of dynamically active mesoscale anvil clouds on the largescale heat and moisture budgets following Donner (1993). Vertical air motion within cumulus cells is closely linked to microphysical processes which in turn play a primary role in determining the rate of condensate formation in the cumulus cells. This condensate in cumuli is the dominant source of water substance for neighboring anvil clouds, which are a common feature of tropical convective systems and can significantly affect the local radiation budget (Houze 1982). Observational studies suggest that a 3
4 substantial portion (20-60%) of total tropical precipitation is associated with stratiform mesoscale cloud systems (Houze 1989, Schumacher and Houze 2003, Yuan and Houze 2010). Whereas conventional convective parameterizations treat only direct interactions between cumuli and their grid-scale environment, the AM3 scheme accounts for mesoscale circulations that modulate the exchange of water substance as well as the radiative, dynamic, and thermodynamic properties within the cloud-environment system. Aside from the changes to the deep convective parameterization mentioned above, the AM3 also implements advanced treatments of shallow convection, cloud-aerosol interactions, and stratospheretroposphere coupling relative to AM2. Full details of the standard AM3 simulations are provided in Donner et al. (2011), but here we highlight results relevant to this study. The AM3 parameterizations are tuned to produce an optimal mean state but some climatological biases remain, including excessive deep convection in the Indian Ocean and West Pacific regions. Tropical interannual variability is broadly consistent with observations (see Fig. 18 in Donner et al. 2011), but subseasonal features such as Kelvin waves, the MJO, and tropical cyclones are poorly simulated. Donner et al. (2011) indicate that modifications made to the convective closure and trigger assumptions improve aspects of intraseasonal convection but also increase mean state biases, a common trade-off found in most GCMs (e.g., Kim et al. 2011). We will examine additional details of this and other modified AM3 simulations in Section 3. A key linkage between parameterized convection and the depiction in GCMs of intraseasonal convective disturbances involves spatial structures of moistening and diabatic heating. In nature, convectively active regions often exhibit a top-heavy heating structure with a peak occurring between hpa (e.g., Yanai et al. 1973). In a time mean sense, this profile is known to result from the combined effects of deep convective, stratiform, and shallow convective heating (Houze 1982, Lin and Johnson 1996, Lau and Wu 2010). However, cloud systems evolve on hourly to intraseasonal time 4
5 scales with characteristic heating profiles during each phase of their life cycle. Lin et al. (2004) noted that the structure of maximum diabatic heating tilts westward with height for MJO disturbances, and that this tilt was associated with a progression of shallow to deep to stratiform cloud types. This westward tilt with height is a common feature of many organized tropical convective systems as discussed in numerous observational and theoretical studies (e.g., Moncrieff 1992, 2004; Kiladis et al. 2005). Lau and Wu (2010) used the Tropical Rainfall Measuring Mission (TRMM) Precipitation Radar to highlight the cumulus deepening and the transition to stratiform clouds during different MJO stages. A similar evolution in cloud populations and their associated heating structures is seen in many other convectively coupled equatorial waves (Kiladis et al. 2009). These heating structures can drive multi-scale circulations that broadly impact moisture availability, atmospheric stability, and thus the probability and characteristics of future convection. Numerous theories related to such feedbacks between convective heating and large-scale circulations have been proposed (e.g., Hayashi 1970, Emanuel 1987, Neelin et al. 1987, Wang 1988, Emanuel 1993), but an accurate, comprehensive model has yet to be established. Several modeling studies have investigated the relationships between heating structures and intraseasonal convection. It is clear that simulated intraseasonal convective systems are sensitive to the vertical structure of diabatic heating, but exactly what type of heating structure is most favorable for generating and sustaining such disturbances in GCMs remains under debate. Some studies show that simulated MJO intensity and propagation can be improved if the contributions to the total heating profile by grid-scale stratiform heating become larger (Fu and Wang 2009, Seo and Wang 2010). Others have emphasized bottom-heavy shallow convective heating rather than top-heavy stratiform heating as being a primary contributor to tropical intraseasonal disturbances (Wu 2003, Zhang and Mu 2005, Li et al. 2009, Jia et al. 2010). The balance of evidence suggests that each heating structure shallow, deep, and stratiform contributes in some way to the observed space-time patterns of intraseasonal convective dis- 5
6 turbances. Recent work has underscored the importance of three-dimensional heating in MJO simulations. In one GCM study, the vertical heating profile is artificially adjusted to determine the optimal profile required for a realistic MJO simulation (Lappen and Schumacher 2011). The authors conclude that an accurate representation of the horizontal variation in the shape of the vertical heating profile rather than a single representative vertical heating structure is critical to generate a realistic MJO. The prominent role that spatially varying vertical heating profiles play in the simulation of intraseasonal convective systems is also noted in reduced-complexity models (Khouider and Majda 2007; Kuang 2008; Khouider et al. 2011). The purpose of this study is to investigate changes to the depiction of intraseasonal convective systems that result from adjustments made to the deep convective parameterization scheme of the GFDL AM3. Our study complements the preliminary results of the AM3 simulation reported in Donner et al. (2011), but also examines in much greater detail the ability of modified versions of the model to produce realistic intraseasonal disturbances. Questions that we seek to address include: (1) What are the spacetime and spectral characteristics of intraseasonal variability in the control AM3, and how does this compare to previous results from AM2 simulations? (2) Can we tune the AM3 to produce more realistic intraseasonal variability by making convection more inhibited, as is typical of many other GCMs (e.g., Tokioka et al. 1988)? If so, does the tuning degrade the mean state as in many other GCMs (e.g., Kim et al. 2011)? (3) Do moisture convergence and vertical heating profiles associated with the simulated intraseasonal disturbances vary systematically across our ensemble of modified AM3 simulations? A description of the AM3, modifications made to its deep convection scheme, and the validation data sets used in this study are provided in Section 2. We review the simulation results in Section 3. In Section 4, we discuss the mechanisms associated with changes to the intraseasonal convective systems in the modified AM3 simulations. Concluding remarks are given in Section 5. 6
7 Section 2. Data and Model Description We analyze daily averaged output from two simulations of the AM2 and four simulations of the AM3 to investigate how modifying parameters of the deep convection scheme influences the tropical mean state and subseasonal variability. Each model is run for 11 years, with the first year of output discarded to account for model spin-up. All simulations are forced by observed long-term seasonal cycle monthly means in sea surface temperatures (SSTs) and sea ice concentrations 1. The AM2 simulations examined in this study are identical to those used by Sobel et al. (2010). AM2 utilizes a hydrostatic, finite-difference dynamical core run on a staggered Arakawa B horizontal grid with 2 latitude and 2.5 longitude resolution. A 24-level hybrid sigma-pressure coordinate system is used in the vertical, with 9 levels in the lowest 1.5 km of the atmosphere and a 3 hpa top. All moist convection is parameterized using a modified version of the relaxed Arakawa-Schubert scheme (RAS) of Moorthi and Suarez (1992). In this scheme, a spectrum of convective plumes exists, and each member has a characteristic lateral entrainment rate. Closure of the system of equations is based on a relaxation of the cloud work function [or, convective available potential energy (CAPE) for a non-entraining parcel] back to a reference value over a specified time scale (Arakawa and Schubert 1974, see Eq. 2 in Wilcox and Donner 2007). The version of RAS used in the AM2 simulations shown in this study does 1 AM2 is forced by the mean annual cycle derived from version 2 of NOAA s Optimum Interpolation SST and sea ice dataset (OI.v2; Reynolds et al. 2002), while AM3 uses the mean annual cycle from a data product that combines OI.v2 with version 1 of the Hadley Centre SST and sea ice dataset (Hurrell et al. 2008). For the purposes of our simulations, the two data sets are nearly identical. 7
8 not parameterize convective downdrafts. We note that this exclusion might hinder AM2 s ability to correctly simulate MJO disturbances, as evidenced in Maloney and Hartmann (2001) who found that intraseasonal variability increases (becomes more realistic) when convective downdrafts are activated in the RAS scheme. Convective momentum transport (CMT) is represented by including an additional term K cu γm C in the vertical momentum diffusion coefficient, where M C is the total cumulus mass flux and γ is a dimensionless constant whose value is chosen to minimize errors in mean and interannual tropical precipitation patterns while still being within a range suggested by cloud-resolving modeling studies (see Eq. 1 in Anderson et al. 2004). The downgradient diffusive treatment of CMT ensures numerical stability but strongly reduces tropical transient eddy activity relative to more conventional massflux-based formulations. This degradation is partially alleviated by suppressing deep convective formation for updrafts with lateral entrainment rates below a minimum threshold µ min = α/d, where α is a positive constant and D is the planetary boundary layer depth (Tokioka et al. 1988). In practice, α can be increased or reduced to make suppression of deep convection stronger or weaker, respectively (e.g., Hannah and Maloney 2011). Stronger suppression of convection in this manner tends to increase the overall rate of subseasonal transient eddies in the tropics (e.g., Tokioka et al. 1988; Kim et al. 2011). Additional details of the AM2 setup are provided in Anderson et al. (2004). Many features of AM3 differ markedly from those of AM2. AM3 has a finite volume dynamical core on a cubed-sphere horizontal grid. The use of a cubed-sphere configuration, characterized by horizontal grid cell sizes ranging from 163 km to 231 km, greatly increases computational efficiency. Although the standard version of AM3 used in Donner et al. (2011) uses 48 levels and an advanced treatment of chemistry, the version used here has 32 levels and implements a simplified chemistry scheme as described in Salzmann et al. (2010) to increase computational efficiency. This simplified AM3 has more stratospheric levels than the AM2, but fewer than the standard AM3 (Donner et al. 2011). 8
9 Compared to AM2, AM3 implements new parameterizations for shallow and deep convection. Shallow convection is represented by a modified version of the Bretherton et al. (2004) scheme (see Zhao et al. 2009). Interactions among vertically dominant deep convective cells 2, their associated horizontally dominant mesoscale anvil clouds, and the environment are parameterized as described in Donner (1993), Donner et al. (2001), and Wilcox and Donner (2007). Because anvil clouds can have a substantial impact on precipitation and the radiation budget in the Tropics (Houze 1982, Houze 1989), some representation of mesoscale cloud effects, even if simplified, is desirable. The Donner formulation incorporates both cumulus cell-scale vertical momentum dynamics as well as traditionally implemented mass fluxes to diagnose the multi-phase water budget of the cloud-environment system. Cumulus microphysical processes are strongly dependent on vertical velocity w within convective cells, and the condensate produced within these cells is the dominant source of water substance to neighboring anvil clouds. Cumulus-scale w is computed using a steady-state equation in which vertical advection of vertical momentum is changed by entrainment, condensate loading, and buoyancy (see Eq. 6 in Donner 1993). Figure 1 depicts graphically the vapor and condensate pathways handled by the Donner deep convection scheme, although we note that two simplified versions of the AM3 discussed below do not treat all pathways. Within each member of a spectrum of cumulus plumes with characteristic entrainment rates, condensate can be formed within convective updrafts (C U ), evaporated directly into the environment near the cloud top (E CE ), evaporated within convective downdrafts (E CD ), removed from the cloud as precipitation (R C ), or transferred to an adjacent anvil cloud as liquid (C A ) or vapor (Q mf ). Water substance supplied by cumulus cells to the dynamically active anvil cloud can undergo additional 2 A requirement for activation of the deep convection parameterization is that a rising air parcel must exhibit a pressure difference of at least 500 hpa between its level of free convection and level of neutral buoyancy. 9
10 phase changes: condensate can be formed within mesoscale updrafts (C MU ), removed as precipitation (R M ), or evaporated into the GCM grid-scale environment from mesoscale updrafts (E ME ) or downdrafts (E MD ). We note that E CD = 0 for two simplified versions of the AM3 (AM3-CTL and AM3-A). Numerous simplifying assumptions within the Donner scheme are a direct result of the limited number of observations describing the physical processes within the cloud systems. For example, the moisture budget partitioning outlined above uses a semi-empirical approach based upon a very limited number of tropical convective system case studies from Leary and Houze (1980). Vertical profiles of evaporation and sublimation within cumulus updrafts and downdrafts also remain highly uncertain. Further details of the AM3 model setup can be found in Donner et al. (2011) and references therein. We summarize key differences among the deep convection parameterizations in Table 1. The two AM2 simulations are identical except that the minimum entrainment parameter µ min is four times larger in the AM2-TOK simulation compared to the AM2 control run (AM2-CTL). A larger µ min essentially represents stronger suppression of the deepest convective plumes, which has been shown to improve the depiction of intraseasonal convective disturbances in some GCMs (Tokioka et al. 1988, Hannah and Maloney 2011). In the AM2, non-precipitated condensate is transferred to grid-scale stratiform clouds. Evaporation of some (or all) of the condensate is then possible depending on the environment and history of the stratiform clouds, which are prognostically parameterized. Additionally, a CAPE relaxation closure assumption is used as described previously (Eq. 2 in Wilcox and Donner 2007). Although the control AM3 simulation, AM3-CTL, uses the same type of closure assumption as in the AM2 runs, the convective parameterization is based upon the scheme of Donner (1993). In AM3- CTL, activation of deep cumulus formation is precluded if convective inhibition (CIN) is above 100 J kg -1. Additionally, a single CAPE threshold (1000 J kg -1 ) and relaxation time scale are applied to the entire cumulus ensemble, whereas in AM2 the thresholds are assigned by each sub-ensemble member. 10
11 The AM3-CTL is tuned such that 10% of non-precipitated condensate formed in convective updrafts is exposed to the environment and possibly evaporated while the remaining 90% is transported into mesoscale clouds. AM3-A uses condensate partitioning identical to AM3-CTL but with modified convective closure and trigger assumptions. The modified closure assumption (Zhang 2002) is based on the idea that CAPE fluctuations associated with free-tropospheric temperature fluctuations driven by largescale processes are balanced by changes in CAPE due to cumulus activity (see Eq. 3 in Wilcox and Donner 2007). In addition to the CAPE and CIN thresholds used to restrict deep convection activation in AM3-CTL, each AM3 experimental simulation employs a triggering mechanism requiring that timeintegrated low-level ascent must exceed a selected value in order for deep cumuli to form (see Eqs. 6 and 7 in Donner et al. 2001). AM3-B is identical to AM3-A but incorporates a new partitioning of cumulus condensate, where 25% of non-precipitated condensate is evaporated within convective downdrafts, 13% is evaporated directly into the environment, and 62% is entrained into mesoscale updrafts. The numerical values of the partitioning are based on observations of tropical convective systems as reported in Leary and Houze (1980). As a final modification in the experimental suite, AM3-C implements a more realistic CAPE calculation. For simplicity, CAPE is typically computed under the assumption that no mixing occurs between a rising parcel and its environment ( undilute CAPE). This zero-entrainment assumption results in an unrealistically weak sensitivity of CAPE to free-tropospheric humidity and temperature (Donner and Phillips 2003, Holloway and Neelin 2009). Versions 3 and 4 of NCAR s Community Climate System Model have shown a more realistic depiction of intraseasonal variability with the dilute CAPE approach (Neale et al. 2008, Subramanian et al. 2011, Zhou et al. 2012). In AM3-C, all CAPE calculations involve parcel-environment mixing whose strength is dependent on an assumed fractional entrainment rate µ = m -1 that is constant with height. This choice of µ is representative of weakly entraining deep convection (Romps 2010). In order to experiment with changes in 11
12 evaporation from convective cells and CAPE relaxation, AM3-B and AM3-C use a cloud model with higher vertical resolution in the deep convection parameterization, which has been coded to allow for these experiments 3. The changes in the parameterization for deep cumulus convection associated with the higher-resolution cloud model are summarized in Section 3e of Donner et al. (2011). In addition, the least-entraining member of the cumulus ensembles in AM3-B and AM3-C occurs only 45% as frequently as in AM3-A and AM3-CTL, with an entrainment coefficient 54% larger. We use several data sources for validation of our results. Two types of comparisons are conducted: (a) long-term climatological comparisons, and (b) comparisons of intraseasonal convective disturbances. Because the AM simulations are forced by ~ seasonal cycle SSTs, we compare climatologies of simulated precipitation and 850 hpa zonal wind with mean Global Precipitation Climatology Project (GPCP; Adler et al. 2003) rainfall and ECMWF Reanalysis-Interim (hereafter abbreviated ERAI ; Berrisford et al. 2009) winds, respectively. The statistical behavior and physical structure of intraseasonal convective disturbances simulated by the AM2 and AM3 are compared to several validation data sets that span the time window. Although this validation period is mostly outside of the window used to construct the mean seasonal cycle SSTs that drive the AM simulations, it does allow us to utilize daily gridded precipitation products from the Tropical Rainfall Measuring Mission (TRMM) that are available only after late The time window exhibits a slightly stronger El Niño SST pattern compared to the 3 In Donner (1993), the cumulus cloud model (cf., Eqs. (5)-(7) therein) is solved on its own vertical grid (10 hpa resolution) to better capture the variations with height of the cumulus properties. The more computationally efficient version of the parameterization used in AM3, which instead uses the same vertical grid as AM3, was coded such that these experiments could more easily be done using the higher resolution Donner (1993) version. 12
13 window (not shown), but the differences are not substantial and we believe that observed intraseasonal disturbances sampled from the window are representative of the MJO. Total precipitation for the period is taken from the TRMM 3B42 version 6 product, which blends space-borne microwave and infrared retrievals and also scales the resulting 3-hr precipitation estimates to be consistent with monthly rain gauge measurements (Huffman et al. 2007). OLR data are derived from NOAA s suite of polar orbiting satellites (Liebmann and Smith 1996). All remaining dynamic and thermodynamic variables are taken from ERAI. For a uniform comparison, all data are daily averaged, linearly interpolated to a 2.5 horizontal grid, and resampled to the 27 ERAI standard pressure levels Section 3. Results a. Global energy budget We examine the net energy budget at the Earth s surface (SFC) and atmosphere top (TOA) for observations and the AM simulations in Table 2. Only small differences in the net surface longwave and sensible heat fluxes are found between the different AM versions. Modifications of AM convective parameterizations examined in this study have a larger impact on net surface shortwave and latent heat fluxes. For example, globally averaged surface shortwave flux increases (becomes more negative, indicating a larger flux into the surface) but is partially compensated by an increase in latent heat flux. At the atmosphere top, the modified versions of the AM3 have enhanced net shortwave that is mostly offset by increased OLR. With the exception of AM3-B, net energy budget residuals at the SFC and TOA are less than 4 W m 2. All AM versions examined indicate net atmospheric column energy budget residuals less than about 0.1 W m 2. 13
14 b. Boreal winter means Observed intraseasonal convective disturbances are influenced by the climatological state in which they exist (e.g., Hendon and Salby 1994). A review of many GCM simulations reveals that models with excessive mean precipitation in the equatorial West Pacific often generate larger intraseasonal precipitation variability (Slingo et al. 1996, Kim et al. 2011). Additionally, several GCM experiments indicate a link between the accurate depiction of tropical time-mean zonal winds and realistic MJO eastward propagation (Inness et al. 2003, Sperber at al. 2005). Figure 2 illustrates climatological boreal winter (November-April) precipitation for the 20-year GPCP data set (Fig. 2a) as well as the biases for all AM simulations (panels b-g). The AM2 and AM3 overestimate globally averaged annual precipitation by about 10-20%. In the boreal winter, these biases are largest in the western Indian and Pacific Ocean basins, the Pacific intertropical convergence zone (ITCZ), and the South American west coast. A weak dry bias is noted near and west of Java in most AM simulations examined. In AM3-CTL, AM3-A, and AM3-C, a dry bias also appears in the equatorial West Pacific. Recent analyses of global energy balances and cloud and aerosol properties based on the CALIPSO, CloudSat, and MODIS satellites indicate that GPCP global mean precipitation could be biased low. Kato et al. (2011) show net surface irradiances consistent with global mean precipitation 15% to 20% more than GPCP and still within estimated GPCP uncertainty (their Fig. 15). Accordingly, the precipitation overestimates relative to GPCP in AM2 and AM3, which increase in the modified AM3 versions examined in this study, may not be consequential. A comparison of climatological boreal winter 850 hpa zonal winds (hereafter, U850 ) between ERAI and the 10-yr AM simulations (Fig. 3) indicates that AM2-CTL and AM3-CTL are able to reproduce the strip of equatorial low-level westerlies across the Indian Ocean, but that this region 14
15 does not extend far enough into the West Pacific. For example, U850 westerlies extend to 175 E in ERAI but only to 135 E and 150 E in the AM3-CTL and AM2-CTL, respectively. The modified versions of the AM2 and AM3 tend to improve the eastward extension of low-level westerlies (e.g., to 160 E in AM2-TOK and 155 E in AM3-C) but also underestimate their strength over the eastern Indian Ocean, where magnitudes drop to less than 1 m s 1 compared to 3-4 m s 1 in ERAI. In the extreme case, AM3-B actually produces U850 easterlies of ~0.5 m s 1 over the eastern Indian Ocean (Fig. 3f). For all AM simulations, low-level boreal winter mean easterlies are too strong across southern Asia, the subtropical Pacific, and Central America. Figure 4 shows boreal winter mean vertical profiles of relative humidity between E for ERAI and the humidity differences between each AM simulation and ERAI. Although only relative humidity profiles are displayed here, comments on other variables are included in this discussion. As documented in previous studies, the cool-troposphere and warm-stratosphere temperature biases in the AM2-CTL are reduced in the AM3-CTL (see middle column of Table 3; Anderson et al. 2004, Donner et al. 2011). Cool biases of 2-4K in the middle to upper troposphere of the climatological deep convecting region (10 S-5 N, E) are evident in the AM2-TOK and all modified AM3 simulations, however, while tropical boundary layer temperatures are within a few tenths of a degree from the values indicated by ERAI (Table 3). Zero (for AM3) or weakly positive (for AM2) biases in boundary layer relative humidity are noted in Fig. 4. A moist bias above 500 hpa in AM3-CTL (Fig. 4d) is strongly reduced and even reverses sign in the modified AM3 versions. For example, Fig. 4g shows relative humidity values that are nearly 20% lower than ERAI (Fig. 4a) in the equatorial mid-troposphere. The cool and dry biases in the modified AM3 are likely linked to deep convection suppression that results from the changes made to the convective parameterization. Regarding vertical profiles of convective heating Q 1 (see Eq. 1 from Lin and Johnson 1996) using identical space-time averaging as in Fig. 4, the 15
16 levels and magnitudes of maximum heating among the reanalysis and AM simulations are qualitatively similar 4. One exception is that the maximum of November-April mean heating shifts from the Northern Hemisphere (5 N) in AM3-CTL to the Southern Hemisphere (2.5 S) in all modified versions of AM3 (not shown). All AM simulations tend to overestimate heating and rising motion north of the Equator and underestimate heating south of the Equator during boreal winter. A persistent and unrealistic secondary maximum of convective heating near 125 hpa is also noted in the AM within 10 of the Equator (not shown) c. Zonal wavenumber-frequency spectra Decomposing a total field into its zonal wavenumber and frequency components allows a succinct view of tropical wave activity. We compute such spectra for the AM2 and AM3 output data using the methods of Wheeler and Kiladis (1999). Figure 5 depicts power spectra of the symmetric component of tropical precipitation for observations and a selection of AM simulations. Panels a-f each consist of a pair of plots showing the base-10 logarithm of the summation of spectral power from 15 S-15 N ( raw spectrum; top) and the raw spectrum divided by a smoothed background spectrum ( significant spectrum; bottom). Negative zonal wavenumbers are associated with disturbances that propagate westward, positive wavenumbers with those that propagate eastward. Figure 6 shows the same spectra as Fig. 5 but zoomed into the MJO spectral region. Relative to the AM2-CTL (not shown), AM2-TOK exhibits a shift of the maximum intraseasonal power from westward- to eastward-propagating disturbances but continues to lack Kelvin wave activity that is prevalent in nature (Fig. 5a). As in AM2-TOK, previ- 4 The accuracy of computing the pressure level of peak convective heating is complicated by the model s vertical resolution in the mid-troposphere. Approximate layer-midpoint pressures in this area are: 392, 461, 532, and 600 hpa. 16
17 ous modeling studies have also reported that MJO variability generally becomes more realistic through the use of stronger moisture triggers more stringent requirements for high humidity to be present in some layer in order for parameterized deep convection to occur in the deep convection parameterization (e.g., Lin et al. 2008). Stronger triggers were found to increase the contributions of large-scale condensation, making model convection more sensitive to environmental moisture. Lin et al. (2008) attribute the slower and more intense disturbances to a reduction in gross moist stability, as was demonstrated in earlier studies using an idealized moist GCM (Frierson 2007). The modifications made to the AM3 convective parameterization generally have a positive impact on the depiction of tropical precipitation variability relative to the control simulation, at the expense of a degraded mean state as seen in Fig. 2 and noted in Donner et al. (2011). Implementation of a modified convective closure (Zhang 2002) and trigger (Donner et al. 2001) dramatically improves precipitation variability associated with Kelvin waves, the MJO, inertio-gravity waves (e.g., Figs. 5d and 6d), and mixed Rossby-gravity waves (not shown) compared to AM3-CTL (Fig. 5c). Consistent with Fig. 5, maps of variance of MJO-filtered precipitation (not shown) show a marked improvement for the modified AM3 compared to AM3-CTL despite an overestimation of variability in the Northern Hemisphere ITCZ. As in the case of AM2, the peak in intraseasonal power shifts from a westward to eastward propagation preference in AM3 when a convective parameterization that suppresses deep cumuli is implemented. In the antisymmetric precipitation spectra (not shown), modified AM3 versions have improved (larger) power in the MJO region but the signal-to-noise ratio is not significant. Despite these improvements, several differences between the observed and modified AM3 precipitation spectra are evident. Overall, total variance is overestimated in the modified versions of AM3, consistent with the findings of Kim et al. (2011). Raw power for westward-propagating disturbances on subseasonal time scales (~6-90 days) is overestimated as well. The power within the MJO spectral region (zonal wavenumbers +1 to 17
18 , periods days) is also moderately overestimated and exhibits a maximum closer to a day period compared to the observed ~45-day period (Fig. 6; see Table 4). Additionally, the significant spectra show that Kelvin wave power shifts to smaller equivalent depths (slower phase speeds) and lower frequencies in the AM3 simulations that incorporate more stringent convective triggers (Fig. 5d-e), in agreement with Frierson et al. (2011). In AM3-C, low-frequency eastward-propagating disturbances resemble convectively coupled Kelvin waves rather than the MJO, as is shown here in Figs. 5 and 6 and later in Fig. 8. The ability of AM3-A to simulate the combination of equatorial Rossby and Kelvin waves and MJO disturbances makes it an appealing testbed for future studies of tropical intraseasonal variability. Recent work by Roundy (2012a,b) suggests that in nature there is a smooth transition of spectral power between the MJO and Kelvin bands in regions of climatological low-level westerlies, in contrast to the spectral gap that arises within the dominant easterly trade regime. In the modified AM3, Kelvin power shifts to lower frequencies and smaller equivalent depths (slower phase speeds) and the gap between MJO and Kelvin spectral peaks is less noticeable, particularly for AM3-C. However, the lowlevel westerlies the presence of which contribute to the smooth MJO-Kelvin transition in Roundy (2012a) are weaker in the modified AM3 compared to AM3-CTL (cf. Fig. 3), and the smooth MJO- Kelvin transition follows the h=12m shallow water equivalent depth line rather than h=5m as in Roundy (2012a). We present zonal wavenumber-frequency spectra of U850 for ERAI, AM2-TOK, and AM3-C in Figures 7a-c, respectively. Both the AM2 and AM3 generate zonal wind variability associated with equatorial Rossby and Kelvin waves and the MJO, but several biases exist. AM2-CTL and AM3-CTL underestimate power for low-frequency Kelvin waves and the MJO (not shown). All AM simulations overestimate zonal wind variability in the spectral area where high-frequency Kelvin waves merge with 18
19 eastward inertia-gravity waves. AM2-TOK produces Kelvin waves with much higher phase speeds (larger equivalent depths) relative to ERAI, likely due to the absence of sufficient convective coupling (cf. Fig. 7a,b). A persistent bias of the AM3 is the enhanced zonal wind variability of low-frequency Kelvin waves that is evident when the background spectrum is removed (bottom plot of Fig. 7c). The clear separation of zonal wind spectral power between the MJO and low-frequency Kelvin waves near a 16-day period in ERAI (Fig. 7a) is seen in AM2-TOK (Fig. 7b) but not in any of the AM3 simulations (e.g., Fig. 7c; AM3-A and AM3-B U850 spectra are qualitatively similar to AM3-C and so are omitted from Fig. 7). The absence of an MJO-Kelvin spectral gap in U850 occurs despite no enhancement of climatological low-level westerlies over the Indo-Pacific region in the AM3 compared to AM2 (see Roundy 2012a). Modified versions of the AM3 do, however, produce slower and more realistic Kelvin wave phase speeds, suggesting an improvement in the coupling between tropical convection and dynamics in AM3. A reduction in Kelvin wave phase speed is noted when the dilute CAPE approximation is implemented in the AM3, compared to the non-dilute CAPE case. The dilute CAPE approach is assumed to represent a more inhibiting convective trigger in that, relative to the undiluted CAPE case, more instability is required to reach the CAPE threshold for deep convection (1000 J kg -1 ). Our findings support the conclusions of Frierson (2007) and Frierson et al. (2011), who showed that slower Kelvin waves developed with more inhibiting convective triggers due to a reduction in gross moist stability d. Lag correlation We present lag correlations between rainfall and U850 in Figure 8. To construct these plots, we first apply a day bandpass filter to anomalous precipitation and U850, where the anomaly is a departure from the smoothed calendar-day mean at each grid point. The data are then latitudinally averaged between 15 S-15 N. We correlate the timeseries of precipitation at either 90 E or 150 E (left and 19
20 right columns of Fig. 8, respectively) with U850 over a range of time lags and longitudes. Results from the AM2-CTL and AM3-CTL are not shown due to the inability of those models to produce realistic eastward-propagating intraseasonal convection. Among the modified AM simulations shown, the coupling between rainfall (which is approximately proportional to the vertically integrated diabatic heating) and U850 (which we take to be largely a dynamical response to the diabatic heating) is stronger in the AM3-A and AM3-C. Although AM2-TOK produces realistic phase speeds for disturbances in the West Pacific, it has difficulty depicting a strong signal in the Indian Ocean (cf. Figs. 8c,d). The modified AM2 and AM3 simulations tend to have a stationary or westward-moving U850 signal to the west of the regression base point at 90 E (Fig. 8, left column), in contrast to reanalysis. The signal generated by AM3-A in the Indian Ocean (Fig. 8e) suggests that this model is able to simulate MJO phase speeds in that region better than AM3-B and AM3-C. However, a general tendency exists for disturbances in the modified AM3 simulations to propagate too quickly, particularly when deep convection is moving across the West Pacific region. For example, estimated phase speeds in the West Pacific are about 5 m s 1 in AM2-TOK but closer to 11 m s 1 in AM3-C (see Table 4). This rapid propagation of convective disturbances in the modified AM3 may be partially attributed to the use of prescribed SSTs in the model. More realistic air-sea interactions, even in an idealized framework, have been shown to reduce the phase speed and enhance organization of the MJO in some GCMs (Zhang et al. 2006). The faster speeds in the AM3-C are consistent with the poorly distinguished separation between the MJO and Kelvin spectral peaks in Fig. 6f and 7c and suggest that, particularly in the Pacific, the disturbances produced by the modified AM3 versions have characteristics more reminiscent of low-frequency convectively coupled Kelvin waves (Straub et al. 2010). This assertion is supported by noting that, in the modified AM3, the pattern of low-level zonal wind anomalies differs from the observed MJO pattern in the Pacific (Fig. 8b) such that a negative correlation exists between intraseasonal rainfall and U850, and peak low-level east- 20
21 erlies occur only a few days before the precipitation maximum (Fig. 8f,h,j). This structure is more con- sistent with observed convectively coupled Kelvin waves (Wheeler et al. 2000) than with the MJO (Ki- ladis et al. 2005, Benedict and Randall 2007) e. Lag regression We present longitudinal cross sections of specific humidity for ERAI and several AM simulations in Fig. 9. Anomalous specific humidity is linearly regressed onto a standardized version of the precipitation index defined in Section 3d and then averaged between 15 S-15 N. Plotted values represent humidity anomalies associated with a one standard deviation change in the precipitation index at zero time lag. All modified AM versions underpredict the longitudinal extent and maximum value of positive humidity anomalies relative to ERAI. The longitudinal structure of moisture appears to be strongly associated with the ability of the AM to realistically simulate eastward propagation of intraseasonal convective systems, as seen in Fig. 8. In particular, the models that perform best at producing these disturbances (Figs. 9d, e, i, and j) show some evidence of shallow moistening that leads deep moistening. Low-level moistening leading deep moistening is apparent in the ERAI results (Figs. 9a,b) and in previous reanalysis- and radiosonde-based studies of the observed MJO (Kiladis et al. 2005, Kemball- Cook and Weare 2001) and other convectively coupled equatorial waves (Kiladis et al. 2009). Regression cross sections of convective heating Q 1 for ERAI and modified AM3 versions are shown in Fig. 10. We use a precipitation index based at 120 E and a 5 S-5 N latitude band to best display the vertically tilted heating profile in ERAI (Fig. 10a) 5. Although the overall width of positive heating is qualitatively correct in the AM3, all simulations produce a deep heating core that is too narrow and intense (by about 10-20%) compared to ERAI. Additionally, the vertical gradient of lower- 5 The results shown are qualitatively consistent with those found using a 10 S-0 latitude band. 21
22 tropospheric heating is lessened during peak rainfall in the AM3 such that large positive heating extends closer to the surface. This suggests an overabundance of shallow cumuli and congesti when rainfall is most intense in the modified versions of AM3. A clear vertical tilt characterized by successive shallow, deep, and stratiform heating is evident in observations (Lin et al. 2004; Fig 10a). AM3-A and AM3-C roughly capture the signature of shallow heating leading deep and stratiform heating, but AM3-B produces excessively deep heating both before and after peak rainfall. We further discuss these heating and moisture structures and their potential ties to convective organization next Section 4. Discussion Salient features and biases of the AM simulations are summarized in Table 4. The results discussed in Section 3 indicate that an improved depiction of eastward-propagating intraseasonal disturbances is achieved when mechanisms that suppress deep convection are implemented in the AM3. This GCM behavior is not unique to the GFDL AM and is documented extensively in the modeling literature (e.g., Tokioka et al. 1988, Hannah and Maloney 2011, Kim et al. 2011). The improvements made to convectively coupled Kelvin waves and the MJO come at the cost of a degraded mean state that includes a drying and cooling of the tropical troposphere and a possible overestimation of equatorial total precipitation. Additionally, phase speeds of the AM3-simulated eastward-propagating convective systems are faster than the observed MJO phase speed, particularly for disturbances in the West Pacific region (see Table 4). Despite these deficiencies, the AM3 simulations provide new and useful information that may contribute to a better understanding of the physical processes associated with intraseasonal convective systems. Our preliminary examination of the modified AM3 suggests a link between the degree of organization of intraseasonal disturbances and their corresponding heating and moisture structures (Figs. 9 22
23 and 10). In this section, we investigate in greater detail how differences in these structures might impact the intraseasonal convective signals seen in the AM3. Some GCM studies show that MJO simulation can be improved if the fraction of stratiform (grid-scale) to total precipitation is increased (Fu and Wang 2009, Seo and Wang 2010). In these studies, MJO-like disturbances become much weaker when turbulent entrainment and detrainment along the edges of either deep or shallow convective plumes are set to zero [i.e., E (1) u = D (1) u = 0 in Eq. 12 of Tiedtke (1989)]. The authors assert that detrainment from convective clouds moistens the grid-scale environment and promotes grid-scale precipitation. The results of Fu and Wang (2009) emphasize the direct interaction between grid-scale precipitation heating and low-frequency disturbances, and their explanation of more vigorous MJO events invokes stratiform instability arguments (Mapes 2000, Kuang 2008). To investigate the applicability of this hypothesis to the AM3, we present longitudinal cross sections of boreal winter mean total precipitation (Fig. 11a) and large-scale 6 precipitation as a percentage of total precipitation (Fig. 11b). In both AM2 and AM3, modifications that suppress deep convection and increase the percentage of time-mean grid-scale precipitation (Fig. 11b) are associated with enhanced intraseasonal variability (cf. Fig. 6). Returning to Fig. 4, AM3-B is drier than AM3-A and AM3-C above 700 hpa but has equal or slightly higher humidity below 700 hpa. This is qualitatively consistent with Fig. 8a of Fu and Wang (2009) and suggests that, in a comparison of AM3 simulations with identical convective closure and trigger assumptions, a drier mid-troposphere is associated with weaker intraseasonal disturbances. Importantly, however, simply increasing the percentage of time-mean gridscale precipitation does not necessarily improve intraseasonal convective organization in the AM3. Fig- 6 Large-scale precipitation reported in AM3 is from grid-scale stratiform clouds only and does not include contributions from mesoscale anvils, so a direct comparison to observed percentages of stratiform to total precipitation (e.g., Schumacher and Houze 2003) is not recommended. 23
24 ure 8 indicates that AM3-A and AM3-C have more robust and coherent signals of intraseasonal convective disturbances compared to AM3-B despite the fact that percentages of grid-scale precipitation, at least in the time-mean, are larger in AM3-B (Fig. 11b). We also examined the behavior of grid-scale precipitation fraction in an intraseasonal context. To do this, we produced plots of anomalous daily grid-scale rainfall fraction regressed onto an MJO total precipitation index at various longitudes between 60 E-180 E. These results (not shown) agree with those depicted in Fig. 11b and indicate a greater gridscale rainfall fraction in AM3-B compared to AM3-A or AM3-C. Additional work is needed to clarify the interactions among humidity, grid-scale precipitation, and the depiction of intraseasonal disturbances in the AM3. We further investigate the link between convection and large-scale circulations by examining Indo-Pacific boreal winter mean convective mass fluxes that are output directly from the AM3 convective parameterizations (i.e., are not computed using grid-scale vertical velocities; Fig. 12). Our modifications to the convective closure and trigger assumptions strongly reduce upward mass fluxes by deep convective cells (second row of Fig. 12). Upward mass fluxes within mesoscale anvils are also reduced in step with the weakened deep cumuli because these cumuli act as a main source of water substance for the anvil clouds. In response to the suppressed deep convection, activity from the shallow convective scheme increases in the lower troposphere and expands upward (top row of Fig. 12). Shallow convection is particularly enhanced in AM3-A and AM3-C relative to AM3-B. We note that the shallow convection scheme is that of a highly entraining plume, where the cloud top is a function of plume buoyancy. As such, modifications applied to the AM3 that limit the ability of deep convection to reduce instability ultimately result in stronger and deeper plumes produced by the shallow convection parameterization. The interplay between stratiform (grid-scale) and shallow convective activity in the AM3 is evident in a comparison of boreal winter mean rainfall associated with large-scale and shallow convective 24
25 processes (not shown). In the AM3 simulations with robust intraseasonal variability (AM3-A and AM3- C), time-mean shallow convection increases as grid-scale precipitation decreases. The opposite behavior occurs in the AM3 version with weaker intraseasonal variability (AM3-B). Shallow convective activity may be stronger in a time-mean sense in the AM3-A and AM3-C simulations, but are these differences in diabatic heating manifested on intraseasonal scales as well? Figure 13 depicts the vertical structure of the effective heat source, Q 1 (Yanai et al. 1973), taken from the linear regressions of Fig. 10 and averaged over selected longitude ranges to capture the dominant heating signatures to the west and east of peak rainfall at 120 E. We omit heating profiles at the longitude of peak rainfall because they are qualitatively similar among the models, with the exception that the modified AM3 version with weaker intraseasonal disturbances (AM3-B) has a slightly weaker uppertropospheric heating maximum (and thus a slightly less top-heavy profile) compared to AM3-A and AM3-C. In Fig. 13b, the observed heating profile over the West Pacific is bottom heavy with a peak heating near 850 hpa and cooling in the mid-troposphere, in agreement with the TRMM-based results of Lau and Wu (2010). A similar structure is noted for AM3-A and AM3-C, but AM3-B reveals a shallow heating peak closer to 725 hpa and a lack of cooling anywhere in the troposphere. Similar differences between the AM3-B heating profiles and the TRMM results of Lau and Wu (2010) are seen to the west of maximum rainfall where stratiform processes are expected to dominate (Fig. 13a). Here, top-heavy heating is evident in ERAI, with a peak near 450 hpa and a minimum in the lower troposphere. The upper-level heating is too weak in all AM3 versions, but the modified AM3 versions with more robust intraseasonal disturbances (AM3-A and AM3-C) produce a much stronger reduction in low-level heating (and thus a larger vertical heating gradient in the middle troposphere) compared to AM3-B. The shape of the vertical heating profile can impact the large-scale flow and thus the distribution of moisture and degree of atmospheric stability. Wu (2003) argues that a bottom-heavy heating profile 25
26 associated with shallow convection generates stronger near-surface circulations and enhances low-level moisture convergence to the east of deep convection, and that this shallow heating can sustain MJO-like systems against dissipation. Fig. 14 depicts anomalies of qv h regressed onto a standardized precipitation index at 120 E, where q is specific humidity and v h is horizontal vector wind. Both fields are averaged between 15 S-15 N. In ERAI (Fig. 14a), positive moisture convergence anomalies develop within the boundary layer during the suppressed convective phase (i.e., in the West Pacific) and then gradually deepen toward the disturbance center. A similar pattern is seen in AM3-A and AM3-C the two modified AM3 versions with more robust intraseasonal disturbances but the suppressed-phase moisture convergence in AM3-B is irregular and weak. Boundary layer moistening along the leading (eastern) edge of the disturbance is mainly associated with meridional convergence (not shown). This suggests that the convergence may be primarily frictional in origin, a process whose importance to the MJO has been debated (e.g., Wang 1988, Moskowitz and Bretherton 2000). Figures 13 and 14 indicate a clear link between the vertical heating profiles and large-scale circulations associated with intraseasonal convective disturbances in the AM3. In the two modified AM3 versions with the strongest inhibition of deep convection (AM3-A and AM3-C), time-mean shallow convective activity is enhanced relative to a third modified AM3 version with weaker deep convective suppression (AM3-B). These differences in heating profiles are associated with subseasonal variability rather than simply being features of the time means. In AM3-A and AM3-C, the peak of shallow convective heating is more prominent and the vertical gradient of heating in the lower- to mid-troposphere is larger ahead of the intraseasonal deep convective center (Fig. 13). This sharper heating peak effectively drives low-level circulations and moisture convergence that can promote subsequent convective development. A larger vertical gradient of upper-tropospheric heating associated with stratiform processes is also seen in AM3-A and AM3-C relative to AM3-B (Fig. 13). It is unclear exactly why the 26
27 stratiform signal trailing the deep convective center is enhanced in the modified AM3 versions with stronger deep convective suppression (AM3-A and AM3-C), although it seems plausible that the overall improved strength and organization of the disturbances themselves somehow promote improved organization of the heating. Lau and Wu (2010) assert that horizontal variability of the vertical heating profile likely contributes to the modulation of intraseasonal deep convection and the transition of MJO phases. For example, those authors demonstrate that shallow cumulus heating preconditions the environment ahead of the MJO while stratiform heating entrains dry mid-tropospheric air and suppresses deep convection following the MJO. Together, the differences in the distributions of the simulated heating structures and their associated circulations are related to the degree of organization of intraseasonal convective disturbances in the AM Section 5. Conclusions Intraseasonal variability in four GFDL AM3 simulations is examined and compared to previous simulations of the AM2. In contrast to AM2, AM3 employs new treatments of deep and shallow convection. In particular, cloud-aerosol interactions are introduced by computing cumulus cell-scale vertical velocities, and the parameterization of convective cloud systems now includes dynamically active mesoscale clouds that modulate the transfer of water substance between cumuli and their environment. The default AM3 generates a realistic mean state but lacks intraseasonal variability. Changes made to the deep convective closure and trigger assumptions inhibit the most penetrative cumuli and result in a substantial increase in the amplitude of eastward-propagating intraseasonal disturbances. As is typical of many other GCMs (Kim et al. 2011), the improved simulation of intraseasonal variability comes at the cost of a degraded mean state that includes possible wet biases in equatorial precipitation and a weakening of low-level westerlies in the Indo-Pacific region. 27
28 The eastward-propagating intraseasonal features produced by the modified AM3 versions have unrealistically narrow longitudinal scales and propagate at speeds closer to those of convectively coupled Kelvin waves in the West Pacific (Wheeler et al. 2000). Notable differences in the degree of convective organization and signal coherence exist among the modified AM3 simulations and may be associated with intraseasonal heating structures and their impact on low-level circulation and moisture availability, particularly for those processes related to shallow convection. In the two versions of the AM3 with the strongest MJO-like signal (AM3-A and AM3-C), a more prominent peak in shallow heating occurs with enhanced low-level convergence that increases moisture accumulation ahead of the deep convective center. The tropospheric heating gradient and low-level convergence leading the convective center are substantially weaker in the AM3 version with more disorganized intraseasonal convection (AM3-B). Following the deep convective center, AM3-A and AM3-C depict a more pronounced stratiform heating signal relative to AM3-B. Stratiform cloud processes can modulate intraseasonal deep convection and the transition of MJO phases (Lau and Wu 2010) and may also be contributing to the differences among the modified AM3 simulations in addition to shallow heating differences. Although we have provided new insight into the mechanisms that contribute to intraseasonal convective organization within the GFDL AM3, many issues have yet to be addressed. One such issue is the inability of the AM3 to produce a realistic mean state concurrent with a reasonable degree of intraseasonal variability. Another involves the dilemma by which intraseasonal convection is improved. On one hand, we have found that suppressing deep convection enhances intraseasonal variability; however, deep convection suppression also limits the source of water substance for the mesoscale clouds that are clearly important in simulated and observed MJOs (Fu and Wang 2009, Lau and Wu 2010). Additionally, our use of prescribed SSTs in the AM simulations precludes realistic air-sea interactions that strongly modulate intraseasonal convection in GCMs (Waliser et al. 1999) and in nature (Roundy and 28
29 Kiladis 2006). Further research is warranted to explore these and other issues related to simulated in- traseasonal convection in the AM Acknowledgements. We thank J.-L. Lin and three anonymous reviewers for their helpful comments on 624 this manuscript. This work was supported by award NA08OAR (JJB, EDM) and NA08OAR (AHS) from the National Oceanic and Atmospheric Administration, U.S. Department of Commerce, and by the Climate and Large-Scale Dynamics Program of the National Science Foundation under Grants AGS (EDM) and ATM (EDM). The statements, findings, conclusions, and recommendations do not necessarily reflect the views of NSF, NOAA, or the Department of Commerce. 29
30 References Adler, R. F., and Coauthors, 2003: The version-2 global precipitation climatology project (GPCP) monthly precipitation analysis (1979-present). J. Hydrol., 4, Anderson, J. L., and Coauthors, 2004: The new GFDL global atmosphere and land model AM2-LM2: Evaluation with prescribed SST simulations. J. Climate, 17, Arakawa, A., and W. H. Schubert, 1974: Interaction of a Cumulus Cloud Ensemble with Large-Scale Environment, Part I. J. Atmos. Sci., 31, Benedict, J. J., and D. A. Randall, 2007: Observed Characteristics of the MJO Relative to Maximum Rainfall. J. Atmos. Sci., 64, Berrisford, P., and Coauthors, 2009: The ERA-Interim Archive, 20 pp. [Available online at: Bretherton, C. S., J. R. McCaa, and H. Grenier, 2004: A new parameterization for shallow cumulus con- vection and its application to marine subtropical cloud-topped boundary layers. Part I: Description and 1D results. Mon. Wea. Rev., 132, Donner, L. J., 1993: A Cumulus Parameterization Including Mass Fluxes, Vertical Momentum Dynam- ics, and Mesoscale Effects. J. Atmos. Sci., 50,
31 Donner, L. J., and V. T. Phillips, 2003: Boundary layer control on convective available potential energy: Implications for cumulus parameterization. J. Geophys. Res., 108, Donner, L. J., C. J. Seman, R. S. Hemler, and S. M. Fan, 2001: A cumulus parameterization including mass fluxes, convective vertical velocities, and mesoscale effects: Thermodynamic and hydrologi- cal aspects in a general circulation model. J. Climate, 14, Donner, L. J., and Coauthors, 2011: The Dynamical Core, Physical Parameterizations, and Basic Simu- lation Characteristics of the Atmospheric Component AM3 of the GFDL Global Coupled Model CM3. J. Climate, 24, Emanuel, K., 1993: The Effect of Convective Response Time on WISHE Modes. J. Atmos. Sci., 50, Emanuel, K. A., 1987: An Air-Sea Interaction Model of Intraseasonal Oscillations in the Tropics. J. At- mos. Sci., 44, Frierson, D. M. W., 2007: Convectively Coupled Kelvin Waves in an Idealized Moist General Circula- tion Model. J. Atmos. Sci., 64, Frierson, D. M. W., D. Kim, I. S. Kang, M. I. Lee, and J. L. Lin, 2011: Structure of AGCM-Simulated Convectively Coupled Kelvin Waves and Sensitivity to Convective Parameterization. J. Atmos. Sci., 68,
32 Fu, X. H., and B. Wang, 2009: Critical Roles of the Stratiform Rainfall in Sustaining the Madden-Julian Oscillation: GCM Experiments. J. Climate, 22, Hannah, W. M., and E. D. Maloney, 2011: The Role of Moisture-Convection Feedbacks in Simulating the Madden-Julian Oscillation. J. Climate, 24, Hayashi, Y., 1970: A Theory of Large-Scale Equatorial Waves Generated by Condensation Heat and Accelerating the Zonal Wind. J. Meteor. Soc. Japan, 48, Hendon, H. H., and M. L. Salby, 1994: The Life Cycle of the Madden-Julian Oscillation. J. Atmos. Sci., 51, Holloway, C. E., and J. D. Neelin, 2009: Moisture Vertical Structure, Column Water Vapor, and Tropi- cal Deep Convection. J. Atmos. Sci., 66, Houze, R. A., Jr., 1982: Cloud Clusters and Large-Scale Vertical Motion in the Tropics. J. Meteor. Soc. Japan, 60, Houze, R. A., 1989: Observed structure of mesoscale convective systems and implications for large- scale heating. Quarterly Journal of the Royal Meteorological Society, 115,
33 Huffman, G. J., and Coauthors, 2007: The TRMM Multisatellite Precipitation Analysis (TMPA): Quasi- Global, Multiyear, Combined-Sensor Precipitation Estimates at Fine Scales. J. Hydrol., 8, Hurrell, J. W., J. J. Hack, D. Shea, J. M. Caron, and J. Rosinski, 2008: A New Sea Surface Temperature and Sea Ice Boundary Dataset for the Community Atmosphere Model. J. Climate, 21, Inness, P. M., J. M. Slingo, E. Guilyardi, and J. Cole, 2003: Simulation of the Madden-Julian oscillation in a coupled general circulation model. Part II: The role of the basic state. J. Climate, 16, Jia, X. L., C. Y. Li, N. F. Zhou, and J. Ling, 2010: The MJO in an AGCM with three different cumulus parameterization schemes. Dynam Atmos Oceans, 49, Kato, S., and Coauthors, 2011: Improvements of top-of-atmosphere and surface irradiance computations with CALIPSO-, CloudSat-, and MODIS-derived cloud and aerosol properties. J. Geophys. Res., 116, D Kemball-Cook, S. R., and B. C. Weare, 2001: The Onset of Convection in the Madden-Julian Oscilla- tion. J. Climate, 14, Khouider, B., and A. J. Majda, 2007: A simple multicloud parameterization for convectively coupled tropical waves. Part II: Nonlinear simulations. J. Atmos. Sci., 64,
34 Khouider, B., A. St-Cyr, A. J. Majda, and J. Tribbia, 2011: The MJO and Convectively Coupled Waves in a Coarse-Resolution GCM with a Simple Multicloud Parameterization. J. Atmos. Sci., 68, Kiladis, G. N., K. H. Straub, and P. T. Haertel, 2005: Zonal and Vertical Structure of the Madden-Julian Oscillation. J. Atmos. Sci., 62, Kiladis, G. N., M. C. Wheeler, P. T. Haertel, K. H. Straub, and P. E. Roundy, 2009: Convectively Cou- pled Equatorial Waves. Rev Geophys, Kim, D., A. H. Sobel, E. D. Maloney, D. M. W. Frierson, and I.-S. Kang, 2011: A Systematic Relation- ship between Intraseasonal Variability and Mean State Bias in AGCM Simulations. J. Climate, 24, Kim, D., and Coauthors, 2009: Application of MJO Simulation Diagnostics to Climate Models. J. Cli- mate, 22, Kuang, Z., 2008: A moisture-stratiform instability for convectively coupled waves. J. Atmos. Sci., 65, Kummerow, C., and Coauthors, 2000: The Status of the Tropical Rainfall Measuring Mission (TRMM) after Two Years in Orbit. J. Appl. Meteor., 39,
35 Lappen, C.-L., and C. Schumacher, 2012: MJO Prediction in GCMs: Are Accurate Heating Distribu- tions Critical? Climate Dynamics, accepted pending revisions Lau, K. M., and H. T. Wu, 2010: Characteristics of Precipitation, Cloud, and Latent Heating Associated with the Madden-Julian Oscillation. J. Climate, 23, Leary, C. A., and R. A. Houze, 1980: The Contribution of Mesoscale Motions to the Mass and Heat Fluxes of an Intense Tropical Convective System. J. Atmos. Sci., 37, Li, C. Y., X. L. Jia, J. Ling, W. Zhou, and C. D. Zhang, 2009: Sensitivity of MJO simulations to diabatic heating profiles. Climate Dynamics, 32, Liebmann, B., and C. A. Smith, 1996: Description of a complete (interpolated) outgoing longwave ra- diation dataset. Bull. Amer. Meteor. Soc., 77, Lin, J., B. Mapes, M. Zhang, and M. Newman, 2004: Stratiform Precipitation, Vertical Heating Profiles, and the Madden-Julian Oscillation. J. Atmos. Sci., 61, Lin, J.-L., and Coauthors, 2006: Tropical Intraseasonal Variability in 14 IPCC AR4 Climate Models. Part I: Convective Signals. J. Climate, 19,
36 Lin, J.-L., M.-I. Lee, D. Kim, I.-S. Kang, and D. M. W. Frierson, 2008: The Impacts of Convective Pa- rameterization and Moisture Triggering on AGCM-Simulated Convectively Coupled Equatorial Waves. J. Climate, 21, Lin, X., and R. H. Johnson, 1996: Heating, Moistening, and Rainfall over the Western Pacific Warm Pool during TOGA COARE. J. Atmos. Sci., 53, Maloney, E. D., 2002: An Intraseasonal Oscillation Composite Life Cycle in the NCAR CCM3.6 with Modified Convection. J. Climate, 15, Maloney, E. D., and D. L. Hartmann, 2001: The sensitivity of intraseasonal variability in the NCAR CCM3 to changes in convective parameterization. J. Climate, 14, Mapes, B. E., 2000: Convective Inhibition, Subgrid-Scale Triggering Energy, and Stratiform Instability in a Toy Tropical Wave Model. J. Atmos. Sci., 57, Moncrieff, M. W., 1992: Organized Convective Systems: Archetypal Dynamical Models, Mass and Momentum Flux Theory, and Parametrization. Quarterly Journal of the Royal Meteorological So- ciety, 118, Moncrieff, M. W., 2004: Analytic Representation of the Large-Scale Organization of Tropical Convec- tion. J. Atmos. Sci., 61,
37 Moorthi, S., and M. J. Suarez, 1992: Relaxed Arakawa-Schubert - a Parameterization of Moist Convec- tion for General-Circulation Models. Mon. Wea. Rev., 120, Moskowitz, B. M., and C. S. Bretherton, 2000: An Analysis of Frictional Feedback on a Moist Equatori- al Kelvin Mode. J. Atmos. Sci., 57, Neale, R. B., J. H. Richter, and M. Jochum, 2008: The Impact of Convection on ENSO: From a Delayed Oscillator to a Series of Events. J. Climate, 21, Neelin, J. D., I. M. Held, and K. H. Cook, 1987: Evaporation-Wind Feedback and Low-Frequency Vari- ability in the Tropical Atmosphere. J. Atmos. Sci., 44, Reynolds, R. W., N. A. Rayner, T. M. Smith, D. C. Stokes, and W. Wang, 2002: An Improved In Situ and Satellite SST Analysis for Climate. J. Climate, 15, Roundy, P. E., and G. N. Kiladis, 2006: Observed Relationships between Oceanic Kelvin Waves and Atmospheric Forcing. J. Climate, 19, Roundy, P. E., 2012a: The Spectrum of Convectively Coupled Kelvin Waves and the Madden-Julian Oscillation in Regions of Low-level Easterly and Westerly Background Flow. J. Atmos. Sci, in press
38 Roundy, P. E., 2012b: Observed Structure of Convectively Coupled Waves as a Function of Equivalent Depth: Kelvin Waves and the Madden-Julian Oscillation. J. Atmos. Sci., in press Romps, D. M., 2010: A Direct Measure of Entrainment. J. Atmos. Sci., 67, Salzmann, M., and Coauthors, 2010: Two-moment bulk stratiform cloud microphysics in the GFDL AM3 GCM: description, evaluation, and sensitivity tests. Atmos. Chem. Phys., 10, Schumacher, C., and R. A. Houze, 2003: The TRMM precipitation radar's view of shallow, isolated rain. J. Appl. Meteor., 42, Seo, K. H., and W. Q. Wang, 2010: The Madden-Julian Oscillation Simulated in the NCEP Climate Forecast System Model: The Importance of Stratiform Heating. J. Climate, 23, Slingo, J. M., and Coauthors, 1996: Intraseasonal oscillations in 15 atmospheric general circulation models: results from an AMIP diagnostic subproject. Climate Dynamics, 12, Sobel, A. H., E. D. Maloney, G. Bellon, and D. M. Frierson, 2010: Surface fluxes and tropical intrasea- sonal variability: a reassessment. Journal of Advances in Modeling Earth Systems, 2, 27 pp Sperber, K., S. Gualdi, S. Legutke, and V. Gayler, 2005: The Madden Julian oscillation in ECHAM4 coupled and uncoupled general circulation models. Climate Dynamics, 25,
39 Straub, K. H., P. T. Haertel, and G. N. Kiladis, 2010: An Analysis of Convectively Coupled Kelvin Waves in 20 WCRP CMIP3 Global Coupled Climate Models. J. Climate, 23, Subramanian, A. C., M. Jochum, A. J. Miller, R. Murtugudde, R. B. Neale, and D. E. Waliser, 2011: The Madden Julian Oscillation in CCSM4. J. Climate, in press Tiedtke, M., 1989: A Comprehensive Mass Flux Scheme for Cumulus Parameterization in Large-Scale Models. Mon. Wea. Rev., 117, Tokioka, T., K. Yamazaki, A. Kitoh, and T. Ose, 1988: The Equatorial Day Oscillation and the Arakawa-Schubert Penetrative Cumulus Parameterization. Journal of the Meteorological Society of Japan, 66, Trenberth, K. E., J. T. Fasullo, and J. Kiehl, 2009: Earth's Global Energy Budget. Bull. Amer. Meteor. Soc., 90, Waliser, D. E., K. M. Lau, and J. H. Kim, 1999: The influence of coupled sea surface temperatures on the Madden-Julian oscillation: A model perturbation experiment. J. Atmos. Sci., 56, Wang, B., 1988: Dynamics of Tropical Low-Frequency Waves: An Analysis of the Moist Kelvin Wave. J. Atmos. Sci., 45,
40 , 2005: Theory, Chapter 10. Intraseasonal Variability in the Atmosphere-Ocean Climate System, W. K. Lau, and D. E. Waliser, Ed., Praxis-Springer, 474 pp Wheeler, M., and G. N. Kiladis, 1999: Convectively Coupled Equatorial Waves: Analysis of Clouds and Temperature in the Wavenumber-Frequency Domain. J. Atmos. Sci., 56, Wheeler, M., G. N. Kiladis, and P. J. Webster, 2000: Large-Scale Dynamical Fields Associated with Convectively Coupled Equatorial Waves. J. Atmos. Sci., 57, Wilcox, E. M., and L. J. Donner, 2007: The frequency of extreme rain events in satellite rain-rate esti- mates and an atmospheric general circulation model. J. Climate, 20, Wolter, K., and M. S. Timlin, 2011: El Nino/Southern Oscillation behaviour since 1871 as diagnosed in an extended multivariate ENSO index (MEI.ext). Int J Climatol, 31, Wu, Z., 2003: A Shallow CISK, Deep Equilibrium Mechanism for the Interaction between Large-Scale Convection and Large-Scale Circulations in the Tropics. J. Atmos. Sci., 60, Yanai, M., S. Esbensen, and J.-H. Chu, 1973: Determination of Bulk Properties of Tropical Cloud Clus- ters from Large-Scale Heat and Moisture Budgets. J. Atmos. Sci., 30, Yuan, J., and R. A. Houze, 2010: Global Variability of Mesoscale Convective System Anvil Structure from A-Train Satellite Data. J. Climate, 23,
41 Zhang, C., and Coauthors, 2006: Simulations of the Madden Julian oscillation in four pairs of coupled and uncoupled global models. Climate Dynamics, 27, Zhang, G. J., 2002: Convective quasi-equilibrium in midlatitude continental environment and its effect on convective parameterization. J. Geophys. Res., 107, Zhang, G. J., and M. Q. Mu, 2005: Simulation of the Madden-Julian oscillation in the NCAR CCM3 us- ing a revised Zhang-McFarlane convection parameterization scheme. J. Climate, 18, Zhao, M., I. M. Held, S. J. Lin, and G. A. Vecchi, 2009: Simulations of Global Hurricane Climatology, Interannual Variability, and Response to Global Warming Using a 50-km Resolution GCM. J. Climate, 22, Zhou, L., R. Neale, M. Jochum, and R. Murtugudde, 2011: Improved Madden-Julian Oscillations with improved physics: the impact of modified convection parameterizations. J. Climate, in press
42 Figure Captions Figure 1. Diagram of selected physical processes represented in the Donner deep convection scheme. Clouds associated with the cumulus (mesoscale) parameterizations are shaded gray (dark blue). For any member of a spectrum of cumuli, condensate can be formed within convective updrafts (C U ), evaporated directly into the environment (E CE ) within the cloud-top zone, evaporated within convective downdrafts (E CD ), removed from the cloud as precipitation (R C ), or transported to a mesoscale anvil cloud as liquid (C A ) or vapor (Q mf ). Water substance provided by cumuli to the subgrid-scale anvil can undergo phase changes: condensate can be formed within mesoscale updrafts (C MU ), removed as precipitation (R M ), or evaporated into the grid-scale environment from mesoscale updrafts (E ME ) or downdrafts (E MD ). The cloud-top zone, defined for each cumulus subensemble, is the region from 50 hpa below cloud top (p t ) to 10 hpa above p t (p tt ). The cloud-top pressure of the most penetrative cumulus plume is p (d) tt. The mesoscale cloud updraft base pressure p zm occurs where Q mf first becomes positive for the least penetrative cumulus plume; its top extends to p ztm, where p ztm is set at the level of zero buoyancy (LZB) or p LZB 10 hpa, if p t for the deepest cell is less than p LZB. Also, p ztm is restricted to be no less than the pressure at the temperature minimum taken as an indicator of the local tropopause. Sublimation associated with mesoscale downdrafts occurs in the layer from p zm to the surface (p g ), and light blue shading fading to white represents the reduction in relative humidity as mixing with environmental air occurs. Mesoscale downdrafts can exist between p zm and p g, and their associated fluxes of moisture and temperature are distributed as functions of height between p md and cumulus cloud-base pressure p b and uniformly between p zm and p md and between p b and p g
43 Figure 2. (a) boreal winter mean GPCP precipitation and (b-g) the difference in boreal win- ter mean precipitation between the GPCP dataset and each AM simulation. Pattern correlations for the domain (20 S-20 N, 50 E-120 W) are shown to the upper right of each difference panel Figure 3. Climatological boreal winter mean 850 hpa zonal wind from (a) ERAI ( ) and (b-g) the AM simulations analyzed. The zero contour is shown with a thick black line Figure 4. Boreal winter mean relative humidity averaged between E for (a) ERAI, and (b-g) the (model ERAI) humidity difference for each AM simulation Figure 5. Frequency-zonal wavenumber power spectra of the symmetric component (about the Equator) of precipitation for observations and a selection of AM simulations. For each panel a-f, a pair of plots display the (top) base-10 logarithm of the summation of power between 15 S-15 N (raw spectrum) and (bottom) raw spectrum divided by a smoothed background spectrum. Thick black lines represent dispersion curves for equivalent depths of 12, 25, and 50 m for equatorial Rossby (ER), Kelvin, and eastward and westward inertio-gravity waves (EIG and WIG, respectively) and the MJO. Negative zonal wavenumbers correspond to westward propagation Figure 6. As in Fig. 5, but zoomed into the MJO spectral region Figure 7. As in Figure 5, but for 850 hpa zonal winds for (a) ERAI, (b) AM2-TOK, and (c) AM3-C
44 Figure 8. Lag correlations of 850 hpa zonal wind with precipitation at (left column) 90 E and (right column) 150 E. Both fields are bandpass filtered ( days) and averaged between 15 S-15 N. Solid (dashed) contours represent positive (negative) correlations that are shaded dark (light) gray if they exceed the 95% statistical significance level. We use ERAI and TRMM for the observed wind and rainfall fields. In the left panels, the index reference longitudes and the 5 m s 1 phase speed are marked by vertical and slanted thick lines, respectively. Right panels also contain the 10 m s 1 phase speed line Figure 9. Lag-0 longitudinal cross sections of specific humidity anomalies linearly regressed onto a standardized day filtered precipitation index timeseries at (left column) 90 E and (right column) 150 E. Humidity anomalies are departures from a smoothed calendar-day mean, and anomaly values represent a one standard deviation change in the index. Both fields are averaged between 15 S-15 N. Positive (negative) anomalies that exceed the 95% statistical significance levels are shaded dark (light) gray. We use ERAI and TRMM for the observed specific humidity and rainfall fields. Index reference longitudes are marked by thick vertical lines. Contour interval is ±0.1 g kg 1, and the ±0.05 g kg 1 contour is also shown. No zero contour is drawn Figure 10. As in Fig. 9, but for anomalous apparent convective heat source Q 1 linearly regressed onto day filtered precipitation at 120 E. All fields are averaged between 5 S-5 N. Contours are ±0.025, 0.05, 0.1, 0.2, 0.4, 0.6, 0.8, and 1.0 K day 1, with a contour interval of ±0.5 K day 1 for more extreme values. The ±0.05 K day 1 contours are emboldened, and a 7-point weighted running mean has been applied in longitude to clarify heating patterns
45 Figure 11. Longitudinal cross sections of boreal winter mean (a) total precipitation and (b) stratiform (grid-scale) precipitation as a percentage of total precipitation for all AM simulations. Latitudinal bounds are 10 S-10 N. Stratiform rainfall fraction was computed for each day prior to space-time averaging Figure 12. Boreal winter mean parameterized mass fluxes from the (top) shallow convection scheme UW_CONV, (middle) deep convection scheme (upward only, CELL_UP ), and (bottom) mesoscale cloud scheme (upward only, MESO_UP ) for all AM3 simulations Figure 13. Vertical profiles of regressed apparent convective heating Q 1 taken from Fig. 10 and aver- aged between (a) E and (b) E Figure 14. As in Fig. 10, but for anomalous moisture convergence linearly regressed onto day filtered precipitation at 120 E. All fields are averaged between 15 S-15 N. Here, q is specific humidity and v h is horizontal vector wind. We use ERAI and TRMM for the observed wind, specific humidity, and rainfall fields. 45
46 Table 1. Key features of the deep convective parameterizations used in the AM2 and AM3 simulations examined in this study. See text for further details. Scheme Deep Convection Parameterization Closure Assumption AM2-CTL RAS CAPE relaxation AM2-TOK RAS CAPE relaxation AM3-CTL Donner CAPE relaxation AM3-A Donner Zhang (2002) AM3-B Donner Zhang (2002) AM3-C Donner Zhang (2002) Activation Trigger CAPE Dilution? Non-precipitated Condensate Pathways Evaporation in Downdrafts Evaporation into Environment Entrained into Anvil Clouds α = no 0 1 α = 0.1 no 0 1 no Time-integrated low-level parcel lifting Time-integrated low-level parcel lifting Time-integrated low-level parcel lifting no no yes
47 Table 2. Global mean energy budgets at the top of atmosphere (TOA) and Earth surface (SFC) for observational estimates (Trenberth et al. 2009) and all AM2 and AM3 simulations. Observational estimates reported in Trenberth et al. (2009) are derived from satellite retrievals (CERES, ISCPP, GPCP), climate models (CLM3), and various reanalysis products (e.g., NCEP; see Trenberth et al. (2009) for acronym descriptions). Net flux components are also shown, including shortwave (SW) and longwave (LW) radiation, surface latent heat flux (LH; includes column heating from snow formation), and surface sensible heat flux (SH). Positive fluxes are into the atmospheric column, and flux units are W m 2. OBS AM2-CTL AM2-TOK AM3-CTL AM3-A AM3-B AM3-C Time Range yr 10 yr 10 yr 10 yr 10 yr 10 yr SFC Net SW Net LH Net LW Net SH NET SFC TOA Net SW Net LW NET TOA NET COLUMN
48 ted as the simulation differences from reanalysis, averaged horizontally within the region (10 S-5 N, E-180 ) and vertically within the noted pressure levels. Simulation Averaged T Bias [K] hpa (8 levels) Averaged T Bias [K] hpa (5 levels) AM2-CTL AM2-TOK AM3-CTL AM3-A AM3-B AM3-C
49 Table 4. Summary of intraseasonal convective disturbances and Warm Pool mean state biases for ERAI and the AM simulations. Columns include U850 (qualitative bias description and eastward extent of boreal winter mean U850 equatorial westerlies), RH [relative humidity bias description in the upper and middle troposphere (approximately hpa and hpa, respectively) and boundary layer (BL; hpa)], T (temperature bias description), MJO E/W [ratio of eastward to westward spectral power for the symmetric component of precipitation in the MJO spectral region (periods d, zonal wavenumbers +1 to +3 (eastward) or 1 to 3 (westward)], Kelvin (qualitative comparison of Kelvin waves between simulation and reanalysis based on significant power spectra in Fig. 5), MJO [qualitative MJO comparison between simulations and reanalysis based on significant power spectra in Fig. 6, where the approximate zonal wavenumber ( zwn ) and period ( T ) of the peak power are indicated], and Speed (approximate intraseasonal disturbance phase speed based on Fig. 8). Other abbreviations in the table include: IO (Indian Ocean), WP (West Pacific), and trop (troposphere) (Table on following page)
50 Boreal Winter Mean Biases U850 RH T MJO E/W Intraseasonal Disturbances Kelvin MJO Speed [m/s] ERAI 175 E AM2-CTL realistic, 150 E up-trop: dry mid-trop: moist BL: moist mid-trop: cool 0.9 very weak zwn 2-3, T~45d AM2-TOK weak IO, realistic WP, 160 E up-trop: dry mid-trop: dry BL: moist mid-trop: very cool 1.4 very weak zwn 3, T~45d 5 AM3-CTL realistic, 135 up-trop: moist small T biases 0.9 weak zwn 3, T~45d AM3-A weak, 140 E up-trop: moist mid-trop: dry mid-trop: cool BL: warm 1.5 slow zwn 2, T~30d 6-10 AM3-B very weak (IO easterlies), 160 E mid-trop: very dry mid-trop: cool 1.4 slow zwn 1, T~35d 5-7 AM3-C weak, 155 E mid-trop: dry mid-trop: very cool BL: warm 1.6 slow, merged with MJO signal zwn 1-2, T~20-30d
 parameterizations are shaded gray (dark blue).")
51 Figure 1. Diagram of selected physical processes represented in the Donner deep convection scheme. Clouds associated with the cumulus (mesoscale) parameterizations are shaded gray (dark blue). For any member of a spectrum of cumuli, condensate can be formed within convective updrafts (C U ), evaporated directly into the environment (E CE ) within the cloud-top zone, evaporated within convective downdrafts (E CD ), removed from the cloud as precipitation (R C ), or transported to a mesoscale anvil cloud as liquid (C A ) or vapor (Q mf ). Water substance provided by cumuli to the subgrid-scale anvil can undergo phase changes: condensate can be formed within mesoscale updrafts (C MU ), removed as precipitation (R M ), or evaporated into the grid-scale environment from mesoscale updrafts (E ME ) or downdrafts (E MD ). The cloud-top zone, defined for each cumulus subensemble, is the region from 50 hpa below cloud top (p t ) to 10 hpa above p t (p tt ). The cloud-top pressure of the most penetrative cumulus plume is p (d) tt. The 51
52 mesoscale cloud updraft base pressure p zm occurs where Q mf first becomes positive for the least penetrative cumulus plume; its top extends to p ztm, where p ztm is set at the level of zero buoyancy (LZB) or p LZB 10 hpa, if p t for the deepest cell is less than p LZB. Also, p ztm is restricted to be no less than the pressure at the temperature minimum taken as an indicator of the local tropopause. Sublimation associated with mesoscale downdrafts occurs in the layer from p zm to the surface (p g ), and light blue shading fading to white represents the reduction in relative humidity as mixing with environmental air occurs. Mesoscale downdrafts can exist between p zm and p g, and their associated fluxes of moisture and temperature are distributed as functions of height between p md and cumulus cloud-base pressure p b and uniformly between p zm and p md and between p b and p g. 52
 1980-2000 boreal winter mean GPCP precipitation and (b-g) the difference in boreal win- ter mean precipitation between the GPCP dataset and each AM")
53 Figure 2. (a) boreal winter mean GPCP precipitation and (b-g) the difference in boreal win- ter mean precipitation between the GPCP dataset and each AM simulation. Pattern correlations for the domain (20 S-20 N, 50 E-120 W) are shown to the upper right of each difference panel. 53
 ERAI (1980-2000) and (b-g) the AM")
54 Figure 3. Climatological boreal winter mean 850 hpa zonal wind from (a) ERAI ( ) and (b-g) the AM simulations analyzed. The zero contour is shown with a thick black line. 54
 ERAI, and (b-g)")
55 Figure 4. Boreal winter mean relative humidity averaged between E for (a) ERAI, and (b-g) the (model ERAI) humidity difference for each AM simulation. 55
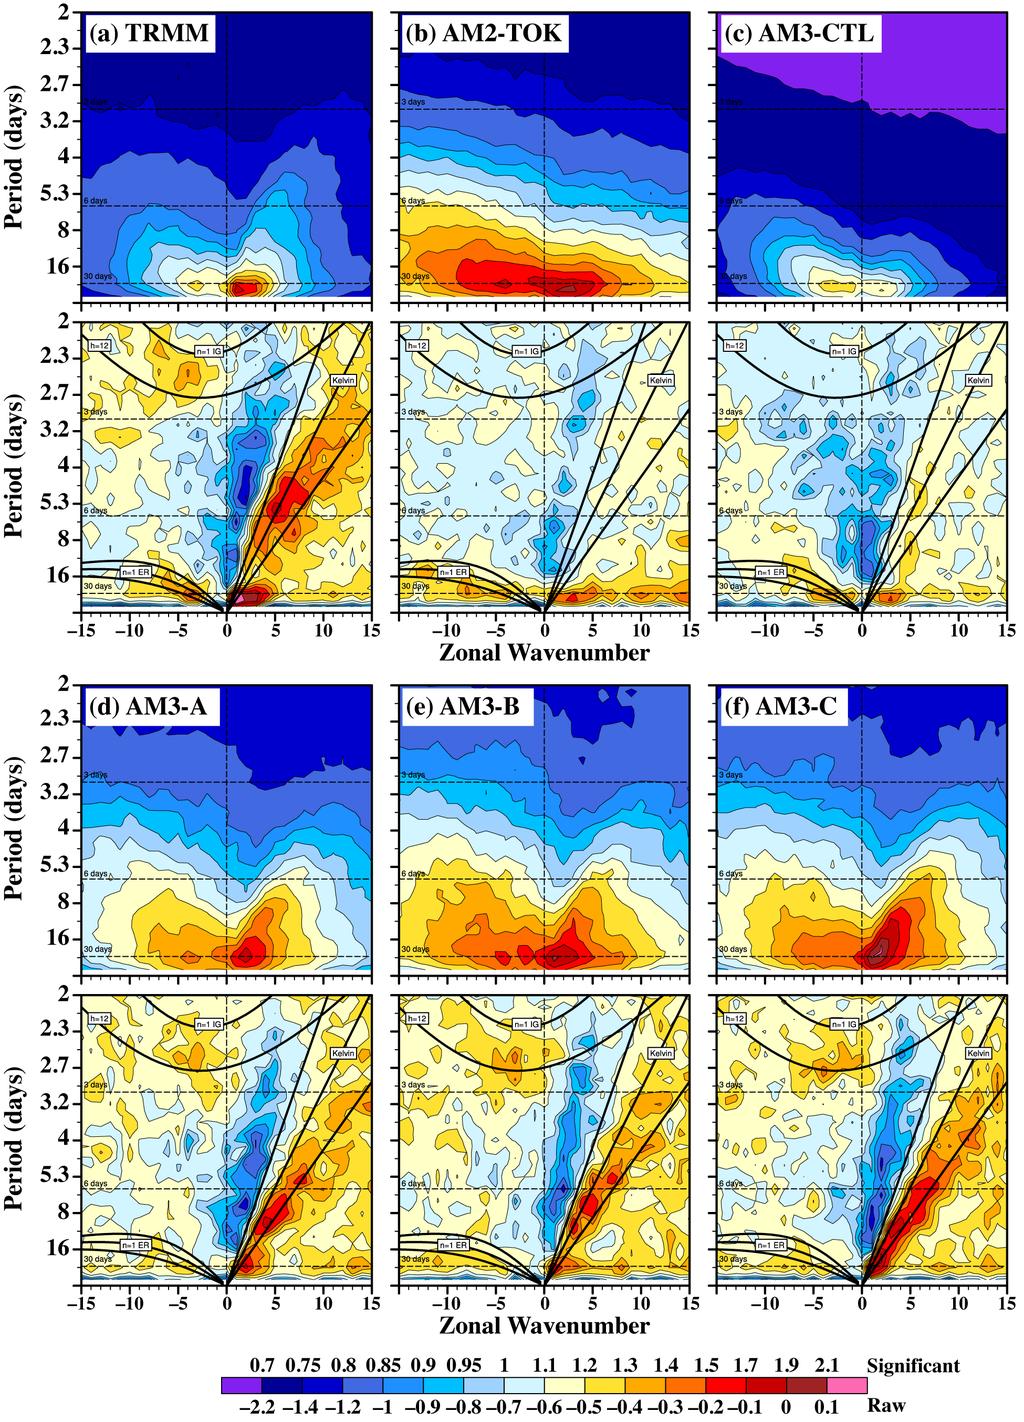
56
57 Figure 5. Frequency-zonal wavenumber power spectra of the symmetric component (about the Equator) of precipitation for observations and a selection of AM simulations. For each panel a-f, a pair of plots display the (top) base-10 logarithm of the summation of power between 15 S-15 N (raw spectrum) and (bottom) raw spectrum divided by a smoothed background spectrum. Thick black lines represent dispersion curves for equivalent depths of 12, 25, and 50 m for equatorial Rossby (ER), Kelvin, and eastward and westward inertio-gravity waves (EIG and WIG, respectively) and the MJO. Negative zonal wavenumbers correspond to westward propagation. 57

58 Figure 6. As in Fig. 5, but zoomed into the MJO spectral region. 58
")
59 Figure 7. As in Figure 5, but for 850 hpa zonal winds for (a) ERAI, (b) AM2-TOK, and (c) AM3-C. 59
 and averaged between 15 S-15 N.")
60 Figure 8. Lag correlations of 850 hpa zonal wind with precipitation at (left column) 90 E and (right column) 150 E. Both fields are bandpass filtered ( days) and averaged between 15 S-15 N. Solid (dashed) contours represent positive (negative) correlations that are shaded dark (light) gray if they exceed the 95% statistical significance level. We use ERAI and TRMM for the observed wind and rainfall fields. In the left panels, index reference longitudes and the 5 m s 1 phase speed are marked by vertical and slanted thick lines, respectively. Right panels also contain the 10 m s 1 phase speed line. 60
 90 E and (right column) 150")
61 Figure 9. Lag-0 longitudinal cross sections of specific humidity anomalies linearly regressed onto a standardized day filtered precipitation index timeseries at (left column) 90 E and (right column) 150 E. Humidity anomalies are departures from a smoothed calendar-day mean, and anomaly values represent a one standard deviation change in the index. Both fields are averaged between 15 S-15 N. Positive (negative) anomalies that exceed the 95% statistical significance levels are shaded dark (light) gray. We use ERAI and TRMM for the observed specific humidity and rainfall fields. Index reference longitudes are marked by thick vertical lines. Contour interval is ±0.1 g kg 1, and the ±0.05 g kg 1 contour is also shown. No zero contour is drawn. 61

62 Figure 10. As in Fig. 9, but for anomalous apparent convective heat source Q 1 linearly regressed onto day filtered precipitation at 120 E. All fields are averaged between 5 S-5 N. Contours are ±0.025, 0.05, 0.1, 0.2, 0.4, 0.6, 0.8, and 1.0 K day 1, with a contour interval of ±0.5 K day 1 for more extreme values. The ±0.05 K day 1 contours are emboldened, and a 7-point weighted running mean has been applied in longitude to clarify heating patterns. 62
63 Figure 11. Longitudinal cross sections of boreal winter mean (a) total precipitation and (b) stratiform (grid-scale) precipitation as a percentage of total precipitation for all AM simulations. Latitudinal bounds are 10 S-10 N. Stratiform rainfall fraction was computed for each day prior to space-time averaging. 63
 shallow convection scheme UW_CONV, (middle) deep convection scheme (upward")
64 Figure 12. Boreal winter mean parameterized mass fluxes from the (top) shallow convection scheme UW_CONV, (middle) deep convection scheme (upward only, CELL_UP ), and (bottom) mesoscale cloud scheme (upward only, MESO_UP ) for all AM3 simulations. 64
65 Figure 13. Vertical profiles of regressed apparent convective heating Q 1 taken from Fig. 10 and aver- aged between (a) E and (b) E. 65

66 Figure 14. As in Fig. 10, but for anomalous moisture convergence linearly regressed onto day filtered precipitation at 120 E. All fields are averaged between 15 S-15 N. Here, q is specific humidity and v h is horizontal vector wind. We use ERAI and TRMM for the observed wind, specific humidity, and rainfall fields. 66
Factors for the Simulation of Convectively Coupled Kelvin Waves
 15 MAY 2012 S E O E T A L. 3495 Factors for the Simulation of Convectively Coupled Kelvin Waves KYONG-HWAN SEO, JIN-HO CHOI, AND SANG-DAE HAN Division of Earth Environmental System, Department of Atmospheric
Convection Trigger: A key to improving GCM MJO simulation? CRM Contribution to DYNAMO and AMIE
 Convection Trigger: A key to improving GCM MJO simulation? CRM Contribution to DYNAMO and AMIE Xiaoqing Wu, Liping Deng and Sunwook Park Iowa State University 2009 DYNAMO Workshop Boulder, CO April 13-14,
Why do GCMs have trouble with the MJO?
 Why do GCMs have trouble with the MJO? The Madden-Julian Oscillation West East 200 [hpa] 500 Cool & dry Cool & dry p 700 850 SST Lag Day +20 +15 +10 +5 0-5 -10-15 -20 ~20 days ~10 days ~10-15 days
Moisture modes, cloud-radiative feedbacks and the MJO
 Moisture modes, cloud-radiative feedbacks and the MJO Adam Sobel Eric Maloney with bits from Shuguang Wang, Jim Benedict; thanks also Gilles Bellon, Dargan Frierson, Daehyun Kim EUCLIPSE summer school
CHAPTER 8 NUMERICAL SIMULATIONS OF THE ITCZ OVER THE INDIAN OCEAN AND INDONESIA DURING A NORMAL YEAR AND DURING AN ENSO YEAR
 CHAPTER 8 NUMERICAL SIMULATIONS OF THE ITCZ OVER THE INDIAN OCEAN AND INDONESIA DURING A NORMAL YEAR AND DURING AN ENSO YEAR In this chapter, comparisons between the model-produced and analyzed streamlines,
Impacts of Idealized Air Sea Coupling on Madden Julian Oscillation Structure in the Superparameterized CAM
 1990 J O U R N A L O F T H E A T M O S P H E R I C S C I E N C E S VOLUME 68 Impacts of Idealized Air Sea Coupling on Madden Julian Oscillation Structure in the Superparameterized CAM JAMES J. BENEDICT
8/21/08. Modeling the General Circulation of the Atmosphere. Topic 4: Equatorial Wave Dynamics. Moisture and Equatorial Waves
 Modeling the General Circulation of the Atmosphere. Topic 4: Equatorial Wave Dynamics D A R G A N M. W. F R I E R S O N U N I V E R S I T Y O F W A S H I N G T O N, D E P A R T M E N T O F A T M O S P
What is the Madden-Julian Oscillation (MJO)?
?") What is the Madden-Julian Oscillation (MJO)? Planetary scale, 30 90 day oscillation in zonal wind, precipitation, surface pressure, humidity, etc., that propagates slowly eastward Wavelength = 12,000 20,000
What is the Madden-Julian Oscillation (MJO)? Planetary scale, 30 90 day oscillation in zonal wind, precipitation, surface pressure, humidity, etc., that propagates slowly eastward Wavelength = 12,000 20,000
The Sensitivity of Intraseasonal Variability in the NCAR CCM3 to Changes in Convective Parameterization
 1MAY 2001 MALONEY AND HARTMANN 2015 The Sensitivity of Intraseasonal Variability in the NCAR CCM3 to Changes in Convective Parameterization ERIC D. MALONEY* AND DENNIS L. HARTMANN Department of Atmospheric
Moisture Modes and the Eastward Propagation of the MJO
 JANUARY 2013 S O B E L A N D M A L O N E Y 187 Moisture Modes and the Eastward Propagation of the MJO ADAM SOBEL Department of Applied Physics and Applied Mathematics, and Department of Earth and Environmental
Vertical Moist Thermodynamic Structure of the MJO in AIRS Observations: An Update and A Comparison to ECMWF Interim Reanalysis
 Vertical Moist Thermodynamic Structure of the MJO in AIRS Observations: An Update and A Comparison to ECMWF Interim Reanalysis Baijun Tian 1 Duane Waliser 1, Eric Fetzer 1, and Yuk Yung 2 1.Jet Propulsion
Moisture modes, cloud-radiative feedbacks and the MJO
 Moisture modes, cloud-radiative feedbacks and the MJO Adam Sobel Eric Maloney, Shuguang Wang, Daehyun Kim, also bits from Jim Benedict; thanks also Gilles Bellon, Dargan Frierson FDEPS, Kyoto Source: Matt
Analysis of Convectively Coupled Kelvin Waves in the Indian Ocean MJO
 1342 J O U R N A L O F T H E A T M O S P H E R I C S C I E N C E S VOLUME 65 Analysis of Convectively Coupled Kelvin Waves in the Indian Ocean MJO PAUL E. ROUNDY University at Albany, State University
Large-Eddy Simulations of Tropical Convective Systems, the Boundary Layer, and Upper Ocean Coupling
 DISTRIBUTION STATEMENT A. Approved for public release; distribution is unlimited. Large-Eddy Simulations of Tropical Convective Systems, the Boundary Layer, and Upper Ocean Coupling Eric D. Skyllingstad
The Amplification of East Pacific Madden Julian Oscillation Convection and Wind Anomalies during June November
 3482 JOURNAL OF CLIMATE VOLUME 16 The Amplification of East Pacific Madden Julian Oscillation Convection and Wind Anomalies during June November ERIC. D.MALONEY AND STEVEN K. ESBENSEN College of Oceanic
ENSO Cycle: Recent Evolution, Current Status and Predictions. Update prepared by Climate Prediction Center / NCEP 23 April 2012
 ENSO Cycle: Recent Evolution, Current Status and Predictions Update prepared by Climate Prediction Center / NCEP 23 April 2012 Outline Overview Recent Evolution and Current Conditions Oceanic Niño Index
Moist static energy budget diagnostics for. monsoon research. H. Annamalai
 Moist static energy budget diagnostics for monsoon research H. Annamalai JJAS Precipitation and SST Climatology I III II Multiple regional heat sources - EIO and SPCZ still experience high precipitation
A "New" Mechanism for the Diurnal Variation of Convection over the Tropical Western Pacific Ocean
 A "New" Mechanism for the Diurnal Variation of Convection over the Tropical Western Pacific Ocean D. B. Parsons Atmospheric Technology Division National Center for Atmospheric Research (NCAR) Boulder,
Moisture Asymmetry and MJO Eastward Propagation in an Aquaplanet General Circulation Model*
 1DECEMBER 2014 H S U E T A L. 8747 Moisture Asymmetry and MJO Eastward Propagation in an Aquaplanet General Circulation Model* PANG-CHI HSU AND TIM LI CDRC/ESMC, International Laboratory on Climate and
Climate Modeling Issues at GFDL on the Eve of AR5
 Climate Modeling Issues at GFDL on the Eve of AR5 Leo Donner, Chris Golaz, Yi Ming, Andrew Wittenberg, Bill Stern, Ming Zhao, Paul Ginoux, Jeff Ploshay, S.J. Lin, Charles Seman CPPA PI Meeting, 29 September
Observed Characteristics of the MJO Relative to Maximum Rainfall
 2332 J O U R N A L O F T H E A T M O S P H E R I C S C I E N C E S VOLUME 64 Observed Characteristics of the MJO Relative to Maximum Rainfall JAMES J. BENEDICT AND DAVID A. RANDALL Department of Atmospheric
ENSO Cycle: Recent Evolution, Current Status and Predictions. Update prepared by Climate Prediction Center / NCEP 11 November 2013
 ENSO Cycle: Recent Evolution, Current Status and Predictions Update prepared by Climate Prediction Center / NCEP 11 November 2013 Outline Overview Recent Evolution and Current Conditions Oceanic Niño Index
MINORU CHIKIRA. Research Institute for Global Change, JAMSTEC, Yokohama, Japan. (Manuscript received 4 February 2013, in final form 12 September 2013)
") FEBRUARY 2014 C H I K I R A 615 Eastward-Propagating Intraseasonal Oscillation Represented by Chikira Sugiyama Cumulus Parameterization. Part II: Understanding Moisture Variation under Weak Temperature
FEBRUARY 2014 C H I K I R A 615 Eastward-Propagating Intraseasonal Oscillation Represented by Chikira Sugiyama Cumulus Parameterization. Part II: Understanding Moisture Variation under Weak Temperature
ENSO Cycle: Recent Evolution, Current Status and Predictions. Update prepared by Climate Prediction Center / NCEP 15 July 2013
 ENSO Cycle: Recent Evolution, Current Status and Predictions Update prepared by Climate Prediction Center / NCEP 15 July 2013 Outline Overview Recent Evolution and Current Conditions Oceanic Niño Index
An Introduction to Physical Parameterization Techniques Used in Atmospheric Models
 An Introduction to Physical Parameterization Techniques Used in Atmospheric Models J. J. Hack National Center for Atmospheric Research Boulder, Colorado USA Outline Frame broader scientific problem Hierarchy
ENSO Cycle: Recent Evolution, Current Status and Predictions. Update prepared by Climate Prediction Center / NCEP 25 February 2013
 ENSO Cycle: Recent Evolution, Current Status and Predictions Update prepared by Climate Prediction Center / NCEP 25 February 2013 Outline Overview Recent Evolution and Current Conditions Oceanic Niño Index
ENSO Cycle: Recent Evolution, Current Status and Predictions. Update prepared by Climate Prediction Center / NCEP 5 August 2013
 ENSO Cycle: Recent Evolution, Current Status and Predictions Update prepared by Climate Prediction Center / NCEP 5 August 2013 Outline Overview Recent Evolution and Current Conditions Oceanic Niño Index
Structure of AGCM-Simulated Convectively. Coupled Kelvin Waves and Sensitivity to. Convective Parameterization
 Structure of AGCM-Simulated Convectively Coupled Kelvin Waves and Sensitivity to Convective Parameterization Dargan M. W. Frierson University of Washington Daehyun Kim Seoul National University In-Sik
Influence of cloud-radiation interaction on simulating tropical intraseasonal oscillation with an atmospheric general circulation model
 JOURNAL OF GEOPHYSICAL RESEARCH, VOL. 106, NO. D13, PAGES 14,219 14,233, JULY 16, 2001 Influence of cloud-radiation interaction on simulating tropical intraseasonal oscillation with an atmospheric general
Wind-driven latent heat flux and the intraseasonal oscillation
 GEOPHYSICAL RESEARCH LETTERS, VOL. 35, L04815, doi:10.1029/2007gl032746, 2008 Wind-driven latent heat flux and the intraseasonal oscillation Nilesh M. Araligidad 1 and Eric D. Maloney 1,2 Received 20 November
Large-Eddy Simulations of Tropical Convective Systems, the Boundary Layer, and Upper Ocean Coupling
 DISTRIBUTION STATEMENT A. Approved for public release; distribution is unlimited. Large-Eddy Simulations of Tropical Convective Systems, the Boundary Layer, and Upper Ocean Coupling Eric D. Skyllingstad
An Introduction to Climate Modeling
 An Introduction to Climate Modeling A. Gettelman & J. J. Hack National Center for Atmospheric Research Boulder, Colorado USA Outline What is Climate & why do we care Hierarchy of atmospheric modeling strategies
Impact of Resolution on Extended-Range Multi-Scale Simulations
 DISTRIBUTION STATEMENT A. Approved for public release; distribution is unlimited. Impact of Resolution on Extended-Range Multi-Scale Simulations Carolyn A. Reynolds Naval Research Laboratory Monterey,
the 2 past three decades
 SUPPLEMENTARY INFORMATION DOI: 10.1038/NCLIMATE2840 Atlantic-induced 1 pan-tropical climate change over the 2 past three decades 3 4 5 6 7 8 9 10 POP simulation forced by the Atlantic-induced atmospheric
Lecture #3: Gravity Waves in GCMs. Charles McLandress (Banff Summer School 7-13 May 2005)
") Lecture #3: Gravity Waves in GCMs Charles McLandress (Banff Summer School 7-13 May 2005) 1 Outline of Lecture 1. Role of GWs in the middle atmosphere 2. Background theory 3. Resolved GWs in GCMs 4. Parameterized
Lecture #3: Gravity Waves in GCMs Charles McLandress (Banff Summer School 7-13 May 2005) 1 Outline of Lecture 1. Role of GWs in the middle atmosphere 2. Background theory 3. Resolved GWs in GCMs 4. Parameterized
CHAPTER 2 DATA AND METHODS. Errors using inadequate data are much less than those using no data at all. Charles Babbage, circa 1850
 CHAPTER 2 DATA AND METHODS Errors using inadequate data are much less than those using no data at all. Charles Babbage, circa 185 2.1 Datasets 2.1.1 OLR The primary data used in this study are the outgoing
Understanding Predictability and Model Errors Through Light, Portable Pseudo-Assimilation and Experimental Prediction Techniques
 DISTRIBUTION STATEMENT A. Approved for public release; distribution is unlimited. Understanding Predictability and Model Errors Through Light, Portable Pseudo-Assimilation and Experimental Prediction Techniques
ENSO Cycle: Recent Evolution, Current Status and Predictions. Update prepared by Climate Prediction Center / NCEP 24 September 2012
 ENSO Cycle: Recent Evolution, Current Status and Predictions Update prepared by Climate Prediction Center / NCEP 24 September 2012 Outline Overview Recent Evolution and Current Conditions Oceanic Niño
An Introduction to Coupled Models of the Atmosphere Ocean System
 An Introduction to Coupled Models of the Atmosphere Ocean System Jonathon S. Wright jswright@tsinghua.edu.cn Atmosphere Ocean Coupling 1. Important to climate on a wide range of time scales Diurnal to
Toward Seamless Weather-Climate Prediction with a Global Cloud Resolving Model
 DISTRIBUTION STATEMENT A. Approved for public release; distribution is unlimited. Toward Seamless Weather-Climate Prediction with a Global Cloud Resolving Model PI: Tim Li IPRC/SOEST, University of Hawaii
Lindzen et al. (2001, hereafter LCH) present
 present") NO EVIDENCE FOR IRIS BY DENNIS L. HARTMANN AND MARC L. MICHELSEN Careful analysis of data reveals no shrinkage of tropical cloud anvil area with increasing SST AFFILIATION: HARTMANN AND MICHELSEN Department
NO EVIDENCE FOR IRIS BY DENNIS L. HARTMANN AND MARC L. MICHELSEN Careful analysis of data reveals no shrinkage of tropical cloud anvil area with increasing SST AFFILIATION: HARTMANN AND MICHELSEN Department
Stochastic convective parameterization
 deep Stochastic convective parameterization J. David Neelin and Johnny W.-B.. Lin* Dept. of Atmospheric Sciences & Inst. of Geophysics and Planetary Physics, U.C.L.A. *CIRES, Boulder, CO (now U. Chicago)
The Precipitating Cloud Population of the Madden-Julian Oscillation over the Indian and. West Pacific Oceans
 The Precipitating Cloud Population of the Madden-Julian Oscillation over the Indian and West Pacific Oceans Hannah C. Barnes and Robert A. Houze, Jr., Department of Atmospheric Sciences, University of
Effects of cloud-radiative heating on atmospheric general circulation model (AGCM) simulations of convectively coupled equatorial waves
 simulations of convectively coupled equatorial waves") JOURNAL OF GEOPHYSICAL RESEARCH, VOL. 112,, doi:10.1029/2006jd008291, 2007 Effects of cloud-radiative heating on atmospheric general circulation model (AGCM) simulations of convectively coupled equatorial
JOURNAL OF GEOPHYSICAL RESEARCH, VOL. 112,, doi:10.1029/2006jd008291, 2007 Effects of cloud-radiative heating on atmospheric general circulation model (AGCM) simulations of convectively coupled equatorial
University of Reading, Reading, United Kingdom. 2 Hadley Centre for Climate Prediction and Research, Meteorological Office, Exeter, United Kingdom.
 9.1 RUNNING A CLIMATE MODEL IN FORECAST MODE TO IDENTIFY THE SOURCE OF TROPICAL CLIMATE ERRORS: WITH SPECIFIC REFERENCE TO THE DRY BIAS OVER THE MARITIME CONTINENT IN AN ATMOSPHERE ONLY GCM 1 Jane Strachan,
Diagnosing the Climatology and Interannual Variability of North American Summer Climate with the Regional Atmospheric Modeling System (RAMS)
") Diagnosing the Climatology and Interannual Variability of North American Summer Climate with the Regional Atmospheric Modeling System (RAMS) Christopher L. Castro and Roger A. Pielke, Sr. Department of
Diagnosing the Climatology and Interannual Variability of North American Summer Climate with the Regional Atmospheric Modeling System (RAMS) Christopher L. Castro and Roger A. Pielke, Sr. Department of
Diurnal Timescale Feedbacks in the Tropical Cumulus Regime
 DYNAMO Sounding Array Diurnal Timescale Feedbacks in the Tropical Cumulus Regime James Ruppert Max Planck Institute for Meteorology, Hamburg, Germany GEWEX CPCM, Tropical Climate Part 1 8 September 2016
Development of a Coupled Atmosphere-Ocean-Land General Circulation Model (GCM) at the Frontier Research Center for Global Change
 at the Frontier Research Center for Global Change") Chapter 1 Atmospheric and Oceanic Simulation Development of a Coupled Atmosphere-Ocean-Land General Circulation Model (GCM) at the Frontier Research Center for Global Change Project Representative Tatsushi
Chapter 1 Atmospheric and Oceanic Simulation Development of a Coupled Atmosphere-Ocean-Land General Circulation Model (GCM) at the Frontier Research Center for Global Change Project Representative Tatsushi
Zonal Momentum Balance in the Tropical Atmospheric Circulation during the Global Monsoon Mature Months
 FEBRUARY 2013 Y A N G E T A L. 583 Zonal Momentum Balance in the Tropical Atmospheric Circulation during the Global Monsoon Mature Months WENCHANG YANG, RICHARD SEAGER, AND MARK A. CANE Lamont-Doherty
Convective scheme and resolution impacts on seasonal precipitation forecasts
 GEOPHYSICAL RESEARCH LETTERS, VOL. 30, NO. 20, 2078, doi:10.1029/2003gl018297, 2003 Convective scheme and resolution impacts on seasonal precipitation forecasts D. W. Shin, T. E. LaRow, and S. Cocke Center
Development of a High-Resolution Coupled Atmosphere-Ocean-Land General Circulation Model for Climate System Studies
 Chapter 1 Earth Science Development of a High-Resolution Coupled Atmosphere-Ocean-Land General Circulation Model for Climate System Studies Project Representative Tatsushi Tokioka Frontier Research Center
ENSO: Recent Evolution, Current Status and Predictions. Update prepared by: Climate Prediction Center / NCEP 9 November 2015
 ENSO: Recent Evolution, Current Status and Predictions Update prepared by: Climate Prediction Center / NCEP 9 November 2015 Outline Summary Recent Evolution and Current Conditions Oceanic Niño Index (ONI)
Correspondence between short and long timescale systematic errors in CAM4/CAM5 explored by YOTC data
 Correspondence between short and long timescale systematic errors in CAM4/CAM5 explored by YOTC data Hsi-Yen Ma In collaboration with Shaocheng Xie, James Boyle, Stephen Klein, and Yuying Zhang Program
The Planetary Circulation System
 12 The Planetary Circulation System Learning Goals After studying this chapter, students should be able to: 1. describe and account for the global patterns of pressure, wind patterns and ocean currents
Air-Sea Interaction and the MJO
 Air-Sea Interaction and the MJO Julia Slingo with thanks to Dan Bernie, Eric Guilyardi, Pete Inness, Hilary Spencer and Steve Woolnough NCAS Centre for Global Atmospheric Modelling University of Reading
Seasonal march and intraseasonal variability of the moist static energy budget over the eastern Maritime Continent during CINDY2011/DYNAMO
 1 2 3 Seasonal march and intraseasonal variability of the moist static energy budget over the eastern Maritime Continent during CINDY2011/DYNAMO 4 5 6 Satoru Yokoi Japan Agency for Marine Earth Science
WaVaCS summerschool Autumn 2009 Cargese, Corsica
 Introduction Part I WaVaCS summerschool Autumn 2009 Cargese, Corsica Holger Tost Max Planck Institute for Chemistry, Mainz, Germany Introduction Overview What is a parameterisation and why using it? Fundamentals
East-west SST contrast over the tropical oceans and the post El Niño western North Pacific summer monsoon
 GEOPHYSICAL RESEARCH LETTERS, VOL. 32, L15706, doi:10.1029/2005gl023010, 2005 East-west SST contrast over the tropical oceans and the post El Niño western North Pacific summer monsoon Toru Terao Faculty
The Tropical Subseasonal Variability Simulated in the NASA GISS General Circulation Model
 1JULY 2012 K I M E T A L. 4641 The Tropical Subseasonal Variability Simulated in the NASA GISS General Circulation Model DAEHYUN KIM,* ADAM H. SOBEL,*,1,# ANTHONY D. DEL GENIO, @ YONGHUA CHEN, 1,@ SUZANA
Lecture 8: Natural Climate Variability
 Lecture 8: Natural Climate Variability Extratropics: PNA, NAO, AM (aka. AO), SAM Tropics: MJO Coupled A-O Variability: ENSO Decadal Variability: PDO, AMO Unforced vs. Forced Variability We often distinguish
Towards Stochastic Deep Convective Parameterization
 Towards Stochastic Deep Convective Parameterization Johnny Wei-Bing Lin and J. David Neelin University of Chicago, Department of the Geophysical Sciences 5734 S. Ellis Ave., Chicago, IL 60637, USA jlin@geosci.uchicago.edu
Large-Eddy Simulations of Tropical Convective Systems, the Boundary Layer, and Upper Ocean Coupling
 DISTRIBUTION STATEMENT A. Approved for public release; distribution is unlimited. Large-Eddy Simulations of Tropical Convective Systems, the Boundary Layer, and Upper Ocean Coupling Eric D. Skyllingstad
Leveraging the MJO for Predicting Envelopes of Tropical Wave and Synoptic Activity at Multi-Week Lead Times
 DISTRIBUTION STATEMENT A. Approved for public release; distribution is unlimited. Leveraging the MJO for Predicting Envelopes of Tropical Wave and Synoptic Activity at Multi-Week Lead Times Dr. Duane Waliser
Charles Jones ICESS University of California, Santa Barbara CA Outline
 The Influence of Tropical Variations on Wintertime Precipitation in California: Pineapple express, Extreme rainfall Events and Long-range Statistical Forecasts Charles Jones ICESS University of California,
Parameterizing large-scale dynamics using the weak temperature gradient approximation
 Parameterizing large-scale dynamics using the weak temperature gradient approximation Adam Sobel Columbia University NCAR IMAGe Workshop, Nov. 3 2005 In the tropics, our picture of the dynamics should
On Improving Precipitation Diurnal Cycle and Frequency in Global Climate Models
 On Improving Precipitation Diurnal Cycle and Frequency in Global Climate Models Xiaoqing Wu Department of Geological and Atmospheric Sciences Iowa State University (ISU) The YOTC International Science
ENSO: Recent Evolution, Current Status and Predictions. Update prepared by: Climate Prediction Center / NCEP 30 October 2017
 ENSO: Recent Evolution, Current Status and Predictions Update prepared by: Climate Prediction Center / NCEP 30 October 2017 Outline Summary Recent Evolution and Current Conditions Oceanic Niño Index (ONI)
CMIP Diagnostic Subproject Proposal. Synoptic to Intraseasonal Variability. Kenneth R. Sperber 1 and Julia M. Slingo 2
 CMIP Diagnostic Subproject Proposal Synoptic to Intraseasonal Variability Kenneth R. Sperber 1 and Julia M. Slingo 2 1 Program for Climate Model Diagnosis and Intercomparison, LLNL, CA, USA (sperber@space.llnl.gov)
PUBLICATIONS. Journal of Geophysical Research: Atmospheres. Diagnosing MJO hindcast biases in NCAR CAM3 using nudging during the DYNAMO field campaign
 PUBLICATIONS Journal of Geophysical Research: Atmospheres RESEARCH ARTICLE Key Points: Evaluate MJO hindcast performance Relate MJO hindcast biases to model physics parameterizations Understand MJO mechanisms
Impacts of Cumulus Convection Parameterization on Aqua-planet AGCM Simulations of Tropical Intraseasonal Variability
 Journal of the Meteorological Society of Japan, Vol. 81, No. 5, pp. 963--992, 2003 963 Impacts of Cumulus Convection Parameterization on Aqua-planet AGCM Simulations of Tropical Intraseasonal Variability
A moist static energy budget analysis of the MJO in the Superparameterized Community Atmosphere Model
 A moist static energy budget analysis of the MJO in the Superparameterized Community Atmosphere Model Mike Pritchard University of Washington in collaboration w. Chris Bretherton & The Center for Multiscale
Impact of different cumulus parameterizations on the numerical simulation of rain over southern China
 Impact of different cumulus parameterizations on the numerical simulation of rain over southern China P.W. Chan * Hong Kong Observatory, Hong Kong, China 1. INTRODUCTION Convective rain occurs over southern
General Circulation. Nili Harnik DEES, Lamont-Doherty Earth Observatory
 General Circulation Nili Harnik DEES, Lamont-Doherty Earth Observatory nili@ldeo.columbia.edu Latitudinal Radiation Imbalance The annual mean, averaged around latitude circles, of the balance between the
The Madden-Julian Oscillation in General Circulation Models
 The Madden-Julian Oscillation in General Circulation Models Kenneth R. Sperber 1, Julia M. Slingo 2, Peter M. Inness 2, Silvio Gualdi 3, Wei Li 4, Peter J. Gleckler 1, Charles Doutriaux 1 and the AMIP
Daehyun Kim. *GCRM (global cloud resolving model): Next talk
: Next talk") Daehyun Kim *GCRM (global cloud resolving model): Next talk No satisfactory theory that everyone agrees Inadequate simulation capability in most of the standard GCMs Slingo et al. 1996: models are poor
Daehyun Kim *GCRM (global cloud resolving model): Next talk No satisfactory theory that everyone agrees Inadequate simulation capability in most of the standard GCMs Slingo et al. 1996: models are poor
ANALYSIS OF THE MPAS CONVECTIVE-PERMITTING PHYSICS SUITE IN THE TROPICS WITH DIFFERENT PARAMETERIZATIONS OF CONVECTION REMARKS AND MOTIVATIONS
 ANALYSIS OF THE MPAS CONVECTIVE-PERMITTING PHYSICS SUITE IN THE TROPICS WITH DIFFERENT PARAMETERIZATIONS OF CONVECTION Laura D. Fowler 1, Mary C. Barth 1, K. Alapaty 2, M. Branson 3, and D. Dazlich 3 1
Jet Propulsion Laboratory, California Institute of Technology, Pasadena, California YUK L. YUNG
 4576 M O N T H L Y W E A T H E R R E V I E W VOLUME 138 Vertical Moist Thermodynamic Structure of the Madden Julian Oscillation in Atmospheric Infrared Sounder Retrievals: An Update and a Comparison to
Unified Cloud and Mixing Parameterizations of the Marine Boundary Layer: EDMF and PDF-based cloud approaches
 DISTRIBUTION STATEMENT A. Approved for public release; distribution is unlimited. Unified Cloud and Mixing Parameterizations of the Marine Boundary Layer: EDMF and PDF-based cloud approaches Joao Teixeira
Key Physics of the Madden-Julian Oscillation Based on Multi-model Simulations
 Key Physics of the Madden-Julian Oscillation Based on Multi-model Simulations Xianan Jiang Joint Institute for Regional Earth System Sci. & Engineering / Univ. of California, Los Angeles Jet Propulsion
ATS 421/521. Climate Modeling. Spring 2015
 ATS 421/521 Climate Modeling Spring 2015 Lecture 9 Hadley Circulation (Held and Hou, 1980) General Circulation Models (tetbook chapter 3.2.3; course notes chapter 5.3) The Primitive Equations (tetbook
Short Term forecasts along the GCSS Pacific Cross-section: Evaluating new Parameterizations in the Community Atmospheric Model
 Short Term forecasts along the GCSS Pacific Cross-section: Evaluating new Parameterizations in the Community Atmospheric Model Cécile Hannay, Dave Williamson, Jerry Olson, Rich Neale, Andrew Gettelman,
Surface Fluxes and Ocean Coupling in the Tropical Intraseasonal Oscillation
 4368 JOURNAL OF CLIMATE Surface Fluxes and Ocean Coupling in the Tropical Intraseasonal Oscillation ERIC D. MALONEY College of Oceanic and Atmospheric Sciences, Oregon State University, Corvallis, Oregon
Tropospheric Moisture: The Crux of the MJO?
 Tropospheric Moisture: The Crux of the MJO? Chidong Zhang RSMAS, University of Miami ICGPSRO2013, May 14 16, 2013 Madden and Julian 1972 Precipitation Global Impacts of the MJO on Weather and Climate MJO
Characteristics of extreme convection over equatorial America and Africa
 Characteristics of extreme convection over equatorial America and Africa Manuel D. Zuluaga, K. Rasmussen and R. A. Houze Jr. Atmospheric & Climate Dynamics Seminar Department of Atmospheric Sciences, University
Dynamics and Kinematics
 Geophysics Fluid Dynamics () Syllabus Course Time Lectures: Tu, Th 09:30-10:50 Discussion: 3315 Croul Hall Text Book J. R. Holton, "An introduction to Dynamic Meteorology", Academic Press (Ch. 1, 2, 3,
PUBLICATIONS. Journal of Advances in Modeling Earth Systems
 PUBLICATIONS Journal of Advances in Modeling Earth Systems RESEARCH ARTICLE./7MS9 Key Points: The changes in surface forcing induce a weakening of the largescale circulation which systematically modulates
2. Meridional atmospheric structure; heat and water transport. Recall that the most primitive equilibrium climate model can be written
 2. Meridional atmospheric structure; heat and water transport The equator-to-pole temperature difference DT was stronger during the last glacial maximum, with polar temperatures down by at least twice
Geophysics Fluid Dynamics (ESS228)
") Geophysics Fluid Dynamics (ESS228) Course Time Lectures: Tu, Th 09:30-10:50 Discussion: 3315 Croul Hall Text Book J. R. Holton, "An introduction to Dynamic Meteorology", Academic Press (Ch. 1, 2, 3, 4,
Geophysics Fluid Dynamics (ESS228) Course Time Lectures: Tu, Th 09:30-10:50 Discussion: 3315 Croul Hall Text Book J. R. Holton, "An introduction to Dynamic Meteorology", Academic Press (Ch. 1, 2, 3, 4,
4.4 EVALUATION OF AN IMPROVED CONVECTION TRIGGERING MECHANISM IN THE NCAR COMMUNITY ATMOSPHERE MODEL CAM2 UNDER CAPT FRAMEWORK
 . EVALUATION OF AN IMPROVED CONVECTION TRIGGERING MECHANISM IN THE NCAR COMMUNITY ATMOSPHERE MODEL CAM UNDER CAPT FRAMEWORK Shaocheng Xie, James S. Boyle, Richard T. Cederwall, and Gerald L. Potter Atmospheric
Testing the Hypothesis that the MJO is a Mixed Rossby Gravity Wave Packet
 226 J O U R N A L O F T H E A T M O S P H E R I C S C I E N C E S VOLUME 68 Testing the Hypothesis that the MJO is a Mixed Rossby Gravity Wave Packet DA YANG AND ANDREW P. INGERSOLL Division of Geological
MJO modeling and Prediction
 MJO modeling and Prediction In-Sik Kang Seoul National University, Korea Madden & Julian Oscillation (MJO) index Composite: OLR & U850 RMM index based on Leading PCs of Combined EOF (OLR, U850, U200) P-1
Evaluating parameterized variables in the Community Atmospheric Model along the GCSS Pacific cross-section
 Evaluating parameterized variables in the Community Atmospheric Model along the GCSS Pacific cross-section Cécile Hannay, Dave Williamson, Rich Neale, Jerry Olson, Dennis Shea National Center for Atmospheric
Introduction of products for Climate System Monitoring
 Introduction of products for Climate System Monitoring 1 Typical flow of making one month forecast Textbook P.66 Observed data Atmospheric and Oceanic conditions Analysis Numerical model Ensemble forecast
KUALA LUMPUR MONSOON ACTIVITY CENT
 T KUALA LUMPUR MONSOON ACTIVITY CENT 2 ALAYSIAN METEOROLOGICAL http://www.met.gov.my DEPARTMENT MINISTRY OF SCIENCE. TECHNOLOGY AND INNOVATIO Introduction Atmospheric and oceanic conditions over the tropical
Geophysical Research Letters
 RESEARCH LETTER Key Points: CCEW phase speeds tend to shift as one would expect based on Doppler effects Observed CCEW amplitudes vary strongly by season and basin Observed CCEWs equivalent depths are
The feature of atmospheric circulation in the extremely warm winter 2006/2007
 The feature of atmospheric circulation in the extremely warm winter 2006/2007 Hiroshi Hasegawa 1, Yayoi Harada 1, Hiroshi Nakamigawa 1, Atsushi Goto 1 1 Climate Prediction Division, Japan Meteorological
NSF 2005 CPT Report. Jeffrey T. Kiehl & Cecile Hannay
 NSF 2005 CPT Report Jeffrey T. Kiehl & Cecile Hannay Introduction: The focus of our research is on the role of low tropical clouds in affecting climate sensitivity. Comparison of climate simulations between
What you need to know in Ch. 12. Lecture Ch. 12. Atmospheric Heat Engine
 Lecture Ch. 12 Review of simplified climate model Revisiting: Kiehl and Trenberth Overview of atmospheric heat engine Current research on clouds-climate Curry and Webster, Ch. 12 For Wednesday: Read Ch.
Spectral cumulus parameterization based on cloud resolving model
 Climate Dynamics https://doi.org/10.1007/s00382-018-4137-z Spectral cumulus parameterization based on cloud resolving model Yuya Baba 1 Received: 7 November 2017 / Accepted: 12 February 2018 The Author(s)
5. General Circulation Models
 5. General Circulation Models I. 3-D Climate Models (General Circulation Models) To include the full three-dimensional aspect of climate, including the calculation of the dynamical transports, requires