CHANDRA X-RAY OBSERVATIONS OF THE 0.6 < z < 1.1 RED-SEQUENCE CLUSTER SURVEY SAMPLE
|
|
|
- Lee Byrd
- 5 years ago
- Views:
Transcription
1 The Astrophysical Journal, 680: , 2008 June 20 # The American Astronomical Society. All rights reserved. Printed in U.S.A. A CHANDRA X-RAY OBSERVATIONS OF THE 0.6 < z < 1.1 RED-SEQUENCE CLUSTER SURVEY SAMPLE A. K. Hicks Department of Astronomy, University of Virginia, Charlottesville, VA 22904; ahicks@alum.mit.edu E. Ellingson Center for Astrophysics and Space Astronomy, University of Colorado, Boulder, CO 80309; elling@casa.colorado.edu M. Bautz MIT Kavli Institute for Astrophysics and Space Research, Cambridge, MA 02139; mwb@space.mit.edu B. Cain MIT Kavli Institute for Astrophysics and Space Research, Cambridge, MA 02139; bcain@mit.edu D. G. Gilbank Department of Astronomy and Astrophysics, University of Toronto, Toronto, ON M5S 3H4, Canada; dgilbank@astro.uwaterloo.ca M. G. Gladders Department of Astronomy and Astrophysics, University of Chicago, Chicago, IL 60637; gladders@uchicago.edu H. Hoekstra Alfred P. Sloan Research Fellow, Department of Physics and Astronomy, University of Victoria, Victoria, BC V8P 5C2, Canada; hoekstra@uvic.ca H. K. C. Yee Department of Astronomy and Astrophysics, University of Toronto, Toronto, ON M5S 3H4, Canada; hyee@astro.utoronto.ca and G. Garmire Department of Astronomy and Astrophysics, Pennsylvania State University, University Park, PA 16802; garmire@astro.psu.edu Received 2007 October 29; accepted 2008 January 20 ABSTRACT We present the results of Chandra observations of 13 optically selected clusters with 0:6 < z < 1:1, discovered via the Red-Sequence Cluster Survey (RCS). All but one are detected at S/N > 3, although three were not observed long enough to support detailed analysis. Surface brightness profiles are fitted to models. Integrated spectra are extracted within R 2500, and T X and L X information is obtained. We derive gas masses and total masses within R 2500 and R 500. Cosmologically corrected scaling relations are investigated, and we find the RCS clusters to be consistent with selfsimilar scaling expectations. However, discrepancies exist between the RCS sample and lower z X-ray selected samples for relationships involving L X, with the higher z RCS clusters having lower L X for a given T X. In addition, we find that gas mass fractions within R 2500 for the high-z RCS sample are lower than expected by a factor of 2. This suggests that the central entropy of these high-z objects has been elevated by processes such as preheating, mergers, and/or AGN outbursts, that their gas is still infalling, or that they contain comparatively more baryonic matter in the form of stars. Finally, relationships between red-sequence optical richness (B gc;red ) and X-ray properties are fitted to the data. For systems with measured T X, we find that optical richness correlates with both T X and mass, having a scatter of 30% with mass for both X-ray selected and optically selected clusters. However, we also find that X-ray luminosity is not well correlated with richness and that several of our sample members appear to be significantly X-ray faint. Subject headinggs: cosmology: observations galaxies: clusters: general X-rays: galaxies: clusters Online material: color figures 1. INTRODUCTION The Extended Medium Sensitivity Survey ( EMSS; Gioia et al. 1990) sparked renewed interest in the ongoing search for clusters of galaxies at high redshift. Since then, numerous high-redshift surveys have been carried out, both optically (e.g., Gilbank et al. 2004; Donahue et al. 2002; Postman et al. 1996; Bower et al. 1994) and in the X-ray (e.g., Valtchanov et al. 2004; Bauer et al. 2002; 1022 Wilkes et al. 2000). The motivations for such searches are multifaceted, but the most compelling of these are cosmological in nature. Clusters of galaxies are an important source of information about the underlying cosmology of the universe. They are considered to be essentially closed boxes, meaning that the primordial matter that they were initially assembled from has remained trapped in their deep potential wells since they were formed. This
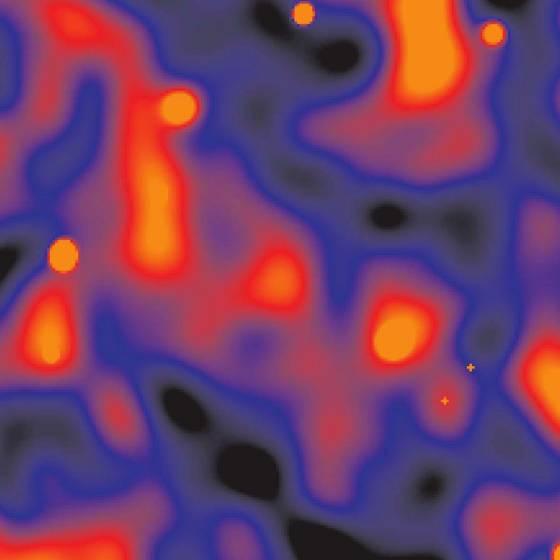
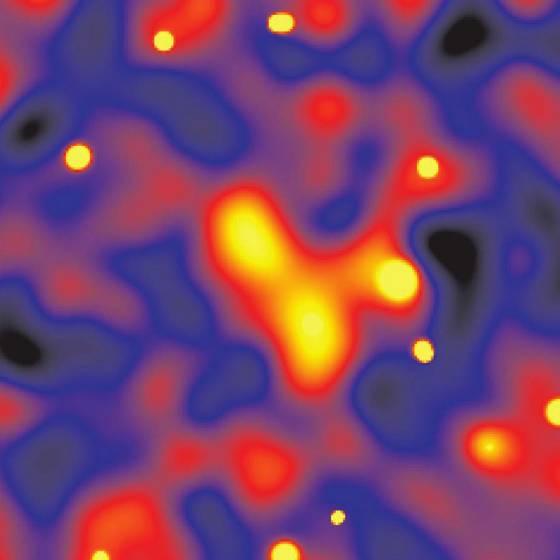
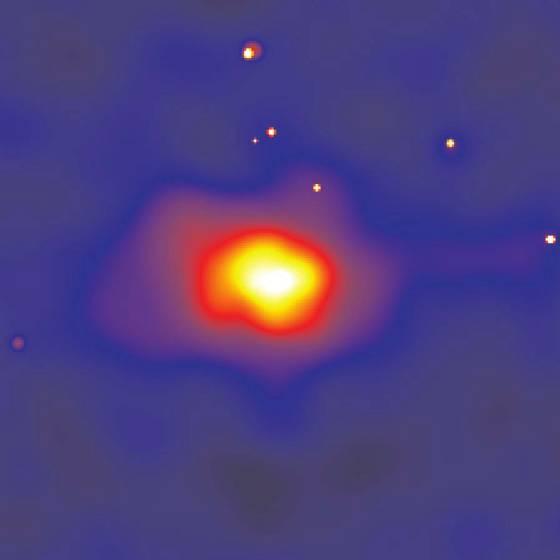
2 X-RAY OBSERVATIONS OF HIGH-REDSHIFT CLUSTERS 1023 makes them ideal objects with which to study galaxy formation and evolution. In addition, clusters are the largest virialized objects in the universe. By virtue of this fact we are able, through high-redshift samples, to investigate the growth of large-scale structure. A firm knowledge of the evolution of the cluster mass function would provide an enormous contribution to constraining cosmological parameters such as 8 (the normalization of the density perturbation spectrum) and w (the dark energy equation of state; e.g., Voit 2005). Two ingredients are required to achieve this goal. First, a statistically significant sample of clusters in multiple redshift bins is needed. Second, reliable mass estimates of the clusters in that sample must be obtained. Difficulties in reaching the first requirement include the vast amount of telescope time required to carry out such a search in the X-ray and the propensity for false detections due to projection effects in optical surveys. The primary challenge in reaching the second part of this goal is again the high cost of observing time to achieve either X-ray or dynamical mass estimates. The Red-Sequence Cluster Survey ( RCS; Gladders & Yee 2000, 2005; Yee et al. 2007) has attempted to evade such difficulties: RCS is an optical survey that uses the color-magnitude relationship of cluster ellipticals to find galactic overdensities in small slices of redshift space. This technique has been estimated to bring false detection rates down to 5% 10% (Gladders 2002; Blindert et al. 2007; Cohn et al. 2007). The chosen filters (R c and z 0 ) optimize this finding algorithm for the redshift range 0:2 < z < 1:2 and provide photometric redshift information with accuracies of 10%. In addition, optical richness information is immediately available from the survey data, and, if sufficiently calibrated, this information could provide a highly efficient way to estimate the masses of cluster candidates. The first phase of the Red-Sequence Cluster Survey (RCS-1; Gladders & Yee 2005), from which our cluster sample was drawn, covers 90 deg 2 and was performed at the Canada-France-Hawaii Telescope (CFHT) and the Cerro Tololo Inter-American Observatory (CTIO). RCS-1 has identified 6483 cluster candidates in the redshift range 0:2 < z < 1:2, over 1000 of which are at least as optically rich as Abell class 0 clusters (Gladders & Yee 2005). The motivations for this work are to characterize high-redshift optically selected cluster samples, probe cluster evolution, and move forward in attempts to calibrate a robust relationship between optical richness and cluster mass. This paper presents a detailed analysis of the Chandra data of 13 RCS-1 clusters with redshifts in the range 0:6 < z < 1:1. Our analysis investigates the temperatures and gas distributions of 10 of these clusters and provides mass estimates for use in the calibration of relationships between optical richness and cluster mass. We also use our results to investigate the X-ray scaling laws of our sample and thereby probe redshift evolution in these relationships. To facilitate comparisons between the RCS clusters and lower redshift X-ray selected samples, we make use of our previous Chandra analysis of the Canadian Network for Observational Cosmology (CNOC) subsample of the EMSS (Hicks et al. 2006; Yee et al. 1996; Gioia et al. 1990). This sample, with redshifts in the range 0:1 < z < 0:6, was chosen based on X-ray luminosity (L X 2 ; ergs s 1 ; Gioia et al. 1990). This paper is organized as follows: In xx 2and3weintroduce our sample and describe the basic properties of our data. In xx 4 and 5 we investigate gas distributions and obtain cluster temperatures. We derive masses for our sample in x 6. High-z X-ray scaling relationships are examined in x 7, while correlations between optical richness and cluster X-ray properties are explored in x 8. In x 9 we investigate possible sources of bias in cluster sample selection. A summary and discussion of our results are presented in x 10. Unless otherwise noted, this paper assumes a cosmology of H 0 ¼ 70 km s 1 Mpc 1, M ¼ 0:3, and ¼ 0:7. All errors are quoted at 68% confidence levels. 2. CLUSTER SAMPLE AND OBSERVATIONS Chandra Advanced CCD Imaging Spectrometer (ACIS) observations of 13 RCS clusters were taken during the period 2002 April October 23. Twelve of these clusters were observed with the ACIS-S CCD array, and one was observed with ACIS-I, with an overall range in individual exposures of ks. Seven of the clusters in this sample were observed on multiple occasions. All multiple observations were merged for imaging analysis to provide higher overall signal-to-noise ratios (S/ Ns). Those clusters with t obs 3 months between observations were merged for spectral analysis as well. Each of the observations analyzed in this study possesses a focal plane temperature of 120 C. Aspect solutions were examined for irregularities, and none were found. Background contamination due to charged particle flares was reduced by removing time intervals during which the background rate exceeded the average background rate by more than 20%. The quiescent background was further reduced by using VFAINT mode. The event files were then filtered on standard grades and bad pixels were removed. Table 1 provides a list of each of the clusters in our sample, including their precise designation (hereafter shortened for simplicity), redshift, ObsID, and corrected exposure information for each observation. After the initial cleaning of each data set, kev images, instrument maps, and exposure maps were created using the CIAO tool MERGE_ALL. Data with energies below 0.3 kev and above 7.0 kev were excluded due to uncertainties in the ACIS calibration and background contamination, respectively. Ideally, all data below 0.6 kev would have been excluded to minimize low-energy uncertainties; however, the combined faintness and high redshifts of our objects require the utilization of lower energy photons as well. Point-source detection was performed by running the tools WTRANSFORM and WRECON on the flux images. Figure 1 contains smoothed kev Chandra flux images of each of the clusters in our sample (produced by the CIAO tool CSMOOTH), including a combined image of the three objects at z 0:9 that belong to a supercluster in the 23 h field (Gilbank et al. 2008). As seen in the figure, this sample covers a wide range of cluster X-ray morphology, from very regular objects (e.g., RCS ), through well-detected clusters with significant substructure (e.g., RCS ), all the way to very disturbed systems (e.g., RCS ). It is worth noting that in Figure 1 the brightest part of RCS does not seem to lie at the center of the cluster, indicating that this object may have recently undergone a merger, or could at least possess an appreciable amount of substructure. Together, these clusters represent an assembly of some of the richest high-z (0:6 < z < 1:1) clusters in the RCS-1 survey. 3. SIGNAL-TO-NOISE RATIOS AND CLUSTER POSITIONS To estimate the significance of RCS cluster detections in the X-ray, we made use of relatively simple statistics. Counts were extracted from a 500 h 1 70 kpc radius region around the aim point of each observation in the kev band (C) and also from a region far away from the aim point on the same chip that served as a background (B). Obvious point sources were removed from each region. S/ Ns were calculated based on dividing net counts, N ¼ C B, by the standard deviation, ¼ (C þ B) 1 =2.Using
3 1024 HICKS ET AL. TABLE 1 Cluster Sample Cluster z 1 00 Individual Exposure (h 1 70 kpc) ObsID (s) Total Exposure (s) RCS a a RCS b b RCS c c RCS d d RCS c e RCS f f RCS c RCS g RCS g,h g,h RCS f RCS i ( RCS )... (0.904) i (7.80) ( RCS )... (0.901) i (7.79) (0.901) i (7.79) a Hicks et al. (2007). b Cain et al. (2008). c Gilbank et al. (2007). d From photometric data (Gladders & Yee 2005). This cluster may be at z 1:01 (see text for explanation). e ACIS-I observation. f From X-ray spectra (this work); see text. g L. F. Barrientos et al. (2008, in preparation). h ID uncertain (see L. F. Barrientos et al. 2008, in preparation). i Gilbank et al. (2008). this method, 12 cluster signals were detected at an S/N greater than 3, with the remaining object detected at S/N ¼ 1:1(Table2). Using adaptively smoothed kev flux images ( Fig. 1), we determined the location of the X-ray emission peak of each cluster. The images of RCS and RCS appear to contain multiple regions of extended emission; therefore, we cannot determine a precise X-ray position for these objects. In the case of RCS , two RCS 13 h clusters lie in the field of view. The original observation was designed to observe a z ¼ 1:01 cluster at R:A: ¼ 13 h 26 m 29 s, decl: ¼þ (J2000.0). Our astrometry indicates, however, that we are most likely detecting the emission of a lower redshift RCS cluster (z ¼ 0:75) at an optical position of R:A: ¼ 13 h 26 m 31 s, decl: ¼ þ Because of the uncertainty surrounding this detection, we have carried both possibilities throughout much of our analysis; however, we include the more likely candidate (at z ¼ 0:75) in our subsequent fitting and plots. All other clusters (with the exceptions of RCS and RCS ) were found within of their optical positions. Table 2 lists optical positions, X-ray positions, net counts within 500 h 1 70 kpc, and S/Ns derived from the method described above. 4. SURFACE BRIGHTNESS A radial surface brightness profile was computed over the range kev in circular annuli for each cluster. These profiles were then fitted with models: Ir ðþ¼i B þ I 0 1þ r 2 3þ1=2 rc 2 ; ð1þ where I B is a constant representing the surface brightness contribution of the background, I 0 is the normalization, and r c is the core radius. Fits were performed to just past the radii at which the cluster s surface brightness met the background (usually ). The parameters of the best-fitting models of the 10 clusters for which surface brightness fitting was possible are shown in Table 3, and images of these fits are given in Figure 2. Although many of the clusters exhibit hints of substructure, most were reasonably well fitted by a model (see Table 3 for goodness-of-fit data). Other than somewhat low normalizations, the results of surface brightness fitting are unremarkable (0:51 <<0:72), except in the two cases of RCS ( ¼ 1:04), which lies at the edge of our detection threshold ( Table 2), and RCS , which appears to not be completely relaxed, as its brightest emission is slightly offset from the center of its extended emission (Fig. 1). 5. SPECTRAL ANALYSIS 5.1. Integrated Spectral Fits and R 2500 Spectra were extracted from each point-source removed event file in a circular region with a 300 h 1 70 kpc radius. In the cases of RCS and RCS (t obs > 2 yr), individual spectra were extracted from each ObsID and fitted simultaneously. The spectra were analyzed with XSPEC (Arnaud 1996), using weighted response matrices (RMFs) and effective area files (ARFs) generated with the CIAO tool SPECEXTRACT and CALDB Background spectra were extracted from the aimpoint chip as far away from the aim point as possible. Spectra were fitted with single-temperature spectral models, inclusive of foreground absorption. Each spectrum was fitted with the absorbing column frozen at its measured value (Dickey &


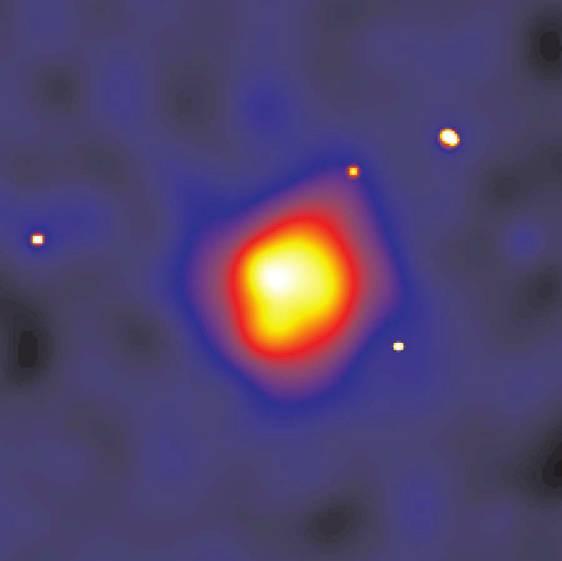
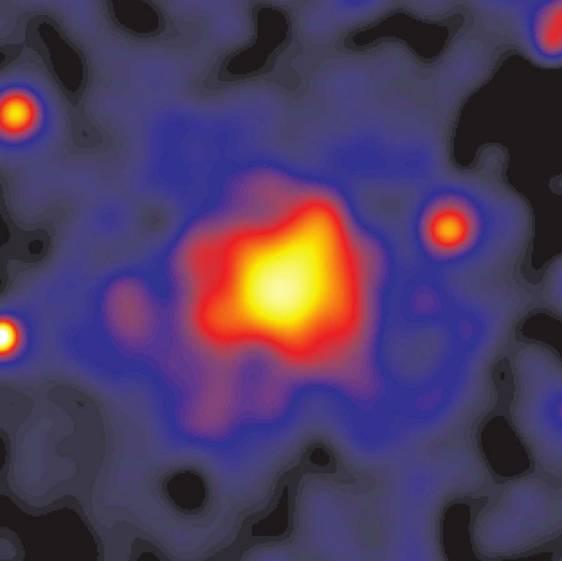
4 Fig. 1. Adaptively smoothed X-ray flux images of our sample in the kev band. Circles denote calculated values of R 2500 for each cluster. The three single cluster images that lack circles did not contain enough cluster signal to constrain a model or a temperature and thus lack estimates of R In each image, north is up and east is to the left. The last image shows the three clusters that make up the z ¼ 0:9 supercluster in the 23 h field. The aim-point cluster ( RCS ) lies at the top of the image on the back-side illuminated CCD ACIS-S3, and the other two clusters ( RCS and RCS ) lie on the front-side illuminated CCD ACIS-S2. Instrumental differences in the two chips cause their respective backgrounds to have slightly different values in the image.

5 Fig. 1 Continued 1026


6 Fig. 1 Continued TABLE 2 Cluster Positions and Detection Details Optical Position a X-Ray Position a Cluster R.A. Decl. R.A. Decl. Separation (arcsec) Net Counts b S/N RCS RCS RCS RCS c RCS RCS RCS RCS RCS RCS RCS RCS RCS Note. Units of right ascension are hours, minutes, and seconds, and units of declination are degrees, arcminutes, and arcseconds. a All positions are given for equinox J b The kev band, within R < 500 h 1 70 kpc. c There is also an RCS cluster at 13 h 26 m 29 s, , which is from the X-ray centroid (see text for details). TABLE 3 Model Fits Cluster r c (h 1 70 kpc) I 0 a a I B 2 /dof RCS RCS RCS RCS RCS RCS RCS RCS RCS RCS þ :72 þ0:04 0:04 7:1 þ0:4 0:4 2:33 þ0: þ8 7 0:59 þ0:04 0:04 5:2 þ0:4 0:3 3:80 þ0:03 31 þ2 2 0:51 0:01 þ0:01 62 þ5 4 2:5 þ0:1 148 þ11 9 1:04 þ0:08 0:06 3:4 þ0:3 0:2 2:97 þ0:03 52 þ2 2 0:60 0:01 þ0:01 85 þ :60 0:04 þ0: þ7 4 0:86 0:02 þ0: þ9 7 2:34 þ0:02 13:3 þ1 1 1:98 þ0:04 29 þ1 1 2:56 þ0: þ8 7 0:54 þ0:03 0:02 19:7 þ1:5 0:7 1:86 þ0: þ7 6 0:65 0:02 þ0:03 46 þ3 2 2:61 þ0: þ8 8 0:61 þ0:03 0:02 18:9 þ1:0 1:0 1:74 þ0:03 0: /199 0: /64 0: /191 0: /64 0: /155 0: /148 0: /300 0: /155 0: /155 0: /147 a Surface brightness I in units of 10 9 photons s 1 cm 2 arcsec
7 1028 HICKS ET AL. Vol. 680 Fig. 2. Radial surface brightness profiles for the kev band accumulated in annular bins for 10 clusters in our sample. A solid line traces the best-fitting model of each cluster. Horizontal dotted lines represent best-fit background values, and vertical dashed lines indicate R Many of the profiles exhibit some substructure; however, most were reasonably well fitted by a standard model (see Table 3 for goodness-of-fit data). Lockman 1990). Metal abundances were initially fixed at a value of 0.3 solar (Edge & Stewart 1991). Data with energies below 0.3 kev and above 7.0 kev were excluded from the fits. Three of the clusters did not possess enough counts to constrain a spectral fit. The results of the 10 successful fits, combined with best-fitting model parameters from x 4, were then used to estimate the value of R 2500 for each cluster. This is accomplished by combining the equation for total gravitating mass (Sarazin 1988) M tot ð<r Þ ¼ ktðþr r Gm ln r ln ln r (where m p is the mean mass per particle) with the definition of mass overdensity ð2þ where z is the cluster redshift and is the factor by which the density at r exceeds c (z), the critical density at z.here c (z)isgiven by c (z) ¼ 3H(z) 2 /8G ¼ 3H0 2E z 2/8G, where E z ¼½ m (1þz) 3 þ Š 1 =2. These equations are then combined with the density profile implied from the model (assuming hydrostatic equilibrium, spherical symmetry, and isothermality) gas (r) ¼ 0 1 þ r 2 3=2 ; ð4þ resulting in the equation sffiffiffiffiffiffiffiffiffiffiffiffiffiffiffiffiffiffiffiffiffiffiffiffiffiffiffiffiffiffiffiffiffiffiffiffiffiffiffiffiffiffiffiffiffiffiffiffiffiffiffiffiffiffiffiffiffi r 3kT ¼ r c Gm p ð4=3þ c ðþr z c 2 1 r 2 c ð5þ M tot ðr Þ ¼ 4 3 cðþr z 3 ; ð3þ (Ettori 2000; Ettori et al. 2004b).
8 No. 2, 2008 X-RAY OBSERVATIONS OF HIGH-REDSHIFT CLUSTERS 1029 Fig. 2 Continued After the initial estimation of R 2500, additional spectra were extracted from within that radius, and spectral fitting was performed again. This procedure was repeated until temperatures and values of R 2500 were consistent for a given spectrum. Where statistically possible, additional fits were performed allowing abundances to vary also. Redshifts were also fitted (allowing only z, T X,andnormalization to vary) for the three clusters in our sample that do not have spectroscopic redshifts. We were unable to constrain a redshift for RCS The fits of the other two clusters resulted in z ¼ 0:62 0:01 for RCS and z ¼ 0:78 þ0:07 0:08 for RCS , within 10% and 14%, respectively, of photometric redshift estimates obtained using the color of the red sequence (Gladders & Yee 2005). Fits with redshift fixed at these values were used in subsequent analysis (Table 4). The small uncertainties in these values (10%) do not substantially affect our analysis. Unabsorbed 2 10 kev luminosities within R 2500 were calculated using fixed abundance fits. These were then converted to bolometric luminosities by scaling, using a thermal emission model in PIMMS. For the three clusters for which spectral temperature fitting was impossible (RCS , RCS , and RCS ), spectra were extracted within 500 h 1 70 kpc radii and fitted in XSPEC with temperatures fixed at 4 kev (slightly lower than the average T X of the sample) to determine their luminosities. Temperature uncertainties of 2 kev were folded into the errors of these estimates. To estimate L X ( ¼ 500), we extracted spectra from within that radius for the 10 clusters in our detailed analysis sample and again used fixed abundance fits, with temperatures also fixed at the R 2500 value. The results of spectral fitting are shown in Table 4, along with 68% confidence ranges. Bolometric X-ray luminosities are listed with richness measurements in Table T X - Comparisons Velocity dispersions for three of the clusters in this sample were obtained from Gilbank et al. (2007, 2008) and are listed in Table 6. Using the -T X relationship of Xue & Wu (2000), ¼ 10 2:49 TX 0:65, we find that our temperatures are in agreement with the clusters measured velocity dispersions in all cases ( Table 6). This result indicates that these three systems, at least, are not overly disturbed. 6. MASS ESTIMATES An isothermal cluster whose surface brightness is well fitted by a model can be shown to have a gas density profile that follows equation (4). Using this relationship and the equation of hydrostatic equilibrium (eq. [2]), total mass can be determined via M tot ð< rþ ¼ 3 G ktr m p ðr=r c Þ 2 1 þ ðr=r c Þ 2 : ð6þ To estimate gas mass (again assuming hydrostatic equilibrium, isothermality, and sphericity), the first step is to obtain a central density (n 0 0 /m p ). There are two complementary ways to go about this. One is to use the surface brightness normalization: ( " #) 1=2 ð3þ n 0 ¼ e I 0 1=2 ð3 1=2Þ X H 0 r c ð1 þ zþ 4 ; ð7þ where the function results from surface brightness integration, comes from the fit to surface brightness, e is the mean atomic mass per free electron (0.62), X H is the hydrogen mass fraction
9 1030 HICKS ET AL. Vol. 680 TABLE 4 Integrated Spectral Fits ( ¼ 2500) Cluster R 2500 (h 1 70 kpc) kt ( kev) Z (Z ) N H (10 20 cm 2 ) 2 /dof RCS RCS RCS RCS RCS (z ¼ 1:01)... RCS RCS RCS RCS RCS RCS þ :0 þ1:2 0: /65 0: /64 0: /10 0: /61 0: /60 0: /11 0: /11 0: /125 0: /124 0: /20 0: /19 0: /68 0: /67 6:5 þ /34 0: /33 0: /81 0: /80 5:9 þ /32 0: / :1 þ1:2 0:9 0:2 þ0:4 123 þ :5 þ0:3 296 þ :2 þ0:8... 4:2 þ0:6 0:5 0:7 þ0:5 202 þ :5 þ0:6 128 þ :6 þ0:7 356 þ :5 þ0:4... 4:6 þ0:4 0:3 0:3 þ0:1 270 þ :9 þ1:3... 3:9 þ1:2 0:8 0:3 þ0:8 410 þ :1 þ1:3... 5:8 þ1:2 0:8 0:6 þ0:3 319 þ þ1 1 0:6 þ0:4 351 þ :2 þ0:9... 5:9 þ0:8 0:7 0:5 þ0:2 323 þ :0 þ2 1 0:3 þ0:4 Notes. Single-temperature fits within R When possible, a second fit was performed allowing both the temperature and abundance to vary. These fits are reported in the second line (where there is one) for each cluster. In the case of RCS , the second line indicates the result of fitting the integrated spectrum with a fixed abundance and a redshift of z ¼ 1:01. (0.707), 0 is the gas emissivity, I 0 is the best-fitting surface brightness normalization (corrected for absorption), and r c is the core radius. A second method of estimating central density makes use of both imaging and spectral fitting: n0 2 ¼ 4d ang 2 ð1 þ zþ2 K ; :82ð4Þrc 3EI cm 6 : ð8þ Here K is the normalization of the XSPEC model and EI is the emission integral, estimated by integrating the (spherical) emission from the source out to some radius: in our case we use 10 Mpc following the method of Ettori et al. (2003). For the RCS sample we employed both of these methods, as it was crucial to confirm that we were not underestimating central density in these comparatively low luminosity objects. We also added the data from our previous Chandra analysis of the moderate-redshift CNOC sample, to cover a wider range of redshifts in our comparison. We found that the methods agree (on average) to within 10% and proceeded in our analysis using the surface brightness normalization method. From these equations, along with equations (4) and (5), and using the results of spectral and surface brightness fitting, gas masses and total masses were determined out to R 2500 and R 500 for the clusters in this sample. We also calculate core gas mass fractions (within R 2500 and R 500 ) for the RCS clusters and find them to be systematically lower than the core gas mass fractions of lower TABLE 5 Cluster Richness and Luminosity Cluster B gc;red (h 1 50 Mpc1.77 ) L X (R 2500 ) (10 44 ergs s 1 ) L X (R 500 ) (10 44 ergs s 1 ) RCS :1 þ0:3 0:2 4:4 þ0:5 0:5 RCS :5 þ0:5 0:5 4:0 þ0:7 0:8 RCS :3 þ0:3 0:2 3:5 þ0:3 0:4 RCS :4 þ0:3 0:3 1:1 þ0:5 0:5 RCS (z ¼ 1:01) :1 þ0:7 0:5 2:7 þ1:0 1:0 RCS :32:0 þ0:9 a... RCS :0 þ0:4 0:3 8:4 þ0:5 0:5 RCS :3 þ0:7 0:3 3:3 þ0:5 0:7 RCS :22:5 þ0:8 a RCS :0 þ0:7 0:4 8:3 þ0:9 0:7 RCS :1 þ0:1 0:3 RCS :6 þ0:6 0:4 7:9 þ0:7 0:8 RCS :6 þ0:6 0:4 16:2 þ0:6 0:8 RCS :2 þ0:5 0:3 5:9 þ0:5 0:6 a Bolometric X-ray luminosity within 500 h 1 70 kpc, assuming a temperature of 4 kev. b ID uncertain ( L. F. Barrientos et al. 2008, in preparation). a,b
10 No. 2, 2008 X-RAY OBSERVATIONS OF HIGH-REDSHIFT CLUSTERS 1031 TABLE 6 Dynamical Comparisons cosmological factor E z ¼ H(z)/H 0 ¼½ m (1 þ z) 3 þ Š 1 =2,and are fitted with the form Cluster (km s 1 ) 10 2:49 TX 0:65 a (km s 1 ) log 10 Y ¼ C1 þ C2log 10 X : ð9þ RCS þ95 74 RCS þ RCS þ93 97 a Xue & Wu (2000). redshift X-ray selected clusters. The robustness and implications of this result are explored in detail in x 7.4. Gas masses, total masses, and gas mass fractions can be found in Tables 7 and 8. We note that while extrapolations to larger radii are possible using our measured fit parameters, R 2500 is the radius to which we have confident measures for our entire sample. 7. CLUSTER SCALING RELATIONS Studying the relationships between global cluster properties (L X, T X, M tot, etc.) over a broad range in redshift allows us to investigate the influence of nongravitational processes on cluster formation and evolution. On a less grand scale, these relationships can also lead to interesting clues regarding an individual cluster s dynamical state and composition, as well as provide a method of comparison between different cluster samples. In this paper we investigate the evolution of scaling relationships over the redshift range 0:1 < z < 1:0 and use them to characterize high-z optically selected RCS clusters (0:6 < z < 1:0). To facilitate comparisons between the RCS clusters and lower redshift X-ray selected samples, we make use of our previous Chandra analysis of the CNOC subsample of the EMSS (Hicks et al. 2006; Yee et al. 1996; Gioia et al. 1990). The CNOC sample was assembled primarily based on X-ray luminosity, with a cut at 2 ; ergs s 1 in the original EMSS catalogs (Gioia et al. 1990), and covers a redshift range of 0:1 < z < 0:6. This sample is not well matched in redshift to our RCS clusters, but it is one of the best-studied moderate-redshift cluster samples today, with substantial information about both X-ray and optical properties available. Our previous analysis of this sample using the same methodology (Hicks et al. 2006) also allows us to make a confident comparison of our measurements. All relationships (L X -T X, L X -M tot, M tot -T X, L X -Y X,andM tot -Y X ) are fitted within either R 2500 or R 500, have been scaled by the In all relationships T X is in units of 5 kev, L X is in units of ergs s 1, total mass is in units of M, and Y X (M g T X ) is in units of 4 ; M kev. Best-fitting relationships are determined using the bisector modification of the BCES algorithm in Akritas & Bershady (1996), and we calculate scatter along the Y-axis as ½ i¼1; N (log 10 Y i C 1 C 2 log 10 X i ) 2 /NŠ 1 =2, facilitating comparisons to previous work (e.g., Ettori et al. 2004a). In all fits the cluster RCS was left out, due to spectroscopic indications (Gilbank et al. 2007; Cain et al. 2008) that it does not consist of a single virialized mass, but two closely spaced objects in projection along the line of sight. We perform fits at ¼ 2500 on the individual samples, RCS (0:62 < z < 0:91) and CNOC (0:17 < z < 0:55), as well as combined data from all 23 clusters (0:17 < z < 0:91). At ¼ 500 only the RCS data are fitted. All fits are then reproduced with the slope fixed at the expected self-similar value. The following discussions pertain to fits with two free parameters unless otherwise noted. Results from the fitting performed in this section can be found in Table 9, while Table 10 provides comparison fits from the literature The L X -T X Relationship In the absence of significant preheating and/or cooling, theory predicts that cluster luminosities should scale as L bol / T 2.However, observational studies have resulted in relationships that fall closer to L bol / T 3 (White et al. 1997; Allen & Fabian 1998; Markevitch 1998; Arnaud & Evrard 1999). These departures from theoretically expected self-similar scaling laws indicate the effects of nongravitational processes, such as galaxy formation (Voit 2005). There is also interest in whether the L X -T X relationship evolves with redshift (Ettori et al. 2004a), which we investigate in this section along with the properties of our sample. The best-fitting relationships and their scatter are given in Table 9 and are plotted in Figure 3. At both radii (R 2500 and R 500 ), the slope of the RCS fit is found to be consistent with a predicted self-similar slope of 2. The CNOC sample, with a slope of 2:31 0:31, is only marginally consistent with predicted scaling, but it does agree with other low-redshift L X -T X relationships. The main difference between the RCS and CNOC fits, however, is their normalization, which is significantly lower in the case of the RCS fit, translating into (2:3 0:3) ; ergs s 1 at 5 kev, compared to TABLE 7 Mass Estimates ( ¼ 2500) Cluster n 0 (10 2 cm 3 ) M gas (10 13 M ) M 2500 (10 13 M ) f gas RCS :329 þ0:009 0:010 0:42 þ0:05 0:05 12:15 þ1:59 1:62 0:035 þ0:005 0:005 RCS :545 þ0:016 0:016 0:07 þ0:01 0:01 0:86 þ0:10 0:10 0:078 þ0:011 0:010 RCS :972 þ0:058 0:061 0:33 þ0:04 0:04 7:88 þ0:88 0:88 0:042 þ0:006 0:005 RCS :323 þ0:010 0:010 0:10 þ0:01 0:01 2:97 þ0:54 0:56 0:034 þ0:008 0:006 RCS (z ¼ 1:01)... 0:432 þ0:013 0:014 0:06 þ0:01 0:01 1:28 þ0:24 0:24 0:048 þ0:011 0:008 RCS :427 þ0:047 0:048 0:75 þ0:06 0:06 11:39 þ0:64 0:65 0:065 þ0:005 0:005 RCS :675 þ0:038 0:035 0:29 þ0:08 0:07 7:60 þ1:51 1:45 0:039 þ0:010 0:008 RCS :713 þ0:011 0:012 0:97 þ0:06 0:06 24:28 þ2:82 2:92 0:040 þ0:005 0:005 RCS :698 þ0:019 0:019 0:66 þ0:07 0:07 12:55 þ1:34 1:35 0:052 þ0:007 0:006 RCS :205 þ0:033 0:033 0:87 þ0:10 0:10 16:54 þ1:59 1:60 0:052 þ0:006 0:006 RCS :699 þ0:019 0:019 0:59 þ0:07 0:07 13:57 þ2:06 2:10 0:044 þ0:008 0:007
11 1032 HICKS ET AL. Vol. 680 TABLE 8 Mass Estimates ( ¼ 500) Cluster R 500 ( kpc) M gas (10 14 M ) M 500 (10 14 M ) f gas RCS RCS RCS RCS RCS (z ¼ 1:01)... RCS RCS RCS RCS RCS RCS RCS þ :153 þ0:020 0:019 4:975 0:692 þ0:680 0:031 þ0:006 0: þ :047 þ0:006 0:006 0:364 0:042 þ0:041 0:129 þ0:020 0: þ :113 þ0:013 0:013 1:782 0:200 þ0:198 0:063 þ0:009 0: þ :032 þ0:004 0:004 1:083 0:203 þ0:198 0:030 þ0:007 0: þ :042 þ0:005 0:005 0:912 0:174 þ0:170 0:046 þ0:011 0: þ :218 þ0:018 0:019 2:600 0:148 þ0:147 0:084 þ0:007 0: þ :091 þ0:014 0:013 2:342 0:420 þ0:409 0:039 þ0:009 0: þ :199 þ0:028 0:026 12:936 2:060 þ1:988 0:015 þ0:004 0: þ :264 þ0:031 0:031 3:181 0:343 þ0:339 0:083 þ0:012 0: þ :264 þ0:032 0:032 4:007 0:388 þ0:384 0:066 þ0:009 0: þ :184 þ0:025 0:024 2:823 0:602 þ0:585 0:065 þ0:018 0: þ :100 þ0:013 0:013 0:619 0:071 þ0:070 0:161 þ0:028 0:024 5:5 þ1:1 0:9 ; 1044 ergs s 1 for CNOC. Fits to the combined sample have significantly higher scatter and a much larger slope (2:90 0:35), inconsistent with self-similar evolution. This is an interesting result: taken with the individual fits, it suggests that redshift evolution in the normalization of L X -T X could be perceived as evolution in its slope if the fitted sample covered a broad enough range of redshifts. This speculation naturally leads us to the important question of whether this trend toward lower luminosity is due to the different selection of the RCS clusters, or to a general evolutionary trend with redshift. In Table 10 we list our fit parameters along with others taken from the literature. Since a number of these studies use measurements at R 500, we compare our fits using estimates extrapolated to this radius. The results of Allen et al. (2001) TABLE 9 Fitting Parameters ¼ 2500 ¼ 500 Fit Sample C 1 C 2 logy C 1 C 2 logy Ez 1 L X -T X... RCS 0:36 0:06 2:05 0: :59 0:05 1:79 0: RCS 0:45 0: (fixed) :65 0: (fixed) 0.19 CNOC 0:74 0:08 2:31 0: CNOC 0:85 0: (fixed) Total 0:56 0:07 2:90 0: Total 0:81 0: (fixed) Ez 1 L X -E z M tot... RCS 0:03 0:04 1:38 0: :20 0:16 1:03 0: RCS 0:06 0: (fixed) :28 0: (fixed) 0.33 CNOC 0:44 0:12 1:26 0: CNOC 0:48 0: (fixed) Total 0:07 0:10 1:77 0: Total 0:40 0: (fixed) E z M tot -T X... RCS 0:29 0:03 1:48 0: :76 0:08 1:72 0: RCS 0:28 0: (fixed) :69 0: (fixed) 0.23 CNOC 0:24 0:02 1:83 0: CNOC 0:27 0: (fixed) Total 0:28 0:02 1:63 0: Total 0:27 0: (fixed) Ez 9=5 L X -Y X... RCS 0:32 0:05 0:73 0: :22 0:04 0:65 0: RCS 0:40 0: (fixed) :08 0: (fixed) 0.27 CNOC 0:50 0:08 0:80 0: CNOC 0:29 0: (fixed) Total 0:41 0:03 0:88 0: Total 0:30 0: (fixed) Ez 2=5 M tot -Y X... RCS 0:25 0:03 0:52 0: :43 0:08 0:64 0: RCS 0:23 0: (fixed) :37 0: (fixed) 0.25 CNOC 0:05 0:04 0:63 0: CNOC 0:04 0: (fixed) Total 0:18 0:02 0:49 0: Total 0:04 0: (fixed) Notes. Best fits to scaling relations cosmologically corrected by the factor E z. Temperature is in units of 5 kev; luminosity in units of ergs s 1 ; mass in units of M ; Y X in units of 4 ; M kev. Scatter along the Y-axis is calculated as ½ i¼1; N (log Y i C 1 C 2 log X i ) 2 /N Š 1=2.
12 No. 2, 2008 X-RAY OBSERVATIONS OF HIGH-REDSHIFT CLUSTERS 1033 TABLE 10 Fitting Comparisons Sample C 1 C 2 Redshift Ez 1 L X -T X ¼ 2500: RCS... 0:36 0:06 2:05 0:34 0:6 < z < 1:0 CNOC... 0:74 0:08 2:31 0:31 0:1 < z < 0:6 Total... 0:56 0:07 2:90 0:35 0:1 < z < 1:0 ASF :98 þ0:09 0:10 2:08 0:06 0:1 < z < 0:45 ¼ 500: RCS... 0:59 0:05 1:79 0:42 0:6 < z < 1:0 ETB :50 0:11 3:72 0:47 0:4 < z < 1:3 Ez 1 L X -E z M tot ¼ 500: RCS... 0:20 0:16 1:03 0:28 0:6 < z < 1:0 ETB :63 0:32 1:88 0:42 0:4 < z < 1:3 E z M tot -T X ¼ 2500: RCS... 0:29 0:03 1:48 0:27 0:6 < z < 1:0 CNOC... 0:24 0:02 1:83 0:13 0:1 < z < 0:6 Total... 0:28 0:02 1:63 0:18 0:1 < z < 1:0 APP :23 0:05 1:70 0:07 z 0:15 ASF :27 0:34 1:51 0:27 0:1 < z < 0:45 ¼ 500: RCS... 0:76 0:08 1:72 0:65 0:6 < z < 1:0 FRB :52 0:45 1:78 0:10 z < 0:09 APP :58 0:14 1:71 0:09 z 0:15 KV :51 0:31 1:79 0:19 0:4 < z < 0:7 ETB :59 0:05 1:98 0:3 0:4 < z < 1:3 Ez 9=5 L X -Y X ¼ 500: RCS... 0:22 0:04 0:65 0:10 0:6 < z < 1:0 M :10 0:04 1:1 0:04 0:1 < z < 1:3 Ez 2=5 M tot -Y X ¼ 500: RCS... 0:43 0:08 0:64 0:22 0:6 < z < 1:0 APP :17 0:2 0:55 0:03 z 0:15 KVN :27 0:006 0:581 0:009 Theory References. (APP05) Arnaud et al. 2005; (APP07) Arnaud et al. 2007; (ASF01) Allen et al. 2001; ( BMS04) Borgani et al. 2004; ( ETB04) Ettori et al. 2004a; ( FRB01) Finoguenov et al. 2001; (KV05) Kotov & Vikhlinin 2005; ( KVN06) Kravtsov et al. 2006; ( M07) Maughan 2007; (SPF03) Sanderson et al from a selected sample of 0:1 < z < 0:5 clusters are consistent in slope with our individual sample fits, but even higher in normalization than the CNOC fit. This is perhaps not surprising given that the clusters in their sample are relaxed lensing clusters, many of which have strong cooling cores that can significantly increase the central cluster luminosity. In general, we do not here have enough information to excise cooling cores from the RCS data; however, in the CNOC data, we did attempt to remove these features from the cluster temperatures and luminosities (Hicks et al. 2006). Discrepancies between CNOC and RCS are thus not likely to be due to a higher incidence of cooling cores in the lower redshift sample. We also compare our sample to the 0:4 < z < 1:3 X-ray selected sample in Ettori et al. (2004a), which consists of 28 clusters taken from the Chandra archive. At ¼ 500, they find that the slope of the L X -T X relationship is much steeper than that predicted by self-similar scaling (slope ¼ 3:72 0:47; Fig. 3), suggesting a negative redshift evolution in the relationship (i.e., clusters at high z have lower L X for a given T X ). A similar result is suggested by Ettori et al. (2004b) based on simulations guided in part by low-redshift observations. Figure 3 shows the extrapolation of our data to R 500. Seven of our nine objects lie on the Ettori et al. (2004a) relationship, suggesting at least some agreement between the properties of their X-ray selected and our optically selected samples. We note that in general their higher redshift clusters also trend toward lower luminosities. While the slope of our fit to the RCS sample at ¼ 500 is inconsistent with theirs, the slope of our combined ¼ 2500 sample is in agreement with their slope, another indication that we may be resolving evolution in slope into changes in the normalization of the relationship with redshift. Our scatter for the individual fits is significantly lower than theirs ( log Y 0:20 vs. log Y ¼ 0:35), whereas our scatter for the combined fits becomes more comparable (0.28). Thus, the RCS high-redshift sample appears to be at least qualitatively similar to this highredshift X-ray selected sample, in support of a trend for samples of clusters at high redshift to have lower luminosities at a given temperature. In summary, the slope of the L X -T X relation from our high-redshift RCS sample is consistent with lower redshift X-ray selected samples (Allen et al. 2001) and the predictions of self-similarity, while the slope of our combined 0:1 < z < 1:1 sample is in agreement with the results of similarly broad (0:4 < z < 1:3) X-ray selected samples ( Ettori et al. 2004a) The L X -M tot Relationship On examining the cosmologically corrected L X -M tot relationship, we again see disparity between the normalizations of the CNOC and RCS fits. This finding provides additional evidence that there is less gas for a given total mass in our high-redshift sample. Individual slopes at R 2500 agree with the self-similar value of 1.33, while the slope of the combined sample fit is higher and inconsistent with that value (Table 9; Fig. 4). Our RCS fit at R 500 is again consistent in normalization, but not slope, with Ettori et al. (2004a). Likewise, again our combined (R 2500 )sampleslope (1:77 0:15) agrees well with theirs (1:88 0:42). Our scatter (0:16 log Y 0:33) is lower in all cases The M tot -T X Relationship The M tot -T X relationship is by far the lowest scatter ( log Y 0:10) relationship in this work ( Fig. 5), although this is largely because of the degeneracy between the two parameters, with much of the scatter arising from differences in the spatial distribution of gas. All of our fits at R 2500 have consistent normalizations, and all but the CNOC fit have slopes that agree well with self-similar predictions. Although the CNOC slope is higher (1:83 0:13), it is in good agreement with both of our listed R 2500 comparison fits (Allen et al. 2001; Arnaud et al. 2005), as are the fits of both the RCS sample and the combined sample (Table 10). At R 500 the RCS fit is in agreement with Finoguenov et al. (2001), Arnaud et al. (2005), and Kotov & Vikhlinin (2005). Our normalization is somewhat higher, however, than all of theirs, and it is in disagreement with that of Ettori et al. (2004a) (Fig. 5). The three objects that are most responsible for driving up the normalization all have gas distributions that appear to be more concentrated than average ( 0:72; Table 3), which would tend to drive up the total mass at higher radius, noting again that at R 500 our masses are extrapolations. In addition, the two most outlying
13 1034 HICKS ET AL. Vol. 680 Fig. 3. Left: X-ray temperatures plotted against cosmologically corrected unabsorbed bolometric luminosities within R Squares designate moderate-redshift CNOC clusters (z avg ¼ 0:32), and diamonds represent high-z RCS clusters (z avg ¼ 0:80). The dashed line traces the best-fitting relationship for only the RCS clusters, which has a slope of 2:05 0:3, and the double-dot dashed line denotes the best fit to the CNOC data with a power-law slope of 2:3 0:3, both in agreement with selfsimilar expectations. The solid line indicates the best-fitting relationship for the entire sample, with a slope of 2:9 0:3, inconsistent with the self-similar value, but in marginal agreement with Ettori et al. (2004a), who find 3:7 0:5 for a cluster ensemble with 0:4 < z < 1:3. Right: L X vs. T X at ¼ 500. The solid line denotes our bestfitting relationship for the RCS clusters with slope 1:8 0:4, again consistent with self-similar scaling. The dot-dashed line shows the fit of Ettori et al. (2004a), which was also measured within R 500. Seven of our nine objects lie on their relationship, suggesting at least some agreement between the properties of their X-ray selected and our optically selected samples. [See the electronic edition of the Journal for a color version of this figure.] points consist of our least massive cluster ( RCS , also our weakest detection in the detailed analysis sample) and our most massive cluster (RCS ). It is worth mentioning again that in Figure 1, the brightest part of RCS does not seem to lie at the center of the cluster s extended emission, indicating that this object may have recently undergone a merger, or could at least possess an appreciable amount of substructure Gas Mass Fractions In x 6 we estimate the core (R 2500 ) gas mass fractions of our high-z sample, finding values that are significantly lower than both the core gas fractions of lower redshift X-ray selected clusters and the expected universal gas fraction ( b / m ¼ 0:175 0:012; Spergel et al. 2007). Taking a weighted average over our high-z objects results in a core gas mass fraction of 4:5% 0:2%, in comparison with the CNOC weighted mean of 9:8% 0:3% and values of 9% found within R 2500 in clusters with T X > 5keV (Vikhlinin et al. 2006). To estimate the contribution of possible mass overestimation on the magnitude of these discrepancies, we also calculate a weighted average using only objects for which 0:65, resulting in a fraction of 5:1% 0:3%, which remains significantly low. Poor clusters and groups are often found to have lower gas mass fractions ( Dell Antonio et al. 1995; Sanderson et al. 2003); therefore, we may expect this result for the lower temperature objects in our sample. This, however, does not explain our findings for the higher temperature objects. To investigate further, we first performed a K-S test on the f g values of subsets of both samples, choosing the eight objects in the RCS sample and the nine objects in the CNOC sample with temperatures between 3.5 and 8 kev. This test resulted in Fig. 4. Left: X-ray mass plotted against cosmologically corrected unabsorbed bolometric luminosity within R Diamonds designate high-redshift RCS clusters, and squares represent moderate-redshift CNOC clusters. The dashed line traces the best-fitting relationship for only the RCS clusters, which has a slope of 1:4 0:1, while the double-dot dashed line denotes the best fit to the CNOC data with a power-law slope of 1:3 0:2, both again in excellent agreement with the self-similar slope of The solid line indicates the best-fitting relationship for the combined sample, which again has a higher slope of 1:77 0:15. Right: OurL X -M 500 data plotted with both our relationship (solid line; slope 1:03 0:28) and that of Ettori et al. (2004a) (dot-dashed line; slope 1:88 0:42) overlaid. [See the electronic edition of the Journal for a color version of this figure.]
14 No. 2, 2008 X-RAY OBSERVATIONS OF HIGH-REDSHIFT CLUSTERS 1035 Fig. 5. X-ray temperatures plotted against cosmologically corrected mass estimates from x 6. Squares designate the CNOC clusters (0:1 < z < 0:6), and diamonds represent RCS clusters (0:6 < z < 1:0). The dashed line indicated the RCS fit, with a slope of 1:5 0:3. Fits to the entire sample (solid line)arealso consistent with self-similar evolution (slope 1:6 0:2). The CNOC fit has a higher slope (double-dot dashed line; 1:83 0:13) but is in good agreement with those from the literature (Allen et al. 2001; Arnaud et al. 2005). [See the electronic edition of the Journal for a color version of this figure.] D ¼ 0:875 and P ¼ 0:002, indicating that the gas mass fractions of the two samples are different at a confidence level of greater than 99%. A histogram showing the f g distributions of these subsamples is shown in Figure 6. We examined the robustness of this result by repeating the K-S test after attempting to remove the effects of any possible trend in gas fraction with temperature. To do so, we assumed that the RCS and CNOC samples can be combined and that the resulting apparent trend of f gas with temperature is physical (note that the resulting relation is much steeper than the one suggested by Vikhlinin et al. 2006; Fig. 6). Under these extreme assumptions, the K-S test yields D ¼ 0:764 and P ¼ 0:007, thus demonstrating the robustness of our earlier results. Low gas mass fractions have previously been observed in clusters at high redshift by both the XMM-Newton project (Sadat et al. 2005) and Lubin et al. (2002) and have been predicted in simulations of high-redshift objects ( Nagai et al. 2007; Ettori et al. 2004b, 2006; Kravtsov et al. 2005). In addition, an SZ/WMAP study performed by Afshordi et al. (2007) reports that 35% of expected baryonic mass is missing from the hot intracluster medium ( ICM) in their 193 clusters. Redshift evolution, however, may not be the only possibility. Multiple studies have confirmed that at least some fraction of their optically selected clusters have lower than expected L X (e.g., Bower et al. 1994; Donahue et al. 2002; Gilbank et al. 2004; Popesso et al. 2007); therefore, sample selection may also contribute to this effect. We explore selection biases in more depth in x 9. Given the possibilities present in the literature and a current lack of sufficient data to perform direct comparisons with significant samples matched in both mass and redshift, it is difficult to determine conclusively that the low gas fractions measured here are the result of cluster evolution. Possible physical explanations for lower gas fractions are that our clusters have a comparatively higher amount of baryonic matter in the form of stars (Vikhlinin et al. 2006; Nagai et al. 2007), that gas is still infalling (i.e., in the process of virialization; Popesso et al. 2007), or that some mechanism has injected excess energy into the gas (i.e., galaxy formation, mergers, active galactic nuclei [AGNs], radio jets; Nulsen et al. 2005), thereby raising its entropy at high z. Many of these processes occur with relatively higher frequency at high redshift (e.g., Lacey & Cole 1993; Eastman et al. 2007); thus, a general trend toward lower gas fractions might easily be expected in high-z clusters Cluster Entropy Cluster entropy can be used as a tool for investigating the energy budget of baryons in clusters (Ponman et al. 1999). Because it may provide insight into f gas discrepancies, we investigate it here for our two samples. Thermodynamic entropy is proportional to the log of the measurable quantity S T X /n 2 =3 e. The canonical radius for measuring S is 0.1R 200 (Ponman et al. 1999), so that is the radius at which we present it here. Figure 7 shows a plot of cosmologically corrected entropy (E 4 =3 z S) versus temperature, with the relationship of Ponman et al. (2003) overlaid (S 120TX 0:65 kev cm 2 ). The specific entropy of the RCS clusters seems overall to be slightly higher for a given Fig. 6. Left: T X plotted against gas mass fractions within R Squares designate moderate-redshift CNOC clusters (0:1 < z < 0:6), and diamonds represent higher z RCS clusters (0:6 < z < 1:0). The dashed line indicates the best-fitting relationship for the entire sample, with a slope of 1:0 0:2. Circles indicate points taken from Vikhlinin et al. (2006). Right: Histogram of gas mass fractions for the eight RCS (left side) and nine CNOC clusters (right side) with 3:5 kev < T X < 8 kev. A K-S test performed on these two samples resulted in D ¼ 0:875 and P ¼ 0:002, indicating that the gas mass fractions of the samples are different at >99% confidence.
Chandra Analysis of a Possible Cooling Core Galaxy Cluster at z = 1.03
 Chandra Analysis of a Possible Cooling Core Galaxy Cluster at z = 1.03 Kyle Dolan Institute for Astronomy, University of Hawaii at Manoa (Dated: 12 August 2005) We present an analysis of Chandra observations
arxiv:astro-ph/ v1 1 Nov 2006
 Modeling Chandra X-ray observations of Galaxy Clusters using Cosmological Simulations arxiv:astro-ph/0611013v1 1 Nov 2006 Daisuke Nagai 1, Andrey V. Kravtsov 2, and Alexey Vikhlinin 3,4 1 Theoretical Astrophysics,
arxiv:astro-ph/ v1 6 May 2004
 XMM-NEWTON OBSERVATIONS OF THREE HIGH REDSHIFT RADIO GALAXIES arxiv:astro-ph/0405116 v1 6 May 2004 Abstract E. Belsole, D.M. Worrall, M. J. Hardcastle Department of Physics - University of Bristol Tyndall
CHANDRA X-RAY SPECTROSCOPY AND IMAGING OF THE GALAXY CLUSTER PKS Amalia K. Hicks, Michael W. Wise, John C. Houck, and Claude R.
 The Astrophysical Journal, 580:763 773, 2002 December 1 # 2002. The American Astronomical Society. All rights reserved. Printed in U.S.A. CHANDRA X-RAY SPECTROSCOPY AND IMAGING OF THE GALAXY CLUSTER PKS
Chandra Observation of Point Sources in the X-Ray Elliptical Galaxy NGC 1407
 Chin. J. Astron. Astrophys. Vol. 4 (2004), No. 3, 221 230 ( http: /www.chjaa.org or http: /chjaa.bao.ac.cn ) Chinese Journal of Astronomy and Astrophysics Chandra Observation of Point Sources in the X-Ray
arxiv:astro-ph/ v1 25 Sep 2006
 Draft version October 23, 2018 Preprint typeset using L A TEX style emulateapj v. 6/22/04 DEEP XMM-Newton AND Chandra OBSERVATIONS OF CLJ1226.9+3332: A DETAILED X-RAY MASS ANALYSIS OF A Z = 0.89 GALAXY
X-ray and Sunyaev-Zel dovich Effect cluster scaling relations: numerical simulations vs. observations
 X-ray and Sunyaev-Zel dovich Effect cluster scaling relations: numerical simulations vs. observations Daisuke Nagai Theoretical Astrophysics, California Institute of Technology, Mail Code 130-33, Pasadena,
arxiv: v3 [astro-ph.co] 24 Jun 2010
![arxiv: v3 [astro-ph.co] 24 Jun 2010](/thumbs/88/117888134.jpg "arxiv: v3 [astro-ph.co] 24 Jun 2010") Mon. Not. R. Astron. Soc. 000, 1 25 (2010) Printed 10 October 2018 (MN LATEX style file v2.2) The Observed Growth of Massive Galaxy Clusters II: X-ray Scaling Relations arxiv:0909.3099v3 [astro-ph.co]
Mon. Not. R. Astron. Soc. 000, 1 25 (2010) Printed 10 October 2018 (MN LATEX style file v2.2) The Observed Growth of Massive Galaxy Clusters II: X-ray Scaling Relations arxiv:0909.3099v3 [astro-ph.co]
Clusters: Observations
 Clusters: Observations Last time we talked about some of the context of clusters, and why observations of them have importance to cosmological issues. Some of the reasons why clusters are useful probes
Publ. Astron. Obs. Belgrade No. 86 (2009), TURKISH NATIONAL OBSERVATORY (TUG) VIEW OF CLUSTERS OF GALAXIES
, TURKISH NATIONAL OBSERVATORY (TUG) VIEW OF CLUSTERS OF GALAXIES") Publ. Astron. Obs. Belgrade No. 86 (2009), 125-130 Contributed paper TURKISH NATIONAL OBSERVATORY (TUG) VIEW OF CLUSTERS OF GALAXIES M. HUDAVERDI 1,2, E. N. ERCAN 2, M. BOZKURT 2, F. GÖK3 and E. AKTEKIN
Publ. Astron. Obs. Belgrade No. 86 (2009), 125-130 Contributed paper TURKISH NATIONAL OBSERVATORY (TUG) VIEW OF CLUSTERS OF GALAXIES M. HUDAVERDI 1,2, E. N. ERCAN 2, M. BOZKURT 2, F. GÖK3 and E. AKTEKIN
Galaxy groups: X-ray scaling relations, cool cores and radio AGN
 Galaxy groups: X-ray scaling relations, cool cores and radio AGN Ming Sun (UVA) (M. Voit, W. Forman, P. Nulsen, M. Donahue, C. Jones, A. Vikhlinin, C. Sarazin ) Outline: 1) Scaling relations and baryon
arxiv:astro-ph/ v2 17 Dec 2003
 Astronomy & Astrophysics manuscript no. scalaw February 2, 2008 (DOI: will be inserted by hand later) Scaling laws in X-ray Galaxy Clusters at redshift between 0.4 and 1.3 S. Ettori 1, P. Tozzi 2, S. Borgani
Observational Cosmology
 (C. Porciani / K. Basu) Lecture 7 Cosmology with galaxy clusters (Mass function, clusters surveys) Course website: http://www.astro.uni-bonn.de/~kbasu/astro845.html Outline of the two lecture Galaxy clusters
arxiv:astro-ph/ v2 24 Apr 2006
 Draft version February 5, 2008 Preprint typeset using L A TEX style emulateapj v. 6/22/04 CHALLENGES FOR PRECISION COSMOLOGY WITH X-RAY AND SUNYAEV-ZELDOVICH EFFECT GAS MASS MEASUREMENTS OF GALAXY CLUSTERS
Clusters and Groups of Galaxies
 Clusters and Groups of Galaxies X-ray emission from clusters Models of the hot gas Cooling flows Sunyaev-Zeldovich effect X-ray surveys and clusters Scaling relations Evolutionary effects X-ray emitting
Chandra discovery of the intracluster medium around UM425 at redshift 1.47
 Chandra discovery of the intracluster medium around UM425 at redshift 1.47 Smita Mathur and Rik J. Williams Astronomy Department, The Ohio State University, 140 West 18th Avenue, Columbus OH 43220 ABSTRACT
Weak lensing calibrated scaling relations for galaxy groups and clusters in the COSMOS and CFHTLS fields
 Weak lensing calibrated scaling relations for galaxy groups and clusters in the COSMOS and CFHTLS fields Kimmo Kettula COSMOS, CFHTLenS and XMM-CFHTLS collaborations 06/19/2014 1 Introduction Mass calibration
The Radio/X-ray Interaction in Abell 2029
 The Radio/X-ray Interaction in Abell 2029 Tracy Clarke (Univ. of Virginia) Collaborators: Craig Sarazin (UVa), Elizabeth Blanton (UVa) Abell 2029: Background z = 0.0767, D=320 Mpc, scale = 1.44 kpc/ typically
Course of Galaxies course organizer: Goeran Ostlin ESSAY. X-ray physics of Galaxy Clusters
 Course of Galaxies course organizer: Goeran Ostlin ESSAY X-ray physics of Galaxy Clusters Student: Angela Adamo angela@astro.su.se fall 2006 Front:-The double cluster A1750. The contours of the XMM-Newton
MASS PROFILES OF X-RAY BRIGHT RELAXED GROUPS: METHODS AND SYSTEMATICS
 MASS PROFILES OF X-RAY BRIGHT RELAXED GROUPS: METHODS AND SYSTEMATICS FABIO GASTALDELLO IASF-INAF MILANO & UC IRVINE D. BUOTE UCI P. HUMPHREY UCI L. ZAPPACOSTA TRIESTE J. BULLOCK UCI W. MATHEWS UCSC F.
POSSIBLE AGN SHOCK HEATING IN THE COOL-CORE GALAXY CLUSTER ABELL 478
 The Astrophysical Journal, 630:191 205, 2005 September 1 # 2005. The American Astronomical Society. All rights reserved. Printed in U.S.A. POSSIBLE AGN SHOCK HEATING IN THE COOL-CORE GALAXY CLUSTER ABELL
The Red-Sequence Cluster Survey (RCS)
") The Red-Sequence Cluster Survey (RCS) Waikaloa, May 2008 Howard Yee Dept. of Astronomy & Astrophysics University of Toronto Outline: - the red-sequence method - RCS1 and 2 - cosmology with RCS1 - cluster
The Red-Sequence Cluster Survey (RCS) Waikaloa, May 2008 Howard Yee Dept. of Astronomy & Astrophysics University of Toronto Outline: - the red-sequence method - RCS1 and 2 - cosmology with RCS1 - cluster
arxiv:astro-ph/ v1 6 Mar 2006
 Studying the Nature of Dark Energy with Galaxy Clusters Thomas H. Reiprich 1, Daniel S. Hudson 1, Thomas Erben 1, and Craig L. Sarazin 2 arxiv:astro-ph/0603129v1 6 Mar 2006 1 Argelander-Institut für Astronomie,
Analysis of Off-Nuclear X-Ray Sources in Galaxy NGC Sarah M. Harrison
 SLAC-TN-6-19 August 26 Analysis of Off-Nuclear X-Ray Sources in Galaxy NGC 4945 Sarah M. Harrison Office of Science, Science Undergraduate Laboratory Internship (SULI) Massachusetts Institute of Technology
Cluster Thermodynamics: Entropy
 Cluster Thermodynamics: Entropy Intracluster Entropy K = Pρ -5/3 Tn e -2/3 (kev cm 2 ) Entropy distribution in ICM determines a cluster s equilibrium structure Entropy distribution retains information
Cosmology and Astrophysics with Galaxy Clusters Recent Advances and Future Challenges
 Cosmology and Astrophysics with Galaxy Clusters Recent Advances and Future Challenges Daisuke Nagai Yale University IPMU, July 15 th, 2010 Large-scale structure in the Universe SDSS (optical) Today δρ/ρ>>1
ROSAT Roentgen Satellite. Chandra X-ray Observatory
 ROSAT Roentgen Satellite Joint facility: US, Germany, UK Operated 1990 1999 All-sky survey + pointed observations Chandra X-ray Observatory US Mission Operating 1999 present Pointed observations How do
The X-ray view of Planck SZ clusters
 The X-ray view of Planck SZ clusters M. ARNAUD CEA- Service d Astrophysique On behalf of the Planck collaboradon With inputs from non- Planck sciendsts The Planck catalogue of SZ sources ESZ Planck Early
Multiwavelength Analysis of CLASH Clusters
 The Galaxy Cluster MACSJ 1206.2 From Umetsu et al. 2012 2' N E Multiwavelength Analysis of CLASH Clusters Seth Siegel Collaboration Bolocam Team: Sunil Golwala, Jack Sayers, Nicole Czakon, Tom Downes,
arxiv: v1 [astro-ph.co] 19 Nov 2012
![arxiv: v1 [astro-ph.co] 19 Nov 2012](/thumbs/89/98950772.jpg "arxiv: v1 [astro-ph.co] 19 Nov 2012") Mon. Not. R. Astron. Soc. 000, 1 20 (2012) Printed 8 August 2018 (MN LATEX style file v2.2) Chandra Measurements of a Complete Sample of X-ray Luminous Galaxy Clusters: the Gas Mass Fraction arxiv:1211.4626v1
Mon. Not. R. Astron. Soc. 000, 1 20 (2012) Printed 8 August 2018 (MN LATEX style file v2.2) Chandra Measurements of a Complete Sample of X-ray Luminous Galaxy Clusters: the Gas Mass Fraction arxiv:1211.4626v1
Energy Balance in Clusters of Galaxies. Patrick M. Motl & Jack O. Burns Center for Astrophysics and Space Astronomy University of Colorado at Boulder
 Energy Balance in Clusters of Galaxies Patrick M. Motl & Jack O. Burns Center for Astrophysics and Space Astronomy University of Colorado at Boulder X-ray and Radio Connections, February 6th, 2004 With
EFFECTS OF GALAXY FORMATION ON THERMODYNAMICS OF THE INTRACLUSTER MEDIUM
 The Astrophysical Journal, 668:1Y14, 2007 October 10 # 2007. The American Astronomical Society. All rights reserved. Printed in U.S.A. A EFFECTS OF GALAXY FORMATION ON THERMODYNAMICS OF THE INTRACLUSTER
Lecture 12 : Clusters of galaxies
 Lecture 12 : Clusters of galaxies All sky surveys in the later half of 20th century changed the earlier view that clusters of galaxies are rare and that only a small fraction of galaxies are grouped together
arxiv:astro-ph/ v3 24 Mar 2006
 Accepted for publication in The Astrophysical Journal Preprint typeset using L A TEX style emulateapj v. 6/22/04 ABSOLUTE MEASUREMENT OF THE UNRESOLVED COSMIC X-RAY BACKGROUND IN THE 0.5 8 KEV BAND WITH
COMPLEX STRUCTURE OF GALAXY CLUSTER ABELL 1689: EVIDENCE FOR A MERGER FROM X-RAY DATA?
 Accepted for publication in ApJ Preprint typeset using L A TEX style emulateapj v. 11/26/03 SLAC-PUB-10329 January 2004 COMPLEX STRUCTURE OF GALAXY CLUSTER ABELL 1689: EVIDENCE FOR A MERGER FROM X-RAY
Galaxy formation and evolution. Astro 850
 Galaxy formation and evolution Astro 850 Introduction What are galaxies? Systems containing many galaxies, e.g. 10 11 stars in the Milky Way. But galaxies have different properties. Properties of individual
Solving. Andrey Kravtsov The University of Chicago Department of Astronomy & Astrophysics Kavli Institute for Cosmological Physics
 Solving Constraining galaxy formation with gaseous halos Andrey Kravtsov The University of Chicago Department of Astronomy & Astrophysics Kavli Institute for Cosmological Physics X-ray Vision workshop:
Precision Cosmology with X-ray and SZE Galaxy Cluster Surveys?
 Precision Cosmology with X-ray and SZE Galaxy Cluster Surveys? Joe Mohr University of Illinois Outline SZE and X-ray Observations of Clusters Cluster survey yields and cosmology Precision cosmology and
Sources of scatter in cluster mass-observable relations
 Great Lakes Cosmology Workshop 8, Columbus OH June 2, 2007 Sources of scatter in cluster mass-observable relations Paul Ricker University of Illinois National Center for Supercomputing Applications With
Infrared Mass-to-Light Profile Throughout the Infall Region of the Coma Cluster
 Infrared Mass-to-Light Profile Throughout the Infall Region of the Coma Cluster K. Rines 1, M.J. Geller 2, M.J. Kurtz 1, A. Diaferio 3, T.H. Jarrett 4, and J.P. Huchra 1 ABSTRACT Using a redshift survey
X- ray surface brightness fluctuations and turbulence in galaxy clusters. Jeremy Sanders. Andy Fabian. Sanders & Fabian 2011, MNRAS, submitted
 X- ray surface brightness fluctuations and turbulence in galaxy clusters Jeremy Sanders Andy Fabian Sanders & Fabian 2011, MNRAS, submitted Simulations predict that in galaxy clusters turbulent energy
Results from the Chandra Deep Field North
 Results from the Chandra Deep Field North Brandt, Alexander, Bauer, Garmire, Hornschemeier, Immler, Lehmer, Schneider, Vignali, Wu, Barger, Cowie, Bautz, Nousek, Sargent, Townsley Chandra Deep Field North
Chemical Enrichment History Of Abell 3112 Galaxy Cluster Out To The Virial Radius
 Chemical Enrichment History Of Abell 3112 Galaxy Cluster Out To The Virial Radius, Esra Bulbul, E. Nihal Ercan, Randall K. Smith, Mark W. Bautz, Mike Loewenstein, Mike McDonald & Eric D. Miller Rome, Italy
arxiv:astro-ph/ v1 27 Sep 2004
 Astronomy & Astrophysics manuscript no. (will be inserted by hand later) XMM-Newton observation of the most X-ray-luminous galaxy cluster RX J1347.5 1145 arxiv:astro-ph/0409627v1 27 Sep 2004 Myriam Gitti
A Multiwavelength Analysis of the Strong Lensing Cluster RCS at z = 0.778
 A Multiwavelength Analysis of the Strong Lensing Cluster RCS 022434-0002.5 at z = 0.778 A.K. Hicks ahicks@alum.mit.edu Department of Astronomy, University of Virginia, P.O. Box 400325, Charlottesville,
Chandra X-ray observations of the 3C 295 cluster core
 University of Wollongong Research Online Faculty of Engineering and Information Sciences - Papers: Part A Faculty of Engineering and Information Sciences 2001 Chandra X-ray observations of the 3C 295 cluster
arxiv:astro-ph/ v1 13 Apr 2006
 **FULL TITLE** ASP Conference Series, Vol. **VOLUME**, **YEAR OF PUBLICATION** **NAMES OF EDITORS** Clusters of Galaxies at 1 < z < 2 : The Spitzer Adaptation of the Red-Sequence Cluster Survey arxiv:astro-ph/0604289
Clusters of galaxies
 Clusters of galaxies Most galaxies belong to some larger bound structure. Conventionally consider groups and clusters, with characteristic properties: Groups Clusters Core radius 250 h -1 kpc 250 h -1
Clusters of galaxies and the large scale structure of the universe. Gastão B. Lima Neto IAG/USP
 Clusters of galaxies and the large scale structure of the universe Gastão B. Lima Neto IAG/USP IWARA, Maresias 10/2009 Our story begins... William Herschel recognizes the clustering of nebulae and their
Clusters of Galaxies " High Energy Objects - most of the baryons are in a hot (kt~ k) gas." The x-ray luminosity is ergs/sec"
 gas. The x-ray luminosity is ergs/sec") Clusters of Galaxies! Ch 4 Longair Clusters of galaxies are the largest gravitationally bound systems in the Universe. At optical wavelengths they appear as over-densities of galaxies with respect to the
Clusters of Galaxies! Ch 4 Longair Clusters of galaxies are the largest gravitationally bound systems in the Universe. At optical wavelengths they appear as over-densities of galaxies with respect to the
80 2 Observational Cosmology L and the mean energy
 80 2 Observational Cosmology fluctuations, short-wavelength modes have amplitudes that are suppressed because these modes oscillated as acoustic waves during the radiation epoch whereas the amplitude of
Clusters: Observations
 Clusters: Observations Last time we talked about some of the context of clusters, and why observations of them have importance to cosmological issues. Some of the reasons why clusters are useful probes
SUPPLEMENTARY INFORMATION
 doi:10.1038/nature11096 Spectroscopic redshifts of CDF-N X-ray sources We have taken a recent compilation 13 as our main source of spectroscopic redshifts. These redshifts are given to two decimal places,
Multi-wavelength scaling relations (scaling relations 101)
") Multi-wavelength scaling relations (scaling relations 101) Gabriel W. Pratt (DSM - IRFU - SAp, CEA Saclay, France) Argument Astrophysics put constraints on formation physics effect of non-gravitational
Multi-wavelength scaling relations (scaling relations 101) Gabriel W. Pratt (DSM - IRFU - SAp, CEA Saclay, France) Argument Astrophysics put constraints on formation physics effect of non-gravitational
1 Introduction. 2 Afterglow Detection Algorithms. MEMORANDUM October 7, 2010
 MIT Kavli Institute Chandra X-Ray Center MEMORANDUM October 7, 2010 To: Jonathan McDowell, SDS Group Leader From: Glenn E. Allen, SDS Subject: The afterglow detection efficiency of acis run hotpix Revision:
Baryon Census in Hydrodynamical Simulations of Galaxy Clusters
 Baryon Census in Hydrodynamical Simulations of Galaxy Clusters Susana Planelles (Univ.Trieste-INAF) Collaborators: S.Borgani (Univ. Trieste-INAF), G.Murante (INAF Torino), L.Tornatore (Univ. Trieste),
Chandra X-Ray Observatory Observation of the High- Redshift Cluster MS
 Chandra X-Ray Observatory Observation of the High- Redshift Cluster MS 1054 0321 The MIT Faculty has made this article openly available. Please share how this access benefits you. Your story matters. Citation
arxiv:astro-ph/ v1 19 Jun 1996
 The Astrophysical Journal, 999:L1-L3, 2000 January 1 c 2000. The American Astrological Society. All rights reserved. Printed in U.S.A. HEATING OF THE INTRACLUSTER GAS IN THE TRIANGULUM AUSTRALIS CLUSTER
Lecture Outlines. Chapter 25. Astronomy Today 7th Edition Chaisson/McMillan Pearson Education, Inc.
 Lecture Outlines Chapter 25 Astronomy Today 7th Edition Chaisson/McMillan Chapter 25 Galaxies and Dark Matter Units of Chapter 25 25.1 Dark Matter in the Universe 25.2 Galaxy Collisions 25.3 Galaxy Formation
SOFT AND HARD X-RAY EXCESS EMISSION IN ABELL 3112 OBSERVED WITH CHANDRA
 The Astrophysical Journal, 668:796Y805, 2007 October 20 # 2007. The American Astronomical Society. All rights reserved. Printed in U.S.A. A SOFT AND HARD X-RAY EXCESS EMISSION IN ABELL 3112 OBSERVED WITH
Large-Scale Structure
 Large-Scale Structure Evidence for Dark Matter Dark Halos in Ellipticals Hot Gas in Ellipticals Clusters Hot Gas in Clusters Cluster Galaxy Velocities and Masses Large-Scale Distribution of Galaxies 1
RECONCILING PLANCK CLUSTER COUNTS AND COSMOLOGY?
 RECONCILING PLANCK CLUSTER COUNTS AND COSMOLOGY? Chandra/XMM instrumental calibration and hydrostatic mass bias Holger Israel Durham University Birmingham Extragalactic Workshop 2015-02-17 HI, G. Schellenberger,
The Astronomical Journal, 127: , 2004 January # The American Astronomical Society. All rights reserved. Printed in U.S.A.
 The Astronomical Journal, 127:213 229, 2004 January # 2004. The American Astronomical Society. All rights reserved. Printed in U.S.A. A THE 172 ks CHANDRA EXPOSURE OF THE LALA BOOTES FIELD: X-RAY SOURCE
ChaMP SERENDIPITOUS GALAXY CLUSTER SURVEY
 The Astrophysical Journal, 645:955 976, 2006 July 10 # 2006. The American Astronomical Society. All rights reserved. Printed in U.S.A. ChaMP SERENDIPITOUS GALAXY CLUSTER SURVEY W. A. Barkhouse, 1,2 P.
New Results on the AGN Content of Galaxy Clusters
 Carnegie Observatories Astrophysics Series, Vol. 3: Clusters of Galaxies: Probes of Cosmological Structure and Galaxy Evolution ed. J. S. Mulchaey, A. Dressler, and A. Oemler (Pasadena; Carnegie Observatories:
Modelling the Sunyaev Zeldovich Scaling Relations
 Modelling the Sunyaev Zeldovich Scaling Relations (Implication for SZ Power Spectrum) Anya Chaudhuri (with Subha Majumdar) Tata Institute of Fundamental Research 31 Oct 2009 Outline Sunyaev Zeldovich effect
Contents. List of Participants
 Table of Introduction List of Participants page xi xiii 1 Galaxy clusters as probes of cosmology and astrophysics August E. Evrard 1 1.1 Introduction 1 1.2 Clusters as Dark Matter Potential Wells 4 1.3
Advanced Topics on Astrophysics: Lectures on dark matter
 Advanced Topics on Astrophysics: Lectures on dark matter Jesús Zavala Franco e-mail: jzavalaf@uwaterloo.ca UW, Department of Physics and Astronomy, office: PHY 208C, ext. 38400 Perimeter Institute for
Construction and Preliminary Application of the Variability Luminosity Estimator
 Construction and Preliminary Application of the Variability Luminosity Estimator arxiv:astro-ph/0103255v2 19 Mar 2001 Daniel E. Reichart 1,2 and Donald Q. Lamb 3 1 Department of Astronomy, California Institute
Cosmology with Galaxy Clusters. V. The Cluster Mass Function
 Cosmology with Galaxy Clusters V. The Cluster Mass Function Baryon Fraction Summary Assuming clusters large enough to be representative, mass composition should match Universe observe fb and constrain
Astronomy 422. Lecture 15: Expansion and Large Scale Structure of the Universe
 Astronomy 422 Lecture 15: Expansion and Large Scale Structure of the Universe Key concepts: Hubble Flow Clusters and Large scale structure Gravitational Lensing Sunyaev-Zeldovich Effect Expansion and age
CLUSTER SUNYAEV-ZELDOVICH EFFECT SCALING RELATIONS
 To appear in the Astrophysical Journal (received 10/02/02, accepted 02/05/03) Preprint typeset using L A TEX style emulateapj v. 25/04/01 CLUSTER SUNYAEV-ZELDOVICH EFFECT SCALING RELATIONS Ian G. McCarthy
Quantifying the Assembly History of Elliptical Galaxies
 Quantifying the Assembly History of Elliptical Galaxies Michael Pierce (University of Wyoming) A Science Use Case for GMT and TMT Origin of Elliptical Galaxies! Elliptical Galaxies Form Through Mergers!
AST 541 Notes: Clusters of Galaxies Fall 2010
 Clusters 1 AST 541 Notes: Clusters of Galaxies Fall 2010 Galaxy clusters represent the largest bound and virialized structures in the Universe today. This extreme environment makes them interesting for
High redshift clusters and their evolution. M.Arnaud (CEA-Sap Saclay France)
") High redshift clusters and their evolution M.Arnaud (CEA-Sap Saclay France) Clusters and structure formation Z= 5 Z= 0 Simulations AMR: Teyssier (2002) Galaxy cluster Primordial fluctuations (DM) that
High redshift clusters and their evolution M.Arnaud (CEA-Sap Saclay France) Clusters and structure formation Z= 5 Z= 0 Simulations AMR: Teyssier (2002) Galaxy cluster Primordial fluctuations (DM) that
arxiv: v1 [astro-ph.he] 29 May 2014
![arxiv: v1 [astro-ph.he] 29 May 2014](/thumbs/88/116141255.jpg "arxiv: v1 [astro-ph.he] 29 May 2014") Mon. Not. R. Astron. Soc. 000, 000 000 (0000) Printed 27 August 2018 (MN LATEX style file v2.2) The effect of the quasar H1821+643 on the surrounding intracluster medium: revealing the underlying cooling
Mon. Not. R. Astron. Soc. 000, 000 000 (0000) Printed 27 August 2018 (MN LATEX style file v2.2) The effect of the quasar H1821+643 on the surrounding intracluster medium: revealing the underlying cooling
Joint X ray/sze analysis of the intra cluster medium
 Joint X ray/sze analysis of the intra cluster medium Kaustuv Basu (MPIfR / Universität Bonn) kbasu@mpifr bonn.mpg.de with Martin Nord Yu Ying Zhang & the APEX SZ collaboration The Sunyaev-Zel'dovich (SZ)
arxiv:astro-ph/ v5 19 Jan 2007
 Astronomy & Astrophysics manuscript no. 3650 March 4, 2009 (DOI: will be inserted by hand later) X-ray properties in massive galaxy clusters: XMM-Newton observations of the REFLEX-DXL sample Y.-Y. Zhang
cluster scaling relations and mass definitions
 cluster scaling relations and mass definitions Andrey Kravtsov Department of Astronomy & Astrophysics Kavli Institute for Cosmological Physics The University of Chicago Abell 85 SDSS Abell 85 SDSS/ Abell
arxiv:astro-ph/ v2 7 May 2002
 astro-ph/0203189 Preprint typeset using L A TE style emulateapj v. 25/04/01 THE CLUSTER M GAS T RELATION: EVIDENCE FOR A HIGH LEVEL OF PREHEATING Ian G. McCarthy 1,2, Arif Babul 1, & Michael L. Balogh
8.1.1 Possible Improvements to the Background Selection Technique
 Chapter 8 Discussion In this final major Chapter, we present and discuss the mass estimates for the eight clusters investigated in this thesis. Section 8.1 reviews the background selection, shear measurement,
PoS(extremesky2009)103
103") The study of the nature of sources AX J1749.1 2733 and AX J1749.2 2725 D. I. Karasev Space Research Institute, Profsoyuznaya str. 84/32, Moscow 117997, Russia E-mail: dkarasev@iki.rssi.ru Space Research
The study of the nature of sources AX J1749.1 2733 and AX J1749.2 2725 D. I. Karasev Space Research Institute, Profsoyuznaya str. 84/32, Moscow 117997, Russia E-mail: dkarasev@iki.rssi.ru Space Research
(Toward) A Solution to the Hydrostatic Mass Bias Problem in Galaxy Clusters. Eiichiro Komatsu (MPA) UTAP Seminar, December 22, 2014
 A Solution to the Hydrostatic Mass Bias Problem in Galaxy Clusters. Eiichiro Komatsu (MPA) UTAP Seminar, December 22, 2014") (Toward) A Solution to the Hydrostatic Mass Bias Problem in Galaxy Clusters Eiichiro Komatsu (MPA) UTAP Seminar, December 22, 2014 References Shi & EK, MNRAS, 442, 512 (2014) Shi, EK, Nelson & Nagai, arxiv:1408.3832
(Toward) A Solution to the Hydrostatic Mass Bias Problem in Galaxy Clusters Eiichiro Komatsu (MPA) UTAP Seminar, December 22, 2014 References Shi & EK, MNRAS, 442, 512 (2014) Shi, EK, Nelson & Nagai, arxiv:1408.3832
Physical Conditions in the Gas
 Physical Conditions in the Gas the elastic collision times for (ions and electrons ) in the intracluster gas are much shorter than the time scales for heating or cooling, and the gas can be treated as
Mapping the non thermal emission in Coma cluster of galaxies using the FeXXV/FeXXVI line ratio
 Mapping the non thermal emission in Coma cluster of galaxies using the FeXXV/FeXXVI line ratio J. Nevalainen 1 & D. Eckert 2 1 Helsinki University Observatory, Finland 2 ISDC, Geneva, Switzerland Evidence
Cosmology with galaxy clusters?
 Cosmology with galaxy clusters? Cosmology with the cluster mass fct. Piero Rosati (ESO, Garching) Paolo Tozzi (INAF-OAT, Trieste) Colin Norman (JHU, Baltimora) Elena Pierpaoli (Princeton Univ.) Douglas
Probing the Outskirts of Strongly Merging Double Clusters
 Probing the Outskirts of Strongly Merging Double Clusters S. W. Randall - CfA E. Bulbul, R. Paterno-Mahler, C. Jones, W. Forman, E. Miller, S. Murray, C. Sarazin, E. Blanton Probing the Outskirts of Strongly
e e-03. which is distributed with standard chandra processing. visual inspection are included.
 1 SUMMARY 1 SNR 0505-67.9 1 Summary Common Name: DEM L71 Distance: 50 kpc (distance to LMC, Westerlund(1990) ) Center of X-ray emission (J2000): ( 05 05 42.0, -67 52 39.8 ) X-ray size: 86 x 74 Description:
Summer School on Cosmology July Clusters of Galaxies - Lecture 2. J. Mohr LMU, Munich
 2354-23 Summer School on Cosmology 16-27 Clusters of Galaxies - Lecture 2 J. Mohr LMU, Munich SPT Outline ICTP Summer School on Cosmology, Trieste, e-rosita ESA/SRE(211)12 July 211 Galaxy Clusters and
Galaxy Cluster Mergers
 Galaxy Cluster Mergers Alexia Schulz Institute for Advanced Study Andrew Wetzel Daniel Holz Mike Warren Talk Overview! Introduction " Why are cluster mergers of interest? " Where will mergers complicate
Clusters and Groups of Galaxies
 Clusters and Groups of Galaxies Groups and clusters The Local Group Clusters: spatial distribution and dynamics Clusters: other components Clusters versus groups Morphology versus density Groups and Clusters
NuSTAR observation of the Arches cluster: X-ray spectrum extraction from a 2D image
 NuSTAR observation of the Arches cluster: X-ray spectrum extraction from a 2D image Space Research Institute (IKI), Moscow, Russia E-mail: krivonos@iki.rssi.ru The NuSTAR mission performed a long (200
AC Fabian, M. Cappi, J Sanders. Cosmic Feedback from AGN
 AC Fabian, M. Cappi, J Sanders Cosmic Feedback from AGN AC Fabian, M Cappi, J Sanders, S Heinz, E Churazov, B McNamara, J Croston, D Worrall, F Humphrey, F Tombesi, J Reeves, M Giustini, P O Brien, T Reiprich
Coma Cluster Matthew Colless. Encyclopedia of Astronomy & Astrophysics P. Murdin
 eaa.iop.org DOI: 10.1888/0333750888/2600 Coma Cluster Matthew Colless From Encyclopedia of Astronomy & Astrophysics P. Murdin IOP Publishing Ltd 2006 ISBN: 0333750888 Institute of Physics Publishing Bristol
A Cluster of Galaxies, Abell 496
 A Cluster of Galaxies, Abell 496 F. Nobels and W. Mulder MSc Astronomy & Kapteyn Astronomical Institute, University of Groningen (Dated: November 11, 2015) As part of the course High-Energy Astrophysics,
Estimate of the X-ray mass! in galaxy clusters! Stefano Ettori!
 Estimate of the X-ray mass! in galaxy clusters! Stefano Ettori! (INAF-OA Bologna) X-ray total mass The ICM is a fluid because the time scale of elastic/ Coulomb collisions between ions & e - (t coulomb
Clusters of Galaxies Groups: Clusters poor rich Superclusters:
 Clusters of Galaxies Galaxies are not randomly strewn throughout space. Instead the majority belong to groups and clusters of galaxies. In these structures, galaxies are bound gravitationally and orbit
Where are the missing baryons? Craig Hogan SLAC Summer Institute 2007
 Where are the missing baryons? Craig Hogan SLAC Summer Institute 2007 Reasons to care Concordance of many measures of baryon number (BBN, CMB,.) Evolution of our personal baryons (galaxies, stars, planets,
arxiv:astro-ph/ v1 10 Nov 1999
 Clustering at High Redshift ASP Conference Series, Vol., 1999 A. Mazure and O. Le Fevre, eds. Weak Lensing Observations of High-Redshift Clusters of Galaxies arxiv:astro-ph/9911169v1 10 Nov 1999 D. Clowe
The Turmoil in IC1262
 Proceedings of The Riddle of Cooling Flows in Galaxies and Clusters of Galaxies: E43 May 31 June 4, 2003, Charlottesville, Virginia, USA Ed. T. H. Reiprich, J. C. Kempner, & N. Soker The Turmoil in IC1262