Character and Spatial Distribution of OH/H 2 O on the Surface of the Moon Seen by M 3 on Chandrayaan-1
|
|
|
- Avice Sparks
- 5 years ago
- Views:
Transcription
1 Character and Spatial Distribution of OH/H 2 O on the Surface of the Moon Seen by M 3 on Chandrayaan-1 C. M. Pieters, 1 * J. N. Goswami, 2,3 R. N. Clark, 4 M. Annadurai, 3 J. Boardman, 5 B. Buratti, 6 J.-P. Combe, 7 M. D. Dyar, 8 R. Green, 6 J. W. Head, 1 C. Hibbitts, 9 M. Hicks, 6 P. Isaacson, 1 R. Klima, 1 G. Kramer, 7 S. Kumar, 10 E. Livo, 4 S. Lundeen, 6 E. Malaret, 11 T. McCord, 7 J. Mustard, 1 J. Nettles, 1 N. Petro, 12 C. Runyon, 13 M. Staid, 14 J. Sunshine, 15 L. A. Taylor, 16 S. Tompkins, 17 P. Varanasi 6 1 Brown University, Providence, RI 02912, USA. 2 Physical Research Laboratory, Ahmedabad, India. 3 Indian Space Research Organization, Bangalore, India. 4 U.S. Geological Survey, Denver, CO 80225, USA. 5 Analytical Imaging and Geophysics, Boulder, CO 80303, USA. 6 Jet Propulsion Laboratory, Pasadena, CA 91109, USA. 7 Bear Fight Center, Winthrop, WA 98862, USA. 8 Mt. Holyoke College, South Hadley, MA 01075, USA. 9 Applied Physics Laboratory, Laurel, MD , USA. 10 National Remote Sensing Agency, Hyderabad, India. 11 Applied Coherent Technology Corporation, Herndon, VA 22070, USA. 12 NASA Goddard, Greenbelt, MD 20771, USA. 13 College of Charleston, Charleston, SC 29424, USA. 14 Planetary Science Institute, Tucson, AZ , USA. 15 University of Maryland, College Park, MD 20742, USA. 16 University of Tennessee, Knoxville, TN , USA. 17 Defense Advanced Research Projects Agency, Arlington, VA 22203, USA. *To whom correspondence should be addressed. carle_pieters@brown.edu The search for water on the surface of the anhydrous Moon remained an unfulfilled quest for 40 years. The Moon Mineralogy Mapper (M 3 ) on Chandrayaan-1 has now detected absorption features near 2.8 to 3.0 µm on the surface of the Moon. For silicate bodies, such features are typically attributed to OH- and/or H 2 O-bearing materials. On the Moon, the feature is seen as a widely distributed absorption that appears strongest at cooler high latitudes and at several fresh feldspathic craters. The general lack of correlation of this feature in sunlit M 3 data with neutron spectrometer H abundance data suggests that the formation and retention of OH and H 2 O is an ongoing surficial process. OH/H 2 O production processes may feed polar cold traps and make the lunar regolith a candidate source of volatiles for human exploration. The Moon has been believed to be quite dry since the return of lunar samples from the Apollo and Luna programs. Many Apollo samples contain some trace water or minor hydrous minerals, but these have typically been attributed to terrestrial contamination (see supporting online material text). A possible accumulation of volatiles, including water frost and ice, in the permanently shadowed regions of the lunar poles has nevertheless been discussed for decades (1 3). The Lunar Prospector neutron spectrometer directly measured H over the Moon and found a higher abundance associated with the permanently shadowed regions of both poles (4, 5), implying that the lunar poles could be potential cold traps for volatiles (6), some of which could be linked to solar-wind hydrogen (7). Here we present measurements acquired by The Moon Mineralogy Mapper (M 3 ) [see (8)], a NASA instrument on Chandrayaan-1, India s first mission to the Moon, that show small amounts of OH/H 2 O on the uppermost surface of the Moon. The M 3 spectrometer measures visible and near-infrared wavelengths, which contain highly diagnostic absorptions due to minerals as well as OH and H 2 O (9) (fig. S1). Absorptions occur as solar radiation passes through multiple randomly oriented particles in the upper 1 to 2 mm of soil; reflectance spectra exhibit these combined absorptions from all particles. As soils evolve in the lunar environment, individual grains develop silicate glass coatings that contain nano-phase metallic iron (npfe 0 ) (10 12). The cumulative abundance of this weathering-derived npfe 0 substantially decreases the measured strength of all absorption bands of lunar material, especially for soils from the FeO-rich maria (13). We have evaluated the 3-µm spectral region in current M 3 data over the sunlit portion of the Moon to search for evidence of water. A feature near 3 µm was seen in several areas of the first returned sequences of M 3 data. As global data accumulated (Fig. 1), it became evident that this feature is observed systematically across the Moon. For various illumination geometries, the strength of the absorption feature near 3 µm (Fig. 1B) is computed as a relative band depth = 1 (Rb/Rc), where Rb = average of channels at 2896 and 2936 nm, and Rc is the approximate continuum, given by the average of channels at 2617, 2657, and 2697 nm. A small component of emitted thermal radiation often occurs along with reflected solar radiation in M 3 radiance measurements. When the surface is warm (greater than ~250 to 300 K), this added component is evident at wavelengths longer than 2000 nm. An iterative procedure to measure and remove this / / 24 September 2009 / Page 1 / /science
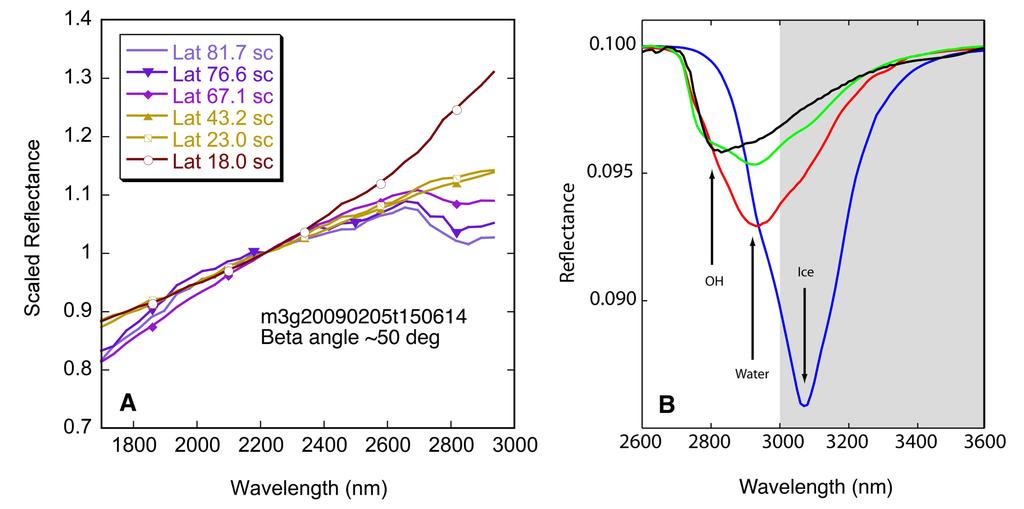
2 thermal emission component has been developed for M 3 data (14). Surface temperature derived from the M 3 measurements are illustrated in Fig. 1C. As these M 3 measurements progressed across the lunar surface, solar illumination angle gradually decreased from east to west. For higher-temperature equatorial mare regions, the added thermal radiation could be up to 30% of the signal received at 3 µm. Minor thermal emission may hide the presence of a weak absorption feature near 3 µm, and although the relative band-depth image (Fig. 1B) excludes areas with detectible thermal radiation, it is a conservative limit to the distribution of the feature [see (8)]. Although it is impossible to capture the full range of lunar surface mineralogy with three parameters, specific mineral properties displayed in red, green, and blue in Fig. 1D are directly linked to our understanding of the diagnostic absorptions of lunar materials (9, 15). Most importantly, these mineral patterns (which rely on spectral channels from the visible through ~2600 nm) do not appear to be correlated with M 3 measurements at slightly longer wavelengths (Fig. 1, B and C). At the spatial resolution of these initial M 3 data (140 m/pixel), the 3-µm feature is identified for soils at moderate to high latitudes (Fig. 1B) as well as at several fresh (plagioclase-rich) impact craters. In the highlands, small (<1 km) morphologically fresh impact craters have ejecta patterns with a prominent 3-µm feature relative to their surroundings (fig. S2). More than one specific absorption may account for the spectral feature, and/or the distribution of the absorption appears variable with local conditions (effects of temperature, solar illumination). For example, Ryder Crater, a fresh ~17- km Copernican-aged crater on the lunar farside (Fig. 2) and its immediate ejecta exhibit no discernable thermal emission component in M 3 data. Although most of the crater exposes plagioclase-rich rocks, it is heterogeneous and contains regions with small amounts of Fe-bearing minerals (Fig. 2E). An enhanced 3-µm band is seen in distal Ryder ejecta to the northwest. A diffuse and approximately inverse correlation of 3-µm band strength with measured signal brightness is seen across the scene, and suggests sensitivity either to solar-wind ions or to solar insolation (i.e., small local variations of emissivity or other thermal effects). The traverse around the sunlit rim of Ryder Crater illustrates this observation (see also fig. S3). Individual M 3 spectra focusing on the to 3000-nm part of the spectral range acquired from highland terrain just east of the central meridian of the lunar nearside suggest that the relative strength of the 3-µm feature increases with latitude (Fig. 3A). These spectra are derived from a current radiance calibration (version K) and with modest imagebased band-to-band calibrations with no thermal emission correction applied. Example spectra of several forms of H 2 O and OH that might be seen with remote detectors are shown for comparison (Fig. 3B). The pattern seen in M 3 data may indicate increasingly strong OH/H 2 O absorptions with latitude, but we cannot eliminate the possibility that a 3-µm feature is present at lower latitudes but is masked by a minor thermal emission component beyond 2.6 µm (8). We implemented several tests to validate the M 3 results for the 3-µm region. We first scrutinized pre-flight laboratory calibrations of M 3 obtained at lunar operating temperatures and in a vacuum [see (16)]. Initial atmospheric effects were readily identified as the instrument reached vacuum equilibrium. Calibration data for two independent standards [spectralon, infragold (17)] were acquired. When applied to M 3 in-flight data, they produce results that do not significantly alter the presence of the observed 3-µm feature, but do alter its shape. We use the infragold standard because the spectralon has a weak feature near 2.8 µm. Furthermore, using purely in-flight image-based methods that are independent of terrestrial laboratory calibration approaches, a feature near 3 µm is seen in contrasting relative reflectance spectra. At moderately high latitudes, there is sufficient orbit-toorbit overlap that M 3 made repeat measurements of the same area on the lunar surface 2 hours apart under approximately the same illumination. The characteristics of observed spectral features were identical within data precision. Every month Chandrayaan-1 passes the same location on the surface, but with a ~30 change in solar illumination angle at the equator. We identified and processed four pairs of image strips across the western portion of the Orientale Basin on the farside western limb that have nearly identical spatial coverage, but substantially different illumination conditions. A local morning set was acquired in February 2009 and the second set was acquired two months later in local afternoon. For several weeks between these optical periods, M 3 activated a decontamination heater to drive off any condensed volatiles. Typical results are shown in Fig. 4, which is a region (~53 S, 259 E) that is low enough in temperature to exhibit no discernable thermal emission for sunlit areas in either geometry. Because of the large variations in local brightness, the spectra are scaled relative to an area exhibiting the weakest 3-µm absorption. The presence of the 3-µm feature was repeatable, but the time of lunar day does affect the apparent distribution and strength of the absorption. Lastly, two independent spacecraft with spectrometers that extend beyond 3-µm, Cassini in 1999 and Deep Impact in June 2009, have flown by the Moon for calibration purposes, and recent analysis of these data confirmed the presence of absorptions in spectra of the lunar surface similar to those reported here (18, 19). Because these spectrometers extend farther into the near-infrared than M 3, they are able to more fully characterize the shape of the 3-µm absorption, which is / / 24 September 2009 / Page 2 / /science
3 important information to constrain the nature of the absorbing species. Approximate abundance estimates of OH or H 2 O are only possible using specific model assumptions about the physical form and location of the hydrated species. As one example, simple attenuation according to Beer s law might be assumed for a case where the detected water/ion is a surficial deposit on individual regolith grains, with the observed reflectance of the regolith dominated by sunlight absorbed and scattered by the grains themselves. Modeled abundance could be as high as 770 ppm (20), but is dependent on particle size, and the total abundance of hydrated material in the bulk upper regolith would be substantially smaller if hydration is not retained during regolith gardening. The 3-µm feature measured by M 3 originates from the upper few mm of the surface, whereas the bulk H detected by the Lunar Prospector neutron spectrometer (LP-NS) (21 23), represents the upper ~50 cm of the regolith. Because the spatial resolution of the LP-NS is 2-3 orders of magnitude lower than that of M 3, only broad features on the order of hundreds of km can be compared directly outside the permanently shadowed regions. Two distinct differences are noted. In contrast to that seen for M 3, the generally diffuse nature of LP-NS H for most regions on the Moon shows no pattern of significant H present at high latitudes near the poles (<80 ). Furthermore, some of the lowest regional abundance of LP-NS H corresponds to large expanses of anorthositic or freshly disturbed (immature) highland material (21, 22). One such example covered by both M 3 and LP-NS is the 113 km diameter crater Goldschmidt (73.0 N, 3.8 W) and its smaller fresh companion, the 51 km diameter Anaxagoras (73.4 N, 10.1 W). As in M 3 observations of many smaller feldspathic craters, M 3 data for Goldschmidt exhibit a prominent 3-µm absorption (Fig. 1B) whereas in LP-NS data the region exhibits a distinctly low H abundance [see fig. S4 and (23)], suggesting the hydrated materials observed by M 3 does not occur at depth. The M 3 3-µm data clearly indicate that a minor hydrated phase or hydration process occurs on the lunar surface. This finding could imply that the Moon contains primary hydrated mineral phases that are uncommon in the limited Apollo, Luna, and lunar meteorite collections. These unsampled phases might be endogenic to the Moon and freshly exposed by craters in ancient highland terrain, or they may form during an impact event by a water-bearing comet or asteroid. On the other hand, H 2 O and OH species might also be continuously created when solar-wind protons (H + ) interact with the oxygen-rich surfaces during the formation of lunar soil particles. In addition, fresh broken surfaces and soil grains may readily react with protons from the solar-wind forming strong surficial OH bonds. Either of these may be highly dependent on the temperature and solar illumination environment. The differences described between LP-NS H abundance and M 3 3-µm band-depth (linked to OH/H 2 O abundance) imply that the M 3 detection of OH/H 2 O species is distinctly surface-correlated, i.e., linked to the upper few millimeters of the lunar regolith, but not significantly deeper. Thus, surficial processes involving the solar-wind are the most likely explanation of our observations. The process for producing OH/H 2 O on the Moon may provide an ongoing mechanism for delivery of these volatile elements to cold traps in the polar permanently shadowed regions. Perhaps most importantly, harvesting the lunar regolith for volatiles now becomes a serious option for longterm human activities. References and Notes 1. H. C. Urey, The Planets: Their Origin and Development (Yale Univ. Press, New Haven, CT, 1952). 2. K. Watson, B. C. Murray, H. Brown, J. Geophys. Res., 66, 3033 (1961). 3. J. R. Arnold, J. Geophys. Res. 84, 5659 (1979). 4. W. C. Feldman et al., Science 281, 1496 (1998). 5. W. C. Feldman et al., J. Geophys. Res. 106, 23231, (2001). 6. D. H. Crider, R. R. Vondrak, Adv. Space Res. 30, 1869 (2002). 7. L. Starukhina, Y. Shkuratov, Icarus 147, 585 (2000). 8. Materials and methods are available as supporting material on Science Online. 9. R. G. Burns, Mineralogical Applications of Crystal Field Theory (Cambridge Univ. Press, ed. 2, 1993). 10. L. P. Keller, D. S. McKay, Geochim. Cosmochim. Acta 61, 2331 (1997). 11. S. K. Noble, C. M. Pieters, L. P. Keller, Icarus 192, 629 (2007). 12. L. A. Taylor, C. M. Pieters, L. P. Keller, R. V. Morris, D. S. McKay, J. Geophys. Res. 106, (2001). 13. C. M. Pieters et al., Meteorit. Planet. Sci. 35, 1101 (2000). 14. We have used the approach described in R. N. Clark, Icarus, 40, 94 (1979). Briefly, our thermal removal algorithm estimates the thermal emission as an excess signal compared to a value derived from the reflectance trend of unaffected shorter wavelengths. The thermal emission component includes an estimate of emissivity and our procedure cannot artificially create the appearance of an absorption feature. See also (8). 15. Bright feldspathic (highland) soils are relatively red and the dark mafic-rich maria contain little of this component. The green and the blue displayed channels (green-cyanblue colors in Fig. 3D) capture the relative band strength of diagnostic absorptions of several ferrous minerals. Regions containing abundant and diverse mafic minerals are highlighted by these two parameters. Both are calculated relative to a continuum and are integrated / / 24 September 2009 / Page 3 / /science
4 across M 3 channels within the broad mineral absorption bands (see fig. S1). The strength of these particular parameters is largely sensitive to the relative abundance of pyroxene, but the integrated 1000 nm band-strength parameter (green) is also sensitive to other mafic minerals present (e.g., olivine). The band-strengths of all absorptions are modulated by the abundance of opaque phases (ilmenite, chromite) and npfe R. O. Green et al., 40th Lunar and Planetary Science Conference, Houston #2307 (2009). 17. The reflectance standards used in the calibration of M 3 are 12! 12 inch panels of Spectralon SN: and Infragold SN: from Labsphere Inc. 18. R. N. Clark, Science; published online 24 September 2009 ( /science ). 19. J. S. Sunshine, et al., Science; published online 24 September 2009 ( /science ). 20. A measured depth of the 3-µm absorption band of ~7% would be equivalent to an effective thickness of such surficial water of ~0.09 "m, which could be accounted for by a single or few molecular layers of water/ion on individual grains given an effective particle size for the interacting upper lunar regolith of ~1 "m and an overall optical depth of ~300 "m. A monolayer of water/ion would not tend to migrate into the grains, which would therefore remain dry i.e., the overall abundance of water in the surface would remain low, but potentially stable. If this surficial water/ion were photolytically dissociated, the resulting H ions may simply migrate along the surface until interacting with another O atom in the grain to again form OH or H 2 O resulting in an effective pseudo-stability or temporary steady-state. If the regolith grains are anorthostic plagioclase, a monolayer of water on a 1-"m spherical grain would equate to a molar abundance of 0.6%, and ~770-ppm mass fraction, given a 1:1 ratio of water molecule/ion to the anorthositic surface molecules. However, if the effective particle size of regolith grains carrying the water is larger than 1 "m, then the surface water proportion will be less. 21. J. R. Johnson et al., J. Geophys. Res., 107, /2000JE (2002). 22. S. Maurice, D. J. Lawrence, W. C. Feldman, R. C. Elphic, O. Gasnault J. Geophys. Res., 109, E07S04, /2003JE (2004). 23. D. J. Lawrence et al., J. Geophys. Res. 111, E08001, /2005JE (2006). 24. J. W. Boardman et al., 6th EARSeL SIG IS workshop on Imaging Spectroscopy, Tel Aviv, Israel (2009). 25. Apparent reflectance is radiance at sensor multiplied by pi and divided by a solar distance-normalized solar spectrum. Currently M 3 often also uses a cos(i) scalar for simple photometric approximations, where i is the solar incidence angle relative to a smooth sphere. 26. D. M. Wieliczka, S. Weng, M. T. Querry, Appl. Opt. 28, 1714 (1989). 27. S. G. Warren, Appl. Opt. 23, 1206 (1984). 28. S. J. Seaman, M. D. Dyar, N. Marinkovic, N. Dunbar, Amer. Mineral 91, 12 (2006). 29. M 3 is funded as a Mission of Opportunity under NASA s Discovery program contract NNM05AB26C to Brown University. Lunar reflectance spectra were acquired using the NASA/Keck RELAB, a multiuser facility supported by NASA grant NNG06GJ31G. A portion of this research was carried out at the Jet Propulsion Laboratory, California Institute of Technology, under a contract with the National Aeronautics and Space Administration. We thank the team of engineers at JPL who designed and built M 3 (led by T. Glavich and M. White) and the Chandrayaan-1 mission operations team (led by N. S. Hegde, with M 3 implementation largely by S. Gomathi) whose mission support has made M 3 data possible. The M 3 team is honored to be a guest instrument on India s first mission to the Moon. Supporting Online Material Materials and Methods SOM Text Figs. S1 to S5 References 5 July 2009; accepted 15 September 2009 Published online 24 September 2009; /science Include this information when citing this paper. Fig. 1. M 3 low-resolution mode data for the lunar nearside acquired from Chandrayaan-1 in a 100-km orbit. All data have been spatially averaged by a factor of 100 and projected to produce a hemispheric overview (24). During this period of observations, the illumination geometry at the equator ranges from 45 in the east to 58 on the western limb. (A) Reflected light at 750 nm. Surface reflectance has not been adjusted for solar illumination and brightness decreases toward the poles. (B) Measured 3-"m absorption strength. Bright represents strong absorption. The large northern crater near 0 longitude with strong 3-µm absorption is Goldschmidt (indicated with arrow). (C) Derived surface temperature (240 to 360 K), and (D) Color composite designed to illustrate major mineral absorptions (red, reflectance at 1580 nm; green, integrated band depth near 1000 nm; blue, integrated band depth near 2000 nm after thermal removal). In this composite, the feldspathic highlands are largely red (with few mafic minerals) whereas the basaltic maria are variations of green- / / 24 September 2009 / Page 4 / /science
5 cyan-blue illustrating the presence and diversity of mafic minerals. Fig. 2. Subscene of M 3 strip M3G T including Ryder Crater (on right), centered at E longitude and 44.5 S latitude. (A) Bightness image at 2856 nm. (B) Image of the relative 3-µm feature depth for the same area. A coherent spatial distribution is seen associated with Ryder ejecta as well as a topography related pattern of solar insolation. (C) Data cloud for the subscene comparing the relative 3-µm feature depth and near-infrared reflectance. Some regions show a diffuse inverse-correlation as a function of apparent reflectance (25). (D) Location of spectra collected along the wall of Ryder Crater, from well-illuminated areas (1) to more shaded areas (7 and 8). (E) M 3 spectra for the areas shown in (D). Although Ryder Crater exhibits spatially diverse lithologies, the strength of the 3-µm feature is weakest in full sun and increases as solar illumination decreases until the lithology changes (becomes more mafic), a pattern that might be indicative of variations of infilling from minor thermal emission (8). Fig. 3. (A) Scaled reflectance spectra for M 3 image strip M3G T All spectra are 7! 7 pixel averages and no thermal emission has been removed in order to allow the measured flux to be compared. The strongest detected 3- µm feature (~10%) occurs at cool, high latitudes and the measured strength gradually decreases to zero toward midlatitudes (where thermal emission is necessarily less well constrained by M 3 ). At lower latitudes (18 ) the additional thermal emission component becomes evident at wavelengths above ~2200 nm (14). (B) Model near-infrared reflectance spectra of H 2 O and OH applicable for lunar comparisons. These spectra are highly dependent on physical state. A model of a thin layer of H 2 O water (red) and ice (blue) on a 10% reflective surface equivalent to ~1000 ppm abundance is distinct from anorthite (green) and a lunar glass analog (black). Shaded area extends beyond the spectral range of M 3. Calculations are based on optical constants from (26 28) assuming no scattering in the H 2 O or OH and with a 100-µm path length within the substrate. Fig. 4. M 3 data taken two months apart during morning (A) (OP1) and afternoon (B) (OP2) solar illumination. The large 30-km Chadwick Crater is located on the farside at 258.7ºE, 52.7ºS. Spectra in panel (C) are scaled reflectance for areas 1 and 2 relative to a local area of strong solar illumination which exhibits a relatively weak 3-µm band in the scene (this reference location varies with geometry). Background soil region 2 (50! 50 pixels) exhibits a moderately weak and consistent 3-µm band strength. Region 1 within the crater (20! 20 pixels) exhibits a more prominent apparent band strength, perhaps sensitive to solar illumination. Black boxes (50! 15 pixels) indicate the reference area selected for spectral ratios. / / 24 September 2009 / Page 5 / /science

6

7
8

9
Detection of Adsorbed Water and Hydroxyl on the Moon
 Detection of Adsorbed Water and Hydroxyl on the Moon Roger N. Clark U. S. Geological Survey, MS 964, Box 25046 Federal Center, Denver CO 80227, USA. E-mail: rclark@usgs.gov Data from the Visual and Infrared
Supporting Online Material for
 www.sciencemag.org/cgi/content/full/1178105/dc1 Supporting Online Material for Detection of Adsorbed Water and Hydroxyl on the Moon Roger N. Clark E-mail: rclark@usgs.gov This PDF file includes: Materials
Thermal removal from near infrared imaging spectroscopy data of the Moon
 JOURNAL OF GEOPHYSICAL RESEARCH, VOL. 116,, doi:10.1029/2010je003751, 2011 Thermal removal from near infrared imaging spectroscopy data of the Moon Roger N. Clark, 1 Carlé M. Pieters, 2 Robert O. Green,
Optical maturity variation in lunar spectra as measured by Moon Mineralogy Mapper data
 JOURNAL OF GEOPHYSICAL RESEARCH, VOL. 116,, doi:10.1029/2010je003748, 2011 Optical maturity variation in lunar spectra as measured by Moon Mineralogy Mapper data J. W. Nettles, 1 M. Staid, 2 S. Besse,
Development, importance, and effect of a ground truth correction for the Moon Mineralogy Mapper reflectance data set
 JOURNAL OF GEOPHYSICAL RESEARCH: PLANETS, VOL. 118, 369 381, doi:10.1002/jgre.20048, 2013 Development, importance, and effect of a ground truth correction for the Moon Mineralogy Mapper reflectance data
DISCOVERY OF LUNAR OLIVINE WITH OH/H 2 O BAND AT MOSCOVIENSE BASIN USING HYPERSPECTRAL IMAGING SPECTROMETER DATA (M 3 )
") DISCOVERY OF LUNAR OLIVINE WITH OH/H 2 O BAND AT MOSCOVIENSE BASIN USING HYPERSPECTRAL IMAGING SPECTROMETER DATA (M 3 ) *Sivakumar V 1 and Neelakantan R 2 1 Department of Geology, Periyar University, Salem,
DISCOVERY OF LUNAR OLIVINE WITH OH/H 2 O BAND AT MOSCOVIENSE BASIN USING HYPERSPECTRAL IMAGING SPECTROMETER DATA (M 3 ) *Sivakumar V 1 and Neelakantan R 2 1 Department of Geology, Periyar University, Salem,
Thermal, Thermophysical, and Compositional Properties of the Moon Revealed by the Diviner Lunar Radiometer
 Thermal, Thermophysical, and Compositional Properties of the Moon Revealed by the Diviner Lunar Radiometer Benjamin T. Greenhagen Jet Propulsion Laboratory David A. Paige and the Diviner Science Team LEAG
UV-V-NIR Reflectance Spectroscopy
 UV-V-NIR Reflectance Spectroscopy Methods and Results A. Nathues Naturally-occurring inorganic substances with a definite and predictable chemical composition and physical properties Major groups: Silicates
Iron and Titanium: Important Elements. posted October 20, References:
 1 of 6 posted October 20, 1997 Moonbeams and Elements Written by G. Jeffrey Taylor Hawai'i Institute of Geophysics and Planetology To determine how a planetary body formed and evolved, we must determine
MULTIPLE CHOICE. Choose the one alternative that best completes the statement or answers the question.
 ASTRO 102/104 Prelim 2 Name Section MULTIPLE CHOICE. Choose the one alternative that best completes the statement or answers the question. 1) This is version E of the exam. Please fill in (E). A) This
MULTIPLE CHOICE. Choose the one alternative that best completes the statement or answers the question.
 ASTRO 102/104 Prelim 2 Name Section MULTIPLE CHOICE. Choose the one alternative that best completes the statement or answers the question. 1) This is version B of the exam. Please fill in (B). A) This
Composition of the Moon's Crust
 1 of 7 posted December 10, 2004 Composition of the Moon's Crust --- New empirical calibrations of Lunar Prospector and Clementine data yield improved global maps of Th, K, and FeO. The movie of the Moon,
Remote compositional analysis of lunar olivine rich lithologies with Moon Mineralogy Mapper (M 3 ) spectra
 spectra") JOURNAL OF GEOPHYSICAL RESEARCH, VOL. 116,, doi:10.1029/2010je003731, 2011 Remote compositional analysis of lunar olivine rich lithologies with Moon Mineralogy Mapper (M 3 ) spectra Peter J. Isaacson,
JOURNAL OF GEOPHYSICAL RESEARCH, VOL. 116,, doi:10.1029/2010je003731, 2011 Remote compositional analysis of lunar olivine rich lithologies with Moon Mineralogy Mapper (M 3 ) spectra Peter J. Isaacson,
EFFECTS OF LASER SPACE WEATHERING ON DERIVED IRON OXIDE CONTENT IN SAN CARLOS OLIVINE, PYROXENE, AND ANORTHOSITE
 EFFECTS OF LASER SPACE WEATHERING ON DERIVED IRON OXIDE CONTENT IN SAN CARLOS OLIVINE, PYROXENE, AND ANORTHOSITE Logan K. Magad-Weiss Department of Geology and Geophysics University of Hawai`i at Mānoa
providing 100-m per pixel resolution in nine ~1.0 µm wide infrared bands centered from
 Supporting Text The THEMS instrument consists of separate infrared and visible imagers providing 100-m per pixel resolution in nine ~1.0 µm wide infrared bands centered from 6.78 to 14.88 µm, and 18-m
Constellation Program Office Tier 1 Regions of Interest for Lunar Reconnaissance Orbiter Camera (LROC) Imaging
 Imaging") Constellation Program Office Tier 1 Regions of Interest for Lunar Reconnaissance Orbiter Camera (LROC) Imaging Regions of Interest listed in alphabetical order ( no priority implied) East longitudes represented
Constellation Program Office Tier 1 Regions of Interest for Lunar Reconnaissance Orbiter Camera (LROC) Imaging Regions of Interest listed in alphabetical order ( no priority implied) East longitudes represented
OH/H 2 0 Enhancements associated with Some Silicic Volcanism as detected by M 3
 OH/H 2 0 Enhancements associated with Some Silicic Volcanism as detected by M 3 Noah Petro LEAG Annual Meeting 2014 October 23, 2014 H/T Carlé Pieters, Rachel Klima, Brad Jolliff, Lillian Ostrach, Tim
The Surprising Lunar Maria
 1 of 5 posted June 23, 2000 The Surprising Lunar Maria Written by G. Jeffrey Taylor Hawai'i Institute of Geophysics and Planetology The lunar maria, the dark, smooth areas on the Moon, formed when lava
Using the modified Gaussian model to extract quantitative data from lunar soils
 Click Here for Full Article JOURNAL OF GEOPHYSICAL RESEARCH, VOL. 111,, doi:10.1029/2006je002721, 2006 Using the modified Gaussian model to extract quantitative data from lunar soils Sarah K. Noble, 1,2
The Moon's Dark, Icy Poles
 1 of 5 posted June 4, 2003 The Moon's Dark, Icy Poles --- Permanently shadowed regions on the Moon--where frozen water could be trapped--are more abundant and more widely distributed than originally thought.
Figure S1. CRISM maps of modeled mineralogy projected over CTX imagery (same
 GSA DATA REPOSITORY 2015222 Cannon and Mustard Additional examples Figure S1. CRISM maps of modeled mineralogy projected over CTX imagery (same parameters as Figure 1). A: Taytay Crater (CRISM ID: HRL00005B77).
Lunar Exploration Requirements and Data Acquisition Architectures
 Lunar Exploration Requirements and Data Acquisition Architectures J. Plescia P. Spudis B. Bussey Johns Hopkins University / Applied Physics Laboratory 2005 International Lunar Conference The Vision and
Newer views of the Moon: Comparing spectra from Clementine and the Moon Mineralogy Mapper
 JOURNAL OF GEOPHYSICAL RESEARCH, VOL. 116,, doi:10.1029/2010je003728, 2011 Newer views of the Moon: Comparing spectra from Clementine and the Moon Mineralogy Mapper Georgiana Y. Kramer, 1 Sebastien Besse,
Volatiles (H, C, N, F, S, Cl) in the lunar mantle, crust, and regolith: What questions remain and where to go next?
 in the lunar mantle, crust, and regolith: What questions remain and where to go next?") Volatiles (H, C, N, F, S, Cl) in the lunar mantle, crust, and regolith: What questions remain and where to go next? Francis M. McCubbin & Charles K. Shearer Motivation behind this work 100, In Revision,
Volatiles (H, C, N, F, S, Cl) in the lunar mantle, crust, and regolith: What questions remain and where to go next? Francis M. McCubbin & Charles K. Shearer Motivation behind this work 100, In Revision,
Background Image: SPA Basin Interior; LRO WAC, NASA/GSFC/ASU
 B. L. Jolliff1, C. K. Shearer2, N. E. Petro3, D. A. Papanastassiou,4 Y. Liu,4 and L. Alkalai4 1Dept. of Earth & Planetary Sciences, Washington University, St. Louis, MO 2Institute of Meteoritics, University
Accessing the Lunar Poles for Human Exploration Missions
 B. KENT JOOSTEN NASA Lyndon B. Johnson Space Center Houston, Texas The National Vision for Space Exploration calls for an American return to the Moon in preparation for the human exploration of Mars and
MESSENGER: Exploring New Views of Mercury s Exosphere and Surface
 MESSENGER: Exploring New Views of Mercury s Exosphere and Surface Ann L. Sprague 1, Ronald J. Vervack, Jr. 2, Rosemary M. Killen 3, William E. McClintock 4, Richard D. Starr 5, David Schriver 6, Pavel
ICE IN THE FAR-IR & DIVINER 3. Far-IR Subteam: Ben Greenhagen, Christopher Edwards, Dan McCleese Additional Contributions: Tim Schofield & Paul Hayne
 ICE IN THE FAR-IR & DIVINER 3 Far-IR Subteam: Ben Greenhagen, Christopher Edwards, Dan McCleese Additional Contributions: Tim Schofield & Paul Hayne WHY FAR IR? ~45µm fundamental ice feature (e.g. Moore
The Final Minute: Results from the LCROSS Solar Viewing NIR Spectrometer
 The Final Minute: Results from the LCROSS Solar Viewing NIR Spectrometer Anthony Colaprete NASA Ames Research Center, Moffett Field, CA, Anthony.Colaprete-1@nasa.gov KISS: New Approaches to Lunar Ice Detection
Malapert Mountain: A Recommended Site for a South Polar Outpost
 For presentation at the Rutgers Symposium on Lunar Settlements, June 4-8, 2007 Malapert Mountain: A Recommended Site for a South Polar Outpost Paul. D. Lowman Jr. Goddard Space Flight Center, Code 698
Dust in the Atmosphere of Mars 2017 (LPI Contrib. No. 1966)
") Dust in the Atmosphere of Mars 2017 (LPI Contrib. No. 1966) MARS CLIMATE SOUNDER (MCS) OBSERVATIONS OF MARTIAN DUST A DECADE-LONG RECORD. D. M. Kass1, D. J. McCleese1, A. Kleinböhl1, J. T. Schofield1 and
Dust in the Atmosphere of Mars 2017 (LPI Contrib. No. 1966) MARS CLIMATE SOUNDER (MCS) OBSERVATIONS OF MARTIAN DUST A DECADE-LONG RECORD. D. M. Kass1, D. J. McCleese1, A. Kleinböhl1, J. T. Schofield1 and
HYPERSPECTRAL IMAGING
 1 HYPERSPECTRAL IMAGING Lecture 9 Multispectral Vs. Hyperspectral 2 The term hyperspectral usually refers to an instrument whose spectral bands are constrained to the region of solar illumination, i.e.,
Lunar Poles. Status of Understanding a Potential Resource. Paul G. Lucey
 Lunar Poles Status of Understanding a Potential Resource Paul G. Lucey Hawaii Institute of Geophysics & Planetology School of Ocean and Earth Science and Technology University of Hawaii at Manoa The Most
The Moon. Tidal Coupling Surface Features Impact Cratering Moon Rocks History and Origin of the Moon
 The Moon Tidal Coupling Surface Features Impact Cratering Moon Rocks History and Origin of the Moon Earth Moon Semi-major Axis 1 A.U. 384 x 10 3 km Inclination 0 Orbital period 1.000 tropical year 27.32
Where we are now. The Moon Chapters 8.2, 9. Topography. Outline
 Where we are now Introduction Little things - comets, asteroids, KBOs Slightly larger things - Moon Larger still - Terrestrial planets Really large - Jovian planets Jovian moons + Pluto Extrasolar Planets
Mineralogical and Geomorphological Mapping of western central part of Mare Tranquillitatis using Hyperspectral Imager onboard Chandrayaan-1
 Mineralogical and Geomorphological Mapping of western central part of Mare Tranquillitatis using Hyperspectral Imager onboard Chandrayaan-1 Henal V. Bhatt 1, Paras M. Solanki 2, Mamta Chauhan 3 Geology
Moon and Mercury 3/8/07
 The Reading Assignment Chapter 12 Announcements 4 th homework due March 20 (first class after spring break) Reminder about term paper due April 17. Next study-group session is Monday, March 19, from 10:30AM-12:00Noon
Mian Abbas, Jim Spann, Andre LeClair NASA Marshall Space Flight Center, Huntsville, AL
 Lunar Dust Distributions From So Infrared Absorption Measurement With a Fourier Transform Spectrometer Mian Abbas, Jim Spann, Andre LeClair NASA Marshall Space Flight Center, Huntsville, AL John Brasunas,
Icarus 210 (2010) Contents lists available at ScienceDirect. Icarus. journal homepage:
 Contents lists available at ScienceDirect. Icarus. journal homepage:") Icarus 210 (2010) 8 13 Contents lists available at ScienceDirect Icarus journal homepage: www.elsevier.com/locate/icarus Deconvolution of lunar olivine reflectance spectra: Implications for remote compositional
Icarus 210 (2010) 8 13 Contents lists available at ScienceDirect Icarus journal homepage: www.elsevier.com/locate/icarus Deconvolution of lunar olivine reflectance spectra: Implications for remote compositional
Supplementary Figure 1 Panoramic view of four sites (CE-0005, CE-0006, CE-0007, and CE-0008) measured by APXS and VNIS. Images (a), (b), and (d) were
 measured by APXS and VNIS. Images (a), (b), and (d) were") Supplementary Figure 1 Panoramic view of four sites (CE-0005, CE-0006, CE-0007, and CE-0008) measured by APXS and VNIS. Images (a), (b), and (d) were acquired by the Panoramic Camera at the CE3-0007 site,
Supplementary Figure 1 Panoramic view of four sites (CE-0005, CE-0006, CE-0007, and CE-0008) measured by APXS and VNIS. Images (a), (b), and (d) were acquired by the Panoramic Camera at the CE3-0007 site,
Stas Barabash 1 Yoshifumi Futaana 1 and the SELMA Team. Swedish Institute of Space Physics Kiruna, Sweden. DAP, Boulder, January, 2017
 Stas Barabash 1 Yoshifumi Futaana 1 and the SELMA Team 1 Swedish Institute of Space Physics Kiruna, Sweden DAP, Boulder, January, 2017 1 SELMA core team 2 SELMA main scientific questions SELMA (Surface,
Geological Setting of the Luna Glob Candidate Landing Site Region in the Northern High Latitudes: Characterization from LOLA and Related Data
 Geological Setting of the Luna Glob Candidate Landing Site Region in the Northern High Latitudes: Characterization from LOLA and Related Data A.M. Abdrakhimov, A.T. Basilevsky, M.A. Ivanov, Vernadsky Institute,
AT350 EXAM #1 September 23, 2003
 AT350 EXAM #1 September 23, 2003 Name and ID: Enter your name and student ID number on the answer sheet and on this exam. Record your answers to the questions by using a No. 2 pencil to completely fill
Lunar soil characterization consortium analyses: Pyroxene and maturity estimates derived from Clementine image data
 Icarus 184 (2006) 83 101 www.elsevier.com/locate/icarus Lunar soil characterization consortium analyses: Pyroxene and maturity estimates derived from Clementine image data Carle Pieters a,, Yuriy Shkuratov
High resolution measurements of absolute thorium abundances on the lunar surface
 taken from Geophysical Research Letters, Vol. 26, No. 17, pages 2681 2684, September 1, 1999 High resolution measurements of absolute thorium abundances on the lunar surface D. J. Lawrence 1, W. C. Feldman
Weather in the Solar System
 Weather in the Solar System Sanjay S. Limaye Space Science and Engineering Center University of Wisconsin-Madison 8 February 2002 What is Weather? Webster s New Collegiate Dictionary: state of the atmosphere
Astronomy 101 The Solar System Tuesday, Thursday 2:30-3:45 pm Hasbrouck 20. Tom Burbine
 Astronomy 101 The Solar System Tuesday, Thursday 2:30-3:45 pm Hasbrouck 20 Tom Burbine tomburbine@astro.umass.edu Course Course Website: http://blogs.umass.edu/astron101-tburbine/ Textbook: Pathways to
Transneptunian objects. Minor bodies in the outer Solar System. Transneptunian objects
 Transneptunian objects Minor bodies in the outer Solar System Planets and Astrobiology (2016-2017) G. Vladilo Around 1980 it was proposed that the hypothetical disk of small bodies beyond Neptune (called
Orbital Identification of Carbonate-Bearing Rocks on Mars
 www.sciencemag.org/cgi/content/full/322/5909/1828/dc1 Supporting Online Material for Orbital Identification of Carbonate-Bearing Rocks on Mars Bethany L. Ehlmann, John F. Mustard, Scott L. Murchie, Francois
STUDIES of the lunar regolith layer might provide the physical
 384 IEEE GEOSCIENCE AND REMOTE SENSING LETTERS, VOL. 12, NO. 2, FEBRUARY 2015 Inversion of Dielectric Properties of the Lunar Regolith Media With Temperature Profiles Using Chang e Microwave Radiometer
Mercury = Hermes Mythology. Planet Mercury, Element, Mercredi God of Commerce, Messenger God, guide to Hades Winged sandals and staff
 Mercury = Hermes Mythology Planet Mercury, Element, Mercredi God of Commerce, Messenger God, guide to Hades Winged sandals and staff Mercury s Orbit Mercury never seen more than 28 from the sun Revolves/orbits
The Apollo 17 Landing Site. posted February 12, 1997
 1 of 6 posted February 12, 1997 Explosive Volcanic Eruptions on the Moon Written by Catherine M. Weitz Department of Geological Sciences, Brown University Recipient of the 1996 Dwornik Student Paper Award.
Planetary Science from a balloon-based Observatory. January 25-26, 2012 NASA Glenn Research Center
 Planetary Science from a balloon-based Observatory January 25-26, 2012 NASA Glenn Research Center Additional info can be found at http://spaceflightsystems.grc.nasa.gov/sspo/sp/balloon_platform/ Outline
Moon 101. Bellaire High School Team: Rachel Fisher, Clint Wu, Omkar Joshi
 Moon 101 Bellaire High School Team: Rachel Fisher, Clint Wu, Omkar Joshi Part I Formation of the Moon Planetary Formation In the solar nebula, dust particles coalesced to form smaller planetesimals and
Luna Resource / Glob Missions: Starting list of potential landing sites
 Luna Resource / Glob Missions: Starting list of potential landing sites A.T. Basilevsky, A.M. Abdrakhimov, M.A. Ivanov, R.O. Kuzmin, E.N. Slyuta Vernadsky Institute of Geochemistry & Analytical Chemistry,
Chapter: The Earth-Moon-Sun System
 Chapter 7 Table of Contents Chapter: The Earth-Moon-Sun System Section 1: Earth in Space Section 2: Time and Seasons Section 3: Earth s Moon 1 Earth in Space Earth s Size and Shape Ancient Measurements
1/3/12. Chapter: The Earth-Moon-Sun System. Ancient Measurements. Earth s Size and Shape. Ancient Measurements. Ancient Measurements
 // Table of Contents Chapter: The Earth-Moon-Sun System Section : Chapter 7 Section : Section : Earth s Size and Shape Ancient Measurements First, no matter where you are on Earth, objects fall straight
A Comparison of Solar Wind Hydroxyla4on within and outside Lunar Magne4c Anomalies
 A Comparison of Solar Wind Hydroxyla4on within and outside Lunar Magne4c Anomalies W. M. Farrell 1, D. M. Hurley 2, V. J. Esposito 3, J. L. McLain 4, M. I. Zimmerman 2 1. NASA/Goddard Space Flight Center,
10. Our Barren Moon. Moon Data (Table 10-1) Moon Data: Numbers. Moon Data: Special Features 1. The Moon As Seen From Earth
 Moon Data: Numbers. Moon Data: Special Features 1. The Moon As Seen From Earth") 10. Our Barren Moon Lunar plains & craters Manned lunar exploration The lunar interior The Moon s geologic history The formation of the Moon Moon Data (Table 10-1) Moon Data: Numbers Diameter: 3,476.km
10. Our Barren Moon Lunar plains & craters Manned lunar exploration The lunar interior The Moon s geologic history The formation of the Moon Moon Data (Table 10-1) Moon Data: Numbers Diameter: 3,476.km
The Distribution of Mg- Spinel across the Moon and Constraints on Crustal Origin
 The Distribution of Mg- Spinel across the Moon and Constraints on Crustal Origin Carle M. Pieters 1 Kerri Donaldson Hanna 1 Leah Cheek 1 Deepak Dhingra 1 Tabb Prissel 1 Colin Jackson 1 Daniel Moriarty
NASA: BACK TO THE MOON
 NASA: BACK TO THE MOON Don Campbell Cornell University "I believe that this nation should commit itself to achieving the goal, before this decade is out, of landing a man on the moon and returning him
C1XS - The Chandrayaan-1 X-ray Spectrometer
 C1XS - The Chandrayaan-1 X-ray Spectrometer Manuel Grande, Brian Madison, P Sreekumar, Juhani Huovelin, Barry Kellett, Chris Howe, Ian Crawford, Dave R Smith and the C1XS team C1XS/D-CIXS - The Team M.
Phys 214. Planets and Life
 Phys 214. Planets and Life Dr. Cristina Buzea Department of Physics Room 259 E-mail: cristi@physics.queensu.ca (Please use PHYS214 in e-mail subject) Lecture 10. Geology and life. Part 1 (Page 99-123)
Dry Droplets of Fiery Rain Written by G. Jeffrey Taylor Hawai'i Institute of Geophysics and Planetology
 1 of 5 posted November 12, 1998 Dry Droplets of Fiery Rain Written by G. Jeffrey Taylor Hawai'i Institute of Geophysics and Planetology Chondrules are millimeter-sized spherical objects found in meteorites.
The C1XS Lunar X-ray Spectrometer for Chandrayaan-1
 The C1XS Lunar X-ray Spectrometer for Chandrayaan-1 Manuel Grande, P. Sreekumar, Ian Crawford, Barry Kellett Brian Maddison, Chris Howe Juhani Huovelin, and the C1XS team C1XS - The Team M. Grande, University
Statistical Analysis of the Links among Lunar Mare Soil Mineralogy, Chemistry, and Reflectance Spectra
 Icarus 155, 285 298 (2002) doi:10.1006/icar.2001.6749, available online at http://www.idealibrary.com on Statistical Analysis of the Links among Lunar Mare Soil Mineralogy, Chemistry, and Reflectance Spectra
Emission Temperature of Planets. Emission Temperature of Earth
 Emission Temperature of Planets The emission temperature of a planet, T e, is the temperature with which it needs to emit in order to achieve energy balance (assuming the average temperature is not decreasing
Fri. Apr. 14, Hewson paper: Geological Map using ASTER data Sabins Ch. 10 Oil Exploration Overview. Reading:
 Fri. Apr. 14, 2018 Hewson paper: Geological Map using ASTER data Sabins Ch. 10 Oil Exploration Overview Reading: Skim Sabins Chapter 10. Oil Exploration 1 Hewson et al. Objectives 1. 2. 3. 4. 5. 6. 7.
What is there in thee, moon, That thou shouldst move My heart so potently? By John Keats
 What is there in thee, moon, That thou shouldst move My heart so potently? By John Keats The most popular view about how the moon formed was that a space object collided with the Earth. The material that
QUATERNARY SCIENCES Vol. 22, No. 6
 22 6 2 0 0 2 11 QUATERNARY SCIENCES Vol. 22, No. 6 November, 2002 3 (, 100012 ;, 550002 ;, 550002), () ;, 66-3, - 3 ;; 1,,,10 %; 40 Ar, 40 Ar 40 K [1 ] 1-6 1 [ 2] Table 1 The escape velocity of some planets
Scientific Contributions of Lunar Robotic Precursor Missions
 Scientific Contributions of Lunar Robotic Precursor Missions Paul D. Spudis Johns Hopkins University Applied Physics Laboratory paul.spudis@jhuapl.edu www.spudislunarresources.com Presentation to LEAG
Testing polar spots of water-rich permafrost on the Moon: LEND observations onboard LRO
 JOURNAL OF GEOPHYSICAL RESEARCH, VOL. 117,, doi:10.1029/2011je003956, 2012 Testing polar spots of water-rich permafrost on the Moon: LEND observations onboard LRO I. Mitrofanov, 1 M. Litvak, 1 A. Sanin,
The Main Point. How do light and matter interact? Lecture #7: Radiation and Spectra II. How is light absorbed and emitted?
 Lecture #7: Radiation and Spectra II How is light absorbed and emitted? Models of Atomic Structure. Formation of Spectral Lines. Doppler Shift. Applications in Solar System Studies Detecting gaseous phases
Mini-RF: An Imaging Radar for the Moon. Ben Bussey The Johns Hopkins University Applied Physics Laboratory
 Mini-RF: An Imaging Radar for the Moon Ben Bussey The Johns Hopkins University Applied Physics Laboratory Paul D. Spudis President s Commission on Implementation of United States Space Exploration Policy
MARINER VENUS / MERCURY 1973 STATUS BULLETIN
 MARINER VENUS / MERCURY 1973 STATUS BULLETIN MARINER 10 PICTURES OF MERCURY; SECOND ENCOUNTER PLANNED Fig. 1. (a) Photomosaic of Mercury made from nine computer-enhanced pictures taken at 234,000 km, 6
Today. Events. Terrestrial Planet Atmospheres (continued) Homework DUE. Review next time? Exam next week
 Homework DUE. Review next time? Exam next week") Today Terrestrial Planet Atmospheres (continued) Events Homework DUE Review next time? Exam next week Planetary Temperature A planet's surface temperature is determined by the balance between energy from
Today Terrestrial Planet Atmospheres (continued) Events Homework DUE Review next time? Exam next week Planetary Temperature A planet's surface temperature is determined by the balance between energy from
Observing Habitable Environments Light & Radiation
 Homework 1 Due Thurs 1/14 Observing Habitable Environments Light & Radiation Given what we know about the origin of life on Earth, how would you recognize life on another world? Would this require a physical
AN INTRODUCTION TO COSMOCHEMISTRY
 AN INTRODUCTION TO COSMOCHEMISTRY CHARLES R. COWLEY Professor of Astronomy, University of Michigan CAMBRIDGE UNIVERSITY PRESS Foreword V a % e x i 1 Overview 1 1.1 The Scope of Cosmochemistry 1 1.2 Cosmochemistry
A) its rotation D) Sun, the Moon, and some stars C) an oblate sphere D) troposphere B) hydrosphere and troposphere B) less dense and more felsic
 its rotation D) Sun, the Moon, and some stars C) an oblate sphere D) troposphere B) hydrosphere and troposphere B) less dense and more felsic") 1. The Earth is slightly flattened from a perfect spherical shape because of A) its rotation B) the pull of the sun and moon C) storms on the sun's surface D) its molten core 2. The Earth's actual shape
1. The Earth is slightly flattened from a perfect spherical shape because of A) its rotation B) the pull of the sun and moon C) storms on the sun's surface D) its molten core 2. The Earth's actual shape
Chapter 10 Planetary Atmospheres Earth and the Other Terrestrial Worlds. What is an atmosphere? Planetary Atmospheres
 Chapter 10 Planetary Atmospheres Earth and the Other Terrestrial Worlds What is an atmosphere? Planetary Atmospheres Pressure Composition Greenhouse effect Atmospheric structure Color of the sky 1 Atmospheres
Science Return from Hayabusa
 Science Return from Hayabusa International Symposium Marco Polo and other Small Body Sample Return Mission 19 May 2009 Portoferraio, Isola d'elba, Italy Makoto Yoshikawa Hayabusa Science Team Japan Aerospace
ASTRONOMY. Chapter 9 CRATERED WORLDS PowerPoint Image Slideshow
 ASTRONOMY Chapter 9 CRATERED WORLDS PowerPoint Image Slideshow FIGURE 9.1 Apollo 11 Astronaut Edwin Buzz Aldrin on the Surface of the Moon. Because there is no atmosphere, ocean, or geological activity
(Received 21 January 2015; revision accepted 23 October 2015)
") Meteoritics & Planetary Science 51, Nr 2, 207 234 (2016) doi: 10.1111/maps.12588 Complexities in pyroxene compositions derived from absorption band centers: Examples from Apollo samples, HED meteorites,
Meteoritics & Planetary Science 51, Nr 2, 207 234 (2016) doi: 10.1111/maps.12588 Complexities in pyroxene compositions derived from absorption band centers: Examples from Apollo samples, HED meteorites,
ASTRO 120 Sample Exam
 ASTRO 120 Sample Exam 1) If a planet has a reasonably strong magnetic field, we know that a. It is made entirely of iron b. There is liquid nitrogen below the surface c. It can harbor life d. It has a
7. Our Solar System. Planetary Orbits to Scale. The Eight Planetary Orbits
 7. Our Solar System Terrestrial & Jovian planets Seven large satellites [moons] Chemical composition of the planets Asteroids & comets The Terrestrial & Jovian Planets Four small terrestrial planets Like
MIDTERM REVIEW QUESTIONS - PACKET #2 (75 MULTIPLE CHOICE QUESTIONS)
") MIDTERM REVIEW QUESTIONS - PACKET #2 (75 MULTIPLE CHOICE QUESTIONS) 1. Which graph best represents the effect that heating has on air density in the atmosphere? 2. An empty 250-milliliter beaker has a
MIDTERM REVIEW QUESTIONS - PACKET #2 (75 MULTIPLE CHOICE QUESTIONS) 1. Which graph best represents the effect that heating has on air density in the atmosphere? 2. An empty 250-milliliter beaker has a
N. A. Schwadron, J. K. Wilson, M. D. Looper, A. P. Jordan, H. E. Spence, J. B. Blake, A. W. Case, Y. Iwata, J. C. Kasper, W. M. Farrell, D. J.
 Signatures of Volatiles in the CRaTER Proton Albedo N. A. Schwadron, J. K. Wilson, M. D. Looper, A. P. Jordan, H. E. Spence, J. B. Blake, A. W. Case, Y. Iwata, J. C. Kasper, W. M. Farrell, D. J. Lawrence,
Little Learners Activity Guide
 LUNAR RECONNAISSANCE ORBITER CAMERA Little Learners Activity Guide Learn about the Moon with puzzles, coloring, and fun facts! Mare Imbrium Mare Serenitatis Mare Tranquillitatis Oceanus Procellarum Mare
CARBONACEOUS CHONDRITES AND AQUEOUS ALTERATION
 CARBONACEOUS CHONDRITES AND AQUEOUS ALTERATION Discussion Summarizer: Ariel Deutsch Hiroi et al., 1996 INTRODUCTION The authors present a thermal metamorphism study by comparing the 0.7 µm, 3 µm, and UV
Constellation Program Office Tier 2 Regions of Interest for Lunar Reconnaissance Orbiter Camera (LROC) Imaging
 Imaging") Constellation Program Office Tier 2 Regions of Interest for Lunar Reconnaissance Orbiter Camera (LROC) Imaging Regions of Interest listed in alphabetical order ( no priority implied) East longitudes represented
Constellation Program Office Tier 2 Regions of Interest for Lunar Reconnaissance Orbiter Camera (LROC) Imaging Regions of Interest listed in alphabetical order ( no priority implied) East longitudes represented
Lecture 11 Earth s Moon January 6d, 2014
 1 Lecture 11 Earth s Moon January 6d, 2014 2 Moon and Earth to Scale Distance: a = 385,000 km ~ 60R Eccentricity: e = 0.055 Galileo Spacecraft Dec. 1992 3 [Review question] Eclipses do not occur each month
Lunar Surface Material Composition Mapping
 Introduction: Lunar Surface Material Composition Mapping Japan, India, China, and the United States have recently sent spacecraft orbiters to study the lunar surface. The main focus of these missions has
The Main Point. Basic Properties of Mars. Observations. Lecture #19: Mars
 Mars: Overview General properties Telescopic observations Space missions Atmospheric Characteristics Reading: Chapters 7.1 (Mars), 9.4, 10.4 Lecture #19: Mars The Main Point Changes in the Martian surface
The Orbiting Carbon Observatory (OCO)
") GEMS 2006 Assembly The Orbiting Carbon Observatory (OCO) http://oco.jpl.nasa.gov David Crisp, OCO PI (JPL/Caltech) February 2006 1 of 13, OCO Dec 2005 Page 1 The Orbiting Carbon Observatory (OCO) OCO will
GEMS 2006 Assembly The Orbiting Carbon Observatory (OCO) http://oco.jpl.nasa.gov David Crisp, OCO PI (JPL/Caltech) February 2006 1 of 13, OCO Dec 2005 Page 1 The Orbiting Carbon Observatory (OCO) OCO will
Measuring Carbon Dioxide from the A-Train: The OCO-2 Mission
 Measuring Carbon Dioxide from the A-Train: The OCO-2 Mission David Crisp, OCO-2 Science Team Leader for the OCO-2 Science Team Jet Propulsion Laboratory, California Institute of Technology March 2013 Copyright
EXERCISE 2 (16 POINTS): LUNAR EVOLUTION & APOLLO EXPLORATION
: LUNAR EVOLUTION & APOLLO EXPLORATION") 1 GEOLOGICAL SCIENCES 0050 I am aware of the Brown University Honor Code [see the Student Handbook, which can be accessed through the Geo0050 web site], understand that this exercise falls under that code,
1 GEOLOGICAL SCIENCES 0050 I am aware of the Brown University Honor Code [see the Student Handbook, which can be accessed through the Geo0050 web site], understand that this exercise falls under that code,
Leah C. Cheek. Visiting Scholar The University of Texas at Austin
 Leah C. Cheek Visiting Scholar The University of Texas at Austin Leah_Cheek@alumni.brown.edu www.leahcheek.com RESEARCH INTERESTS I am a geoscientist specializing in the application of remote sensing and
Planetary Temperatures
 Planetary Temperatures How does Sunlight heat a planet with no atmosphere? This is similar to our dust grain heating problem First pass: Consider a planet of radius a at a distance R from a star of luminosity
The Moon: Stepping Stone to the Planets
 The Moon: Stepping Stone to the Planets William A. Ambrose Houston Geological Society May 10, 2017 Schmitt (2004) Why Return to the Moon? Earth s closest neighbor -Three-day trip -Technology already exists
2. Fargo, North Dakota receives more snow than Charleston, South Carolina.
 2015 National Tournament Division B Meteorology Section 1: Weather versus Climate Chose the answer that best answers the question 1. The sky is partly cloudy this morning in Lincoln, Nebraska. 2. Fargo,