MAGNETIC POLES AND CLIMATE
|
|
|
- Bennett Stafford
- 6 years ago
- Views:
Transcription

1 MAGNETIC POLES AND CLIMATE Reno, NV June 25,

2 The strength of the Earth s magnetic field varies tremendously around the world. The following figure shows the magnetic field intensity around the world, with greatest strength near the poles and the weakest area over South America and across the El Nino area of the Pacific Ocean 2

3 The following figure shows another view of the Earth s magnetic field intensity in 2000 from the Danish Orsted satellite 3

4 The following figure shows the global temperature change from 1978 to 2006 for the lower troposphere from satellite data 4

5 This figure shows the same temperature data with the magnetic field intensity contours (5000 nt contours in red) from the first (above) figure superimposed. The areas of greatest warming are where the magnetic field is at its greatest intensity in the northern polar region, whereas the area of greatest cooling is where the magnetic field is at its greatest intensity in the southern polar region. 5
 shows (magenta) the path of the North Magnetic Pole (NMP) since its discovery in 1831 to the last observed position in 2001, and (purple)")
6 The locations of the magnetic poles are not static and continuously change position. The following figure (left) shows (magenta) the path of the North Magnetic Pole (NMP) since its discovery in 1831 to the last observed position in 2001, and (purple) past NMP positions since approximately 1600 derived from spherical harmonic models 6

7 The next figure illustrates that the position of the NMP given for a particular year is an average position it wanders daily around this average position and, on days when the magnetic field is disturbed, may be displaced by 80 km or more. Although the daily motion on any given day is irregular, the average path forms a well-defined oval due to interaction with the sun s magnetic field 7
8 Since about 1970 the NMP has accelerated and is now moving at more than 40 km per year. The following figure shows the average change in motion of the North Magnetic Pole since the 1950s. Since the early 1970s the rate of change of the location increased from about 9 km/yr to 41 km/yr 8
9 A 2005 Oregon State University article Movement of Earth's North Magnetic Pole Accelerating Rapidly states: After some 400 years of relative stability, Earth's North Magnetic Pole has moved nearly 1,100 kilometers out into the Arctic Ocean during the last century and at its present rate could move from northern Canada to Siberia within the next halfcentury. the North Magnetic Pole has moved all over the place over the last few thousand years. In general, it moves back and forth between northern Canada and Siberia. 9

10 The following figure shows the magnetic field intensity 10

11 This figure shows the magnetic meridians. The NMP position is indicated by the star. The magnetic field is asymmetrical with two field maxima: one over the northwest shore of Hudson Bay in Canada, and one over the Central Siberian Plateau. The convergences of the magnetic meridians indicate the approximate path followed by the moving NMP 11
12 The following figure shows the historical movement of the South Magnetic Pole 12
 model.")
13 The following figures show movement of the magnetic poles projected to 2010 calculated using the International Geomagnetic Reference Field (IGRF) model. The south magnetic pole has not accelerated over the last few decades like the NMP has. 13
 model.")
14 The following figures show movement of the magnetic poles projected to 2010 calculated using the International Geomagnetic Reference Field (IGRF) model. The south magnetic pole has not accelerated over the last few decades like the NMP has. 14

15 The following figure shows the rate of change of NMP declination at Lerwick, Eskdalemuir and Greenwich-Abinger-Hartland observatories in the United Kingdom. It can be seen from this plot that there have been a number of changes in the general trend of secular variation in the past, in particular at about 1925, 1969, 1978 and These sudden changes are known as jerks or impulses and, at the present time, are not well understood and are certainly not predictable. Some researchers have found evidence for a correlation with length-of-day changes. 15
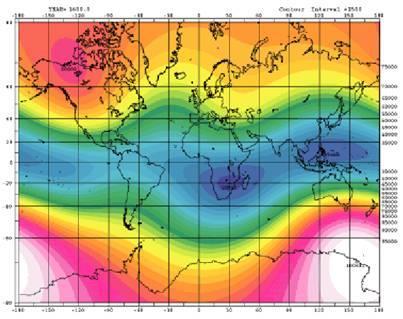
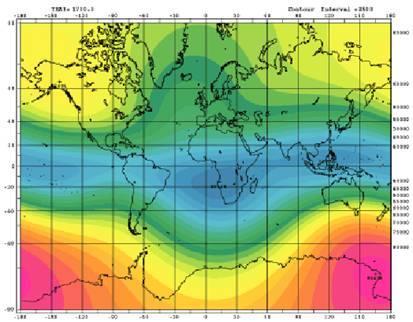
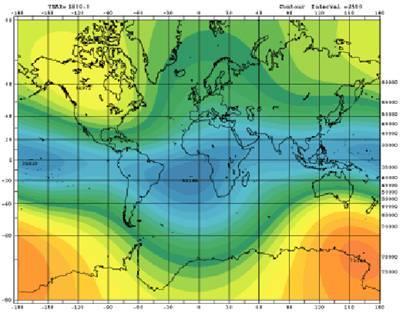
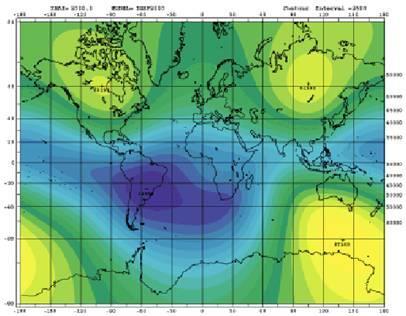
16 The following sequence of figures shows the change of the magnetic field intensity over the last 400 years derived from IGRF, along with the NMP movement map shown previously. The overall intensity of the magnetic field has decreased. In 1600 there was a more distinct intensity over northern Canada. Over the centuries this has weakened, while increasing over the last century in northern Siberia. As the field intensity increases in Siberia and decreases in Canada, the north magnetic pole moves across the arctic from Canada towards Siberia. 16
17
18
19

20
21

22 22
23 The following figure is from the British Geological Survey, Measurements have been made of the Earth's magnetic field more or less continuously since about If we look at the trend in the strength of the magnetic field over this time (for example the so-called 'dipole moment' shown in the graph below) we can see a downward trend.... We also know from studies of the magnetisation of minerals in ancient clay pots that the Earth's magnetic field was approximately twice as strong in Roman times as it is now. 23
24 The Earth s magnetic field acts as a shield against the bombardment of particles continuously streaming from the sun. Because the solar particles (ions and electrons) are electrically charged, they feel magnetic forces and most are deflected by our planet's magnetic field. However, our magnetic field is a leaky shield and the number of particles breaching this shield depends on the orientation of the sun s magnetic field. Twenty times more solar particles cross the Earth s leaky magnetic shield when the sun s magnetic field is aligned with that of the Earth compared to when the two magnetic fields are oppositely directed The Earth s magnetic field interacts with the Sun s magnetic field. The interplanetary magnetic field (IMF) is a part of the Sun's magnetic field that is carried into interplanetary space by the solar wind. 24

25 The Earth s magnetic field is distorted by the solar wind as illustrated by the following figures 25

26 The Earth s magnetic field is distorted by the solar wind as illustrated by the following figures 26
27 Most of the energy transfer to the Earth from the solar wind is accomplished electrically, and nearly the entire voltage associated with this process appears in the polar cap region, which extends typically less than 20 in latitude from the magnetic pole. The total voltage across the polar cap can be as large as 100,000 volts, rivaling that of thunderstorm electrification of the planet in magnitude. This polar cap electric field is the major source of large-scale horizontal voltage differences in the atmosphere. Moreover, the dynamic polar region accounts for a large fraction of the variability inherent in our upper atmosphere, variability due to chaotic changes in the solar wind magnetic field that produces large-scale restructuring of the cavity enclosing the Earth s magnetic field. This restructuring visibly manifests itself most clearly in the production of ionized plasmas and the associated distribution of aurora high over the north and south polar regions. In turn, the Earth s lower atmosphere (that part responsible for weather phenomena) undergoes variations in composition and dynamics influenced by these coupling effects through a complex and as yet not fully understood feedback system. 27
28 Coronal mass ejections (CMEs) are eruptions into interplanetary space of as much as a few billion tons of plasma and embedded magnetic fields from the Sun's corona.... The exact processes involved in the release of CMEs are not known. CMEs can occur at any time during the solar cycle, but their occurrence rate increases with increasing solar activity and peaks around solar maximum.... Fast CMEs --those traveling faster than the ambient solar wind-- are responsible for triggering large, non-recurrent geomagnetic storms when they encounter the Earth's magnetosphere. Such storms can result from the passage either of the CME itself or of the shock created by the fast CME's interaction with the slowermoving solar wind. The majority of large and major geomagnetic storms are generated by the encounter with both the interplanetary shock and the CME that drives it. The "geo-effectiveness" of CMEs --i.e., their ability to disturb the Earth's magnetosphere-- is a function of their speed, the strength of their magnetic field, and the presence of a strong southward magnetic field component 28

29 The following figure shows the correspondence of solar geomagnetic storms and the solar sunspot cycle 29
30 A study done by an Assistant Professor of Earth Sciences at Dartmouth University looked at the cycles of the sun s magnetic fluctuations and found: when the sun is magnetically more active, the earth experiences a warmer climate, and vice versa, when the sun is magnetically less active, there is a glacial period. Right now, the earth is in an interglacial period (in between ice ages) that began about 11,000 years ago, and as expected, this is also a time when the estimated solar activity appears to be high Authors of a Danish study published in 2009 stated: Our results show a strong correlation between the strength of the earth's magnetic field and the amount of precipitation in the tropics 30
31 A 2005 study (Georgieva, Bianchi and Kirov: Once Again About Global Warming and Solar Activity, Mem. Societa Astronomica Italiana, Vol 76, 2005 states: We show that the index commonly used for quantifying long-term changes in solar activity, the sunspot number, accounts for only one part of solar activity and using this index leads to the underestimation of the role of solar activity in the global warming in the recent decades. A more suitable index is the geomagnetic activity which reflects all solar activity, and it is highly correlated to global temperature variations in the whole period for which we have data. The study examined the geo-effectiveness of coronal mass ejections (CME) separated into two types magnetic cloud (MC) and non-mc CMEs (CME), and coronal holes (CH). when speaking about the influence of solar activity on the Earth, we cannot neglect the contribution of the solar wind originating from coronal holes. However, these open magnetic field regions are not connected in any way to sunspots, so their contribution is totally neglected when we use the sunspot number as a measure of solar activity 31
32 The following figures are from their study. 32
33 The following figures show the global average temperature from

34 The total solar magnetic flux (black line bounding grey shading and blue line) along with the annual sunspot number (shaded purple). The solar figure is from M. Lockwood, R. Stamper, and M.N. Wild: A Doubling of the Sun's Coronal Magnetic Field during the Last 100 Years, Nature Vol. 399, 3 June 1999 which states: The magnetic flux in the solar corona has risen by 40% since 1964 and by a factor of 2.3 since
 on the solar flux (from above right).")
35 The following figure superimposes the global temperature (from above left changed to red) on the solar flux (from above right). 35
 showing the decrease in GCR throughout the 1900s. 36")
36 The following figure shows the change in global cosmic ray flux (GCR) from four independent proxies (left) showing the decrease in GCR throughout the 1900s. 36

37 The other figure compares the same data with the solar magnetic flux from above, showing the strong inverse correlation between the solar magnetic flux and the cosmic ray flux. The figures above and below indicate a strong correlation between the solar magnetic flux, the cosmic ray flux, and the global temperatures. 37

38 The following figure shows global average temperature 38
39 The average change in motion of the North Magnetic Pole as shown previously 39

40 The next figure below combines these two, with the North Magnetic Pole data changed to red. There is a clear correlation between the rate of change of the North Magnetic Pole location and the global temperature 40
41 A 2009 paper (Adrian Kerton: Climate Change and the Earth's Magnetic Poles, A Possible Connection, Energy & Environment, Vol 20, 2009 states: Analysis of the movement of the Earth's magnetic poles over the last 105 years demonstrates strong correlations between the position of the north magnetic, and geomagnetic poles, and both northern hemisphere and global temperatures. Although these correlations are surprising, a statistical analysis shows there is a less than one percent chance they are random, but it is not clear how movements of the poles affect climate. 41
42 The following figure is from that paper, comparing normalized NMP location in terms of latitude and longitude with normalized northern hemisphere temperature anomalies. 42
43 The global cooling over the past several years may be related to the recent decrease in the strength of the solar magnetic field. The following figure (left) shows global measurements of solar wind pressure by the Ulysses satellite (green curves - solar wind in , blue curves - solar winds in ). The average pressure of the solar wind has dropped more than 20% since the mid-1990s the speed of the million mph solar wind hasn't decreased much only 3%. The change in pressure comes mainly from reductions in temperature and density. The solar wind is 13% cooler and 20% less dense. The solar wind isn't inflating the heliosphere as much as it used to That means less shielding against cosmic rays. Ulysses also finds that the sun's underlying magnetic field has weakened by more than 30% since the mid-1990s 43

44 44
45 45
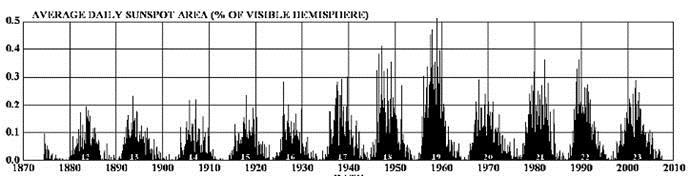
46 The following figure shows the sunspot cycles since The sunspot cycle is approximately an 11-year cycle the sun s magnetic field reverses with each sunspot cycle and thus after two sunspot cycles the magnetic field has completed a reversal cycle a Hale Cycle and is back to where it started). Thus a complete magnetic sunspot cycle is approximately 22 years (the 11 year cycle varies substantially). From the solar magnetic flux / sunspot plot shown above it can be seen that the rapid increase in magnetic flux occurs at the onset of the sunspot cycle, a couple of years after the solar minimum occurs. 46
47 47
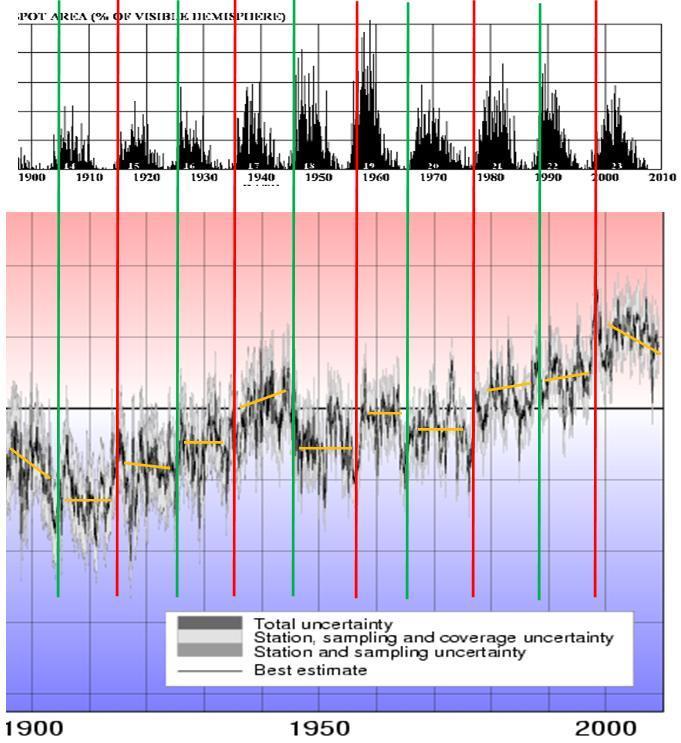
48 The following figure compares the Hadley (HadCrut3) global average temperature shown previously with the sunspot cycle since 1900 from above. Shifts in global temperature coincide with the onset of odd-numbered sunspot cycles (red vertical lines). In each case approximately 1915, 1936, 1957, 1977, 1998 the onset of the odd-numbered cycle corresponds to an increase in global temperature. The onsets of even-numbered solar cycles (green vertical lines) are not as consistent. 48
49 49
50 A study of solar magnetic clouds during by Wu, Lepping & Gopalswamy, Solar Cycle Variations of Magnetic Clouds and CMEs states: The average occurrence rate is 9 magnetic clouds per year for the overall period (68 events/7.6 years). It is found that some of the frequency of occurrence anomalies were during the early part of Cycle 23: 1. Only 4 magnetic clouds were observed in 1999, and 2. An unusually large number of magnetic clouds (16 events) were observed in 1997 in which the Sun was beginning the rising of Cycle 23 50

51 The following figure shows the relative polarity of the Sun s magnetic poles for recent sunspot cycles along with the solar magnetic flux 51
52 A 2007 study (Vovk, V.; Egorova, L., Role of solar activity in formation of the anomalous El Nin'o current, Geomagnetism and Aeronomy, Volume 47, Number 1, February 2007 found a sharp decrease in the SOI indices, which corresponds to the beginning of El Nin'o (ENSO), is preceded one or two months before by a 20% increase in the monthly average Wolf numbers. In warm years of Southern Atmospheric Oscillation a linear relationship is observed between the SOI indices and the number of geo-effective solar flares with correlation coefficients p < 0.5. It is shown that in warm years a change in the general direction of the surface wind to anomalous at the above stations is preceded one or two days before by an increase in the daily average values of IMF Bz. An increase in the SOI indices is preceded one or two months before by a considerable increase in the monthly average values of the magnetic AE indices. 52
53 A 2009 study (Knudsen and Riisager, Is there a link between the Earth s magnetic field and low-latitude precipitation?, Geology, v 37, January 2009) states: Some studies indicate that the solar modulation of galactic cosmic ray (GCR) particles has profound consequences for Earth's climate system. A corollary of the GCR-climate theory involves a link between Earth's magnetic field and climate, since the geomagnetic field also modulates the GCR flux reaching Earth's atmosphere. In this study, we explore this potential geomagnetic-climate link by comparing a new reconstruction of the Holocene geomagnetic dipole moment with high-resolution speleothem data from China and Oman. 53
54 The speleothem 18 O data represent proxy records for past precipitation in low-latitude regions, which is a climate parameter that is likely to have been sensitive to variations in the GCR flux modulated by the dipole moment. Intriguingly, we observe a relatively good correlation between the high-resolution speleothem 18 O records and the dipole moment, suggesting that Earth's magnetic field to some degree influenced low-latitude precipitation in the past. In addition to supporting the notion that variations in the geomagnetic field may have influenced Earth's climate in the past, our study also provides some degree of support for the controversial link between GCR particles, cloud formation, and climate. 54
55 A study published in 2008 (Robert Baker, Exploratory Analysis of Similarities in Solar Cycle Magnetic Phases with Southern Oscillation Index Fluctuations in Eastern Australia Geophysical Research Papers, Vol. 46, 2008) states: There is growing interest in the role that the Sun's magnetic field has on weather and climatic parameters, particularly the ~11 year sunspot (Schwab) cycle, the ~22 yr magnetic field (Hale) cycle and the ~88 yr (Gleissberg) cycle. These cycles and the derivative harmonics are part of the peculiar periodic behaviour of the solar magnetic field. Using data from 1876 to the present, the exploratory analysis suggests that when the Sun's South Pole is positive in the Hale Cycle, the likelihood of strongly positive and negative Southern Oscillation Index (SOI) values increase after certain phases in the cyclic ~22 yr solar magnetic field. 55
56 The SOI is also shown to track the pairing of sunspot cycles in ~88 yr periods. This coupling of odd cycles, 23 15, and 19 11, produces an apparently close charting in positive and negative SOI fluctuations for each grouping. This Gleissberg effect is also apparent for the southern hemisphere rainfall anomaly. Over the last decade, the SOI and rainfall fluctuations have been tracking similar values to that recorded in Cycle 15 ( ). This discovery has important implications for future drought predictions in Australia and in countries in the northern and southern hemispheres which have been shown to be influenced by the sunspot cycle. Further, it provides a benchmark for longterm SOI behaviour. 56
57 The onset of an odd-numbered sunspot cycle ( , ) results in the relative alignment of the Earth s and the Sun s magnetic fields (positive North pole on the Sun) allowing greater penetration of the geomagnetic storms into the Earth s atmosphere. As mentioned previously Twenty times more solar particles cross the Earth s leaky magnetic shield when the sun s magnetic field is aligned with that of the Earth compared to when the two magnetic fields are oppositely directed 57

58 58
Geomagnetic Disturbance Report Reeve Observatory
 Event type: Various geomagnetic disturbances including coronal hole high-speed stream, coronal mass ejection, sudden impulse and reverse shock effects Background: This background section defines the various
A Correlative Study of Climate Changes and Solar Activity
 10 A Correlative Study of Climate Changes and Solar Activity S. R. Lahauriya and A. P. Mishra Department of Physics, Govt. P. G. Autonomous College, Datia (M.P.) Abstract:- The Sun is ultimate source of
Chapter outline. Reference 12/13/2016
 Chapter 2. observation CC EST 5103 Climate Change Science Rezaul Karim Environmental Science & Technology Jessore University of science & Technology Chapter outline Temperature in the instrumental record
Geomagnetic storms. Measurement and forecasting
 Geomagnetic storms. Measurement and forecasting Anna Gustavsson 17 October 2006 Project of the Space Physics Course 2006 Umeå University 1 Introduction Effects of magnetic storms on technology Geomagnetic
INTERPLANETARY ASPECTS OF SPACE WEATHER
 INTERPLANETARY ASPECTS OF SPACE WEATHER Richard G. Marsden Research & Scientific Support Dept. of ESA, ESTEC, P.O. Box 299, 2200 AG Noordwijk, NL, Email: Richard.Marsden@esa.int ABSTRACT/RESUME Interplanetary
Solar Activity The Solar Wind
 Solar Activity The Solar Wind The solar wind is a flow of particles away from the Sun. They pass Earth at speeds from 400 to 500 km/s. This wind sometimes gusts up to 1000 km/s. Leaves Sun at highest speeds
Climate Changes due to Natural Processes
 Climate Changes due to Natural Processes 2.6.2a Summarize natural processes that can and have affected global climate (particularly El Niño/La Niña, volcanic eruptions, sunspots, shifts in Earth's orbit,
1-4-1A. Sun Structure
 Sun Structure A cross section of the Sun reveals its various layers. The Core is the hottest part of the internal sun and is the location of nuclear fusion. The heat and energy produced in the core is
The Magnetic Sun. CESAR s Booklet
 The Magnetic Sun CESAR s Booklet 1 Introduction to planetary magnetospheres and the interplanetary medium Most of the planets in our Solar system are enclosed by huge magnetic structures, named magnetospheres
Earth s Magnetic Field
 Magnetosphere Earth s Magnetic Field The Earth acts much like a bar magnet: its magnetic field deflects compasses on the Earth s surface to point northwards. Magnetic field lines North Pole S N South Pole
INVESTIGATIONS OF THE STRUCTURE OF THE DIURNAL VARIATIONS OF GEOMAGNETIC FIELD
 Geologica Macedonica, Vol. 26, No. 1, pp. 37 51 (2012) GEOME 2 ISSN 0352 1206 Manuscript received: May 6, 2012 UDC: 556.385 Accepted: October 10, 2012 Original scientific paper INVESTIGATIONS OF THE STRUCTURE
Module 4: Astronomy - The Solar System Topic 2 Content: Solar Activity Presentation Notes
 The Sun, the largest body in the Solar System, is a giant ball of gas held together by gravity. The Sun is constantly undergoing the nuclear process of fusion and creating a tremendous amount of light
The Transfer of Heat
 The Transfer of Heat Outcomes: S2-4-03 Explain effects of heat transfer within the atmosphere and hydrosphere on the development and movement of wind and ocean currents. Coriolis Effect In our ecology
THE CONNECTION OF SECULAR VARIATION OF SOLAR ACTIVITY, ATMOSPHERE CIRCULATION AND AIR TEMPERATURE OF NORTHERN HEMISPHERE
 THE CONNECTION OF SECULAR VARIATION OF SOLAR ACTIVITY, ATMOSPHERE CIRCULATION AND AIR TEMPERATURE OF NORTHERN HEMISPHERE T.E.Val chuk 1, N.K.Kononova 2 1 Pushkov Institute of Terrestrial Magnetism, Ionosphere
At it s most extreme very low pressure off Indonesia, every high off SA, ~8 o C difference over the Pacific and ½ m water level differential) ENSO is
 ENSO is") This summer : El Niño (ENSO) and the NAO (Ocean/Atmosphere coupling teleconnections) A teleconnection (as used in the atmospheric sciences) refers to climate anomalies that are related across very large
This summer : El Niño (ENSO) and the NAO (Ocean/Atmosphere coupling teleconnections) A teleconnection (as used in the atmospheric sciences) refers to climate anomalies that are related across very large
Solar and Interplanetary Disturbances causing Moderate Geomagnetic Storms
 J. Astrophys. Astr. (2008) 29, 263 267 Solar and Interplanetary Disturbances causing Moderate Geomagnetic Storms Santosh Kumar, M. P. Yadav & Amita Raizada Department of P.G. Studies and Research in Physics
Effect of CME Events of Geomagnetic Field at Indian Station Alibag and Pondicherry
 Effect of CME Events of Geomagnetic Field at Indian Station Alibag and Pondicherry Babita Chandel Sri Sai University Palampur, Himachal Pradesh, India Abstract: Space weather activity CMEs, and solar energetic
The Solar wind - magnetosphere - ionosphere interaction
 The Solar wind - magnetosphere - ionosphere interaction Research seminar on Sun-Earth connections Eija Tanskanen Friday January 27, 2006 12-14 a.m., D115 Outline 1. Basics of the Earth s magnetosphere
(The Open Flux Has Been Constant Since at Least 1840s) Long-term Variations of Open Flux in the Solar Corona
 Long-term Variations of Open Flux in the Solar Corona") Long-term Variations of Open Flux in the Solar Corona (The Open Flux Has Been Constant Since at Least 1s) Leif Svalgaard ETK, Houston, TX Abstract: The geomagnetic record allows us to infer the strength
Long-term Variations of Open Flux in the Solar Corona (The Open Flux Has Been Constant Since at Least 1s) Leif Svalgaard ETK, Houston, TX Abstract: The geomagnetic record allows us to infer the strength
Historical Changes in Climate
 Historical Changes in Climate Medieval Warm Period (MWP) Little Ice Age (LIA) Lamb, 1969 Hunters in the snow by Pieter Bruegel, 1565 Retreat of the Rhone Glacier shown by comparing the drawing from 1750
Space Physics: Recent Advances and Near-term Challenge. Chi Wang. National Space Science Center, CAS
 Space Physics: Recent Advances and Near-term Challenge Chi Wang National Space Science Center, CAS Feb.25, 2014 Contents Significant advances from the past decade Key scientific challenges Future missions
The Solar Wind Space physics 7,5hp
 The Solar Wind Space physics 7,5hp Teknisk fysik '07 1 Contents History... 3 Introduction... 3 Two types of solar winds... 4 Effects of the solar wind... 5 Magnetospheres... 5 Atmospheres... 6 Solar storms...
Space Physics. An Introduction to Plasmas and Particles in the Heliosphere and Magnetospheres. May-Britt Kallenrode. Springer
 May-Britt Kallenrode Space Physics An Introduction to Plasmas and Particles in the Heliosphere and Magnetospheres With 170 Figures, 9 Tables, Numerous Exercises and Problems Springer Contents 1. Introduction
8.2 The Sun pg Stars emit electromagnetic radiation, which travels at the speed of light.
 8.2 The Sun pg. 309 Key Concepts: 1. Careful observation of the night sky can offer clues about the motion of celestial objects. 2. Celestial objects in the Solar System have unique properties. 3. Some
Long term data for Heliospheric science Nat Gopalswamy NASA Goddard Space Flight Center Greenbelt, MD 20771, USA
 Long term data for Heliospheric science Nat Gopalswamy NASA Goddard Space Flight Center Greenbelt, MD 20771, USA IAU340 1-day School, Saturday 24th February 2018 Jaipur India CMEs & their Consequences
El Niño / Southern Oscillation
 El Niño / Southern Oscillation Student Packet 2 Use contents of this packet as you feel appropriate. You are free to copy and use any of the material in this lesson plan. Packet Contents Introduction on
Introduction to Space Weather
 Introduction to Space Weather We may have been taught that there is a friendly, peaceful nonhostile relationship between the Sun and the Earth and that the Sun provides a constant stream of energy and
Coronal Mass Ejections in the Heliosphere
 Coronal Mass Ejections in the Heliosphere N. Gopalswamy (NASA GSFC) http://cdaw.gsfc.nasa.gov/publications Plan General Properties Rate & Solar Cycle Variability Relation to Polarity Reversal CMEs and
CORRELATION OF CLIMATIC AND SOLAR VARIATIONS OVER THE PAST 500 YEARS AND PREDICTING GLOBAL CLIMATE CHANGES FROM RECURRING CLIMATE CYCLES
 Easterbrook, D.J., 2008, Correlation of climatic and solar variations over the past 500 years and predicting global climate changes from recurring climate cycles: International Geological Congress, Oslo,
Geomagnetic activity indicates large amplitude for sunspot cycle 24
 Geomagnetic activity indicates large amplitude for sunspot cycle 24 David H. Hathaway and Robert M. Wilson NASA/National Space Science and Technology Center Huntsville, AL USA Abstract. The level of geomagnetic
The Dancing Lights Program
 The Sun Teacher Background: The Dancing Lights Program Margaux Krahe Many people think the Sun is just a fiery yellow ball. The Sun is not actually burning because fire requires oxygen. Really, the Sun
Atmospheric Responses to Solar Wind Dynamic Pressure
 Atmospheric Responses to Solar Wind Dynamic Pressure Hua Lu British Antarctic Survey Outline Background: Sun-Earth Climate Connection Solar wind/geomagnetic activity signals with 3 examples stratospheric
THE PACIFIC DECADAL OSCILLATION (PDO)
") THE PACIFIC DECADAL OSCILLATION (PDO) The Pacific Decadal Oscillation (PDO) refers to cyclical variations in sea surface temperatures in the Pacific Ocean. A detailed summary of the PDO is given in D Aleo
THE PACIFIC DECADAL OSCILLATION (PDO) The Pacific Decadal Oscillation (PDO) refers to cyclical variations in sea surface temperatures in the Pacific Ocean. A detailed summary of the PDO is given in D Aleo
Chapter 8 Geospace 1
 Chapter 8 Geospace 1 Previously Sources of the Earth's magnetic field. 2 Content Basic concepts The Sun and solar wind Near-Earth space About other planets 3 Basic concepts 4 Plasma The molecules of an
The Sun sends the Earth:
 The Sun sends the Earth: Solar Radiation - peak wavelength.visible light - Travels at the speed of light..takes 8 minutes to reach Earth Solar Wind, Solar flares, and Coronal Mass Ejections of Plasma (ionized
Name Date Class. growth rings of trees, fossilized pollen, and ocean. in the northern hemisphere.
 Lesson Outline LESSON 2 A. Long-Term Cycles 1. A(n) climate cycle takes much longer than a lifetime to complete. a. To learn about long-term climate cycles, scientists study natural records, such as growth
Teacher Background: The Dancing Lights Program
 Teacher Background: The Dancing Lights Program The Sun Many people think the Sun is just a fiery yellow ball. The Sun isn t actually burning because fire requires oxygen. Really, the Sun a giant ball of
Lecture #13 notes, Geology 3950 Spring 2006: CR Stern Magnetic reversals (text pages th edition and in the 5 th edition)
") Lecture #13 notes, Geology 3950 Spring 2006: CR Stern Magnetic reversals (text pages 35-37 4 th edition and 53-55 in the 5 th edition) The earth has a magnetic field generated by circulation of charged
Lecture #13 notes, Geology 3950 Spring 2006: CR Stern Magnetic reversals (text pages 35-37 4 th edition and 53-55 in the 5 th edition) The earth has a magnetic field generated by circulation of charged
An Introduction to Space Weather. J. Burkepile High Altitude Observatory / NCAR
 An Introduction to Space Weather J. Burkepile High Altitude Observatory / NCAR What is Space Weather? Space Weather refers to conditions in interplanetary space, produced by the Sun, that can disrupt
Eurasian Snow Cover Variability and Links with Stratosphere-Troposphere Coupling and Their Potential Use in Seasonal to Decadal Climate Predictions
 US National Oceanic and Atmospheric Administration Climate Test Bed Joint Seminar Series NCEP, Camp Springs, Maryland, 22 June 2011 Eurasian Snow Cover Variability and Links with Stratosphere-Troposphere
Geomagnetic Disturbance Report Reeve Observatory
 Event type: Geomagnetic disturbances due to recurrent coronal hole high-speed stream Background: This background section defines the events covered. A coronal hole is a large dark region of less dense
THE ATMOSPHERE IN MOTION
 Funding provided by NOAA Sectoral Applications Research Project THE ATMOSPHERE IN MOTION Basic Climatology Oklahoma Climatological Survey Factor 1: Our Energy Source Hi, I m the Sun! I provide 99.9999+
EFFECT OF SOLAR AND INTERPLANETARY DISTURBANCES ON SPACE WEATHER
 Indian J.Sci.Res.3(2) : 121-125, 2012 EFFECT OF SOLAR AND INTERPLANETARY DISTURBANCES ON SPACE WEATHER a1 b c SHAM SINGH, DIVYA SHRIVASTAVA AND A.P. MISHRA Department of Physics, A.P.S.University, Rewa,M.P.,
Sunspot Cycle Worksheet
 Sunspot Cycle Worksheet Read the Explore information and answer the Explain questions in your own words. Explore: Global warming and climate change are international concerns and the focus of much controversy.
MAGNETIC FIELDS AND CLIMATE
 MAGNETIC FIELDS AND CLIMATE Reno, NV June 25, 2009 1 The earth's climate has been significantly affected by the planet's magnetic field, according to a Danish study that could challenge the notion that
Winter. Here s what a weak La Nina usually brings to the nation with tempseraures:
 2017-2018 Winter Time again for my annual Winter Weather Outlook. Here's just a small part of the items I considered this year and how I think they will play out with our winter of 2017-2018. El Nino /
There are two more types of solar wind! The ballerina Sun right before activity minimum. The ballerina dancing through the solar cycle
 There are two more types of solar wind! 3. Low speed wind of "maximum" type Similar characteristics as (2), except for Lectures at the International Max-Planck-Research School Oktober 2002 by Rainer Schwenn,
Tracking Solar Eruptions to Their Impact on Earth Carl Luetzelschwab K9LA September 2016 Bonus
 Tracking Solar Eruptions to Their Impact on Earth Carl Luetzelschwab K9LA September 2016 Bonus In June 2015, the Sun emitted several M-Class flares over a 2-day period. These flares were concurrent with
Website Lecture 3 The Physical Environment Part 1
 Website http://websites.rcc.edu/halama Lecture 3 The Physical Environment Part 1 1 Lectures 3 & 4 1. Biogeochemical Cycling 2. Solar Radiation 3. The Atmosphere 4. The Global Ocean 5. Weather and Climate
THE SOLAR WIND & SOLAR VARIABILITY
 The Sun-Earth System: CONTENTS AN OVERVIEW The Stars Around Us 1 Our Dependence on the Sun 3 The Sun s Inconstancy 3 Intruders from Afar 5 What Gets By 5 Voyages of Discovery in an Age of Exploration 6
Ice Age Canada. Understanding our climate future. By Rolf A. F. Witzsche 2013 Published by Cygni Communications Ltd. Canada
 Ice Age Canada Understanding our climate future By Rolf A. F. Witzsche 2013 Published by Cygni Communications Ltd. Canada In love with our humanity The incredible intelligence that we have as human beings
STCE Newsletter. 18 Jan Jan 2016
 Published by the STCE - this issue : 29 Jan 2016. Available online at http://www.stce.be/newsletter/. The Solar-Terrestrial Centre of Excellence (STCE) is a collaborative network of the Belgian Institute
Here s what a weak El Nino usually brings to the nation with temperatures:
 Time again for my annual Winter Weather Outlook. Here's just a small part of the items I considered this year and how I think they will play out with our winter of 2018-2019. El Nino / La Nina: When looking
Pacific Decadal Oscillation ( PDO ):
:") Time again for my annual Winter Weather Outlook. Here's just a small part of the items I considered this year and how I think they will play out with our winter of 2015-2016. El Nino / La Nina: When looking
Time again for my annual Winter Weather Outlook. Here's just a small part of the items I considered this year and how I think they will play out with our winter of 2015-2016. El Nino / La Nina: When looking
Physical Model of Solar Activity Influence on Climate Characteristics of Troposphere
 Sun and Geosphere, 2009; 4(1): 25-30 ISSN 1819-0839 Physical Model of Solar Activity Influence on Climate Characteristics of Troposphere S.I. Molodykh, G.A. Zherebtsov, V.A. Kovalenko Institute of Solar-Terrestrial
Two types of geomagnetic storms and relationship between Dst and AE indexes
 Two types of geomagnetic storms and relationship between Dst and AE indexes Lyudmila P. Shadrina 1, * 1 Academy of sciences of Sakha (Yakutia) Republic, Yakutsk, Russia Abstract. The study of the relationship
Lecture 28: Observed Climate Variability and Change
 Lecture 28: Observed Climate Variability and Change 1. Introduction This chapter focuses on 6 questions - Has the climate warmed? Has the climate become wetter? Are the atmosphere/ocean circulations changing?
Solar Activity and Climate Change Hazards. Department of Astronomy & Space and Meteorology, Faculty of Sciences, Cairo University, Giza 12613, Egypt
 Journal of Geological Resource and Engineering 3 (2014) 151-157 doi: 10.17265/2328-2193/2014.03.002 D DAVID PUBLISHING Ahmed A. Hady Department of Astronomy & Space and Meteorology, Faculty of Sciences,
Appearance of solar activity signals in Indian Ocean Dipole (IOD) phenomena and monsoon climate pattern over Indonesia
 phenomena and monsoon climate pattern over Indonesia") Bull. Astr. Soc. India (2007) 35, 575 579 Appearance of solar activity signals in Indian Ocean Dipole (IOD) phenomena and monsoon climate pattern over Indonesia Jalu Tejo Nugroho National Institute of
Bull. Astr. Soc. India (2007) 35, 575 579 Appearance of solar activity signals in Indian Ocean Dipole (IOD) phenomena and monsoon climate pattern over Indonesia Jalu Tejo Nugroho National Institute of
Solar Activity and Global Warming Revisited
 12 Solar Activity and Global Warming Revisited K. Georgieva, B. Kirov Solar-Terrestrial Influences Laboratory, Bulgarian Academy of Sciences, Sofia, Bulgaria kgeorg@bas.bg, bkirov@space.bas.bg While in
Interplanetary Field During the Current Solar Minimum
 Interplanetary Field During the Current Solar Minimum C.T. Russell 1, L.K. Jian 1, J. G. Luhmann 2, T.L. Zhang 3 1 UCLA, 2 UCB, 3 SRI, OEAW SOHO 23 Understanding a Peculiar Solar Minimum Asticou Inn, Northeast
8. Climate changes Short-term regional variations
 8. Climate changes 8.1. Short-term regional variations By short-term climate changes, we refer here to changes occurring over years to decades. Over this timescale, climate is influenced by interactions
Name: Climate Date: EI Niño Conditions
 Name: Date: Base your answers to questions 1 and 2 on the maps and the passage below. The maps show differences in trade wind strength, ocean current direction, and water temperature associated with air-pressure
Major climate change triggers
 Major climate change triggers Variations in solar output Milankovitch cycles Elevation & distribution of continents Ocean interactions Atmospheric composition change (CO 2 and other volcanic gasses) Biological
CESAR BOOKLET General Understanding of the Sun: Magnetic field, Structure and Sunspot cycle
 CESAR BOOKLET General Understanding of the Sun: Magnetic field, Structure and Sunspot cycle 1 Table of contents Introduction to planetary magnetospheres and the interplanetary medium... 3 A short introduction
Warming after a cold winter will disappear quickly as it did in 2007 By Joseph D Aleo
 Warming after a cold winter will disappear quickly as it did in 2007 By Joseph D Aleo The pop in global temperatures, even the satellite, the last few months seems surprising to some in the Northern Hemisphere
K32: The Structure of the Earth s Atmosphere
 K32: The Structure of the Earth s Atmosphere Chemical composition Vertical Layers Temperature structure Coriolis Force and horizontal structure Hadley Cells and Heat sources Current Molecular Composition
Volcanoes drive climate variability by
 Volcanoes drive climate variability by 1. emitting ozone weeks before eruptions, 2. forming lower stratospheric aerosols that cool Earth, 3. causing sustained ozone depletion, surface warming, and lower
This project has received funding from the European Union s Horizon 2020 research and innovation programme under the Marie-Sklodowska-Curie grant
 This project has received funding from the European Union s Horizon 2020 research and innovation programme under the Marie-Sklodowska-Curie grant agreement number 721624. Space weather and the variable
2015: A YEAR IN REVIEW F.S. ANSLOW
 2015: A YEAR IN REVIEW F.S. ANSLOW 1 INTRODUCTION Recently, three of the major centres for global climate monitoring determined with high confidence that 2015 was the warmest year on record, globally.
THE SUN AND THE SOLAR SYSTEM
 Chapter 26 THE SUN AND THE SOLAR SYSTEM CHAPTER 26 SECTION 26.1: THE SUN S SIZE, HEAT, AND STRUCTURE Objectives: What is the Sun s structure and source of energy? Key Vocabulary: Fusion Photosphere Corona
STCE Newsletter. 7 May May 2018
 Published by the STCE - this issue : 18 May 2018. Available online at http://www.stce.be/newsletter/. The Solar-Terrestrial Centre of Excellence (STCE) is a collaborative network of the Belgian Institute
Climate 1: The Climate System
 Climate 1: The Climate System Prof. Franco Prodi Institute of Atmospheric Sciences and Climate National Research Council Via P. Gobetti, 101 40129 BOLOGNA SIF, School of Energy, Varenna, July 2014 CLIMATE
The Planetary Circulation System
 12 The Planetary Circulation System Learning Goals After studying this chapter, students should be able to: 1. describe and account for the global patterns of pressure, wind patterns and ocean currents
Global Weather Trade Winds etc.notebook February 17, 2017
 Global Weather 1 north pole northern hemisphere equator southern hemisphere south pole 2 We have seasons because of the Earth's tilt The seasons are opposite in the northern and southern hemispheres winter
Wind: Global Systems Chapter 10
 Wind: Global Systems Chapter 10 General Circulation of the Atmosphere General circulation of the atmosphere describes average wind patterns and is useful for understanding climate Over the earth, incoming
The North Atlantic Oscillation: Climatic Significance and Environmental Impact
 1 The North Atlantic Oscillation: Climatic Significance and Environmental Impact James W. Hurrell National Center for Atmospheric Research Climate and Global Dynamics Division, Climate Analysis Section
! The Sun as a star! Structure of the Sun! The Solar Cycle! Solar Activity! Solar Wind! Observing the Sun. The Sun & Solar Activity
 ! The Sun as a star! Structure of the Sun! The Solar Cycle! Solar Activity! Solar Wind! Observing the Sun The Sun & Solar Activity The Sun in Perspective Planck s Law for Black Body Radiation ν = c / λ
Physical Science Context Lecture 2 The Earth and Sun's Magnetic Fields
 Physical Science Context Lecture 2 The Earth and Sun's Magnetic Fields The earth is a huge magnetic and close to its surface it can be approximated as a bar magnet (a magnetic dipole) that is positioned
Solar Energetic Particles measured by AMS-02
 Solar Energetic Particles measured by AMS-02 Physics and Astronomy Department, University of Hawaii at Manoa, 96822, HI, US E-mail: bindi@hawaii.edu AMS-02 collaboration The Alpha Magnetic Spectrometer
Global Wind Patterns
 Name: Earth Science: Date: Period: Global Wind Patterns 1. Which factor causes global wind patterns? a. changes in the distance between Earth and the Moon b. unequal heating of Earth s surface by the Sun
Weather Outlook 2016: Cycles and Patterns Influencing Our Growing Season
 Weather Outlook 2016: Cycles and Patterns Influencing Our Growing Season Leon F. Osborne Chester Fritz Distinguished Professor of Atmospheric Sciences University of North Dakota Cycle of El Niño Events
The Current Solar Minimum and Its Consequences for Climate
 Chapter 11 The Current Solar and Its Consequences for Climate David Archibald Summa Development Limited Chapter Outline 1. Introduction 277 2. The Current 278 3. Summary 287 1. INTRODUCTION A number of
Directed Reading. Section: Solar Activity SUNSPOTS. Skills Worksheet. 1. How do the gases that make up the sun s interior and atmosphere behave?
 Skills Worksheet Directed Reading Section: Solar Activity 1. How do the gases that make up the sun s interior and atmosphere behave? 2. What causes the continuous rising and sinking of the sun s gases?
Global Climate Patterns and Their Impacts on North American Weather
 Global Climate Patterns and Their Impacts on North American Weather By Julie Malmberg and Jessica Lowrey, Western Water Assessment Introduction This article provides a broad overview of various climate
The Solar Cycle or El Niño Southern Oscillation (ENSO) as a Criterion for the Definition of Public Policies
 as a Criterion for the Definition of Public Policies") The Solar Cycle or El Niño Southern Oscillation (ENSO) as a Criterion for the Definition of Public Policies Juan Manuel Rodríguez Torres* Gerardo Zavala Guzmán** * e-mail: rodrito@ugto.mx; Departamento
The Solar Cycle or El Niño Southern Oscillation (ENSO) as a Criterion for the Definition of Public Policies Juan Manuel Rodríguez Torres* Gerardo Zavala Guzmán** * e-mail: rodrito@ugto.mx; Departamento
Introduction of products for Climate System Monitoring
 Introduction of products for Climate System Monitoring 1 Typical flow of making one month forecast Textbook P.66 Observed data Atmospheric and Oceanic conditions Analysis Numerical model Ensemble forecast
Extra-terrestrial Influences on Nature s Risks
 Extra-terrestrial Influences on Nature s Risks Brent Walker Session Number: WBR9 Gravitational Influences Phase Locks & Harmonic Resonances After billions of years of evolution the solar system is still
Figure 1. Carbon dioxide time series in the North Pacific Ocean (
 Evidence #1: Since 1950, Earth s atmosphere and oceans have changed. The amount of carbon released to the atmosphere has risen. Dissolved carbon in the ocean has also risen. More carbon has increased ocean
Current and future climate of the Cook Islands. Pacific-Australia Climate Change Science and Adaptation Planning Program
 Pacific-Australia Climate Change Science and Adaptation Planning Program Penrhyn Pukapuka Nassau Suwarrow Rakahanga Manihiki N o r t h e r n C o o k I s l a nds S o u t h e Palmerston r n C o o k I s l
Impacts of Climate on the Corn Belt
 Impacts of Climate on the Corn Belt Great Lakes Crop Summit 2015 2015 Evelyn Browning Garriss Conclusions Climate change is not linear. It ebbs and flows. Recent polar volcano eruptions created a cool
Comparative study of solar and geomagnetic indices for the solar cycle 22 and 23 C. M Tiwari Dept. of Physics, APS University, Rewa (M. P.
 International Association of Scientific Innovation and Research (IASIR) (An Association Unifying the Sciences, Engineering, and Applied Research) International Journal of Emerging Technologies in Computational
Astronomy Chapter 12 Review
 Astronomy Chapter 12 Review Approximately how massive is the Sun as compared to the Earth? A. 100 times B. 300 times C. 3000 times D. 300,000 times E. One million times Approximately how massive is the
STCE Newsletter. 7 Dec Dec 2015
 Published by the STCE - this issue : 18 Dec 2015. Available online at http://www.stce.be/newsletter/. The Solar-Terrestrial Centre of Excellence (STCE) is a collaborative network of the Belgian Institute
The Structure of the Magnetosphere
 The Structure of the Magnetosphere The earth s magnetic field would resemble a simple magnetic dipole, much like a big bar magnet, except that the solar wind distorts its shape. As illustrated below, the
Please be ready for today by:
 Please be ready for today by: 1. HW out for a stamp 2. Paper and pencil/pen for notes 3. Be ready to discuss what you know about El Nino after you view the video clip What is El Nino? El Nino Basics El
Climate and Environment
 Climate and Environment Oxygen Isotope Fractionation and Measuring Ancient Temperatures Oxygen Isotope Ratio Cycles Oxygen isotope ratio cycles are cyclical variations in the ratio of the mass of oxygen
Energetic Particle Influences on the Ozonosphere mediated by the Geomagnetic Field
 Energetic Particle Influences on the Ozonosphere mediated by the Geomagnetic Field M.-B. Kallenrode University of Osnabrück, Germany Joachim Vogt, Bertalan Zieger, Int. University Bremen Anja Stadelmann,
6. What has been the most effective erosive agent in the climate system? a. Water b. Ice c. Wind
 Multiple Choice. 1. Heinrich Events a. Show increased abundance of warm-water species of planktic foraminifera b. Show greater intensity since the last deglaciation c. Show increased accumulation of ice-rafted
Solar-terrestrial relation and space weather. Mateja Dumbović Hvar Observatory, University of Zagreb Croatia
 Solar-terrestrial relation and space weather Mateja Dumbović Hvar Observatory, University of Zagreb Croatia Planets Comets Solar wind Interplanetary magnetic field Cosmic rays Satellites Astronauts HELIOSPHERE