Multispacecraft observation of magnetic cloud erosion by magnetic reconnection during propagation
|
|
|
- Dale Simmons
- 6 years ago
- Views:
Transcription
1 JOURNAL OF GEOPHYSICAL RESEARCH, VOL. 117,, doi: /2012ja017624, 2012 Multispacecraft observation of magnetic cloud erosion by magnetic reconnection during propagation A. Ruffenach, 1,2 B. Lavraud, 1,2 M. J. Owens, 3 J.-A. Sauvaud, 1,2 N. P. Savani, 4,5 A. P. Rouillard, 1,2 P. Démoulin, 6 C. Foullon, 7 A. Opitz, 1,2 A. Fedorov, 1,2 C. J. Jacquey, 1,2 V. Génot, 1,2 P. Louarn, 1,2 J. G. Luhmann, 8 C. T. Russell, 9 C. J. Farrugia, 10 and A. B. Galvin 10 Received 15 February 2012; revised 3 July 2012; accepted 22 July 2012; published 7 September [1] During propagation, Magnetic Clouds (MC) interact with their environment and, in particular, may reconnect with the solar wind around it, eroding away part of its initial magnetic flux. Here we quantitatively analyze such an interaction using combined, multipoint observations of the same MC flux rope by STEREO A, B, ACE, WIND and THEMIS on November 19 20, Observation of azimuthal magnetic flux imbalance inside a MC flux rope has been argued to stem from erosion due to magnetic reconnection at its front boundary. The present study adds to such analysis a large set of signatures expected from this erosion process. (1) Comparison of azimuthal flux imbalance for the same MC at widely separated points precludes the crossing of the MC leg as a source of bias in flux imbalance estimates. (2) The use of different methods, associated errors and parametric analyses show that only an unexpectedly large error in MC axis orientation could explain the azimuthal flux imbalance. (3) Reconnection signatures are observed at the MC front at all spacecraft, consistent with an ongoing erosion process. (4) Signatures in suprathermal electrons suggest that the trailing part of the MC has a different large-scale magnetic topology, as expected. The azimuthal magnetic flux erosion estimated at ACE and STEREO A corresponds respectively to 44% and 49% of the inferred initial azimuthal magnetic flux before MC erosion upon propagation. The corresponding average reconnection rate during transit is estimated to be in the range mv/m, suggesting most of the erosion occurs in the inner parts of the heliosphere. Future studies ought to quantify the influence of such an erosion process on geo-effectiveness. Citation: Ruffenach, A., et al. (2012), Multispacecraft observation of magnetic cloud erosion by magnetic reconnection during propagation, J. Geophys. Res., 117,, doi: /2012ja Institut de Recherche en Astrophysique et Planétologie, Université de Toulouse, Toulouse, France. 2 UMR 5277, Centre National de la Recherche Scientifique, Toulouse, France. 3 Space Environment Physics Group, University of Reading, Reading, UK. 4 University Corporation for Atmospheric Research, Boulder, Colorado, USA. 5 NASA Goddard Space Flight Center, Greenbelt, Maryland, USA. 6 Observatoire de Paris, LESIA, UMR 8109, CNRS, Meudon, France. 7 Centre for Fusion Space and Astrophysics, University of Warwick, Warwick, UK. 8 Space Sciences Laboratory, University of California, Berkeley, California, USA. 9 IGPP, UCLA, Los Angeles, California, USA. 10 Space Science Center, University of New Hampshire, Durham, New Hampshire, USA. Corresponding author: A. Ruffenach, Institut de Recherche en Astrophysique et Planétologie, Université de Toulouse, 9 Avenue du Colonel Roche, BP 44346, FR Toulouse CEDEX 4, France. (alexis.ruffenach@irap.omp.eu) American Geophysical Union. All Rights Reserved /12/2012JA Introduction [2] The interplanetary manifestations of solar coronal mass ejections, called interplanetary coronal mass ejections (ICMEs), are magnetized plasma structures that play a pivotal role in solar-terrestrial interaction [Gosling, 1993; Wimmer-Schweingruber et al., 2006; Borovsky and Denton, 2006; Foullon et al., 2007; Gopalswamy et al., 2007; Lavraud and Borovsky, 2008; Möstl et al., 2010; Richardson and Cane, 2010]. These structures may interact in various ways with the ambient solar wind during their propagation in the interplanetary medium [Burlaga et al., 1987; Farrugia et al., 1997]. Magnetic clouds, a subset of ICMEs, are primarily characterized by a large smooth rotation of enhanced magnetic field, low temperature and low plasma beta [Burlaga et al., 1981; Klein and Burlaga, 1982]. The largescale structure of a MC consists of a twisted magnetic flux rope [Goldstein, 1983; Marubashi, 1986; Burlaga, 1988; Lepping et al., 1990]. Another signature commonly associated with ICMEs is the presence of counterstreaming suprathermal electrons [Gosling et al., 1987; Gosling, 1990; Farrugia et al., 1993] which indicates a large-scale 1of16
2 Figure 1. Schematic representing the magnetic structure of (a) non-eroded and (c) eroded MCs together with (b and d) the expected variations in the magnetic field components and accumulated azimuthal flux. The analysis needs to be made in the proper MC coordinate system as is implicit here. closed magnetic topology, with magnetic field lines rooted on the Sun at both ends. [3] Magnetic reconnection converts magnetic energy into thermal and kinetic energy. Although this process has been mainly studied in situ in Earth s magnetosphere, signatures of magnetic reconnection have previously been associated with magnetic clouds [Farrugia et al., 2001] and confirmed recently as ubiquitous in the solar wind [Gosling et al., 2005a, 2006a; Davis et al., 2006; Phan et al., 2006; Huttunen et al., 2008; Lavraud et al., 2009; Eriksson et al., 2009]. Gosling et al. [2005a, 2006a] identified Petschek-like reconnection exhausts characterized by bifurcated current sheets. These current sheets form a pair of rotational discontinuities with correlated changes in the components of the magnetic field and flow velocity on one side and anticorrelated changes on the other. Magnetic reconnection implies a change in magnetic field topology. This can be diagnosed using suprathermal electron characteristics since they travel extremely fast along the magnetic field. Unidirectional electron beams of a few hundred ev (called the strahl ) are associated with regular solar wind, i.e., open field lines connected to the hot coronal source at one end. Counterstreaming suprathermal electrons, in addition to being observed inside ICMEs [e.g., Shodhan et al., 2000], have been measured in narrow reconnection exhaust at the Heliospheric Current Sheet (HCS). This is also a result of the newly closed nature of the magnetic field lines in the specific configuration of the HCS [Gosling et al., 2006b; Lavraud et al., 2009] if the spacecraft is crossing the exhaust Sunward of the reconnection line along the magnetic field. By contrast, a spacecraft crossing the exhaust anti-sunward of the reconnection line observes a lack of strahl electrons in both the parallel and anti-parallel directions [Gosling et al., 2005b]. Note that other suprathermal electron signatures have been reported [e.g., Gosling et al., 2002; Steinberg et al., 2005; Wimmer-Schweingruber et al., 2006; Skoug et al., 2006; Foullon et al., 2009; Lavraud et al., 2010]. [4] During its propagation in the interplanetary medium, a MC may interact with the solar wind around it. Magnetic reconnection may in particular occur at the front of the MC, thereby leading to a global topological change as depicted in Figure 1. Figure 1 presents the expected magnetic structure as an observing spacecraft would cut through either a noneroded (Figure 1a) or eroded MC (Figure 1c). Dasso et al. [2006] presented a new method to analyze the structure of a MC that consists in calculating the azimuthal magnetic flux accumulated along the spacecraft trajectory. An imbalance in accumulated azimuthal flux, with an excess flux at the back of the MC, is believed to be the signature of magnetic erosion at its front (cf. section 4 for further explanations). This possibility has further been studied using both observations [Dasso et al., 2007; Möstl et al., 2008] and global MHD simulations [Schmidt and Cargill, 2003; Taubenschuss et al., 2010]. The simulation works showed in particular that the efficiency of the reconnection process increases with the relative velocity of the MC with respect to the ambient solar wind. [5] ICMEs are major sources of strong southward interplanetary magnetic field and often increased solar wind flow speed impinging on the Earth s magnetosphere. The subsequent coupling and geomagnetic storms, mediated in its 2of16
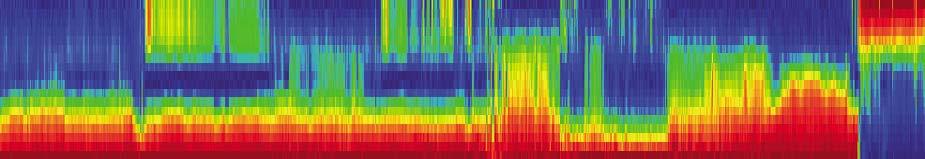
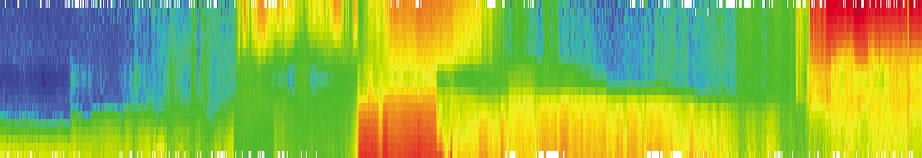
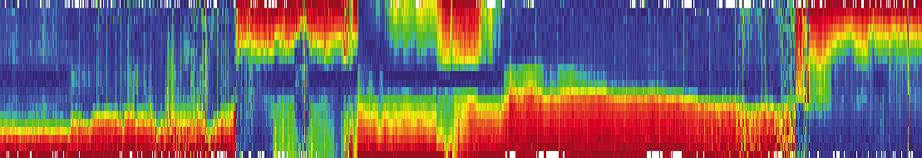
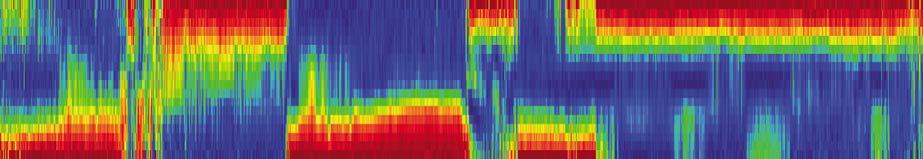
3 THEMIS. In section 4 we present the different methods used and associated results. We discuss these results in section 5. Figure 2. ACE, ST-A, ST-B, and Earth locations on November 19 20, 2007 in the ecliptic plane with the respective projection of MC axis orientations inferred from MVA analysis. most part through magnetic reconnection at the dayside magnetopause [Dungey, 1961; Akasofu, 1981], are directly related to the intensity of the magnetic field in MCs and their sheath regions. Because the proposed erosion directly alters the amount and duration of the typically large magnetic flux contained within MCs impinging on Earth, this process may significantly impact the geo-effectiveness of MCs over the solar cycle. Evaluation of MC magnetic flux budget is also very relevant to the study of coronal processes during eruption [Qiu et al., 2007]. For instance, MC flux estimations are important for comparison with the magnetic flux observed in the suspected solar source region, and which may be used to link MCs to their solar origin [e.g., Mandrini et al., 2005; Nakwacki et al., 2011]. It is thus important to take into account the presumed eroded flux when comparing in situ and solar observations of MCs. [6] Finally, it should be noted that we use a twisted flux rope hypothesis for our MC in the present study [e.g., Burlaga et al., 1981]. Although this hypothesis appears justified from the results of our multispacecraft analysis, MCs have also been described using writhed and sheared threedimensional magnetic field or spheromak-shaped structures [e.g., Al-Haddad et al., 2011; Vandas et al., 1993]. [7] Here we study an event that occurred on November 19 21, The MC was observed by STEREO A (ST-A), STEREO B (ST-B), ACE, WIND and THEMIS in particular. Several authors have studied this event in other contexts [Gosling and Szabo, 2008; Farrugia et al., 2011; Kilpua et al., 2011; Howard and Tappin, 2009], as will be discussed in section 5. The purpose of the present study is to demonstrate the occurrence of magnetic flux erosion by magnetic reconnection at the front of this MC, owing to its interaction with the slow solar wind ahead of it, using a combination of different methods and signatures together with detailed error assessments. In section 3, we describe data observed by ST-A, ST-B, ACE, WIND and 2. Instrumentation [8] The solar terrestrial relations observatory (STEREO) [Kaiser et al., 2008] consists of two spacecraft that slowly drift ahead (referred to ST-A) and behind (referred to ST-B) the Earth on similar orbits around the Sun. The mission was designed to study the solar activity stereoscopically and the structure of the solar wind. We use data from the two Solar Wind Electron Analysers (SWEA) [Sauvaud et al., 2008] and magnetometers (MAG) [Acuña et al., 2008] from the In situ Measurement of Particles and CME Transient (IMPACT) instrument suite [Luhmann et al., 2008]. Proton data from the PLASTIC instrument [Galvin et al., 2008] are also utilized. These instruments are identical onboard each of the two STEREO spacecraft. The time resolutions are 3 s and 1 min for magnetic field and velocity, respectively. [9] In addition, we make use of measurements from the Advanced Composition Explorer (ACE) spacecraft [Stone et al., 1998], in particular data from the Solar Wind Electron, Proton, Alpha Monitor investigation (SWEPAM) [McComas et al., 1998] and magnetic field (MAG, 3-s resolution) [Smith et al., 1998]. Due to the low time resolution of ACE velocity moments (1-min resolution), we also use THEMIS-B magnetic field and plasma data (3-s resolution for both data sets) from the fluxgate magnetometers (FGM) [Auster et al., 2008] and the electrostatic analyzers (ESA) [McFadden et al., 2008]. [10] We work mainly in the RTN coordinate system. This system is centered on the spacecraft, R is the sun-to-spacecraft unit vector, T is perpendicular to it and points in the direction of planetary/spacecraft orbital motion, N completes the right-handed triad. In Figure 10, we use the Heliocentric Earth Ecliptic (HEE) coordinate system where X is the Sun- Earth line direction, Z is directed toward the North Pole relative to the ecliptic plane and Y closes a right-handed system. Electron pitch angle distributions (PADs) at 250 ev are used for ST-A and ST-B. ACE electron PADs are from the 272 ev channel. 3. Overview of the Event [11] The MC under study was observed at 4 main locations: ST-A, ST-B, ACE (L1), and THEMIS (near-earth environment) (Figure 2). At this time, ST-A and ST-B were separated by 40 (respectively 20 west and east from Earth). [12] Figure 3 shows data from ST-B, ACE, and ST-A. The panels are the same for each spacecraft. Figure 3a shows the traditional suprathermal electron PAD spectrograms, while Figure 3b shows the same data but normalized (between 0 and 1) for each sample in time. This allows a better visualization of PAD characteristics when the dynamic range of fluxes is large. The following panels show ion and magnetic field data in the same format for each spacecraft. The magnetic cloud at ST-B is more complex, we thus first describe below the data from ACE and ST-A. 3of16


4 Figure 3 4 of 16
5 [13] The magnetic cloud front and back boundaries at ACE are defined at 22:22 UT (Nov. 19) and 11:42 UT (Nov. 20). The magnetic field is high and shows a clear smooth rotation over a large angle inside the MC (Figure 3j). Based on magnetic field data alone, Gosling and Szabo [2008] marked the start of the MC at 23:32 UT (Nov. 19) at WIND (corresponding to 23:13 UT at ACE). Based on the magnetic field, plasma and electron PAD data, however, we believe the MC front is observed earlier, at 22:22 UT at ACE (cf. section 4.1.4). Both fronts are marked in Figure 3. Note, however, that this choice does not affect the results regarding azimuthal flux imbalance as discussed in the following sections (the amount of azimuthal flux between these two fronts is small compared to the flux rope magnetic flux, about 5%). [14] Figure 3h shows the proton temperature and density for ACE. From 22:22 UT (19 Nov.) to 11:42 UT (20 Nov.), the proton temperature is lower than in the ambient solar wind, again as expected for a MC. The velocity (Figure 3i) is relativity constant, 460 km/s, until 11:42 UT (20 Nov.), only about 70 km/s faster than the solar wind ahead of it. The solar wind velocity enhances significantly after the MC, highlighting the presence of a high speed stream just adjacent and following the MC. [15] At ACE, before 21:21 UT on 19 November the electron PAD shows a 180 strahl (toward sector) (Figures 3f and 3g). Just after this time, the PAD becomes field-aligned (0 ), indicative of the crossing of the HCS. Counterstreaming electrons appear at 22:22 UT on 19 November implying closed magnetic field lines at the beginning of the MC. From 4:05 UT to 11:42 UT on 20 November, the spectrogram shows unidirectional PADs again; this interval includes essentially the entire second-half (trailing) of the MC. [16] The duration of the MC at ST-A is longer than at ACE. The MC is characterized by enhanced magnetic field and a clear large-scale rotation of that field between 22:00 UT (19 Nov.) to 3:20 UT (21 Nov.) (Figure 3o). ST-A observes bidirectional suprathermal electrons from 22:00 UT (19 Nov.) to 12:00 UT (20 Nov.) (Figures 3k and 3l). Unidirectional electrons are yet observed in the trailing part from 12:00 UT (20 Nov.) to the end of the MC at 3:20 UT (21 Nov.). Unlike at ACE, no HCS crossing is observed before the MC. The MC appears to have replaced the HCS at ST-A. [17] At ST-B, the time period 22:47 UT (19 Nov.) - 7:00 UT (20 Nov.) shows a somewhat lower proton temperature with an enhanced and rotating magnetic field consistent with signatures of MCs (Figure 3c), apart from a relatively extended and complex region in its middle around 3:00 UT (20 Nov.). Suprathermal electron PADs are mostly unidirectional and in the same direction as at ACE and ST-A (Figures 3a and 3b), consistent with ST-B sampling the same MC. Based on various in situ properties, the event at ST-B has been identified as the same event as observed at ACE and ST-A [Farrugia et al., 2011; Kilpua et al., 2011]. 4. Method and Erosion Signatures [18] To determine whether magnetic erosion occurs through magnetic reconnection at the front of the MC, we here explore several methods and signatures Magnetic Flux Imbalance Estimation The Direct Method of Dasso et al. [2006] [19] We first employ the direct method developed by Dasso et al. [2006]. This method consists in calculating and analyzing the accumulated azimuthal magnetic flux along the spacecraft trajectory in the MC frame. The accumulative flux per unit length is defined as F yx ðþ =L in Z tx ðþ ¼ tin B y;cloud ðt ÞV x;cloud ðt Þdt Here t in is the time of the MC front boundary. B y and V x are the respective components of the magnetic field and velocity from the observed time series in the MC frame. We use the frame as defined in Dasso et al. [2006]. In the RTN coordinate system, the latitude angle q ([ 90,90 ]) is defined between the ecliptic plane and the cloud axis (called z cloud ). The longitude angle 8 ([ 180, 180 ]) is defined as the angle between the projection of the axis in the ecliptic plane and the Sun-spacecraft direction. The direction d is defined by the rectilinear trajectory of the spacecraft ( x rtn ), y cloud is in the direction z cloud d and x cloud completes the righthanded orthonormal base (x cloud, y cloud, z cloud ). This frame is depicted in Figure 1. [20] Figure 1 shows an idealized schematic of the expected magnetic configuration for both non-eroded (Figure 1a) and eroded (Figure 1c) MCs, together with the associated variation in each magnetic field component (Figures 1b and 1d). For non-eroded MCs (Figure 1a), the magnetic field azimuthal component By (blue curve) is symmetric about the MC center. Starting the integration of the By component at the leading MC boundary, the accumulated azimuthal magnetic flux (red curve) goes back to a null value exactly at the MC trailing boundary. If the MC is eroded (Figure 1c) the expected topological changes alter the variation of the azimuthal By component. The accumulated azimuthal magnetic flux is then unbalanced: it goes back to a null value before the end of the MC, revealing what Dasso et al. [2006] called a back region. The back region thus corresponds to an excess of azimuthal ð1þ Figure 3. Plasma and magnetic field data from ST-B, ACE, and ST-A during the period November The various MC boundaries used are marked with red dashed lines (see text for details). (a, f, k) The suprathermal electron pitch angle distributions, (b, g, l) the normalized (between 0 and 1 for each time sample) pitch angle distributions, (c, h, m) the proton temperature (red line) and proton density (black line), (d, i, n) the proton speed, and (e, j, o) the magnetic field components in RTN coordinates. Region (1) corresponds to the open MC region interpreted as resulting from interchange reconnection at the Sun. Region (2) is deemed to be the back region resulting from erosion. It also shows unidirectional electrons but with markedly different strahl properties (cf. Figure 9). Forward shocks (FS) are shown with a dashed line at ACE and ST-B. 5of16
6 Table 1. Summary of the Results Obtained for the Azimuthal Flux Balance-Related Analyses at Each Spacecraft ACE ST-A ST-B MVA and cloud-fitting time interval 23:13 (19 Nov.)- 11:42 (20 Nov.) 22:00 (19 Nov.)-3:20 (21 Nov.) 22:52 (19 Nov.)-7:00 (20 Nov.) Azimuthal flux integration start time 22:22 (19 Nov.) 22:00 (19 Nov.) 22:47 (19 Nov.) MC axis orientation from the mean of all q = 3 1 q =31 7 q = 39 4 MVA results (with standard deviations) 8 = = =96 8 MC axis orientation from FRF q = 5 q =17 q = 50 8 =99 8 =97 8 =92 MC axis orientation: mean of results q = 4 q =24 q = 45 from MVA and FRF methods 8 = =91 8 =94 Start of back region inferred from electron PAD 9:53 (20 Nov.) 23:40 (20 Nov.) Time of flux balance (mean of results from 9:26 13 min (20 Nov.) 22:59 1:48 (20 Nov.) 7:58 1:23 (20 Nov.) MVA and FRF methods) Intermediate/minimum eigenvalue ratio (mean from all MVA analyses) Impact parameter from FRF (positive means spacecraft crosses north of MC center axis) Alpha parameter from FRF magnetic flux whose counterpart at the front of the MC has been eroded through magnetic reconnection Determination of the MC Orientation Using Minimum Variance Analysis [21] Knowledge of the cloud axis orientation is the prime quantity needed to apply this method. To that end, we use two different methods: minimum variance analysis (MVA) [Sonnerup and Cahill, 1967] and force-free MC fitting [Lepping et al., 1990]. With MVA, the cloud axis is determined by the intermediate eigenvector [Bothmer and Schwenn, 1998]. We apply MVA to normalized magnetic field vector time series in order to avoid the influence of fluctuations in magnetic field magnitude [Gulisano et al., 2007]. [22] In order to assess potential errors on MC axis orientations from MVA, we apply a bootstrap method [Kawano and Higuchi, 1995] with 1000 random resamplings of the magnetic field data acquired inside the MC. This resampling is used to quantify the impact of the intrinsic variability of the data set on the results. We then repeat this for 7 different nested time intervals within the MC separated by 10 min: we begin each of the 7 time intervals 10 min after the previous and end it 10 min before. This enables us to estimate how errors related to the definition of the MC boundaries may affect the resulting axis orientation. Since such sub-intervals containing a properly defined MC should lead to the same axis determination through MVA, this approach allows us to assess errors from possible sub-structures in the MC (for example, compressions at the edges). Note that for the analysis at ACE, although we consider the leading boundary at 22:22 UT on 19 November for the accumulated azimuthal flux balance estimates, we only apply MVA after 23:13 UT owing to unusual fluctuations of the magnetic field during the interval 22:22 23:13 UT Determination of the MC Orientation Using Force-Free MC Fitting [23] The second method to determine the MC axis orientation and other parameters is a flux rope fitting (FRF) based on a force-free model with least squares minimization. The force-free model satisfies the equation r B = ab [Goldstein, 1983; Marubashi, 1986], with a = constant [Burlaga, 1988; Lepping et al., 1990]. Lundquist [1950] gave the solution for a cylindrical geometry in an axially symmetric configuration: ðradialþb r ¼ 0 ðazimuthalþb 8 ¼ B 0 J 1 ðarþ ðaxialþb z ¼ B 0 J 0 ðarþ Here J n is the Bessel function of the first kind of order n, B 0 is the strength of the magnetic field at the MC axis and r is the radial distance from the axis. The constant a determines the magnetic field twist of the flux tube. To apply this method, we estimate initial guesses of the following parameters in the MC frame determined by MVA: the helicity (right or left handed), the MC axis orientation (the latitude angle q and longitude angle 8), and the impact parameter p (distance between the center of the flux tube and the spacecraft trajectory through the MC, which is approximated for initial guess as B x / B (where B x is computed in the MC frame previously obtained from MVA [Démoulin and Dasso, 2009]). Then, we apply a least square fitting method and a first series of iteration to determine the angle q and 8. When these are determined, we perform another series of iteration to determine the impact parameter p and a. [24] It is worth mentioning that the MC is compressed at its rear edge by a high-speed solar wind. This restrains its expansion, as shown by a rather constant speed throughout the MC at all spacecraft. Hence we do not take the MC expansion into account for both MC fitting and analysis of magnetic flux imbalance (cf. next section). Nakwacki et al. [2008] have shown, anyway, that radial expansion does not strongly affect such calculation Results on Magnetic Flux Imbalance [25] Table 1 summarizes the results obtained from the above analyses. The accumulative azimuthal magnetic flux per unit length F y /L, which starts at the front MC boundary, is shown in Figure 4 for ST-B, ACE, and ST-A. The solid colored curves show the results obtained for each of the 7 nested time intervals to which MVA is applied (from the full interval, in purple, to the smallest interval in red), and the 1000 curves observed for each color correspond to the results from the bootstrap resamplings. These curves thus highlight the errors, or variability, of the azimuthal flux ð2þ 6of16
7 Figure 4. B ycloud component and accumulated azimuthal magnetic flux per unit length for (a) ST-B, (b) ACE, and (c) ST-A. The colored curves show the results using orientations deduced from MVA with bootstrap method applied to different intervals (cf. section 4.1.2). The dash-dotted curves show the results using the orientation deduced from forcefree MC fitting. Vertical lines indicate the boundaries of the MC and the time at which the azimuthal flux is balanced (cuts zero) for both the (mean of) MVA and FRF methods. Cf. also Table 1 for details. accumulation results. The dashed lines show the result using the axis orientation given by the FRF method at each spacecraft. In Table 1, the time of flux balance is given for each spacecraft and for both methods used: FRF and MVA (for MVA analysis the time corresponds to the mean of the 7000 colored curves). [26] Despite a large set of trials in error assessment and the use of different methods, there is a clear imbalance in flux in every case for both ST-A and ACE. The more complex case of ST-B does not show a clear signature of potential magnetic erosion (Figure 4). This stems from the unusual magnetic structure that is observed between 02:00 and 04:00 UT on 20 November. This structure impacts on the results of MC axis orientation from MVA and FRF, and thus the magnetic flux balance analysis is possibly biased. [27] We now report some additional tests that are not shown. We performed a second series of analyses where we modified the time interval used (for both MVA and FRF) so as to exclude the back region from the analysis. Indeed, if the MC is asymmetric owing to erosion, the back region constitutes a region of additional flux with no counterpart on the front side of the MC. Although such asymmetry might influence the results from both MVA and FRF (and in turn the flux balance analysis), the use of a shortened MC interval at ACE without the back region yielded results compatible with erosion and with those obtained when the full MC is analyzed. The analysis at ST-A using a shortened MC interval without the back region also shows flux imbalance with similar results, but there is substantially less variability in the results when the back region is removed from analysis. Indeed, we note that our MVA analyses yield weak standard deviations in terms of axis orientation at ACE: lower than 2. At ST-A, the standard deviation is 6 if the full MC is analyzed (Figure 4) and 2 (not shown) if the back region is removed from analysis. These results are consistent with the work carried out by Gulisano et al. [2007] who studied the bias of MVA in the determination of MC axis orientation. They concluded that the orientation is well determined for MC axes close to the ecliptic plane and with reasonably small impact parameters (i.e., spacecraft crossing close to the MC center) as in the present case. [28] As mentioned in section 3, we defined the front MC boundary at 22:22 UT (19 November) at ACE, which is earlier than the corresponding start time given in Gosling and Szabo [2008] and Farrugia et al. [2011] for WIND. Although not shown, quite obviously if one starts the azimuthal flux accumulation in Figure 4 at the later time defined by these authors, then the estimated back region is even more extended (5% change in total azimuthal flux). [29] In conclusion, for both ACE and ST-A the combination of several methods and error analyses based on both bootstrap and changes in the MC boundary definitions all concur and are compatible with the existence of a significant excess magnetic flux in the trailing part of the MC, which we further substantiate and interpret in the next sections. [30] In order to estimate the amount of azimuthal magnetic flux that was eroded from the front of the MC, we compute the total azimuthal flux before reconnection with the ambient solar wind magnetic field (F t,azimuthal ), which can be determined using solely the second half of the MC from the sum of Fy/L (in absolute value) between the peak in accumulated flux and the end of the MC (Figure 4) [Dasso et al., 2006]. 7of16
8 Figure 5. Parametric study of the impact of an arbitrary MC axis orientation on the amount of azimuthal magnetic flux eroded from the front of the MC at (a) ACE and (b) ST-A, as defined in section The display is centered on the orientation given by the mean MC axis orientation from our analyses (cf. Table 1). The line separating the dark blue and the brown regions in the plots corresponds to axes orientations for which the azimuthal flux is exactly balanced (in the front and back parts of the MC). Regions with other colors (blue to red) are consistent with erosion of various degrees (cf. color scale for MC flux erosion percentage), while the entire brown part of the plot is inconsistent with erosion and the presence of a back region. The axis orientation obtained by Farrugia et al. [2011] using MVA (from WIND and ST-A) is given as a solid purple circle for context. We assume a MC length of 2 AU in order to be consistent with previous works [e. g. Nakwacki et al., 2011]. We obtain F t,azimuthal = Mx for ACE and Mx for ST-A. The amount of eroded azimuthal flux F e,azimuthal (i.e., equal to the azimuthal flux contained in the inferred back region) is then given by the absolute value of Fy at the end of the MC, F e,azimuthal = Mx at ACE and Mx at ST-A. The eroded azimuthal magnetic flux corresponds to 44% and 49% of the total, initial azimuthal magnetic flux, respectively at ACE and ST-A. [31] With regards to the axial magnetic flux F z, we may also calculate it from observations as performed in Dasso et al. [2006, 2007]. We assume a circular MC cross section, p = 0 and we compute r = x(t) x center (x is the distance inside the MC in AU, x center corresponds to the center of the MC as defined by the maximum in accumulated azimuthal B y magnetic field). Note that we also neglect the axial flux in the core since it only corresponds to a correction of the order (p/r) 2 [Dasso et al., 2006]. Following Dasso et al. [2006, 2007], the axial flux is calculated as Z tx ð Þ F z ¼ 2p B z;cloud ðþxt ð ðþ x center ÞV x;cloud ðþdt tin From this calculation we obtain the total axial magnetic fluxes, which are F t,axial = Mx at ACE and Mx at ST-A. We also find eroded axial magnetic fluxes of F e,axial = Mx at ACE and Mx at ST-A. Hence, the amounts of eroded axial magnetic fluxes correspond to 75% and 45% of the total axial fluxes, respectively at ACE and ST-A Parametric Study of Axis Orientation Impact on Accumulated Azimuthal Flux [32] Figure 5 shows a parametric study that highlights the amount of eroded azimuthal magnetic flux as a function of MC axis orientation. Each contour value quantifies the inferred erosion (as defined in Section 4.1.4) when alternative MC orientations are arbitrarily chosen in terms of latitude and longitude at ACE (a) and ST-A (b). The central value corresponds to the mean MC axis orientation from our analysis (cf. Table 1). [33] Figure 5 demonstrates that only a large error in axis determination (more than 20 for ST-A and more than 10 for ACE), and specifically toward lower latitude only, could explain the imbalance in azimuthal flux. This simple parametric study further and strongly supports the fact that there is an actual azimuthal flux imbalance at both ACE and ST-A, and which we interpret as the signature of magnetic erosion Signatures of Magnetic Reconnection at the MC Front Boundary [34] The erosion mechanism investigated here implies the occurrence of magnetic reconnection at the front of the MC during its propagation. Magnetic reconnection creates rotational discontinuities that are observed as bifurcated current sheets bounding an exhaust [Farrugia et al., 2001; Gosling et al., 2005a; Gosling and Szabo, 2008]. During an exhaust crossing, a spacecraft should observe correlated changes in V and B components at one edge (or current sheet) of the exhaust and anti-correlated changes at the other edge. 8of16
9 [35] Figure 6 shows selected plasma and magnetic field data at different spacecraft when these cross the front boundary of the MC on 19 November. Vertical dashed green lines identify the transition from the solar wind ahead of the MC (to the left) to the MC itself (to the right). As shown by these lines, there are fairly clear bifurcated current sheet signatures (two well separated gradients mainly in either/or the B t and B n components) at the three spacecraft shown: ST-B, THEMIS-B, and ST-A. Note that we use THEMIS-B data here because this data set has a higher time resolution (3 s) than ACE (1-min for velocity moments) and because WIND has a data gap at this time. THEMIS B is in the pristine solar wind (as confirmed from visual inspection of the particle energy-time spectrograms) close to Earth at this time (GSE coordinates [ 9, 29, 9.5] R E ). To confirm that these bifurcated current sheet signatures are bounding reconnection exhausts, i.e., with Alfvénic changes in the velocity components, we perform the Walén test [Hudson, 1970; Paschmann et al., 1986]: V pre ¼ V ref r 1=2 ref B=r B ref =r ref =m 1=2 0 ð3þ Here, V, B, r, represent the velocity, magnetic field and density (the pressure anisotropy factor is not accounted here owing to the lack of such data). The subscript ref denotes the reference time at the leading or trailing edge of the exhaust in the upstream region, and subscript pre denotes the velocity predicted across the region for an exhaust bounded by rotational discontinuities. The positive (negative) sign is chosen for the trailing (leading) edge of the exhaust. The velocities predicted inside the exhausts are shown as colored dashed lines in Figure 6 for ST-A and THEMIS-B. (For context, Figure 7 shows data only around the exhaust seen at ACE and THEMIS-B, confirming it is indeed the same exhaust observed by THEMIS-B at 23:18 UT (Nov. 19). Moreover, we note that despite the low resolution of the proton velocity data at ACE, the expected velocity change (marked jet in Figure 7) is also seen at this spacecraft. Based on the velocity at the MC front (440 km/sec) and the distance between ACE and THEMIS (224 Re) the expected delay is 54 min, compatible with observations. [36] In Figure 6 the Walén tests are performed inward from the vertical black dashed lines, which correspond to the reference times used in the application of equation (1). As can be seen, the test is basically successful for both THEMIS-B and ST-A. From Figure 6, we note the exhausts at THEMIS-B and ST-A have very different durations. The spatial width of the exhaust is estimated to be 9450 km at THEMIS-B, whereas at ST-A it is km. This suggests that ST-A is at a significant distance from the reconnection line while THEMIS-B (and ACE) is much closer. For 9of16 Figure 6. Data for the exhausts seen at ST-B, THEMIS-B and ST-A at the front of the MC together with Walén test results when the time resolution is sufficient (THEMIS-B and ST-A). For each spacecraft the panels show (a, e, i) proton density, (b, f, j) magnetic field components, (c, g, k) proton velocity components observed and predicted (dashed lines), and (d, h, j) proton velocity magnitude observed and predicted (dashed lines). The two black vertical lines denote the reference times for the Walén test (which is performed inward ). The green vertical lines denote the edges of the exhaust, i.e., the bifurcated current sheets. The time interval used to determine the orientation of the reconnection line through MVA is also indicated with an arrow (cf. Table 2).
10 Figure 7. Data for the exhaust seen at ACE and THEMIS-B at the MC front boundary on 19 November: the magnetic field components for (a) ACE and (b) THEMIS and (b and d) the associated velocity components. Despite a resolution too low to allow a proper Walén test, a proton jet is clearly also observed at ACE at the front boundary of the MC. ST-B, a bifurcated current sheet structure akin to that observed at ACE and THEMIS-B is observed at 22:46 UT (November 19). However, the time resolution of the proton data is insufficient to perform the Walén test at this spacecraft because the exhaust is much thinner at ST-B than at ST-A. [37] Because the magnetic field component normal to a reconnecting current sheet should be constant for an ideal magnetic reconnection exhaust with a constant guide field, the MVA minimum eigenvector provides the direction normal to the current sheet while putative reconnection line orientations are given by the intermediate eigenvector direction [see, e.g., Phan et al., 2006; Gosling et al., 2007]. Table 2 summarizes the results for the reconnection line orientations obtained at each spacecraft, together with the local magnetic shear and Walén tests results for the exhausts. Figure 8 shows the orientation of the reconnection lines at the three spacecraft. The main feature is that the reconnection lines at all spacecraft have a significant tilt both away from the equator and away from the radial direction to Sun Signature of Large-Scale Topological Changes in Suprathermal Electrons [38] Finally, we examine the large-scale topological changes that may be expected from the process of magnetic erosion envisaged here (Figure 1). For this purpose we may use suprathermal electrons as tracers (cf. introduction). [39] The suprathermal electron PADs displayed in Figure 3 show that this MC is characterized by both closed and open field lines, as indicated by the presence of both bi- and unidirectional suprathermal electrons. The unidirectional beams are observed anti-parallel to the magnetic field at all spacecraft, consistent with the spacecraft observing the same MC. The open field lines with unidirectional electrons observed in the core of the MC, before the back region inferred previously, can be associated with the occurrence of interchange reconnection at the Sun as has often been reported [e.g., Crooker, 2004; Owens and Crooker, 2006; Lavraud et al., 2011]. Note, however, that such interchange reconnection cannot affect the magnetic structure of the Table 2. Properties of the Exhausts Observed at the MC Front Boundaries at Each Spacecraft ACE THEMIS ST-A ST-B Time interval of exhaust location 22:20:30 22:21:30 23:18:05 23:18:26 21:28 22:01 22:46:45 22:47:03 Time interval of MVA 22:19:30 22:22:30 23:17:44 23:18:47 21:13 22:16 22:46:36 22:47:12 Reconnection line orientation (GSE) [ 0.01, 0.68, 0.73] [ 0.49, 0.74, 0.45] [ 0.03, 0.35, 0.94] [0.54, 0.67, 0.51] Walén test Insufficient resolution ok ok Insufficient resolution Magnetic shear angle of 16
11 Figure 8. Projections of the reconnection line orientations at each spacecraft in GSE coordinates at 22:00 UT on 19 November 2007 in the X-Y GSE (a) and Z-Y GSE (b) planes. MC observed at 1 AU because information (traveling at the Alfvén speed) does not have enough time to be transmitted to 1 AU. [40] The back regions of the MC were estimated to span from 9:53 to 11:43 UT (on 20 November) at ACE and from 23:40 to 03:20 UT (on Nov.) at ST-A (vertical red lines in Figure 3). Figure 9 shows 5-min averages of the suprathermal electron pitch angle distributions (PADs) at times just before and just after this expected transition between the core of the MC and the back region for each spacecraft. The time intervals are respectively 9:00 9:05 UT and 10:30 10:35 on 20 Nov. (23:00 23:05 on 20 Nov. and 00:00 00:05 on 21 Nov.) for ACE (ST-A). Clear changes in both phase space density (PSD) values (parallel and antiparallel) and distribution angular widths are observed upon entry into the back region for both ACE and ST-A. These are suggestive of a different strahl source for the back region of the MC, as discussed next in section 5.4. Changes are also observed near the end of the MC at ST-B, but these are not analyzed, nor interpreted, since the azimuthal flux balance analysis is deemed to be biased at this spacecraft, as discussed in section Discussion [41] We here discuss how this combined set of signatures provides significant, additional evidence for the occurrence Figure 9. (a) ACE and (b) ST-A suprathermal electron pitch angle distributions obtained in the MC back region (red curve) and the MC core (blue curve), at times close to the boundary separating those two regions (see section 4.4 for details). Each is an average of consecutive PAD samples over 5 min. 11 of 16
12 Figure 10. Illustration of the projected helical MC field (black curve), with estimated reconnection line orientations (color curves), for the exhausts observed at the MC front boundaries at the three spacecraft in the ZY planes (HEE coordinates). This suggests that it may not be the same reconnection line observed at all spacecraft. of magnetic erosion during the propagation of the MC observed on November 19 21, Evidence From Multipoint Magnetic Flux Imbalance Analyses [42] The accumulated azimuthal magnetic flux analysis reveals the presence of an excess magnetic flux in the trailing part of the MC at both ACE and ST-A. Dasso et al. [2006] devised and used this method with single satellite observations, and without detailed error assessment. In the present study, the MC is observed at 3 different and widely separated spacecraft. This puts constraints on the spatial configuration of the MC. For instance, as shown in Owens et al. [2012], passage through the leg of a MC significantly alters the observed magnetic field signatures (e. g. double flux rope signature). Such large alterations of the magnetic field are not seen at ST-A. ST-A is therefore not sampling the leg of the MC. The longer duration of the MC at ST-A may rather reflect a larger expansion of the MC. This is compatible with the observed lower magnetic field strength, the smaller difference between the MC velocity and solar wind ahead of it, and the absence of a shock at ST-A. [43] The two MC axes obtained for ACE and ST-A are somewhat different (Figure 5), with the latitude of the axis being larger at ST-A. Focusing on the parametric study for ACE in Figure 5, it is very unlikely that the axis orientation at this spacecraft could be wrong by more than 10, and specifically toward lower latitude, since this would increase the difference with the orientation found at ST-A and since errors on axis orientation are particularly low at this spacecraft. All these results give strong confidence in the finding that the azimuthal magnetic flux is strongly imbalanced at least at ACE, but also at ST-A. The azimuthal magnetic flux contained in the back region is equivalent to the magnetic flux that has been eroded at the front of the MC. According to our calculations, the amount of azimuthal magnetic flux that was eroded from the front of the MC at ACE corresponds to 44% of the total, initial azimuthal magnetic flux measured, i.e., before erosion. This calculation yields 49% at ST-A. Note that Dasso et al. [2006, 2007] estimated the amount of eroded azimuthal magnetic flux with the same method for two MCs on November 1995 and 9 11 November 2004: the values were respectively 57% and 17%. [44] We also noted that the trailing edge of the MC is compressed by a high-speed solar wind. This compression is significant, as observed in the magnetic field (Figure 3), and as shown by Rouillard et al. [2010] and Farrugia et al. [2011] for this MC. Although such MC distortion may impact the MVA and FRF analyses, as mentioned in section 4 the results are similar when the compressed back region is left out of the analyses at both ACE and ST-A. This effect is also not expected to influence the accumulated flux calculation since magnetic flux is conserved through mere adiabatic compression. Future studies ought, nevertheless, to study uncompressed MCs Evidence From the Estimated MC Twist After Erosion [45] The force-free fitting method allows us to estimate the MC a parameter. In the force free model, a = 2.41 corresponds to a completely poloidal field at the outer MC boundaries (r = 1). We obtain for ACE a value of 2.16 when analyzing the full MC interval (Table 1). We obtain a value of 1.92 when the back region is left out of the analysis, i.e., when analyzing the symmetric part of the MC only. We may claim that this is consistent with an eroded MC in the forcefree model assumption. However, because we have no knowledge of the initial configuration (in terms of a parameter) of the MC at the time of its initiation at the Sun, this result only provides an additional element but may not be viewed as a strong argument Evidence From the Observation of Reconnection at the MC Front Boundary [46] MC erosion during propagation in the interplanetary medium implies the occurrence of magnetic reconnection at its front boundary, as depicted in Figure 1. As was demonstrated in section 4.3, signatures of reconnection exhausts at the front boundary of the MC were observed at all spacecraft (though with variable uncertainties owing to different time resolutions and exhaust widths). This demonstrates that the expected magnetic reconnection did occur, at least at the position and time of observation, for this particular MC. We note, however, that although magnetic reconnection at the front boundary of the MC is a prerequisite to the erosion mechanism invoked here, it needs not be observed specifically at the spacecraft at the time of observation as long as it did occur at earlier times during propagation. Interestingly, the erosion is observed here for a rather slow MC (450 km/s). Erosion is, however, expected to be stronger for faster MCs owing to increased compression at the forward shock, with associated increased reconnection rates. [47] Figure 10 shows the reconnection lines orientations at the MC fronts, deduced from MVA analysis, in the Y-Z HEE plane. The reconnection lines have somewhat different tilt angles at each spacecraft, which is not unexpected owing to the large inter-spacecraft distances and the 3D geometry of a MC that interacts with its environment. Although it is not the purpose of the present study, we note that the reconnection line tilts in the Y-Z plane are large. This brings up the question of whether there is a single or several patchy reconnection lines present along the front of the MC. This is in analogy to the issue of extended versus patchy reconnection at Earth s dayside magnetopause as a function of IMF conditions, and which also depends on complex 3-dimensional geometrical 12 of 16
13 Figure of 16
14 considerations (as further discussed in section 5.5) and on the influence of various processes occurring at the shock and in the sheath Evidence for a Different Suprathermal Electron Strahl Source [48] The suprathermal electrons PADs in the MC back regions show clear changes at ACE and ST-A as compared to the core of the MC. Because the erosion process implies large-scale topological changes (Figure 1), we do expect the source of the strahl in the back region to be different from that in the MC core. This is what is observed for both ACE and ST-A at the expected times (within 1 h). An unexpected signature would be to observe no changes at all in the PADs as the spacecraft enter the inferred back regions. [49] The observed enhanced magnetic field in the back region and the presence of a trailing high-speed stream (cf. Figure 3) suggest adiabatic compression is occurring. From Liouville s theorem, such an adiabatic compression would result in a larger PAD width of the strahl, but without any increase in absolute phase space density values around 180. This is opposite to what is observed at the transition between the core of the MC and the inferred back regions, where the phase space density at 180 significantly increases (decreases) at ST-A (ACE) while the PAD width does not change or even decreases at both spacecraft. The strahl source is thus different in the back regions at both ACE and ST-A Reconnection Scenarios and Complexity of the 3D Global Topology [50] These signatures in the suprathermal electron PADs are thus consistent with a topological change at the front of the MC and subsequent erosion. However, because of the complex topology of the MC and of the possibly patchy reconnection lines, we have no obvious way of knowing where the eroded magnetic field may now connect to in the heliosphere, and whether or not they should be singly or doubly connected to the Sun. Figure 11 illustrates this fact. Figures 11a 11b and Figures 11c 11d respectively show configurations where reconnection lines with the rough local properties observed at ST-A and ACE are used. Because the magnetic field and suprathermal electron properties at the MC front boundaries are different at ACE and ST-A, as well as in the slow solar wind ahead of it with different sectors being observed at ACE and ST-A (i.e., the strahl is measured at 0 at 22UT on 19 Nov. at ACE and at 180 at 19UT on 19 Nov. at ST-A), the obtained new connectivity inside the MC may have either closed or open magnetic topologies at other locations along the magnetic fields of the MC. [51] These configurations, however, are over-simplified. Placing both reconnection scenarios into the same picture significantly alters these simple geometries and makes the global 3D topology more complex. This is illustrated in Figures 11e and 11f where all cases of parallel, anti-parallel or bidirectional suprathermal electrons may be found at various places in the MC depending on where reconnection occurs. Figures 11e and 11f may not be viewed as realistic either. This is because even more complex configurations can be envisaged if reconnection varies spatially and temporally, and if reconnection occurs along extended lines rather than points as depicted in the figures for sake of simplicity. Adding to this complexity is the fact that part of the MC is likely disconnected from the Sun at one end (left-hand side of MC in all figures) through interchange reconnection in the corona. [52] In conclusion, we may not attempt to fully explain the characteristics of suprathermal electrons in the MC but simply note that suprathermal electron PADs must change in the back region. We may not know what strahl and PAD properties are to be expected with the new connectivity because we do not know the global 3D topology that follows from such reconnections. This is also why the relative changes in PAD profiles, as observed in Figure 9 (red and blue curves), do not have to be the same at all spacecraft (again, owing to a complex 3D geometry). PAD properties (e.g., at ST-B) may thus not be used alone to study erosion. Future studies ought to investigate this further, for instance through the use of global modeling Inferences for the Preferential Location and Rate of Magnetic Reconnection During Propagation [53] We note that Gosling and Szabo [2008] found a reconnection exhaust at the trailing boundary of the MC (11:46 UT at WIND/11:42 UT at ACE on 20 November). This likely stems from the compression that occurs as the trailing high-speed stream overtakes the MC. Because this compression is expected to build-up gradually as it propagates in the heliosphere, it is probable that the reconnection process at the trailing boundary has not been much efficient in the inner heliosphere. By contrast, since the Alfvén speed in the solar wind increases as one approaches the Sun [Fujimoto et al., 2007; Lavraud and Borovsky, 2008], and magnetic reconnection rate scales with the Alfvén speed, we may expect that a significant portion of the magnetic erosion investigated here has in fact occurred in the inner parts of the heliosphere. [54] From the observed azimuthal magnetic flux erosion and knowledge of the transit time from the Sun, we can estimate the average reconnection rate which prevailed at the front MC boundary during propagation. Howard and Tappin [2009] observed this CME from different viewpoints on 15 November at 18:10 UT (by COR2-B), 18:40 UT (by COR2-A) and 18:50 UT (by LASCO2). We choose the mean Figure 11. Illustration of different reconnection scenarios at the front of the MC and resulting global three-dimensional topologies. (a, c, e) The topology of the MC and solar wind magnetic field lines before magnetic reconnection occurs. The global magnetic field topology that may be inferred in the case when magnetic reconnection occurs at (b) ST-A, (d) ACE and (f) at both spacecraft. Reconnection is assumed with solar wind from a toward sector at ST-A and an away sector at ACE, as observed. Blue lines correspond to closed magnetic field lines where counterstreaming suprathermal electron beams may be expected. Green and red lines respectively correspond to open field lines with anti-parallel and parallel unidirectional suprathermal electrons. Arrows show the orientation of the magnetic field. These topologies, and inferred electron properties, must be viewed as highly idealized and thus not realistic. Much more complex, and thus unpredictable, configurations may be expected as a function of the type and spatiotemporal variability of reconnection lines at the MC front boundary. 14 of 16
Sta$s$cal Analysis of Magne$c Cloud Erosion by Magne$c Reconnec$on
 ISEST, Interna\onal Study of Earth- Affec\ng Solar Transients - 2013 Sta$s$cal Analysis of Magne$c Cloud Erosion by Magne$c Reconnec$on A. Ruffenach (1), B. Lavraud (1), C. J. Farrugia (2), P. Démoulin
GEOPHYSICAL RESEARCH LETTERS, VOL. 34, L20108, doi: /2007gl031492, 2007
 Click Here for Full Article GEOPHYSICAL RESEARCH LETTERS, VOL. 34,, doi:10.1029/2007gl031492, 2007 Five spacecraft observations of oppositely directed exhaust jets from a magnetic reconnection X-line extending
Deformation of ICME and MC on 1 30 AU Seen by Voyager 2 and WIND
 WDS'10 Proceedings of Contributed Papers, Part II, 128 134, 2010. ISBN 978-80-7378-140-8 MATFYZPRESS Deformation of ICME and MC on 1 30 AU Seen by Voyager 2 and WIND A. Lynnyk, J. Šafránková, Z. Němeček
Magnetic Reconnection in ICME Sheath
 WDS'11 Proceedings of Contributed Papers, Part II, 14 18, 2011. ISBN 978-80-7378-185-9 MATFYZPRESS Magnetic Reconnection in ICME Sheath J. Enzl, L. Prech, K. Grygorov, A. Lynnyk Charles University, Faculty
In-Situ Signatures of Interplanetary Coronal Mass Ejections
 In-Situ Signatures of Interplanetary Coronal Mass Ejections Ian G. Richardson, NASA/Goddard Space Flight Center and CRESST/Department of Astronomy, University of Maryland, College Park ~Two dozen in-situ
Downstream structures of interplanetary fast shocks associated with coronal mass ejections
 GEOPHYSICAL RESEARCH LETTERS, VOL. 32,, doi:10.1029/2005gl022777, 2005 Downstream structures of interplanetary fast shocks associated with coronal mass ejections R. Kataoka, S. Watari, N. Shimada, H. Shimazu,
Interaction of ICMEs with the Solar Wind
 Interaction of ICMEs with the Solar Wind Pascal Démoulin Observatoire de Paris, LESIA, UMR 8109 (CNRS), F-92195 Meudon Principal Cedex, France Abstract. Interplanetary Coronal Mass Ejections (ICMEs) are
Observations of an interplanetary slow shock associated with magnetic cloud boundary layer
 Click Here for Full Article GEOPHYSICAL RESEARCH LETTERS, VOL. 33, L15107, doi:10.1029/2006gl026419, 2006 Observations of an interplanetary slow shock associated with magnetic cloud boundary layer P. B.
Expected in Situ Velocities from a Hierarchical Model for Expanding Interplanetary Coronal Mass Ejections
 Solar Physics DOI: 10.1007/ - - - - Expected in Situ Velocities from a Hierarchical Model for Expanding Interplanetary Coronal Mass Ejections P. Démoulin 1, M.S. Nakwacki 2, S. Dasso 2,3, C.H. Mandrini
Estimation of the bias of the minimum variance technique in the determination of magnetic clouds global quantities and orientation
 Estimation of the bias of the minimum variance technique in the determination of magnetic clouds global quantities and orientation A.M. Gulisano, S. Dasso, C.H. Mandrini, P. Démoulin, Instituto de Astronomía
Evolution of interplanetary coronal mass ejections and magnetic clouds in the heliosphere
 IAUS300, Nature of prominences and their role in Space Weather Proceedings IAU Symposium No. S300, 2014 B. Schmieder, J.M. Malherbe & S.T. Wu, eds. c 2014 International Astronomical Union DOI: 00.0000/X000000000000000X
University of Warwick institutional repository:
 University of Warwick institutional repository: http://go.warwick.ac.uk/wrap This paper is made available online in accordance with publisher policies. Please scroll down to view the document itself. Please
Generation and properties of in vivo flux transfer events
 JOURNAL OF GEOPHYSICAL RESEARCH, VOL. 117,, doi:10.1029/2011ja017166, 2012 Generation and properties of in vivo flux transfer events H. Zhang, 1,2,3 M. G. Kivelson, 1,2 V. Angelopoulos, 1,2 K. K. Khurana,
PROPAGATION AND EVOLUTION OF ICMES IN THE SOLAR WIND
 PROPAGATION AND EVOLUTION OF ICMES IN THE SOLAR WIND John D. Richardson, Ying Liu, and John W. Belcher Massachusetts Institute of Technology Cambridge, MA, USA jdr@space.mit.edu Abstract Interplanetary
STRUCTURE OF A MAGNETIC DECREASE OBSERVED
 Journal of the Korean Astronomical Society http://dx.doi.org/1.33/jkas.216.49.1.19 49: 19 23, 216 February pissn: 122-4614 eissn: 2288-89X c 216. The Korean Astronomical Society. All rights reserved. http://jkas.kas.org
Solar energetic electron probes of magnetic cloud field line lengths
 JOURNAL OF GEOPHYSICAL RESEARCH, VOL. 116,, doi:10.1029/2010ja015328, 2011 Solar energetic electron probes of magnetic cloud field line lengths S. W. Kahler, 1 S. Krucker, 2 and A. Szabo 3 Received 2 February
INTERPLANETARY ASPECTS OF SPACE WEATHER
 INTERPLANETARY ASPECTS OF SPACE WEATHER Richard G. Marsden Research & Scientific Support Dept. of ESA, ESTEC, P.O. Box 299, 2200 AG Noordwijk, NL, Email: Richard.Marsden@esa.int ABSTRACT/RESUME Interplanetary
JOURNAL OF GEOPHYSICAL RESEARCH, VOL.???, XXXX, DOI: /,
 JOURNAL OF GEOPHYSICAL RESEARCH, VOL.???, XXXX, DOI:10.1029/, Multiple-spacecraft Study of an Extended Magnetic Structure in the Solar Wind P. Ruan, 1 A. Korth, 1 E. Marsch, 1 B. Inhester, 1 S. Solanki,
arxiv: v1 [astro-ph.sr] 23 Aug 2014
![arxiv: v1 [astro-ph.sr] 23 Aug 2014](/thumbs/77/76461305.jpg "arxiv: v1 [astro-ph.sr] 23 Aug 2014") JOURNAL OF GEOPHYSICAL RESEARCH, VOL.???, XXXX, DOI:10.1029/, In Situ Properties of Small and Large Flux Ropes in the Solar Wind M. Janvier, 1 P. Démoulin, 2 S. Dasso, 3,4,5 arxiv:1408.5520v1 [astro-ph.sr]
JOURNAL OF GEOPHYSICAL RESEARCH, VOL.???, XXXX, DOI:10.1029/, In Situ Properties of Small and Large Flux Ropes in the Solar Wind M. Janvier, 1 P. Démoulin, 2 S. Dasso, 3,4,5 arxiv:1408.5520v1 [astro-ph.sr]
arxiv: v1 [astro-ph.sr] 22 Nov 2012
![arxiv: v1 [astro-ph.sr] 22 Nov 2012](/thumbs/72/67832648.jpg "arxiv: v1 [astro-ph.sr] 22 Nov 2012") Astronomy & Astrophysics manuscript no. demoulin12_arxiv c ESO 2012 November 26, 2012 Does the spacecraft trajectory strongly affect the detection of magnetic clouds? P. Démoulin 1, S. Dasso 2, 3, and
Astronomy & Astrophysics manuscript no. demoulin12_arxiv c ESO 2012 November 26, 2012 Does the spacecraft trajectory strongly affect the detection of magnetic clouds? P. Démoulin 1, S. Dasso 2, 3, and
Plasma and Magnetic Field Observations of Stream Interaction Regions near 1 AU
 Plasma and Magnetic Field Observations of Stream Interaction Regions near 1 AU Lan K. Jian 1, C.T. Russell 1, J.G. Luhmann 2, A.B. Gavin 3, D. Odstrcil 4, P.J. MacNeice 5 1 Inst. of Geophysics & Planetary
Petschek-type magnetic reconnection exhausts in the solar wind well
 Click Here for Full Article JOURNAL OF GEOPHYSICAL RESEARCH, VOL. 111,, doi:10.1029/2006ja011863, 2006 Petschek-type magnetic reconnection exhausts in the solar wind well inside 1 AU: Helios J. T. Gosling,
Long term data for Heliospheric science Nat Gopalswamy NASA Goddard Space Flight Center Greenbelt, MD 20771, USA
 Long term data for Heliospheric science Nat Gopalswamy NASA Goddard Space Flight Center Greenbelt, MD 20771, USA IAU340 1-day School, Saturday 24th February 2018 Jaipur India CMEs & their Consequences
Cluster observations of hot flow anomalies
 JOURNAL OF GEOPHYSICAL RESEARCH, VOL. 109,, doi:10.1029/2003ja010016, 2004 Cluster observations of hot flow anomalies E. A. Lucek, T. S. Horbury, and A. Balogh Blackett Laboratory, Imperial College, London,
Evidence that crater flux transfer events are initial stages of typical flux transfer events
 JOURNAL OF GEOPHYSICAL RESEARCH, VOL. 115,, doi:10.1029/2009ja015013, 2010 Evidence that crater flux transfer events are initial stages of typical flux transfer events H. Zhang, 1 M. G. Kivelson, 1 K.
Reconciling the electron counterstreaming and dropout occurrence rates with the heliospheric flux budget
 Reconciling the electron counterstreaming and dropout occurrence rates with the heliospheric flux budget Article Published Version Owens, M. J. and Crooker, N. U. (2007) Reconciling the electron counterstreaming
Bulk properties of the slow and fast solar wind and interplanetary coronal mass ejections measured by Ulysses: Three polar orbits of observations
 JOURNAL OF GEOPHYSICAL RESEARCH, VOL. 114,, doi:10.1029/2008ja013631, 2009 Bulk properties of the slow and fast solar wind and interplanetary coronal mass ejections measured by Ulysses: Three polar orbits
STATISTICAL PROPERTIES OF FAST FORWARD TRANSIENT INTERPLANETARY SHOCKS AND ASSOCIATED ENERGETIC PARTICLE EVENTS: ACE OBSERVATIONS
 STATISTICAL PROPERTIES OF FAST FORWARD TRANSIENT INTERPLANETARY SHOCKS AND ASSOCIATED ENERGETIC PARTICLE EVENTS: ACE OBSERVATIONS D. Lario (1), Q. Hu (2), G. C. Ho (1), R. B. Decker (1), E. C. Roelof (1),
Lecture 5 CME Flux Ropes. February 1, 2017
 Lecture 5 CME Flux Ropes February 1, 2017 energy release on the Sun in a day CMEs best seen by coronagraphs LASCO C2 CMEs best seen by coronagraphs LASCO C3 The three-part white light CME Front Core Cavity
MULTIPLE MAGNETIC CLOUDS IN INTERPLANETARY SPACE. 1. Introduction
 MULTIPLE MAGNETIC CLOUDS IN INTERPLANETARY SPACE Y. M. WANG, S. WANG and P. Z. YE School of Earth and Space Sciences, University of Science and Technology of China, Hefei, China (E-mail: wym@mail.ustc.edu.cn)
Reconstruction of a magnetic flux rope from THEMIS observations
 Click Here for Full Article GEOPHYSICAL RESEARCH LETTERS, VOL. 35, L17S05, doi:10.1029/2007gl032933, 2008 Reconstruction of a magnetic flux rope from THEMIS observations A. T. Y. Lui, 1 D. G. Sibeck, 2
Magnetic reconnection and cold plasma at the magnetopause
 GEOPHYSICAL RESEARCH LETTERS, VOL. 37,, doi:10.1029/2010gl044611, 2010 Magnetic reconnection and cold plasma at the magnetopause M. André, 1 A. Vaivads, 1 Y. V. Khotyaintsev, 1 T. Laitinen, 1 H. Nilsson,
Connecting Magnetic Clouds to Solar Surface Features
 Connecting Magnetic Clouds to Solar Surface Features Vasyl Yurchyshyn Coronal mass ejecta (CMEs) are known to cause strongest geomagnetic storms Most of the strongest storms are associated with arrival
Multispacecraft recovery of a magnetic cloud and its origin from magnetic reconnection on the Sun
 JOURNAL OF GEOPHYSICAL RESEARCH, VOL. 114,, doi:10.1029/2008ja013657, 2009 Multispacecraft recovery of a magnetic cloud and its origin from magnetic reconnection on the Sun C. Möstl, 1,2 C. J. Farrugia,
Solar cycle effect on geomagnetic storms caused by interplanetary magnetic clouds
 Ann. Geophys., 24, 3383 3389, 2006 European Geosciences Union 2006 Annales Geophysicae Solar cycle effect on geomagnetic storms caused by interplanetary magnetic clouds C.-C. Wu 1,2,3 and R. P. Lepping
The largest geomagnetic storm of solar cycle 23 occurred on 2003 November 20 with a
 Solar source of the largest geomagnetic storm of cycle 23 N. Gopalswamy 1, S. Yashiro 1,2, G. Michalek, H. Xie 1,2, R. P. Lepping 1, and R. A. Howard 3 1 NASA Goddard Space Flight Center, Greenbelt, MD,
Global axis shape of magnetic clouds deduced from the distribution of their local axis orientation
 Astronomy & Astrophysics manuscript no. janvier13_axismc c ESO 213 May 16, 213 Global axis shape of magnetic clouds deduced from the distribution of their local axis orientation M. Janvier 1, P. Démoulin
Astronomy. Astrophysics. Dynamical evolution of a magnetic cloud from the Sun to 5.4 AU
 A&A 535, A52 (211) DOI: 1.151/4-6361/2115853 c ESO 211 Astronomy & Astrophysics Dynamical evolution of a magnetic cloud from the Sun to 5.4 AU M. S. Nakwacki 1,2, S. Dasso 2,3,P.Démoulin 4,C.H.Mandrini
Magnetopause reconnection impact parameters from multiple spacecraft magnetic field measurements
 Click Here for Full Article GEOPHYSICAL RESEARCH LETTERS, VOL. 36, L20108, doi:10.1029/2009gl040228, 2009 Magnetopause reconnection impact parameters from multiple spacecraft magnetic field measurements
Correlation between energetic ion enhancements and heliospheric current sheet crossings in the outer heliosphere
 Click Here for Full Article GEOPHYSICAL RESEARCH LETTERS, VOL. 33, L21112, doi:10.1029/2006gl027578, 2006 Correlation between energetic ion enhancements and heliospheric current sheet crossings in the
Plasma depletion layer: its dependence on solar wind conditions and the Earth dipole tilt
 Annales Geophysicae (2) 22: 273 29 SRef-ID: 132-576/ag/2-22-273 European Geosciences Union 2 Annales Geophysicae Plasma depletion layer: its dependence on solar wind conditions and the Earth dipole tilt
THE SOLAR ORIGIN OF SMALL INTERPLANETARY TRANSIENTS
 C 2011. The American Astronomical Society. All rights reserved. Printed in the U.S.A. doi:10.1088/0004-637x/734/1/7 THE SOLAR ORIGIN OF SMALL INTERPLANETARY TRANSIENTS A. P. Rouillard 1,2, N. R. Sheeley,
Expected in Situ Velocities from a Hierarchical Model for Expanding Interplanetary Coronal Mass Ejections
 Solar Phys (2008) 250: 347 374 DOI 10.1007/s11207-008-9221-9 Expected in Situ Velocities from a Hierarchical Model for Expanding Interplanetary Coronal Mass Ejections P. Démoulin M.S. Nakwacki S. Dasso
IDENTIFICATION OF SOLAR SOURCES OF MAJOR GEOMAGNETIC STORMS BETWEEN 1996 AND 2000 J. Zhang, 1 K. P. Dere, 2 R. A. Howard, 2 and V.
 The Astrophysical Journal, 582:520 533, 2003 January 1 # 2003. The American Astronomical Society. All rights reserved. Printed in U.S.A. IDENTIFICATION OF SOLAR SOURCES OF MAJOR GEOMAGNETIC STORMS BETWEEN
arxiv: v1 [physics.space-ph] 7 Jun 2012
![arxiv: v1 [physics.space-ph] 7 Jun 2012](/thumbs/94/122336046.jpg "arxiv: v1 [physics.space-ph] 7 Jun 2012") Astronomy & Astrophysics manuscript no. Gulisanoetal printer format c ESO 8 February, 8 Expansion of magnetic clouds in the outer heliosphere A.M. Gulisano,,, P. Démoulin, S. Dasso,, L. Rodriguez 5 arxiv:6.5v
Astronomy & Astrophysics manuscript no. Gulisanoetal printer format c ESO 8 February, 8 Expansion of magnetic clouds in the outer heliosphere A.M. Gulisano,,, P. Démoulin, S. Dasso,, L. Rodriguez 5 arxiv:6.5v
A global study of hot flow anomalies using Cluster multi-spacecraft measurements
 Ann. Geophys., 27, 2057 2076, 2009 Author(s) 2009. This work is distributed under the Creative Commons Attribution 3.0 License. Annales Geophysicae A global study of hot flow anomalies using Cluster multi-spacecraft
Simultaneous Geotail and Wind observations of reconnection at the subsolar and tail flank magnetopause
 GEOPHYSICAL RESEARCH LETTERS, VOL. 33, L09104, doi:10.1029/2006gl025756, 2006 Simultaneous Geotail and Wind observations of reconnection at the subsolar and tail flank magnetopause T. D. Phan, 1 H. Hasegawa,
Lecture 12 The Importance of Accurate Solar Wind Measurements
 Lecture 12 The Importance of Accurate Solar Wind Measurements The Approach Magnetospheric studies usually are based on a single solar wind monitor. We propagate the solar wind from the observation point
Deflection flows ahead of ICMEs as an indicator of curvature and geoeffectiveness
 JOURNAL OF GEOPHYSICAL RESEARCH, VOL. 113,, doi:10.1029/2007ja012996, 2008 Deflection flows ahead of ICMEs as an indicator of curvature and geoeffectiveness Y. Liu, 1,2 W. B. Manchester IV, 3 J. D. Richardson,
Cone angle control of the interaction of magnetic clouds with the Earth's bow shock
 Cone angle control of the interaction of magnetic clouds with the Earth's bow shock L. Turc1, P. Escoubet1, D. Fontaine2, E. Kilpua3 1 ESA/ESTEC, Noordwijk, The Netherlands 2 LPP-CNRS-Ecole Polytechnique-UPMC,
Propagation and evolution of a magnetic cloud from ACE to Ulysses
 Click Here for Full Article JOURNAL OF GEOPHYSICAL RESEARCH, VOL. 112,, doi:10.1029/2007ja012482, 2007 Propagation and evolution of a magnetic cloud from ACE to Ulysses D. Du, 1,2 C. Wang, 1 and Q. Hu
Crater FTEs: Simulation results and THEMIS observations
 Click Here for Full Article GEOPHYSICAL RESEARCH LETTERS, VOL. 35, L17S06, doi:10.1029/2008gl033568, 2008 Crater FTEs: Simulation results and THEMIS observations D. G. Sibeck, 1 M. Kuznetsova, 1 V. Angelopoulos,
Y. Wang 1,2,F.S.Wei 1,X.S.Feng 1,P.B.Zuo 1,J.P.Guo 1,X.J.Xu 3, and Z. Li 4,5
 C 212. The American Astronomical Society. All rights reserved. Printed in the U.S.A. doi:.88/4-637x/749/1/82 VARIATIONS OF SOLAR ELECTRON AND PROTON FLUX IN MAGNETIC CLOUD BOUNDARY LAYERS AND COMPARISONS
Mesoscale Variations in the Heliospheric Magnetic Field and their Consequences in the Outer Heliosphere
 Mesoscale Variations in the Heliospheric Magnetic Field and their Consequences in the Outer Heliosphere L. A. Fisk Department of Atmospheric, Oceanic, and Space Sciences, University of Michigan, Ann Arbor,
STEREO Beacon. O. C. St. Cyr. The Catholic University of America NASA-Goddard Space Flight Center (301)
") STEREO Beacon O. C. St. Cyr The Catholic University of America NASA-Goddard Space Flight Center (301) 286-2575 cstcyr@grace.nascom.nasa.gov J. M. Davila NASA-Goddard Space Flight Center (301) 286-8366
STEREO Beacon O. C. St. Cyr The Catholic University of America NASA-Goddard Space Flight Center (301) 286-2575 cstcyr@grace.nascom.nasa.gov J. M. Davila NASA-Goddard Space Flight Center (301) 286-8366
Probing the magnetic polarity structure of the heliospheric current sheet
 JOURNAL OF GEOPHYSICAL RESEARCH, VOL. 108, NO. A8, 1316, doi:10.1029/2002ja009649, 2003 Probing the magnetic polarity structure of the heliospheric current sheet S. W. Kahler Space Vehicles Directorate,
Forecas(ng the Magne(c Field Configura(on of CMEs
 Volker Bothmer University of Göttingen Institute for Astrophysics 26 October 2015 ISEST Workshop, UNAM, Mexico City Forecas(ng the Magne(c Field Configura(on of CMEs Outline 1. Magnetic field configuration
Impacts of torus model on studies of geometrical relationships between interplanetary magnetic clouds and their solar origins
 LETTER Earth Planets pace, 61, 589 594, 29 Impacts of torus model on studies of geometrical relationships between interplanetary magnetic clouds and their solar origins Katsuhide Marubashi 1, uk-kyung
ANALYSIS OF THE INTERPLANETARY EVENTS OBSERVED BY ULYSSES BETWEEN 5 MAY 2002 AND 11 MAY 2002
 ANALYSIS OF THE INTERPLANETARY EVENTS OBSERVED BY ULYSSES BETWEEN 5 MAY 2002 AND 11 MAY 2002 NEDELIA ANTONIA POPESCU, CRISTIANA DUMITRACHE Astronomical Institute of Romanian Academy Str. Cutitul de Argint
Quantitative Comparison of Methods for Predicting the Arrival of Coronal Mass Ejections at Earth based on multi-view imaging
 Quantitative Comparison of Methods for Predicting the Arrival of Coronal Mass Ejections at Earth based on multi-view imaging arxiv:1310.6680v2 [astro-ph.sr] 30 Oct 2013 R. C. Colaninno, A. Vourlidas, C.-C.
Inverse and normal coronal mass ejections: evolution up to 1 AU. E. Chané, B. Van der Holst, C. Jacobs, S. Poedts, and D.
 A&A 447, 727 733 (2006) DOI: 10.1051/0004-6361:20053802 c ESO 2006 Astronomy & Astrophysics Inverse and normal coronal mass ejections: evolution up to 1 AU E. Chané, B. Van der Holst, C. Jacobs, S. Poedts,
Effect of CME Events of Geomagnetic Field at Indian Station Alibag and Pondicherry
 Effect of CME Events of Geomagnetic Field at Indian Station Alibag and Pondicherry Babita Chandel Sri Sai University Palampur, Himachal Pradesh, India Abstract: Space weather activity CMEs, and solar energetic
2-1-4 Preceding Monitoring of Solar Wind Toward the Earth Using STEREO
 2-1-4 Preceding Monitoring of Solar Wind Toward the Earth Using STEREO NAGATSUMA Tsutomu, AKIOKA Maki, MIYAKE Wataru, and OHTAKA Kazuhiro Acquisition of solar wind information before it reaches the earth
First observations of foreshock bubbles upstream of Earth s bow shock: Characteristics and comparisons to HFAs
 JOURNAL OF GEOPHYSICAL RESEARCH: SPACE PHYSICS, VOL. 118, 1 17, doi:1.1/jgra.198, 13 First observations of foreshock bubbles upstream of Earth s bow shock: Characteristics and comparisons to HFAs D. L.
Mercury s magnetosphere-solar wind interaction for northward and southward interplanetary magnetic field during the MESSENGER Flybys
 Mercury s magnetosphere-solar wind interaction for northward and southward interplanetary magnetic field during the MESSENGER Flybys P. M. Trávníček 1,3, D. Schriver 2, D. Herčík 3, P. Hellinger 3, J.
On the variations of the solar wind magnetic field about the Parker spiral direction
 JOURNAL OF GEOPHYSICAL RESEARCH, VOL. 115,, doi:10.1029/2009ja015040, 2010 On the variations of the solar wind magnetic field about the Parker spiral direction Joseph E. Borovsky 1 Received 29 October
Properties and geoeffectiveness of magnetic clouds in the rising, maximum and early declining phases of solar cycle 23
 Annales Geophysicae (2) 23: 62 641 SRef-ID: 1432-76/ag/2-23-62 European Geosciences Union 2 Annales Geophysicae Properties and geoeffectiveness of magnetic clouds in the rising, maximum and early declining
Solar Energetic Particles in the Inner Heliosphere
 Author: Mariona Adillón Corbera Advisor: Neus Agueda Costafreda Facultat de Física, Universitat de Barcelona, Diagonal 645, 08028 Barcelona, Spain. Abstract: The upcoming missions Solar Orbiter (SolO)
Understanding the Nature of Collision of CMEs in the Heliosphere. Wageesh Mishra Postdoctoral Researcher with Yuming Wang
 Understanding the Nature of Collision of CMEs in the Heliosphere Wageesh Mishra Postdoctoral Researcher with Yuming Wang University of Science and Technology of China (USTC), China Email ID: wageesh@ustc.edu.cn
Multispacecraft observations of a foreshock induced magnetopause disturbance exhibiting distinct plasma flows and an intense density compression
 JOURNAL OF GEOPHYSICAL RESEARCH, VOL. 116,, doi:10.1029/2010ja015668, 2011 Multispacecraft observations of a foreshock induced magnetopause disturbance exhibiting distinct plasma flows and an intense density
Space Weather Effects of Coronal Mass Ejection
 J. Astrophys. Astr. (2006) 27, 219 226 Space Weather Effects of Coronal Mass Ejection K. N. Iyer 1,, R. M. Jadav 1, A. K. Jadeja 1, P. K. Manoharan 2, Som Sharma 3 and Hari Om Vats 3 1 Department of Physics,
Numerical simulation of the 12 May 1997 interplanetary CME event
 JOURNAL OF GEOPHYSICAL RESEARCH, VOL. 109,, doi:10.1029/2003ja010135, 2004 Numerical simulation of the 12 May 1997 interplanetary CME event D. Odstrcil 1 Cooperative Institute for Research in Environmental
The first super geomagnetic storm of solar cycle 24: The St. Patrick day (17 March 2015) event
 event") The first super geomagnetic storm of solar cycle 24: The St. Patrick day (17 March 2015) event Chin Chun Wu 1, Kan Liou 2, Bernard Jackson 3, Hsiu Shan Yu 3, Lynn Hutting 1, R. P. Lepping 4, Simon Plunkett
The first super geomagnetic storm of solar cycle 24: The St. Patrick day (17 March 2015) event Chin Chun Wu 1, Kan Liou 2, Bernard Jackson 3, Hsiu Shan Yu 3, Lynn Hutting 1, R. P. Lepping 4, Simon Plunkett
Interplanetary magnetic structure guiding solar relativistic particles
 Astronomy & Astrophysics manuscript no. mcgle final2 c ESO 2011 November 2, 2011 Interplanetary magnetic structure guiding solar relativistic particles S. Masson 1,2, P. Démoulin 1, S. Dasso 3, and K.-L.
Improved input to the empirical coronal mass ejection (CME) driven shock arrival model from CME cone models
 driven shock arrival model from CME cone models") SPACE WEATHER, VOL. 4,, doi:10.1029/2006sw000227, 2006 Improved input to the empirical coronal mass ejection (CME) driven shock arrival model from CME cone models H. Xie, 1,2 N. Gopalswamy, 2 L. Ofman,
SPACE WEATHER, VOL. 4,, doi:10.1029/2006sw000227, 2006 Improved input to the empirical coronal mass ejection (CME) driven shock arrival model from CME cone models H. Xie, 1,2 N. Gopalswamy, 2 L. Ofman,
arxiv: v1 [astro-ph.sr] 22 May 2014
![arxiv: v1 [astro-ph.sr] 22 May 2014](/thumbs/79/80255144.jpg "arxiv: v1 [astro-ph.sr] 22 May 2014") Solar Physics DOI: 10.1007/ - - - - Solar Wind Electron Strahls Associated with a High-Latitude CME: Ulysses Observations M. Lazar 1,2 J. Pomoell 1 S. Poedts 1 C. Dumitrache 3 N.A. Popescu 3 Received ;
Solar Physics DOI: 10.1007/ - - - - Solar Wind Electron Strahls Associated with a High-Latitude CME: Ulysses Observations M. Lazar 1,2 J. Pomoell 1 S. Poedts 1 C. Dumitrache 3 N.A. Popescu 3 Received ;
Comparing generic models for interplanetary shocks and magnetic clouds axis configurations at 1 AU
 JOURNAL OF GEOPHYSICAL RESEARCH, VOL.???, XXXX, DOI:10.1002/, Comparing generic models for interplanetary shocks and magnetic clouds axis configurations at 1 AU M. Janvier, 1 S. Dasso, 2,3 P. Démoulin,
A summary of WIND magnetic clouds for years : model-fitted parameters, associated errors and classifications
 Annales Geophysicae, 24, 215 245, 2006 SRef-ID: 1432-0576/ag/2006-24-215 European Geosciences Union 2006 Annales Geophysicae A summary of WIND magnetic clouds for years 1995 2003: model-fitted parameters,
arxiv: v1 [physics.space-ph] 19 Jul 2018
![arxiv: v1 [physics.space-ph] 19 Jul 2018](/thumbs/82/86396619.jpg "arxiv: v1 [physics.space-ph] 19 Jul 2018") Manuscript prepared for Ann. Geophys. with version 1.3 of the L A TEX class copernicus.cls. Date: 20 July 2018 arxiv:1807.07368v1 [physics.space-ph] 19 Jul 2018 A global study of hot flow anomalies using
Manuscript prepared for Ann. Geophys. with version 1.3 of the L A TEX class copernicus.cls. Date: 20 July 2018 arxiv:1807.07368v1 [physics.space-ph] 19 Jul 2018 A global study of hot flow anomalies using
Why Study Magnetic Reconnection?
 Why Study Magnetic Reconnection? Fundamental Process Sun: Solar flares, Flare loops, CMEs Interplanetary Space Planetary Magnetosphere: solar wind plasma entry, causes Aurora Ultimate goal of the project
Connecting remote and in situ observations of 22 coronal mass ejections from the Sun to 1 AU
 Connecting remote and in situ observations of 22 coronal mass ejections from the Sun to 1 AU Christian Möstl University of Graz, Austria with K. Amla, J.R. Hall, P.C. Liewer, E. De Jong, M. Temmer, J.A.
Large-scale magnetic field inversions at sector boundaries
 JOURNAL OF GEOPHYSICAL RESEARCH, VOL. 109,, doi:10.1029/2003ja010278, 2004 Large-scale magnetic field inversions at sector boundaries N. U. Crooker Center for Space Physics, Boston University, Boston,
, B z. ) Polarity and Statistical Analysis of Solar Wind Parameters during the Magnetic Storm Period
 Polarity and Statistical Analysis of Solar Wind Parameters during the Magnetic Storm Period") Research Paper J. Astron. Space Sci. 28(2), 2-2 (2) DOI:./JASS.2.28.2.2 Variation of Magnetic Field (B y, B z ) Polarity and Statistical Analysis of Solar Wind Parameters during the Magnetic Storm Period
Research Paper J. Astron. Space Sci. 28(2), 2-2 (2) DOI:./JASS.2.28.2.2 Variation of Magnetic Field (B y, B z ) Polarity and Statistical Analysis of Solar Wind Parameters during the Magnetic Storm Period
ESS 200C. Lectures 6 and 7 The Solar Wind
 ESS 200C Lectures 6 and 7 The Solar Wind The Earth s atmosphere is stationary. The Sun s atmosphere is not stable but is blown out into space as the solar wind filling the solar system and then some. The
A STATISTICAL STUDY ON CORONAL MASS EJECTION AND MAGNETIC CLOUD AND THEIR GEOEFFECTIVENESS
 A STATISTICAL STUDY ON CORONAL MASS EJECTION AND MAGNETIC CLOUD AND THEIR GEOEFFECTIVENESS Rajiv Kumar 1 Government Pench Valley PG college Parasia Distt.CHHINDWARA M.P., INDIA E-mail: captainrajiv@live.com
Correlation length of large-scale solar wind velocity fluctuations measured tangent to the Earth s orbit: First results from Stereo
 JOURNAL OF GEOPHYSICAL RESEARCH, VOL. 113,, doi:10.1029/2007ja012865, 2008 Correlation length of large-scale solar wind velocity fluctuations measured tangent to the Earth s orbit: First results from Stereo
NASA s STEREO Mission
 NASA s STEREO Mission J.B. Gurman STEREO Project Scientist W.T. Thompson STEREO Chief Observer Solar Physics Laboratory, Helophysics Division NASA Goddard Space Flight Center 1 The STEREO Mission Science
The differences between storms driven by helmet streamer CIRs and storms driven by pseudostreamer CIRs
 JOURNAL OF GEOPHYSICAL RESEARCH: SPACE PHYSICS, VOL. 118, 5506 5521, doi:10.1002/jgra.50524, 2013 The differences between storms driven by helmet streamer CIRs and storms driven by pseudostreamer CIRs
Geoeffectiveness (Dst and Kp) of interplanetary coronal mass ejections during and implications for storm forecasting
 of interplanetary coronal mass ejections during and implications for storm forecasting") SPACE WEATHER, VOL. 9,, doi:10.1029/2011sw000670, 2011 Geoeffectiveness (Dst and Kp) of interplanetary coronal mass ejections during 1995 2009 and implications for storm forecasting I. G. Richardson 1,2
SPACE WEATHER, VOL. 9,, doi:10.1029/2011sw000670, 2011 Geoeffectiveness (Dst and Kp) of interplanetary coronal mass ejections during 1995 2009 and implications for storm forecasting I. G. Richardson 1,2
Energy Analysis During the Collision of Two Successive CMEs
 Numerical Modeling of Space Plasma Flows: ASTRONUM-2013 ASP Conference Series, Vol. 488 N.V.Pogorelov, E.Audit,and G.P.Zank,eds. c 2014 Astronomical Society of the Pacific Energy Analysis During the Collision
Statistical properties and geoefficiency of interplanetary coronal mass ejections and their sheaths during intense geomagnetic storms
 JOURNAL OF GEOPHYSICAL RESEARCH, VOL. 115,, doi:10.1029/2009ja015140, 2010 Statistical properties and geoefficiency of interplanetary coronal mass ejections and their sheaths during intense geomagnetic
Strong bulk plasma acceleration in Earth s magnetosheath: A magnetic slingshot effect?
 Click Here for Full Article GEOPHYSICAL RESEARCH LETTERS, VOL. 34, L14102, doi:10.1029/2007gl030024, 2007 Strong bulk plasma acceleration in Earth s magnetosheath: A magnetic slingshot effect? B. Lavraud,
participation in magnetopause reconnection: first results
 Structure of plasmaspheric plumes and their participation in magnetopause reconnection: first results from THEMIS 0 J. P. McFadden, C. W. Carlson, D. Larson, J. Bonnell, F. S. Mozer, V. Angelopoulos,,
Interplanetary coronal mass ejections that are undetected by solar coronagraphs
 Click Here for Full Article JOURNAL OF GEOPHYSICAL RESEARCH, VOL. 113,, doi:10.1029/2007ja012920, 2008 Interplanetary coronal mass ejections that are undetected by solar coronagraphs T. A. Howard 1 and
Magnetic cloud distortion resulting from propagation through a structured solar wind: Models and observations
 Click Here for Full Article JOURNAL OF GEOPHYSICAL RESEARCH, VOL. 111,, doi:10.1029/2006ja011903, 2006 Magnetic cloud distortion resulting from propagation through a structured solar wind: Models and observations
A NEW MODEL FOR REALISTIC 3-D SIMULATIONS OF SOLAR ENERGETIC PARTICLE EVENTS
 A NEW MODEL FOR REALISTIC 3-D SIMULATIONS OF SOLAR ENERGETIC PARTICLE EVENTS Nicolas Wijsen KU Leuven In collaboration with: A. Aran (University of Barcelona) S. Poedts (KU Leuven) J. Pomoell (University
Role of IMF B x in the solar wind magnetosphere ionosphere coupling
 JOURNAL OF GEOPHYSICAL RESEARCH, VOL. 115,, doi:10.1029/2010ja015454, 2010 Role of IMF B x in the solar wind magnetosphere ionosphere coupling Z. Peng, 1 C. Wang, 1 and Y. Q. Hu 2 Received 14 March 2010;
Predicting the Magnetic Field of Earth-impacting CMEs
 2017. The American Astronomical Society. All rights reserved. doi:10.3847/1538-4357/835/2/117 Predicting the Magnetic Field of Earth-impacting CMEs C. Kay 1, N. Gopalswamy 1, A. Reinard 2, and M. Opher
cos 6 λ m sin 2 λ m Mirror Point latitude Equatorial Pitch Angle Figure 5.1: Mirror point latitude as function of equatorial pitch angle.
 Chapter 5 The Inner Magnetosphere 5.1 Trapped Particles The motion of trapped particles in the inner magnetosphere is a combination of gyro motion, bounce motion, and gradient and curvature drifts. In
Single particle motion and trapped particles
 Single particle motion and trapped particles Gyromotion of ions and electrons Drifts in electric fields Inhomogeneous magnetic fields Magnetic and general drift motions Trapped magnetospheric particles